Sample Category Title
USD/JPY Mid-Day Outlook
Daily Pivots: (S1) 149.63; (P) 149.79; (R1) 150.08; More...
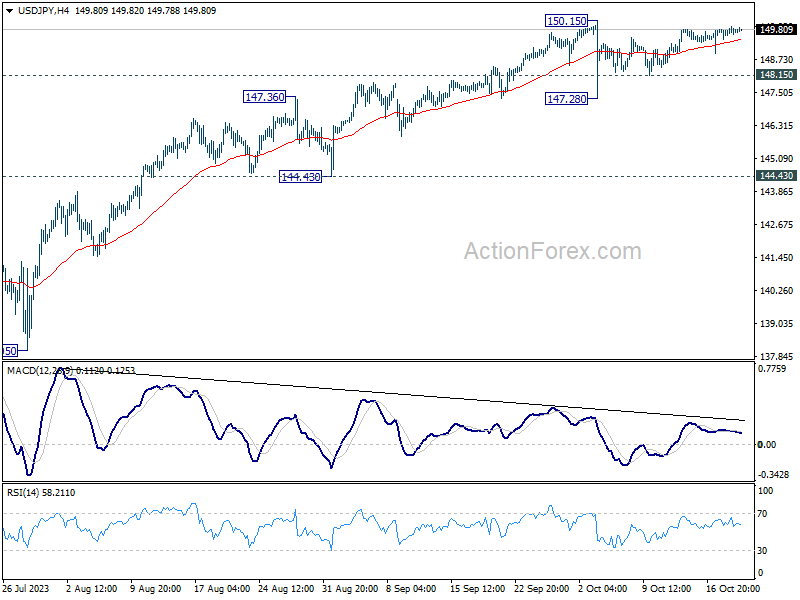
Range trading continues in USD/JPY and intraday bias stays neutral. On the downside, below 148.24 minor support will turn bias to the downside for another down leg through 147.28. On the upside, firm break of 150.15 will resume larger up trend to test 151.93 high.
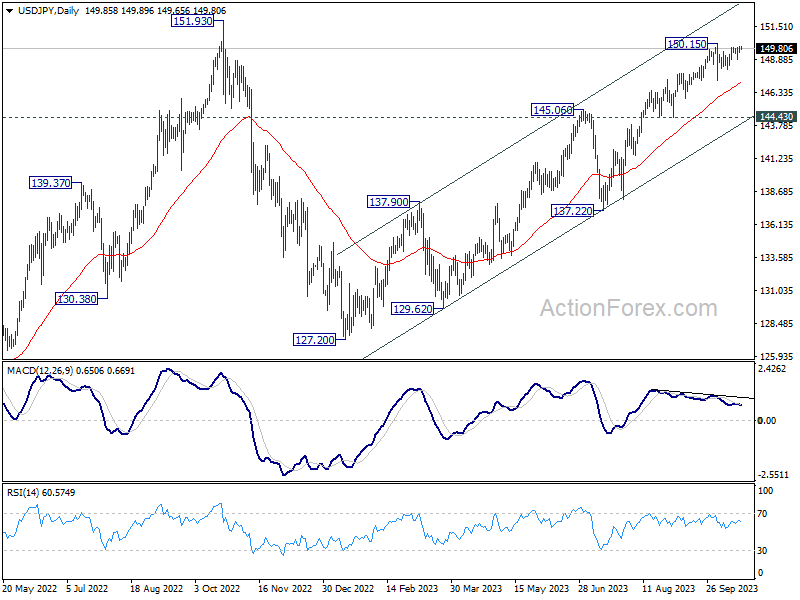
In the bigger picture, while rise from 127.20 is strong, it could still be seen as the second leg of the corrective pattern from 151.93 (2022 high). Rejection by 151.93, followed by sustained break of 145.06 resistance turned support will be the first sign that the third leg of the pattern has started. However, sustained break of 151.93 will confirm resumption of long term up trend.
USD/CHF Mid-Day Outlook
Daily Pivots: (S1) 0.8958; (P) 0.8987; (R1) 0.9021; More....
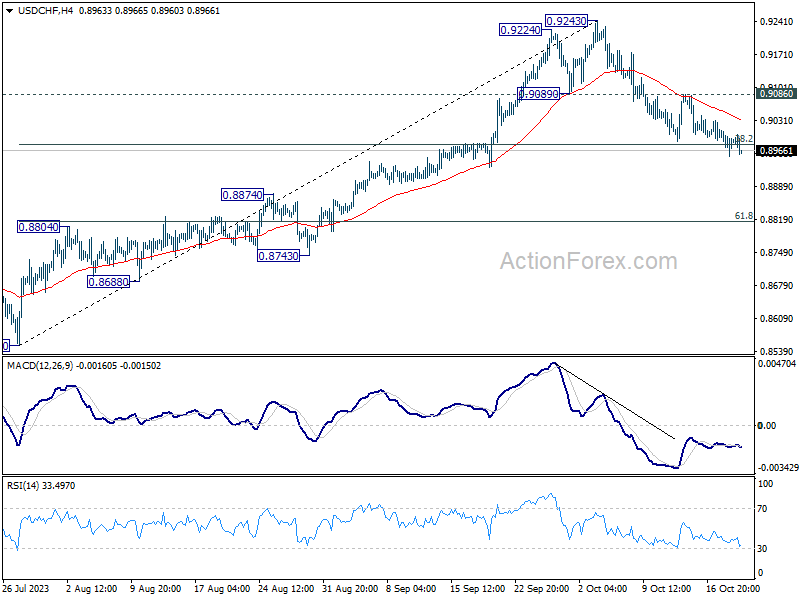
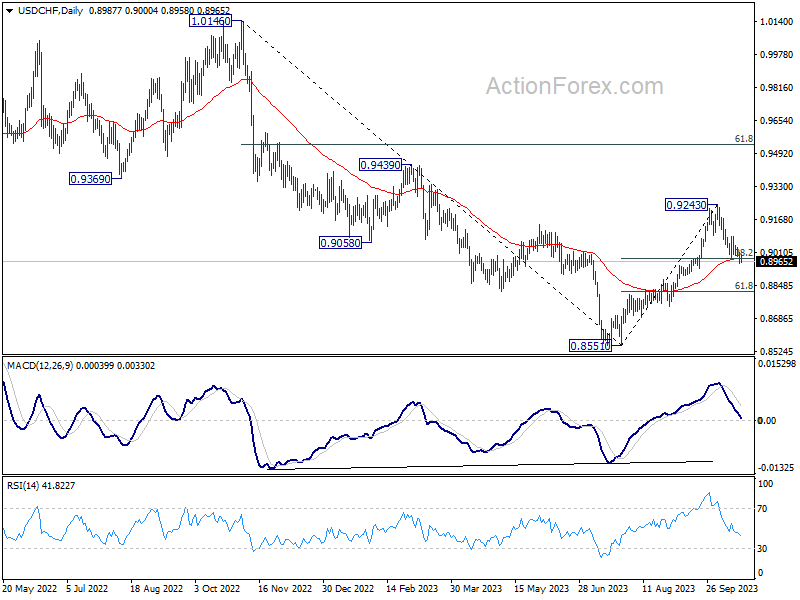
No change in USD/CHF's outlook as focus stays on 38.2% retracement of 0.8551 to 0.9243 at 0.8979. Sustained break there will extend the fall from 0.9243 to 61.8% retracement at 0.8815. That would also carry larger bearish implications. On the upside, however, break of 0.9086 resistance will indicate that pull back from 0.9243 has completed, and turn bias to the upside for retesting this high.
In the bigger picture, as long as 55 D EMA (now at 0.8976) holds rise from 0.8551 is viewed as reversing whole down trend from 1.0146 (2022 high). On resumption, further rise should be seen to 61.8% retracement of 1.0146 to 0.8551 at 0.9537 and above. However, sustained break of 55 D EMA will revive medium term bearishness, for retesting 0.8551 low at a later stage.
GBP/USD Mid-Day Outlook
Daily Pivots: (S1) 1.2115; (P) 1.2163; (R1) 1.2189; More
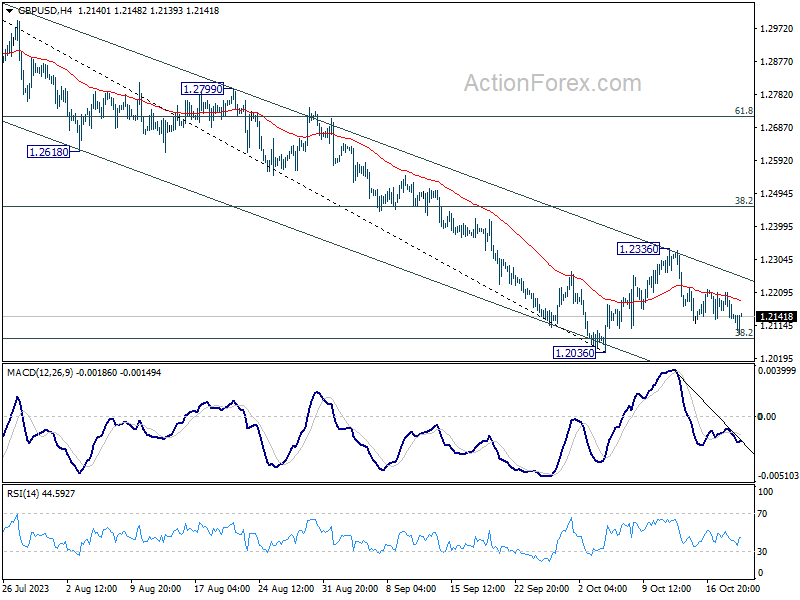
Intraday bias in GBP/USD remains neutral for the moment. Consolidation from 1.2026 is still extending, and outlook stays bearish with 1.2336 resistance intact. On the downside, decisive break of 1.2036 will resume whole decline from 1.3141 for 1.1801 support next. However, break of 1.2336 will resume the rebound from 1.2036 to 55 D EMA (now at 1.2383).
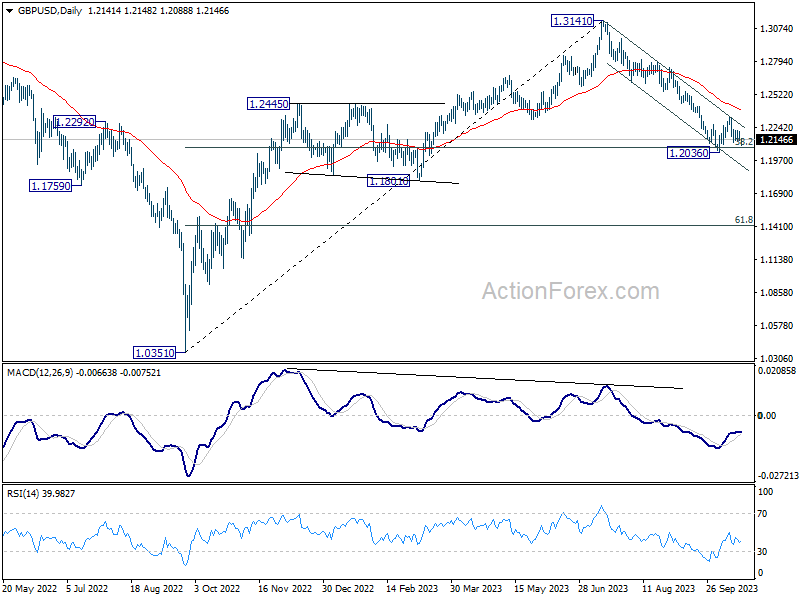
In the bigger picture, fall from 1.3141 medium term top could still be a correction to up trend from 1.0351 (2022 low) only. But risk of complete trend reversal is rising. Sustained break of 38.2% retracement of 1.0351 to 1.3141 at 1.2075 will pave the way to 61.8% retracement at 1.1417. For now, risk will stay on the downside as long as 55 D EMA (now at 1.2383) holds, in case of rebound.
EUR/USD Mid-Day Outlook
Daily Pivots: (S1) 1.0508; (P) 1.0551; (R1) 1.0579; More...
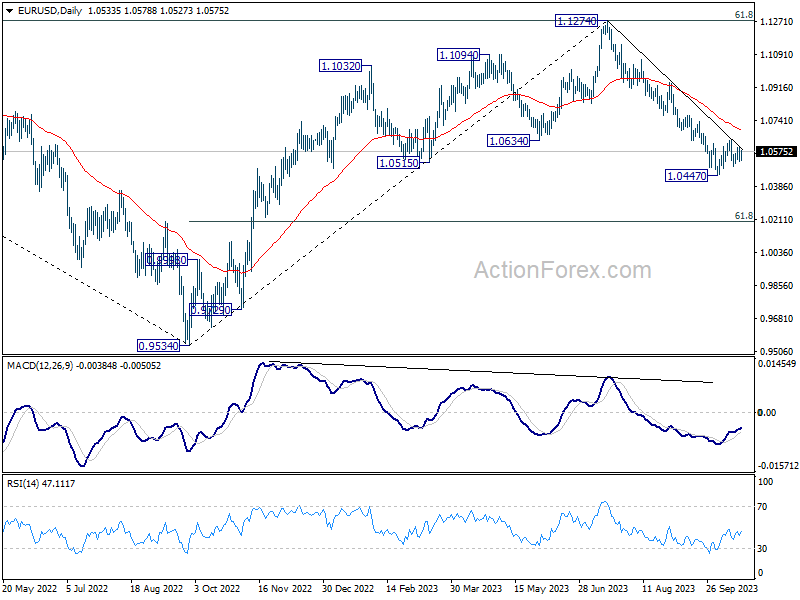
EUR/USD is still extending sideway trading between 1.0447 and 1.0639 and intraday bias stays neutral. Near term outlook stays bearish with 1.0639 resistance intact. On the downside, firm break of 1.0447 will resume whole fall from 1.1274 and target 1.0199 fibonacci level. On the upside, however, break of 1.0639 will resume the rebound from 1.0447 to 55 D EMA (now at 1.0692).
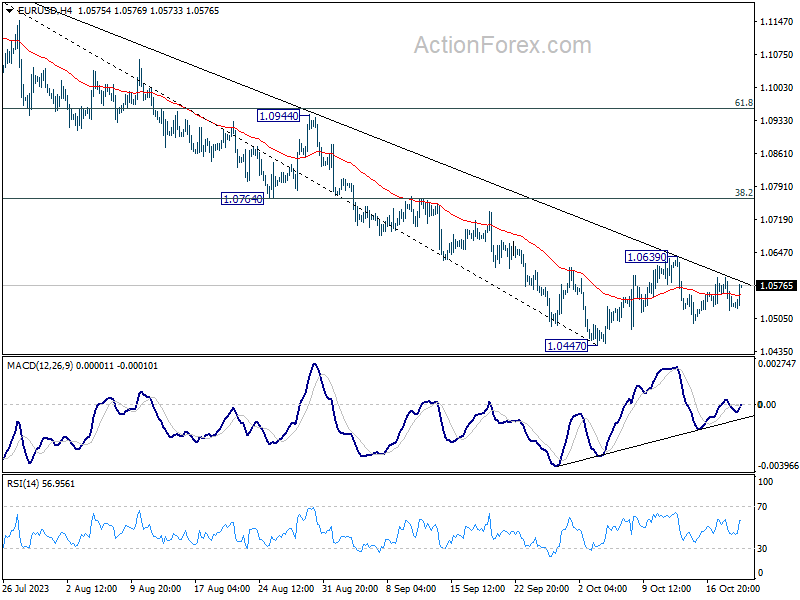
In the bigger picture, fall from 1.1274 medium term top could still be a correction to rise from 0.9534 (2022 low). But chance of a complete trend reversal is rising. In either case, current fall should target 61.8% retracement of 0.9534 to 1.1274 at 1.0199 next. For now, risk will stay on the downside as long as 55 D EMA (now at 1.0692) holds, in case of rebound.
US 10-yr Yield Marches Towards 5%, But Dollar Fails to Match the Tempo
The global markets today are abuzz with the rapid rise of US benchmark treasury yields. Market pundits are keeping a keen eye on 10-year yield, which, given its present momentum, is poised to touch 5% level. All eyes will also be on how traders react at this critical psychological level. Simultaneously, anticipation is building around Fed Chair Jerome Powell's forthcoming speech at the Economic Club of New York. It's widely expected that he will reiterate the stance on maintaining "higher for longer" interest rates in response to inflationary pressures. However, it's crucial to understand that this ascent in yields isn't restricted to the US alone. Germany's 10-year yield has climbed to levels not seen since 2011, while Japan's 10-year JGB yield has touched its highest point since 2013.
In the realm of currency markets, Australian Dollar and New Zealand Dollar are bearing the brunt of market shifts, emerging as the day's weakest performers. While disappointing employment figures are an added burden for Aussie, Kiwi remains under the shadow of yesterday's CPI revelations. British Pound is also under duress, particularly against Euro and Swiss Franc, placing it as the day's third weakest currency. On the other end of the spectrum, Yen, Franc, and Euro are vying for the top positions, with Dollar lagging slightly behind, struggling to keep up the pace with 10-year yield.
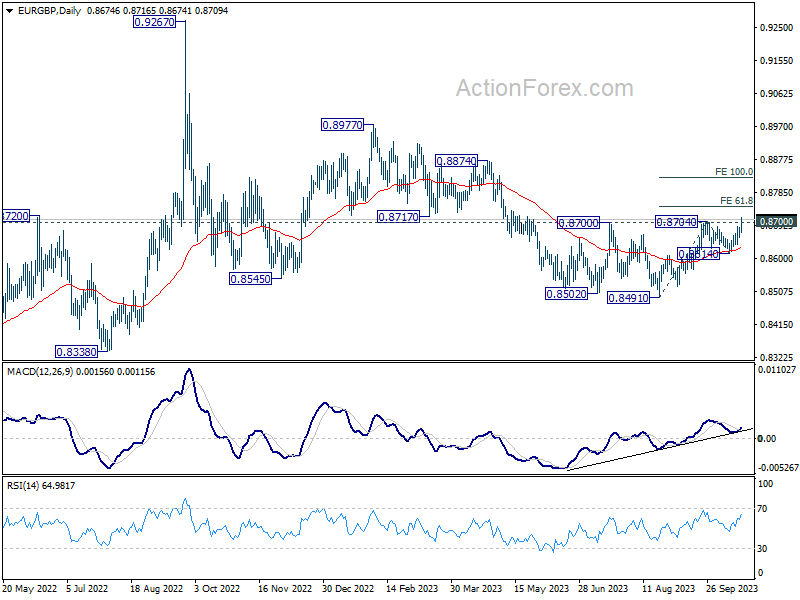
Technically, EUR/GBP's break of 0.8700/4 resistance zone confirms resumption of rise from 0.8491. More importantly, the development suggest strengthens the case that corrective pattern from 0.9267 has completed with three waves down to 0.8941. Next near term target is 61.8% projection of 0.8419 to 0.8704 from 0.8614 at 0.8746. Decisive break there could prompt upside acceleration to 100% projection at 0.8827 next. A major question is whether this rally in EUR/GBP can inject vitality into EUR/USD, propelling it beyond 1.0639 resistance and heralding a stronger rebound.
In Europe, at the time of writing, FTSE is down -1.00%. DAX is down -0.19%. CAC is down -0.60%. Germany 10-year yield is down -0.008 at 2.922. Earlier in Asia, Nikkei fell -1.91%. Hong Kong HSI fell -2.46%. China Shanghai SSE fell -1.74%. Singapore Strait Times fell -1.18%. Japan 10-year JGB yield rose 0.0391 to 0.847.
US initial jobless claims fell to 198k, vs exp 210k
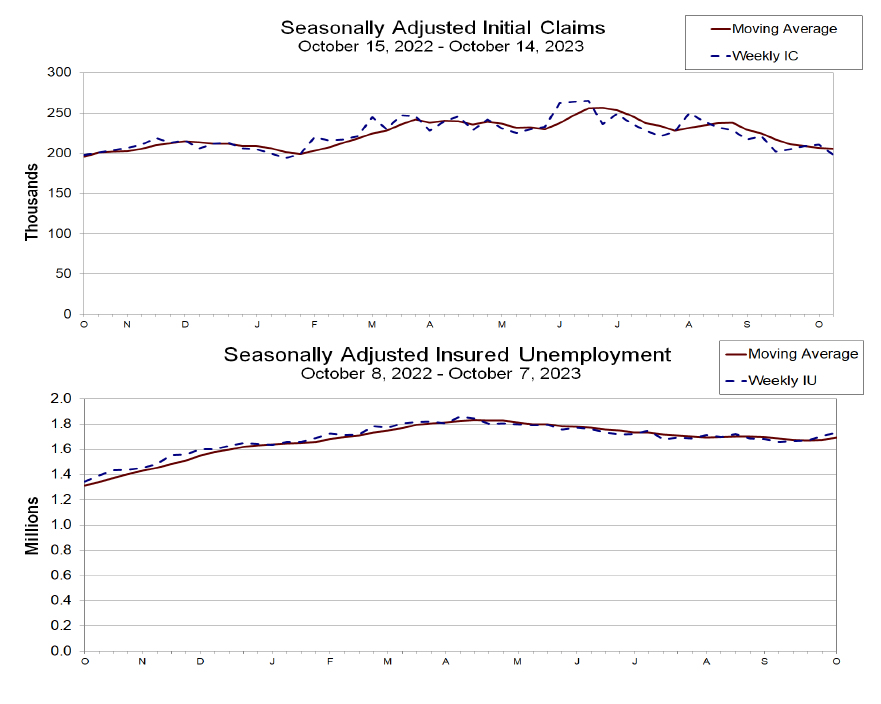
US initial jobless claims fell -13k to 198k in the week ending October 14, below expectation of 210k. Four-week moving average of initial claims dropped -1k to 206k.
Continuing claims rose 29k to 1743k in the week ending October 7. Four-week moving average of continuing claims rose 19k to 1694k.
BoJ's regional economic report unveils broadest upgrade since mid 2022
In the Regional Economic Report released today, BoJ upgraded the economic assessment for six regions, marking the most substantial uplift since July 2022. The regions experiencing this optimistic revision include Hokkaido, Tohoku, Hokuriku, Kanto-Koshinetsu, Chugoku, and Shikoku. Conversely, the economic outlook for Tokai, Kinki, and Kyushu-Okinawa remained steady.
This comprehensive upgrade underscores the resilience and adaptability of the Japanese economy. Despite the headwinds presented by decelerating recovery in overseas economies and rising prices domestically, all nine regions delineated a narrative of an economy that is either picking up momentum or recovering at a moderate pace.
On a related note, a separate report from branch managers indicated that many companies, due to a structural labor shortage, are gearing up to continue wage increments in the upcoming fiscal year. However, the magnitude of these wage hikes will largely depend on competitor trends and upcoming price movements, especially as the spring labor unions of next year approach.
Japan's export rose 4.3% yoy in Sep amid US and European demand
Japan saw a welcomed increase in exports in September, breaking a two-month declining trend and outpacing forecasts. Exports rose by 4.3% yoy to JPY 9198B, surpassing the anticipated growth of 3.1% yoy.
A closer examination of the trade partners reveals a contrasting scenario. Exports to China, Japan's prominent trading partner, dipped by -6.2% yoy, marking the tenth consecutive month of decline. A staggering -58% yoy drop in food shipments contributed significantly to this contraction. Conversely, trade ties with US and Europe exhibited robustness, with exports expanding by 13.0% yoy and 12.9% yoy respectively.
On the import front, Japan reported a decline of -16.3% yoy to JPY 9136B, a steeper fall than the anticipated -12.9% yoy. Trade dynamics shifted, with Japan posting a trade surplus of JPY 62.4B.
When assessed in seasonally adjusted terms, exports went up by 7.2% mom to JPY 8910B, while imports climbed by 5.4% mom, reaching JPY 9345B. Consequently, trade deficit was reduced to JPY -434B.
Australia employment grows a mere 6.7%, unemployment rate ticks down
Australia's job market portrayed a mixed picture in September, with a significant undershoot in employment growth countered by a lower-than-expected unemployment rate.
The country added a mere 6.7k jobs in the month, a far cry from the anticipated 20.3k. Delving deeper into the data, full-time employment took a hit, shrinking by -39.9k. However, this was partly offset by increase in part-time roles, which swelled by 46.5k.
Unemployment rate showed slight improvement, ticking down to 3.6% from previous 3.7%, despite expectations that it would remain steady. Yet, this decline could be attributed to a drop in participation rate, which receded from 67.0% to 66.7%. Meanwhile, total monthly hours worked contracted by -0.4% mom, equivalent to a reduction of 8 million hours.
Kate Lamb, ABS's head of labour statistics, highlighted that, when considering the last two months, the average monthly employment growth stood at 35k, in line with the yearly average growth. However, Lamb also drew attention to the declining unemployment rate in September, indicating it primarily resulted from a shift of people from the unemployed category to being outside the labor force altogether.
Furthermore, she noted, "The recent softening in hours worked, relative to employment growth, may suggest an easing in labour market strength."
Australia's business confidence shows uptick, but inflationary concerns persist
Australian businesses are displaying signs of renewed optimism, as revealed by NAB Quarterly Business Confidence index for Q3. The index improved, moving up from -4 in the second quarter to -1 in the third. Moreover, the gauge for Current Business Conditions also indicated better sentiment, rising from 11 to 13.
However, an undercurrent of concern persisted regarding cost dynamics. Labour cost growth experienced an increase, shifting up to 1.8% from the 1.3% witnessed in Q2. On the other hand, purchase costs growth showed a modest climb, reaching 1.4% from the 1.3% seen in the previous quarter. In a positive sign, fewer businesses highlighted materials as a limiting factor, with the percentage dropping to 32% from the 36% reported in Q2.
NAB's Chief Economist Alan Oster noted, "Price growth remained elevated in Q3. This is in line with our expectation for a reasonably strong inflation print of 1.1% for the quarter when the full Q3 CPI is released next week."
However, he tempered the immediate inflationary concerns with a longer-term view, adding, "Still, we do expect inflation to moderate gradually as the economy slows."
EUR/USD Mid-Day Outlook
Daily Pivots: (S1) 1.0508; (P) 1.0551; (R1) 1.0579; More...
EUR/USD is still extending sideway trading between 1.0447 and 1.0639 and intraday bias stays neutral. Near term outlook stays bearish with 1.0639 resistance intact. On the downside, firm break of 1.0447 will resume whole fall from 1.1274 and target 1.0199 fibonacci level. On the upside, however, break of 1.0639 will resume the rebound from 1.0447 to 55 D EMA (now at 1.0692).
In the bigger picture, fall from 1.1274 medium term top could still be a correction to rise from 0.9534 (2022 low). But chance of a complete trend reversal is rising. In either case, current fall should target 61.8% retracement of 0.9534 to 1.1274 at 1.0199 next. For now, risk will stay on the downside as long as 55 D EMA (now at 1.0692) holds, in case of rebound.
Economic Indicators Update
| GMT | Ccy | Events | Actual | Forecast | Previous | Revised |
|---|---|---|---|---|---|---|
| 23:50 | JPY | Trade Balance (JPY) Sep | -0.43T | -0.50T | -0.56T | -0.55T |
| 00:30 | AUD | NAB Business Confidence Q3 | -1 | -3 | -4 | |
| 00:30 | AUD | Employment Change Sep | 6.7K | 20.3K | 64.9K | 63.3K |
| 00:30 | AUD | Unemployment Rate Sep | 3.60% | 3.70% | 3.70% | |
| 06:00 | CHF | Trade Balance (CHF) Sep | 6.32B | 3.77B | 4.05B | 3.81B |
| 08:00 | EUR | Eurozone Current Account (EUR) Aug | 27.7B | 20.9B | 21.0B | |
| 12:30 | CAD | Industrial Product Price M/M Sep | 0.40% | 0.30% | 1.30% | |
| 12:30 | CAD | Raw Material Price Index Sep | 3.50% | 1.80% | 3.00% | |
| 12:30 | USD | Initial Jobless Claims (Oct 13) | 198K | 210K | 209K | |
| 12:30 | USD | Philadelphia Fed Manufacturing Survey Oct | -9 | -6.5 | -13.5 | |
| 14:00 | USD | Existing Home Sales Sep | 3.90M | 4.04M | ||
| 14:30 | USD | Natural Gas Storage | 82B | 84B |
US initial jobless claims fell to 198k, vs exp 210k
US initial jobless claims fell -13k to 198k in the week ending October 14, below expectation of 210k. Four-week moving average of initial claims dropped -1k to 206k.
Continuing claims rose 29k to 1743k in the week ending October 7. Four-week moving average of continuing claims rose 19k to 1694k.
Aussie Slips on Soft Employment Data
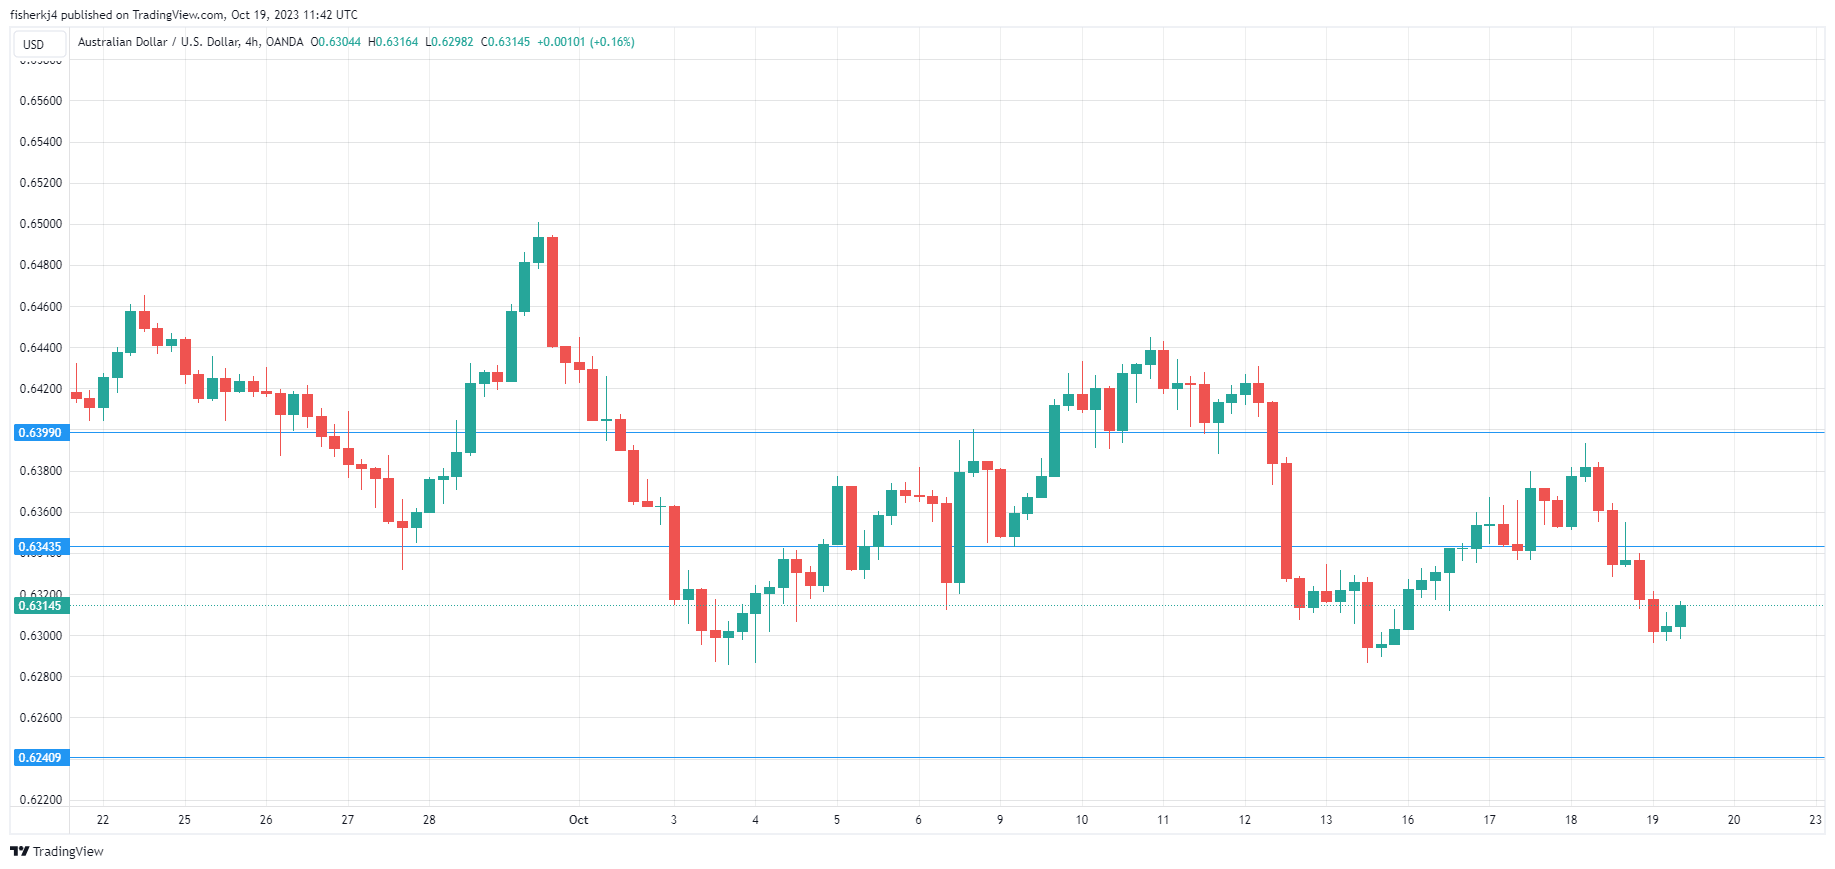
The Australian dollar has extended its losses on Thursday. In the North American session, AUD/USD is trading at 0.6312, down 0.37%.
Australia’s labour market had a disappointing September, with only 6,700 jobs created. This was well below the August reading of a revised 63,300 and missed the consensus estimate of 20,000. The unemployment rate dipped to 3.6%, down from 3.7% in August, but only because the workforce participation rate dropped sharply from 67.0% to 66.7%.
The labour market has been surprisingly robust, despite aggressive tightening by the Reserve Bank of Australia. However, a look at the past six months shows a more complicated picture. Employment growth has almost exclusively limited to time positions, with little growth in full-time employment.
The employment report did not move the market pricing for a rate increase at the November meeting, which remains at just 13%, according to the ASX RBA rate tracker. The final piece in the rate decision puzzle will be next week’s inflation report, which could make or break the case for a hike. Inflation to 5.2% y/y in September, up from 4.9% a month earlier.
The RBA remains hawkish about inflation and Governor Bullock said on Wednesday that it would be difficult to push inflation down, with services inflation, low unemployment and rising house costs contributing to “sticky” inflation which was running above the 2% target. Bullock warned that if long-term inflation expectations become entrenched at high levels, the central bank would have to raise rates.
China’s GDP for the third quarter came in at 4.9%, down from Q2 but stronger than expected. On Friday, the PBOC is expected to maintain the one-year and five-year Loan Prime rates at 3.45% and 4.2%, respectively.
AUD/USD Technical
- AUD/USD has support at 0.6240 and 0.6184
- 0.6343 and 0.6399 are the next resistance lines
Reality Has Started to Sink in for Richly Valued US Long-Duration and Growth Equities
- Rising geopolitical risk premium may override the historical positive seasonality in the S&P 500 for the months of October and November.
- The US 10-year Treasury yield is now just a stone-throw away from 5.20% and a break above it may spiral towards 6.87% next.
- S&P 500’s market breadth has continued to deteriorate as only 38% of its component stocks are above their respective key 200-day moving averages.
- A bearish breakdown below 4,140 key support on the S&P 500 may trigger a major downtrend phase.
The rally in risk assets such as global equities has started to show signs of wobbliness as the sentiment pendulum swung from over-pessimism in terms of earnings growth at the tail end of 2022 to over-optimism from June this year triggered by the safe haven status of the US mega-cap technology stocks in terms of their respective strong balance sheets reinforced by the artificial intelligence’s (AI) heightened productivity revolution that saw investors and traders bid up aggressively AI-related equities despite their market prices being “richly valued” above their historical mean valuations.
In our previous analysis, we highlighted an impending tactical risk-off scenario in our article, “No summer lull for global equities” published on 7 July 2023 using intermarket analysis such as the record low level of implied correlation among S&P 500 component stocks, the key bullish breakout of the US 10-year Treasury yield above the 3.90% level, and the significant positive gap between the MOVE Index (aggregate US Treasuries’ yield implied volatility) and the CBOE VIX Index (S&P 500 implied volatility).
So far, the S&P 500 has staged the expected decline from its medium-term swing high on 27 July to record a decline of -8.50% to print its recent 3 October low of 4,216, similar losses of -8.20% were seen on the Nasdaq 100 and the small-cap Russell 2000 fared the worst that tumbled by -13.70% over the same period.
October and November tend to be positive months for the S&P 500
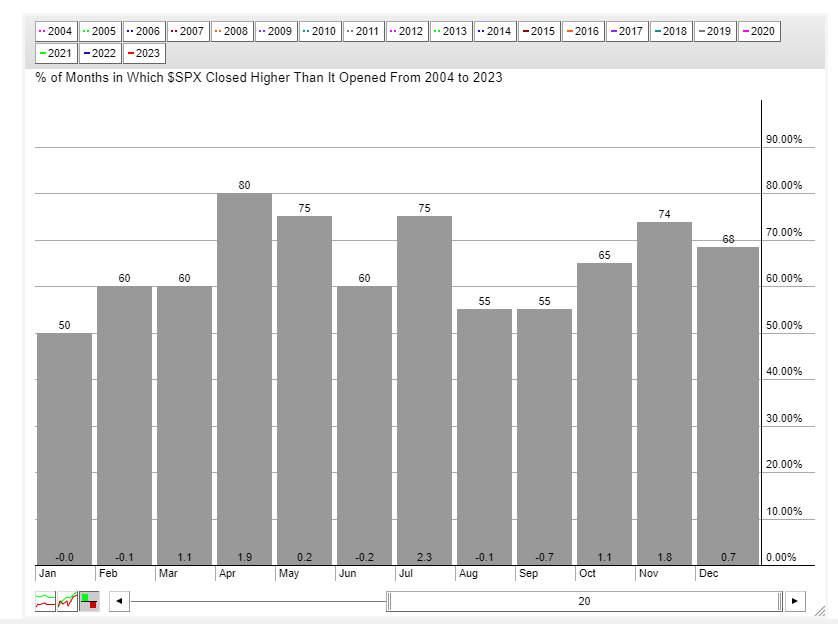
Fig 1: S&P 500 monthly seasonality performances in the past 20 years as of 18 Oct 2023 (Source: stockcharts.com, click to enlarge chart)
Based on seasonality over the past twenty years, the monthly performances of October and November are generally positive for the main US benchmark stock index, the S&P 500 where these two months recorded an average monthly positive return of 1.1% and 1.8% with a probability of 65% and 74% respectively.
However, given the current uptick in geopolitical risk premium trigged by the current Israel-Hamas conflict that may trigger a further rise in oil prices due to an increasing risk that oil may be used as a “strategic choice of weapon” by respective stakeholders in the Middle East region in any potential “peace negotiation” process.
In the past three years since the pandemic crisis of 2020, WTI crude oil, the US 5 and 10-year breakeven inflation rates (market transacted implied inflationary expectations), and the US 10-year Treasury yield have moved in direct unison.
Watch WTI crude oil that may trigger a further uptick in the US 10-year Treasury yield
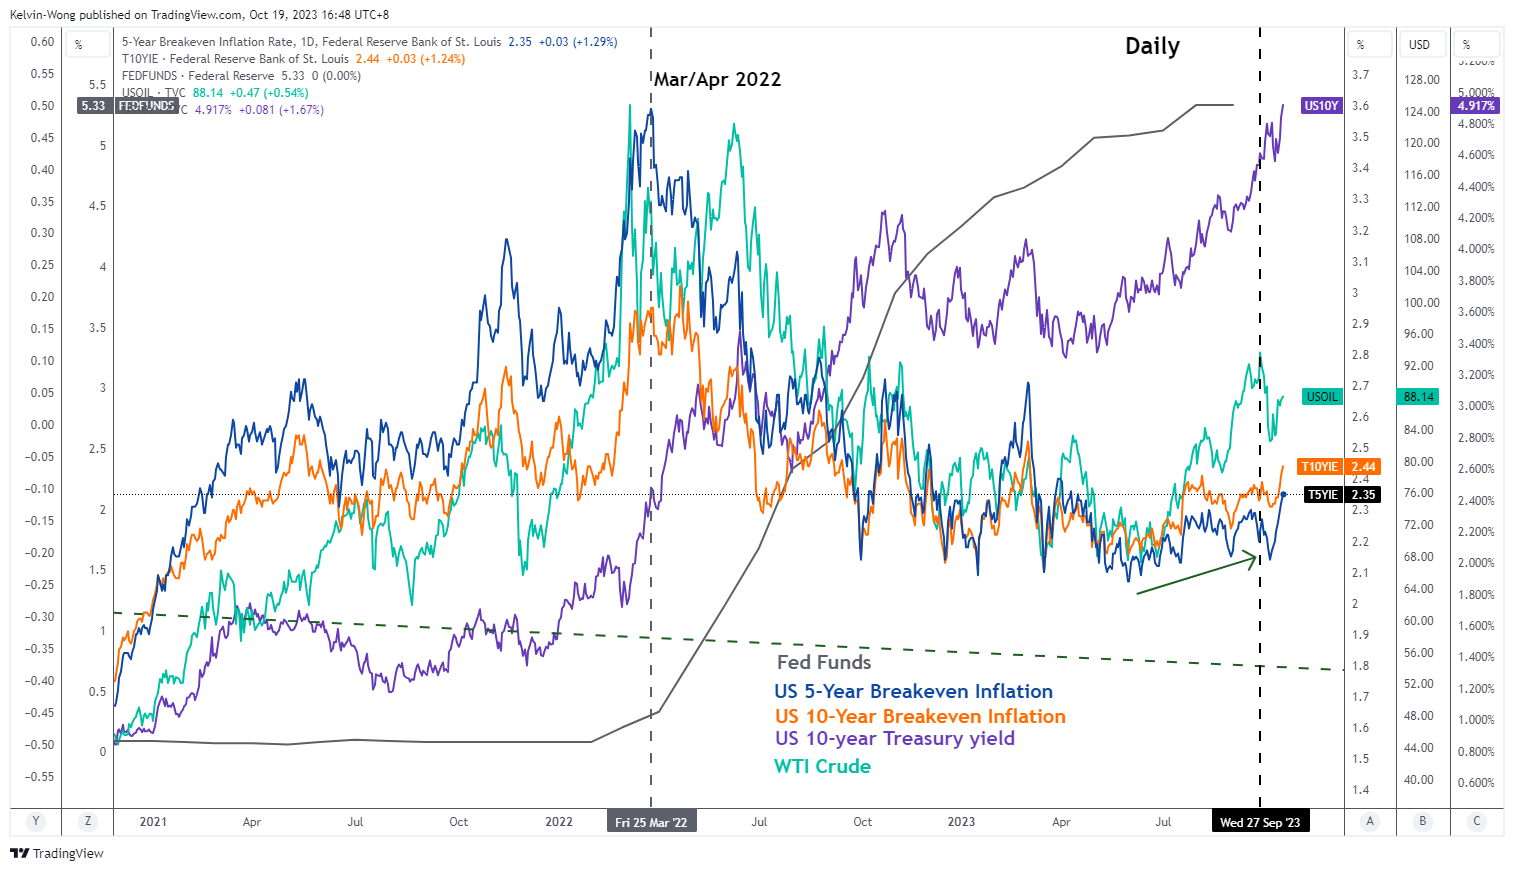
Fig 2: Correlation between WTI crude oil, US 5-year & 10-year breakeven inflation rates, and US 10-year Treasury yield as of 18 Oct 2023 (Source: TradingView, click to enlarge chart)
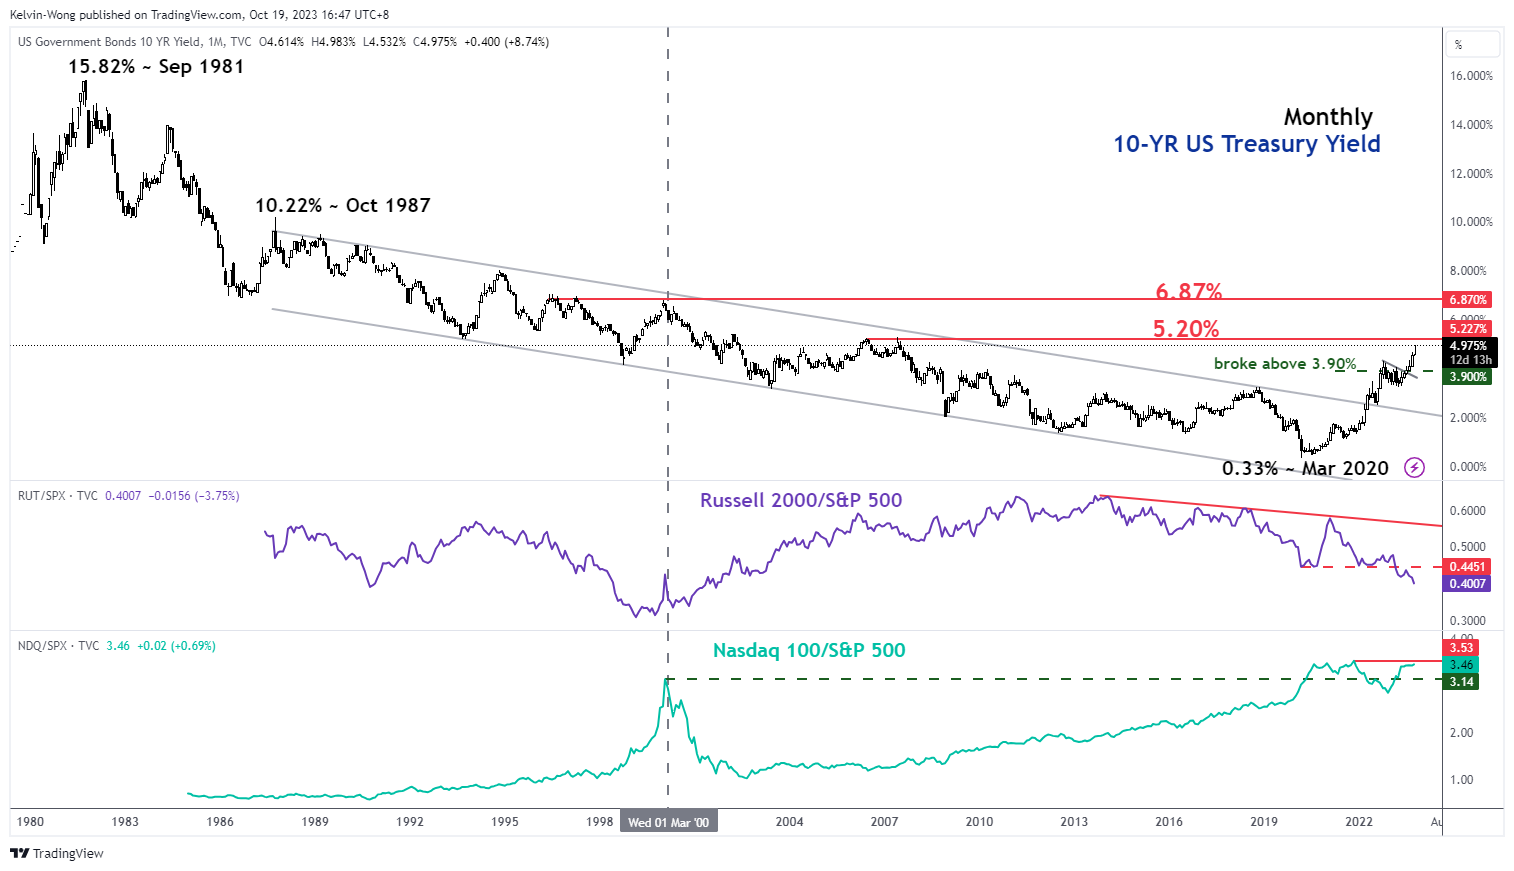
Hence, another round of significant impulsive up move sequences in WTI crude oil is likely to trigger a further uptick in the US inflationary expectations above the 2% threshold (the US central bank, Fed’s inflation target) that is likely to reinforce the Fed’s current stance of keeping interest rates at a higher level for a longer period.
Hence, all these chain effects may see further upside movements in the US 10-year Treasury yield where a clearance above 5.20% increases the odds of seeing the next resistance coming in at 6.87% as its long-term secular downtrend from September 1981 to March 2020 is likely to have ended.
Therefore, a higher US 10-year Treasury yield is likely to lead to a higher cost of funding environment. The current 2023 year-to-date high-water mark rally of +20% seen in the S&P 500 has been attributed significantly to the magnificent seven mega-caps (Apple, Amazon, Alphabet, Meta, Microsoft, Tesla & Nvidia) are primarily dependent on longer-term revenues or cash inflows that are likely to be received further far out in the future which in turn tend to have lower present values if discounted by a higher interest rate factor, hence higher opportunity costs for holding such long duration and growth-related mega-cap stocks.
Breadth is getting weaker in the S&P 500
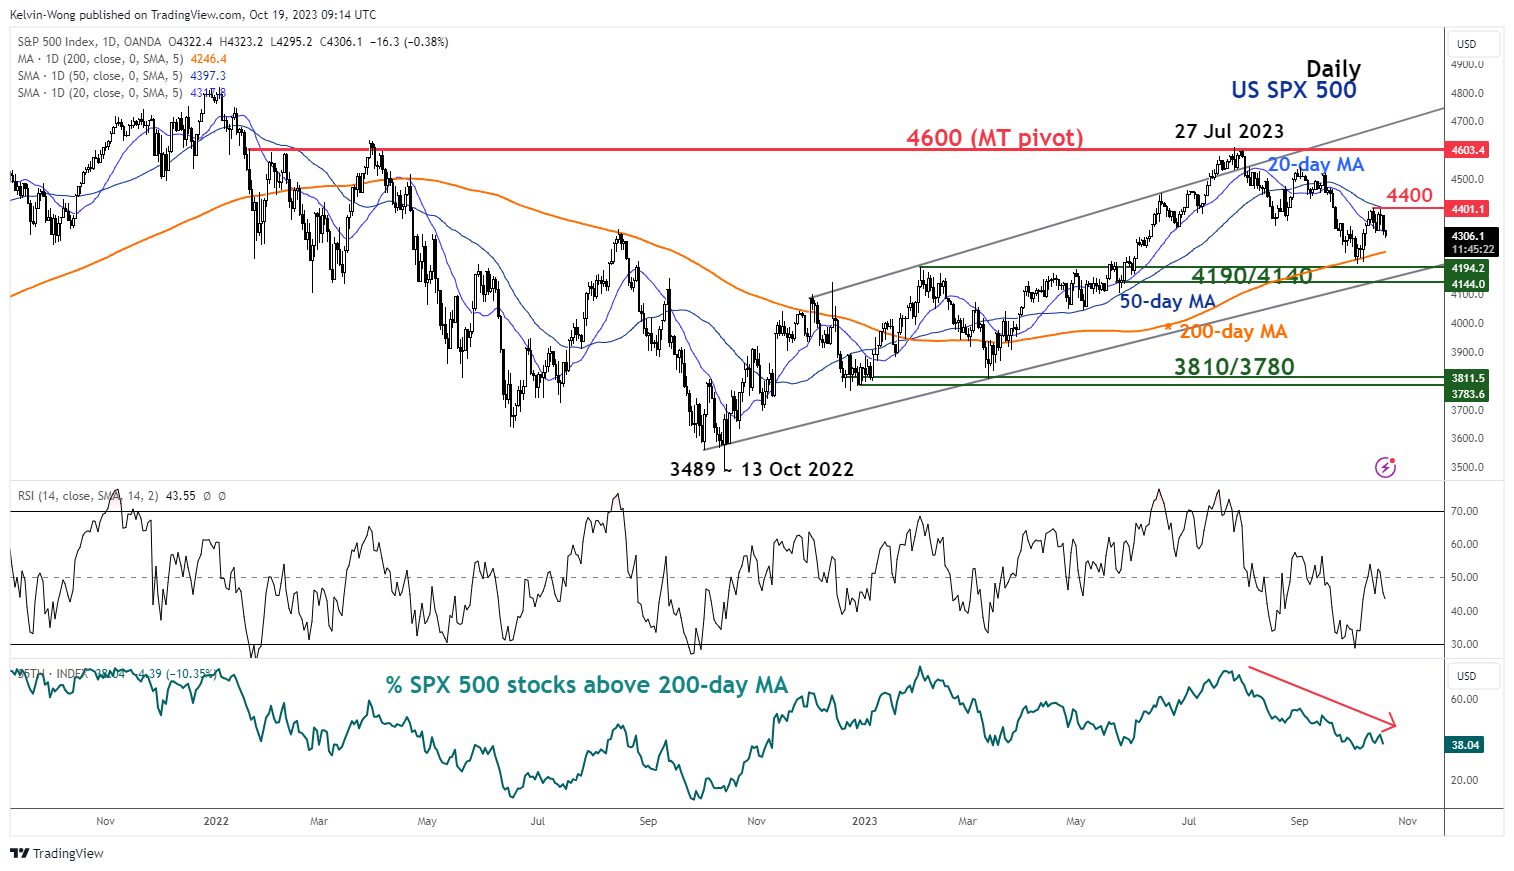
Fig 4: US SPX 500 medium-term trend with market breadth as of 19 Oct 2023 (Source: TradingView, click to enlarge chart)
The current three-month decline in place since the end of July 2023 seen in the S&P 500 has managed to hold above the key 200-day moving average so far but its market breadth is deteriorating.
The number of constituent stocks in the S&P 500 that are above their respective 200-day moving averages is getting lesser by the day, and right now only 38% of the S&P 500 component stocks are still above their 200-day moving averages based on data as of yesterday, 18 October.
This deterioration in market breadth coupled with medium-term and major uptrend phases that are in play for the US 10-year Treasury yield increases the odds of a major bearish breakdown of the S&P 500 below 4,190/4,140 support (ascending trendline from 13 October 2023 low and close to the 200-day moving average).
If such a scenario materializes, the up move of the S&P 500 from the 13 October 2022 low to the recent 27 July 2023 high is likely to be a corrective rally where it kickstarts another potential leg of a multi-month major downtrend phase.
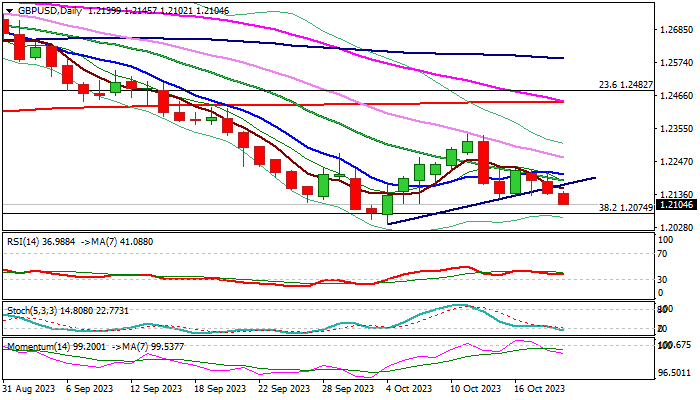
GBP/USD: Break of Pivotal Supports Risks Further Weakness
Fresh leg lower extends into third straight day, with increasing downside risk seen after break of pivotal supports at 1.2170/22 (trendline support / Oct 13 former higher low).
Close below 1.2122 to confirm signal and expose targets and key near-term supports at 1.2037/00 Oct 4 new multi-month low / psychological).
Daily chart studies are bearish, as south-heading 14-d momentum is going deeper into negative territory and moving averages remain in bearish setup, adding to weakening near-term structure, though bears may face headwinds from oversold conditions.
Upticks should be capped under broken bull trendline to keep bears in play and offer better selling opportunities.
Res: 1.2145; 1.2169; 1.2203; 1.2260.
Sup: 1.2074; 1.2037; 1.2000; 1.1915.
WTI Oil Futures Await Green Light from 88.50
- WTI oil retains upward move
- Bulls may retry push higher, but resistance still nearby
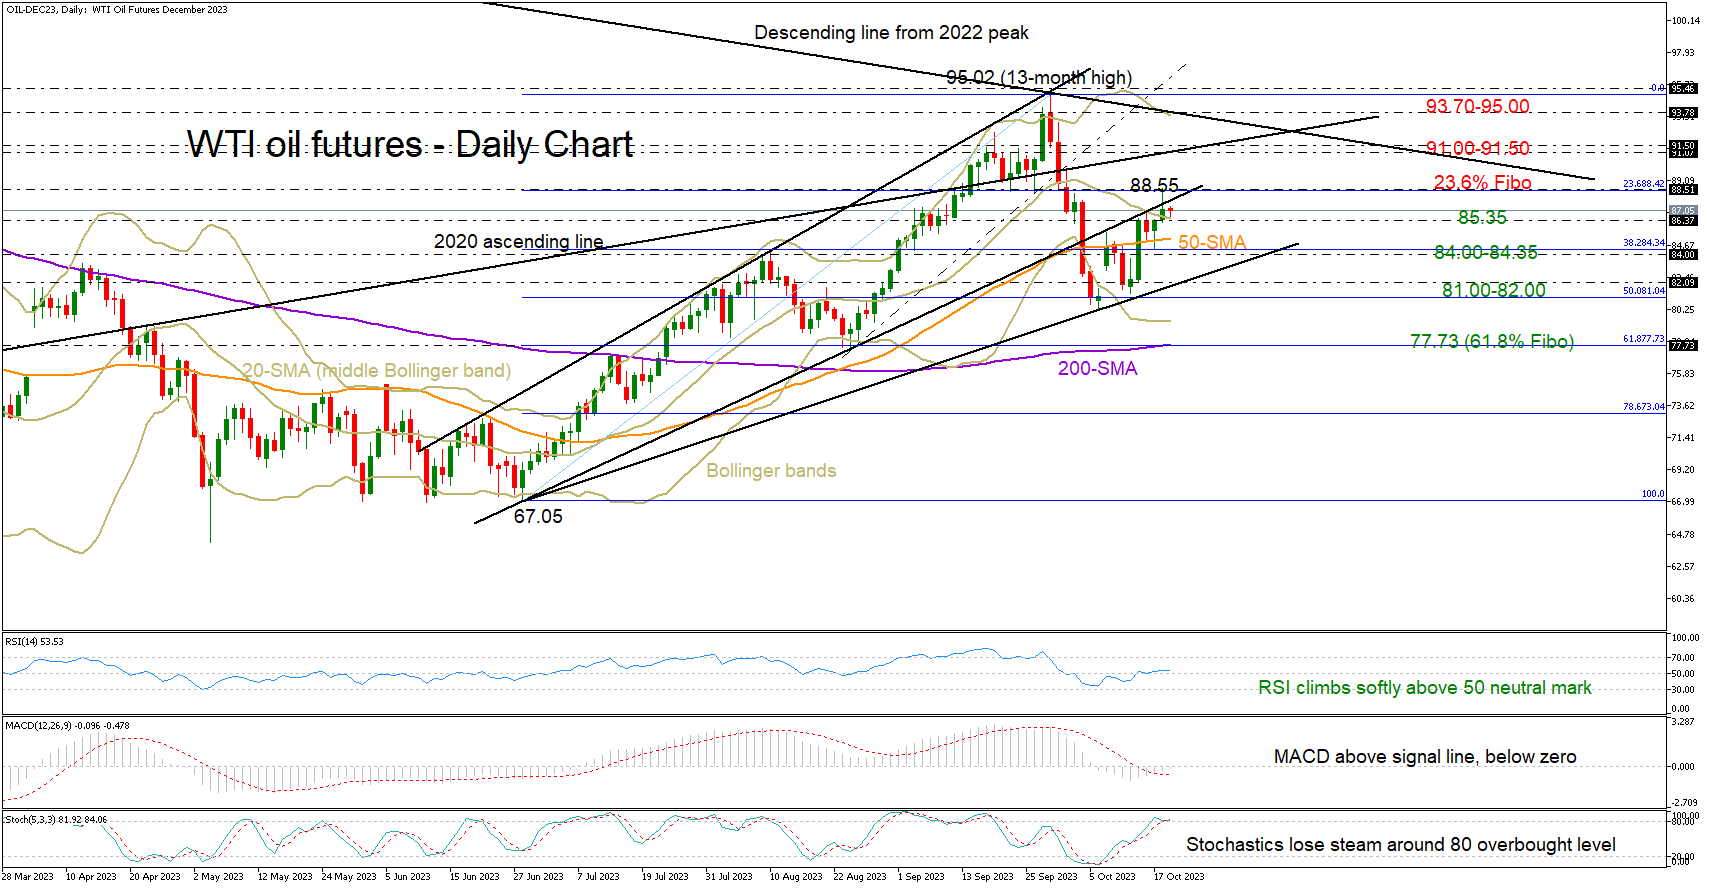
WTI oil futures could not sustain strength above June’s broken support trendline at 87.50 on Wednesday despite a flash spike to 88.55. The 23.6% Fibonacci retracement of the previous uptrend also proved a heavy obstacle at 88.50.
Fortunately, the price closed marginally above its 20-day moving average (SMA) and held within the upper bullish Bollinger area, suggesting sentiment still favors the upside. The RSI has risen above its 50 neutral mark, albeit marginally, witnessing some improvement in buying appetite too.
Yet, with the stochastic oscillator hovering around its 80 overbought level and the MACD remaining within the negative zone, buyers will probably await a confirmation signal above the 88.50 barrier before boosting the price towards the 91.00-91.50 constraining zone, where the ascending line drawn from the 2020 bottom is positioned. A more aggressive bullish action could lose momentum somewhere between the tentative resistance trendline from the 2022 top at 93.70 and September’s peak of 95.00.
Otherwise, a pullback below the 20-day SMA could initially stabilize near the 50-day SMA and the 38.2% Fibonacci of 84.35. Falling lower, the bears could examine the limits within the 81.00-82.00 zone, which includes the 50% Fibonacci and the tentative ascending line from June’s low. Another defeat there could activate fresh selling towards the 200-day SMA and the 61.8% Fibonacci of 77.73.
In brief, WTI oil futures are probably looking for more wins in the short-term, but the price could trade cautiously until it successfully claims the 88.50 level.