Sample Category Title
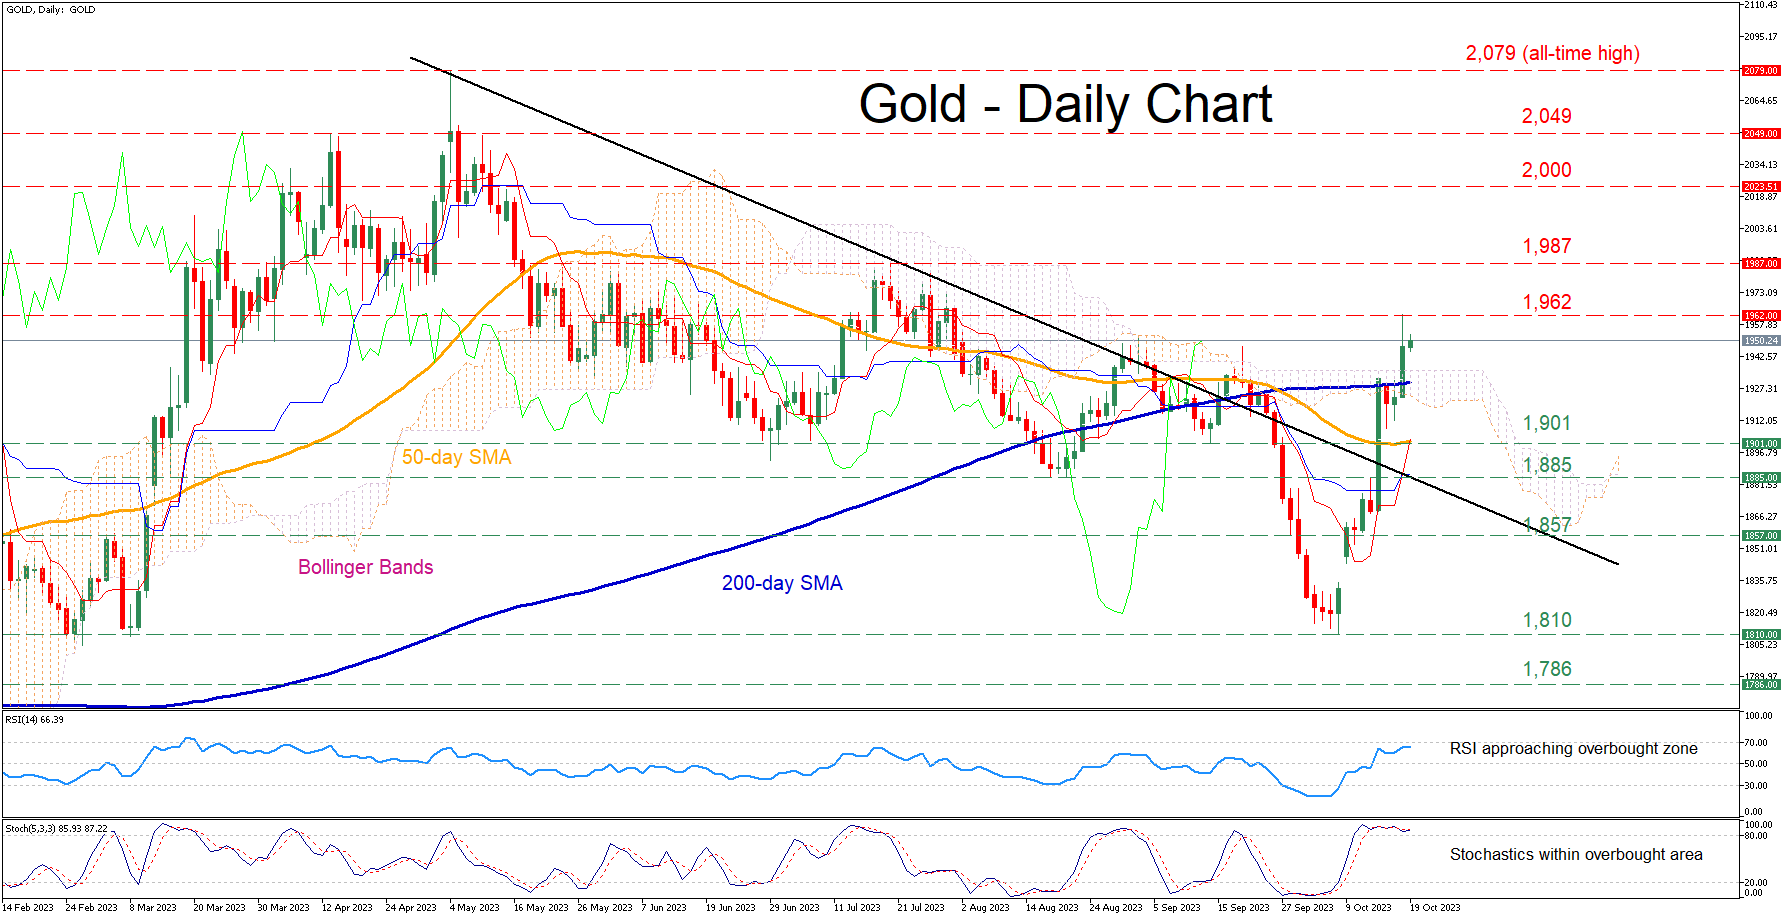
Gold Advances above 200-day SMA
- Gold violates crucial trendline as geopolitical tensions increase
- Erases its October decline, marching to a fresh 2-month high
- Momentum indicators reach overbought levels
Gold has been in a steep uptrend after bouncing off its October low, jumping back above crucial technical regions such as the 200-day simple moving average (SMA) and the Ichimoku cloud. Although the short-term oscillators are hinting that the advance is overstretched, fresh geopolitical concerns may add more fuel to the latest rally.
Should buying interest persist, the recent two-month peak of 1,962 could curb bullion's upside. Conquering this barricade, the bulls might aim at the July high of 1,987. A break above that region could bring the 2,000 psychological mark under examination.
On the flipside, bearish actions could send the price to revisit the September support of 1,901, which overlaps with the 50-day SMA. Failing to halt there, gold may descend towards the August low of 1,885. Should that barricade also fail, the spotlight could turn to the September 2022 resistance of 1,857 that could serve as support in the future.
All in all, gold seems to be under relentless upside pressure, which has pushed the price near overbought levels. Can the bears strike back?
AUD/USD: Australian Dollar Falls Further after Weak Labor Data
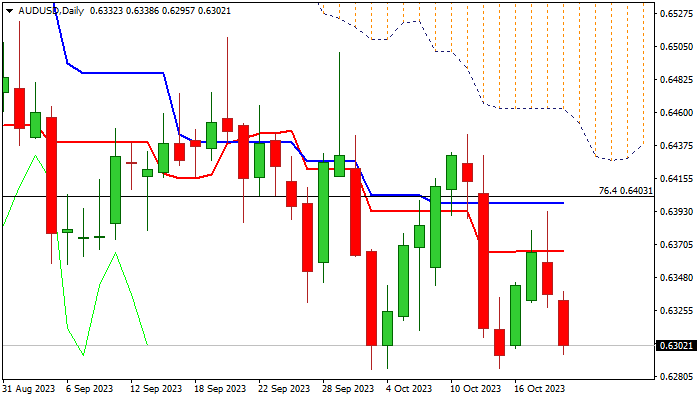
AUD/USD remains in red for the second consecutive day, with overall negative Australian September labor data, adding to downside pressure on renewed risk aversion.
Employment rose less than expected and was well below previous month’s growth (Sep 6.7K vs 20K f/c and Aug 63.3K), contributing to negative impact, as unemployment ticked lower from 3.7% in Aug to 3.6% in Sep.
Limited recovery kept daily technical studies in full bearish mode, with fresh weakness increasing pressure on 2023 lows (0.6285/86 of Oct 3 / 13), break of which to signal continuation of larger downtrend and expose 2022 low (0.6170).
Near-term bias is expected to remain with bears while the action holds below daily Tenkan-sen (0.6365), while lift above daily Kijun-sen (0.6398) would sideline downside threats.
Res: 0.6338; 0.6365; 0.6398; 0.6452.
Sup: 0.6285; 0.6272; 0.6200; 0.6170.
BoJ’s regional economic report unveils broadest upgrade since mid 2022
In the Regional Economic Report released today, BoJ upgraded the economic assessment for six regions, marking the most substantial uplift since July 2022. The regions experiencing this optimistic revision include Hokkaido, Tohoku, Hokuriku, Kanto-Koshinetsu, Chugoku, and Shikoku. Conversely, the economic outlook for Tokai, Kinki, and Kyushu-Okinawa remained steady.
This comprehensive upgrade underscores the resilience and adaptability of the Japanese economy. Despite the headwinds presented by decelerating recovery in overseas economies and rising prices domestically, all nine regions delineated a narrative of an economy that is either picking up momentum or recovering at a moderate pace.
On a related note, a separate report from branch managers indicated that many companies, due to a structural labor shortage, are gearing up to continue wage increments in the upcoming fiscal year. However, the magnitude of these wage hikes will largely depend on competitor trends and upcoming price movements, especially as the spring labor unions of next year approach.
Dow Futures (YM) Pullback May Find Support
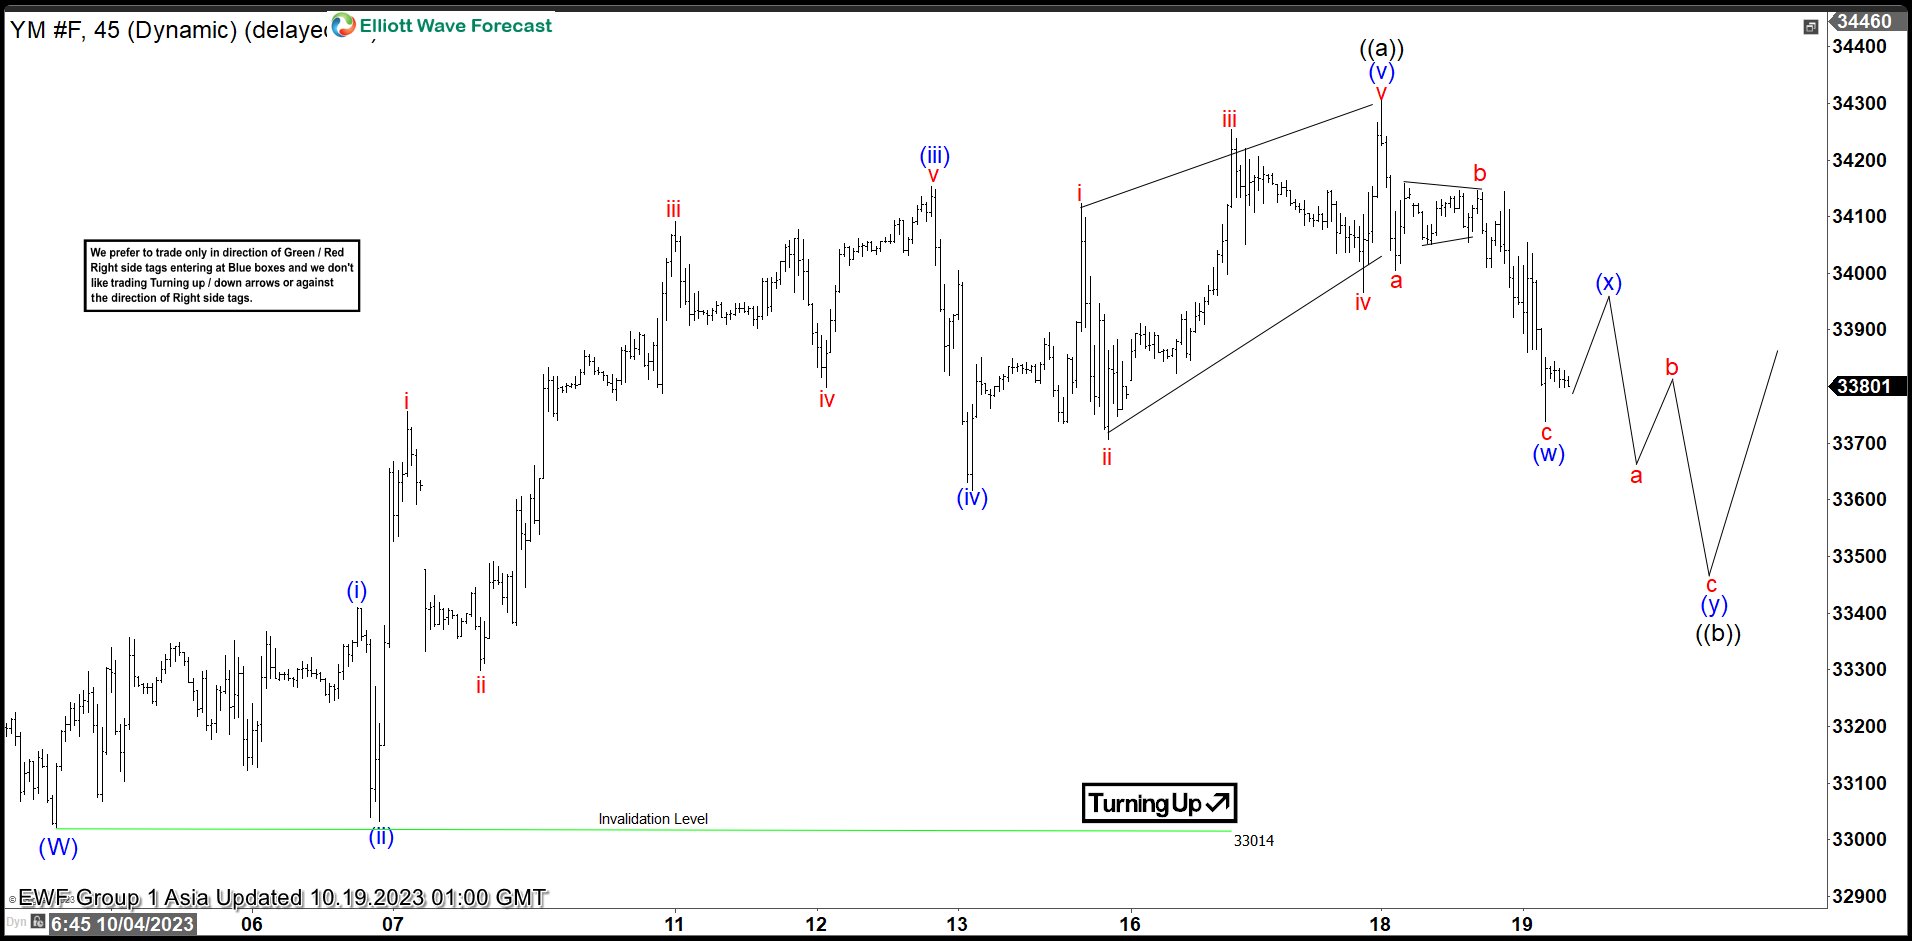
Short Term Elliott Wave in Dow Futures (YM) suggests the decline from 7.27.2023 high has ended with wave (W) at 33014. The Index is now correcting that cycle in wave (X) with internal subdivision as a double three Elliott Wave structure. Up from wave (W), wave (i) ended at 33410 and pullback in wave (ii) ended at 33032. Index then resumed higher again in wave (iii). Up from wave (ii), wave i ended at 33756 and wave ii dips ended at 33298. Index resumes higher again in wave iii towards 34092 and pullback in wave iv ended at 33799. Final leg higher wave v ended at 34153 which completed wave (iii). Pullback in wave (iv) ended at 33617.
Index resumed higher in wave (v) as a diagonal. Up from wave (iv), wave i ended at 34123 and wave ii ended at 33707. Wave iii higher ended at 34254 and pullback in wave iv ended at 33966. Final leg wave v ended at 34305 which completed wave (v) of ((a)). Index is now doing a wave ((b)) pullback to correct the cycle from 10.4.2023 low in 3, 7, or 11 swing. Down from wave ((a)), wave (w) ended at 33738. Expect rally in wave (x) to fail in 3, 7, or 11 swing for another leg lower in wave (y) to complete wave ((b)). Near term, as far as pivot at 33014 low stays intact, expect pullback to find support in 3, 7, or 11 swing for further upside.
Dow Futures ($YM_F) 45 Minutes Elliott Wave Chart
$YM_F Elliott Wave Video
https://www.youtube.com/watch?v=_wACJBJB-zI
GBP/JPY Technical – Impending Bearish Reversal
- The GBP is the second weakest currency among the major US dollar pairs in the past five days.
- A potential bearish reversal set-up has emerged for GBP/JPY while the JPY bears seem to be cautious about Japan’s MoF intervention at around the 150.30 risk level on USD/JPY.
- Watch the key short-term resistance at 182.95 on the GBP/JPY.
The UK pound sterling (GBP) is the second weakest currency among the major US dollar pairs based on a five-day rolling performance calculation at this time of the writing. The USD/GBP has recorded a gain of +0.43% ex-post UK inflation data (September) that was released yesterday, 18 October.
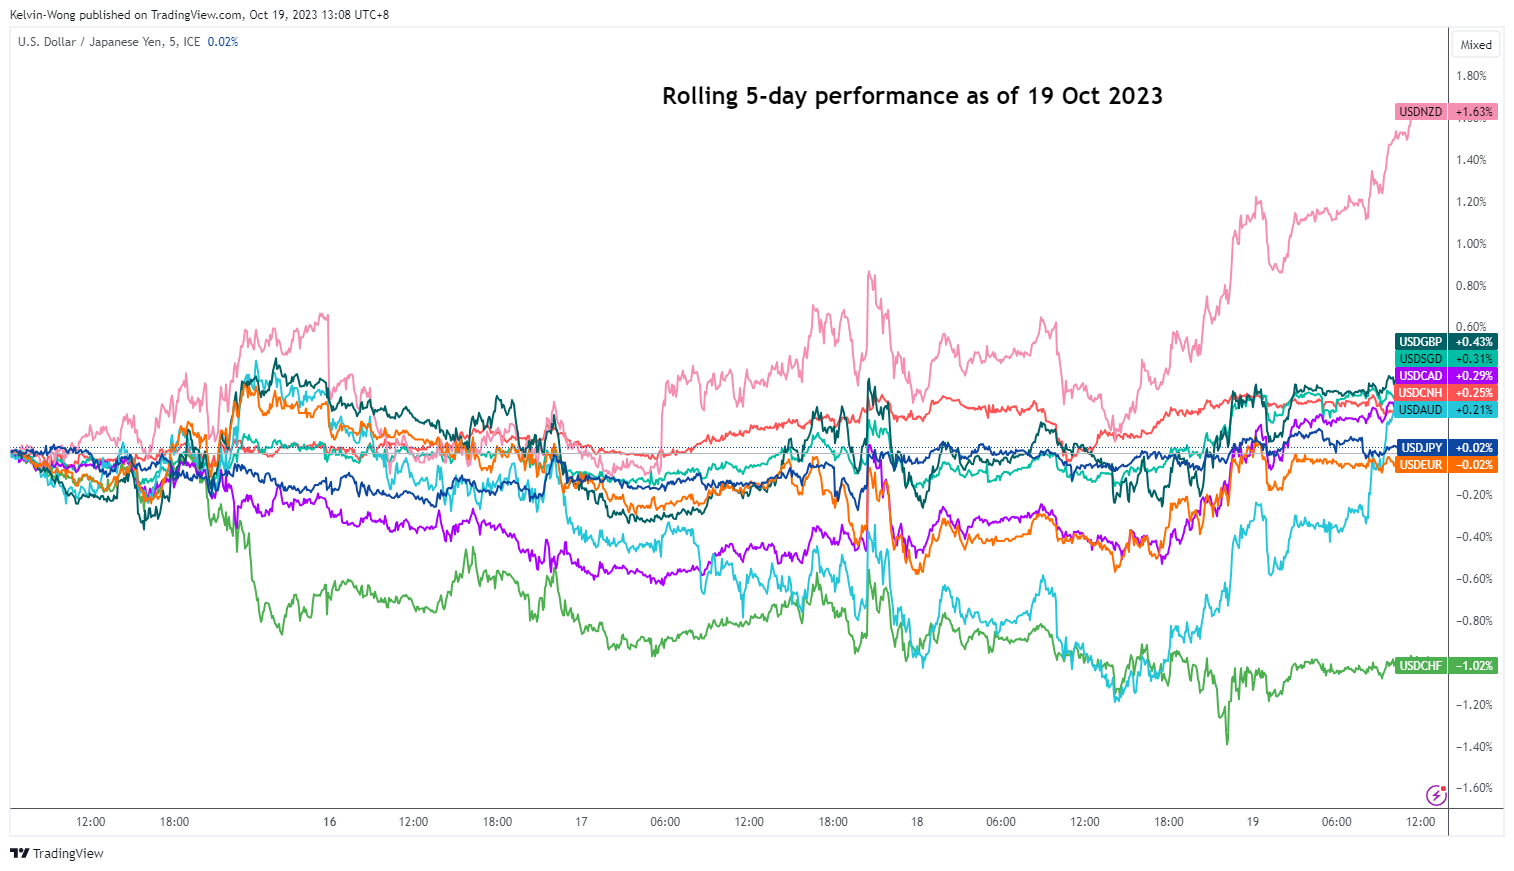
Fig 1: USD major pairs rolling 5-day performance as of 19 Oct 2023 (Source: TradingView, click to enlarge chart)
Both the headline and core inflation rates in the UK have come in slightly above expectations; (6.7% y/y vs. 6.6% y/y consensus) and (6.1% y/y vs. 6% y/y consensus) respectively.
Interestingly, the USD/JPY has continued to trade in a sideways range as the JPY bears may be getting cautious and likely on the lookout for potential intervention by Japan’s Ministry of Finance at around the 150.30 risk level on USD/JPY.
Through the lens of technical analysis, an interesting potential bearish reversal set-up has emerged for the GBP/JPY cross-pair.
Major bullish upside momentum has started to dissipate
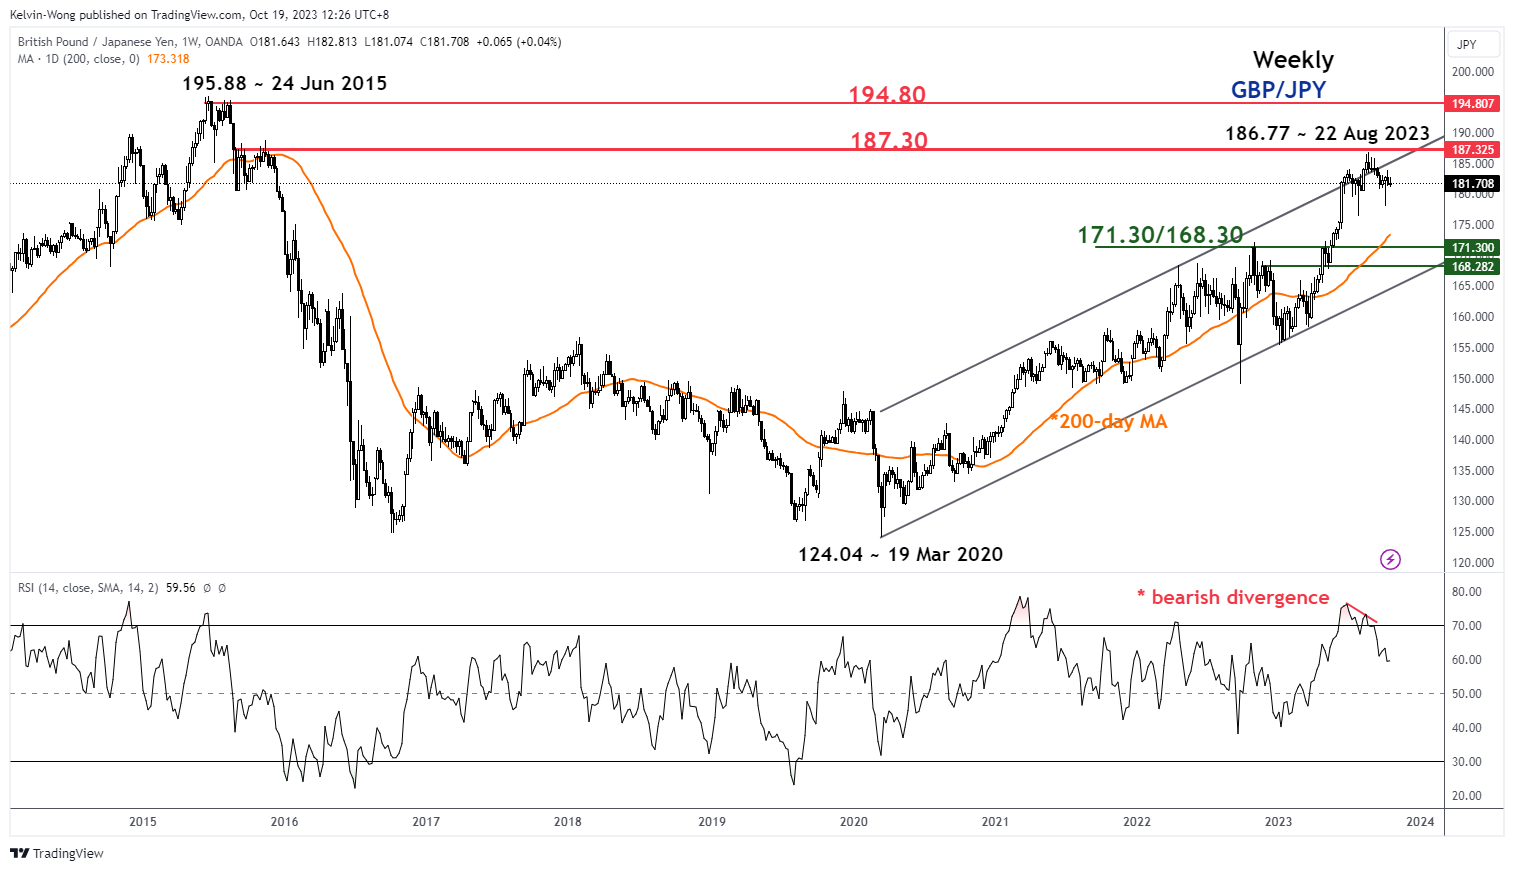
Fig 2: GBP/JPY major trend as of 19 Oct 2023 (Source: TradingView, click to enlarge chart)
In addition, the weekly RSI momentum indicator flashed a bearish divergence condition on 22 August 2023 at its overbought region which suggests that the major upside momentum has started to ease and in turn increases the odds of potential multi-week corrective decline towards the 171.30/168.30 support zone (also the 200-day moving average).
Minor bearish “Head & Shoulders” in progress
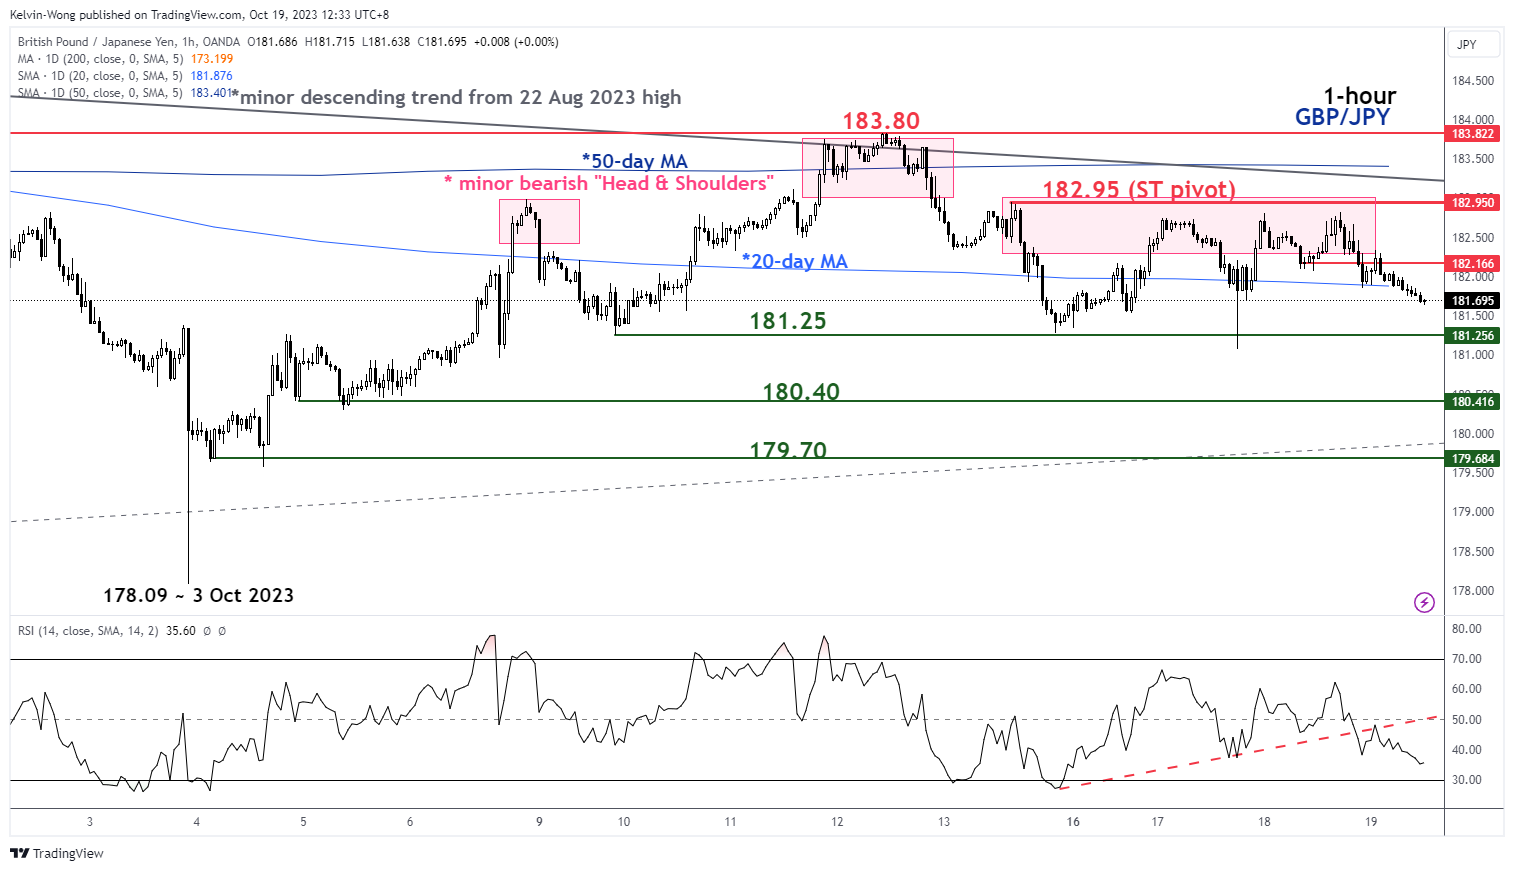
Fig 3: GBP/JPY minor short-term trend as of 19 Oct 2023 (Source: TradingView, click to enlarge chart)
In the shorter term as seen on the 1-hour chart, the price actions of the GBP/JPY have traced out an impending minor bearish reversal “Head & Shoulders” configuration with its neckline support coming in at 181.25 after a rejection on the minor descending trendline resistance in place since 22 August 2023 high.
Several bearish elements have also emerged in the past five days where the GBP/JPY has broken below its 20 and 50-day moving averages. Watch the 182.95 key short-term pivotal resistance and a break below 181.25 reinforces a potential short-term impulsive decline towards the next immediate supports at 180.40 and 179.70.
On the flip side, a clearance above 182.95 negates the bearish tone for a retest on the next intermediate resistance at 183.80 (minor swing highs of 12 October/15 September 2023).
Stocks Fall on Earnings, Surging Rates, and Higher Oil Prices
US stocks are declining on soft earnings, rising rates, and as the risks grow for a potential widening of the Israel-Hamas conflict. Today’s round of earnings from Morgan Stanley, JB Hunt, and United Airlines told a story of a weakening economy that has rising costs drive a weakening profit outlook. Investors are scrambling into safety as the next quarter looks like it has a lot of turbulence for earnings.
FX
Stubborn UK inflation and the risk of more BOE tightening in 2024 was unable to stop the British pound’s slide. Rising motor fuel prices were a key driver for the hot UK inflation data, which means disinflation might struggle if crude disruptions start occurring. Geopolitical tensions will remain elevated and will lead to a softer growth outlook that will drive safe-haven flows towards the dollar.
US Data
The housing market is showing signs of stabilizing. Housing starts rose in September as multi-family homes saw an increase of more than 17%. New home construction rose from 1.269 million to 1.358 million and building permits dropped from 1.541 million to 1.473 million.
This should be a rough year ahead for the housing market as mortgage demand plunges as interest rates for the 30-year fixed rate mortgage approaches 8%. Home buyers will have to face high rates, elevated house prices, and low inventories.
Oil
Crude prices held onto gains after the EIA crude oil inventory report showed the oil market is staying tight. US crude stockpiles fell by 4.4 million, matching the decline API reported yesterday. Demand improved across the board. Gasoline demand was strong as inventories fell by 2.37 million bpd. The standout data point was US oil exports, which surged by 5.3 million bpd. It is clear that now that we have two wars that are putting oil supplies at risk, which means European and Asian buyers will become more interested with US crude. US production also remained at 13.2 million bpd, which is still the highest level seen since 1983.
The oil market is going to remain very tight going forward and the next move with prices will depend on whether geopolitical risks disrupt crude flows. Overnight, oil rose after impressive Chinese data and reports that Iran wanted to impose an Israeli oil embargo.
Oil is going to remain a favorite trade on Wall Street as both the supply and demand side drivers are still mostly bullish. The latest round of US and Chinese data suggest the world’s two largest economies are supportive for steady or rising crude demand.
Gold
Everyone on Wall Street is becoming the gold guy in Austin Powers. “I love gold”, Goldmember, the fictional villain’s key quote is becoming the mantra for many traders. Gold is rallying on geopolitical risks, expected Diwali demand, bond market stress, and stock market selling pressure. The path to $2000 is clearly in play, but so might a move back to record territory.
Bitcoin
Bitcoin is hovering near the upper boundaries of its recent range as optimism grows that a spot Bitcoin ETF approval will happen before the end of the year. Yesterday’s surge to $30,000 on an erroneous Bitcoin ETF approval news shows you how the market is ready to act once Bitcoin becomes easier to access. The fundamental drivers for crypto however remain mixed. The macro backdrop is starting to turn positive for Bitcoin as Treasury market liquidity concerns grow, but the use case for crypto so far has yet to make any major breakthroughs.
Fed Chair Powell Going on Stage
Markets
The US yield curve is going after 5%+. Another sell‐off in Treasuries yesterday hurled yields between 1.3 and 8.2 bps higher in a move not driven by any particular news event. Real yields once again took the lead and brought the 10‐ year close to the early October cycle high (2.48%). As per close yesterday, only the 5, 7 and 10‐year nominal yields still traded sub 5%. But yields add another 3‐5 bps across the curve in Asian dealings this morning, narrowing that list down to just the 5‐ and 10‐year tenors. Every maturity but the 30‐y (a mere 2 bps short) is exploring new cycle highs. Monetary policy certainly plays a role through the higher‐for‐longer mantra and the balance sheet rundown. Fed’s Waller yesterday said he expected the latter could amount up to $2500 bn with the balance sheet currently already down $1000bn from the +/‐ $9000bn peak in 2022. Combined with the US stacking up huge deficits with no improvement expected in the foreseeable future, there’s a structural side to the yield increase as well (risk premia). German Bund yields added 2.8‐4.5 bps with the 2‐y yield being the exception due to a benchmark change. The dollar enjoyed a nice bid, both from UST underperformance and the risk‐off mood that the real yield surge triggered. EUR/USD dipped from a day’s high of 1.0594 to 1.0536. DXY bounced off 106 to finish at 106.56. USD/JPY can practically taste the 150 barrier. UK inflation eased less than hoped‐for in September, thus keeping the debate on a final BoE rate hike still alive. It offered some counterweight for sterling in a session where stocks shed 1‐1.5%. EUR/GBP closed near the 0.8678 resistance level.
Asian‐Pacific stocks follow the European and US example yesterday. Losses mount to 2% in China and even 3% in South Korea. Oil prices marginally ease to $91.05 (Brent) after the US suspended some sanctions on the Venezuelan oil, gas and gold sector. Risk‐off supports the US dollar as well as the Japanese yen. The Aussie dollar underperforms G10 peers with a disappointing labour market report acting as an additional drag. Today’s economic calendar is all about Fed speech with chair Powell going on stage at the Economic Club of New York as the highlight. We expect him to strike a similar tone as his colleagues. Several compared the recent yield rally as having the same monetary tightening effect at the final rate hike projected by the dot plot. It makes a November hike less likely but doesn’t exclude anything for December. For yields, however, the technical charts are probably the dominating factor for trading. As the 10‐y yield approaches the symbolic 5% level, it’s meteoric ascent could ease up a bit. We may even see some buyers stepping in from the sidelines. The US dollar may retain its strengthening bias throughout the day. EUR/USD’s October lows of 1.0448 acts as support but should be safe for today.
News and views
The Bank of Korea today as expected left its policy rate unchanged at 3.50%. The policy rate already stands at that level since the last BoK rate hike in January. The BoK maintains a tightening bias as it sees risks that upward price pressures might persist longer than previously expected, amongst other due to higher oil prices. CPI inflation in the country dropped to 2.3% Y/Y in July but reaccelerated to a faster than expected 3.7% Y/Y in September. The BoK sees its policy currently as being restrictive, but this will have to be maintained for a considerable period of time. Further deliberations on whether the policy rate needs to be raised further take into account the development of inflation, (elevated) household debt and monetary policy in major overseas economies. With respect to inflation, Y/Y price growth is expected to return to the low 3.0% area later this year. The Korean won remains in the defensive this morning with USD/KRW rising to 1358. This compares to the strong YTD level of the won at 1216.3 early February.
September Australian labour market data were slightly softer than expected. The economy added a net 6.7k jobs, coming on the back of a very strong 63.3 job growth in August. Full time employment even declined 39.9k while part time job growth printed at 46.5k. This suggests cooling in the labour market. The unemployment rate declined to 3.6% from 3.7%, but this coincided with a decline in the participation rate (66.7% from 67.0%). Next week’s inflation data will be a final key input for the November 7 RBA policy meeting. Markets currently expect the RBA to keep rates unchanged in November. Australian yields this morning jumped sharply higher (10‐y +13.5 bps) but this was mainly due to broader market trends. The Aussie dollar eased to AUD/USD 0.63, nearing the YTD low (0.6286) on a broader risk‐off sentiment.
EUR/USD Daily Outlook
Daily Pivots: (S1) 1.0508; (P) 1.0551; (R1) 1.0579; More...
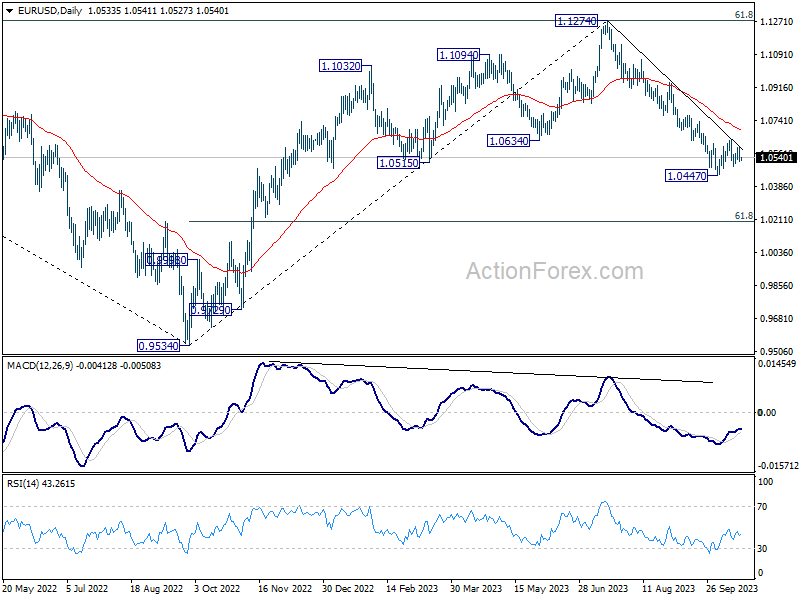
Intraday bias in EUR/USD remains neutral as consolidation from 1.0447 is still in progress. On the downside, firm break of 1.0447 will resume whole fall from 1.1274 and target 1.0199 fibonacci level. On the upside, however, break of 1.0639 will resume the rebound from 1.0447 to 55 D EMA (now at 1.0692).
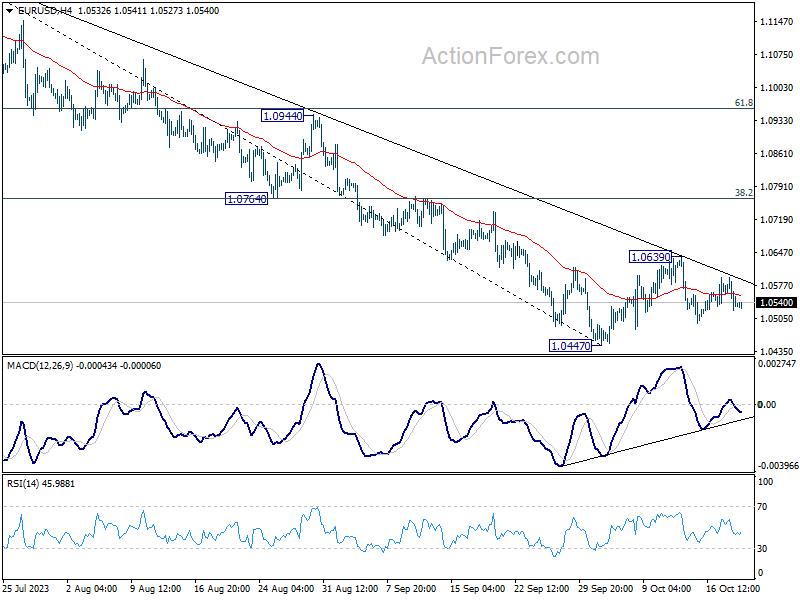
In the bigger picture, fall from 1.1274 medium term top could still be a correction to rise from 0.9534 (2022 low). But chance of a complete trend reversal is rising. In either case, current fall should target 61.8% retracement of 0.9534 to 1.1274 at 1.0199 next. For now, risk will stay on the downside as long as 55 D EMA (now at 1.0692) holds, in case of rebound.
GBP/USD Daily Outlook
Daily Pivots: (S1) 1.2115; (P) 1.2163; (R1) 1.2189; More
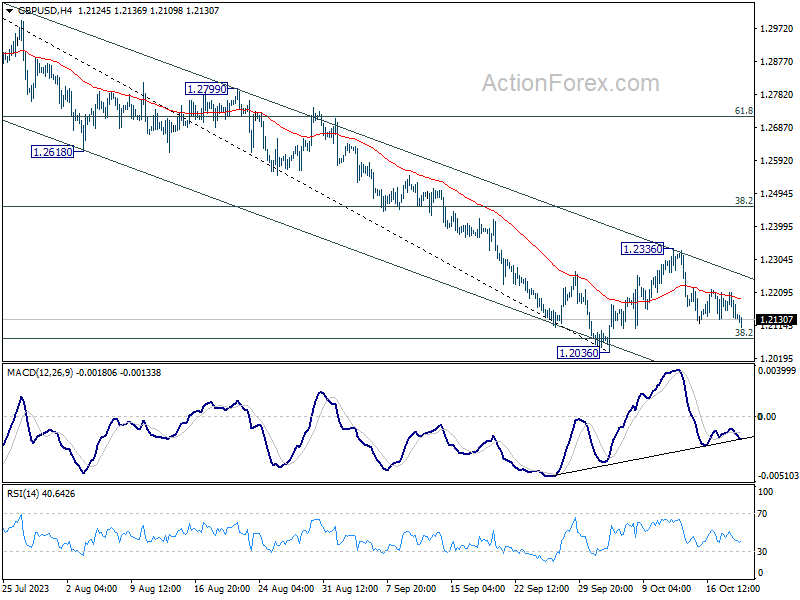
Intraday bias in GBP/USD remains neutral as consolidation from 1.2026 is extending. On the downside, decisive break of 1.2036 will resume whole decline from 1.3141 for 1.1801 support next. However, break of 1.2336 will resume the rebound from 1.2036 to 55 D EMA (now at 1.2383).
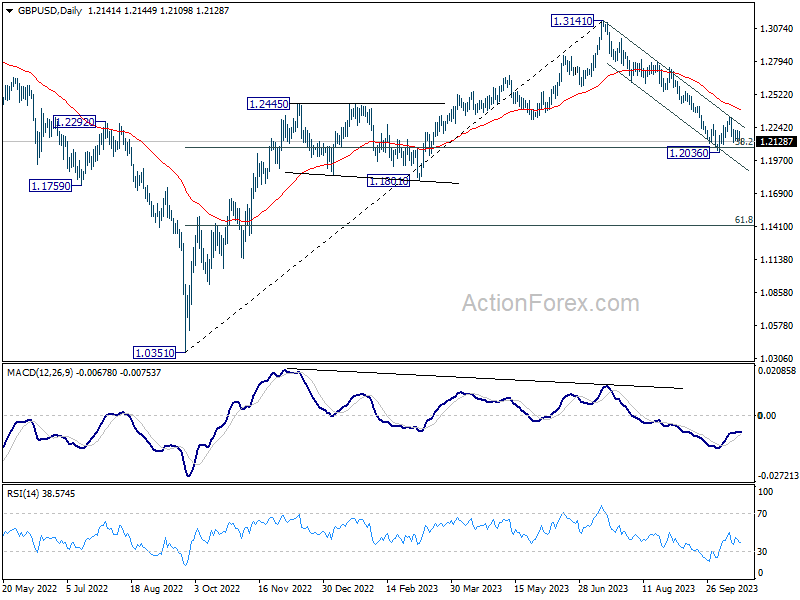
In the bigger picture, fall from 1.3141 medium term top could still be a correction to up trend from 1.0351 (2022 low) only. But risk of complete trend reversal is rising. Sustained break of 38.2% retracement of 1.0351 to 1.3141 at 1.2075 will pave the way to 61.8% retracement at 1.1417. For now, risk will stay on the downside as long as 55 D EMA (now at 1.2383) holds, in case of rebound.
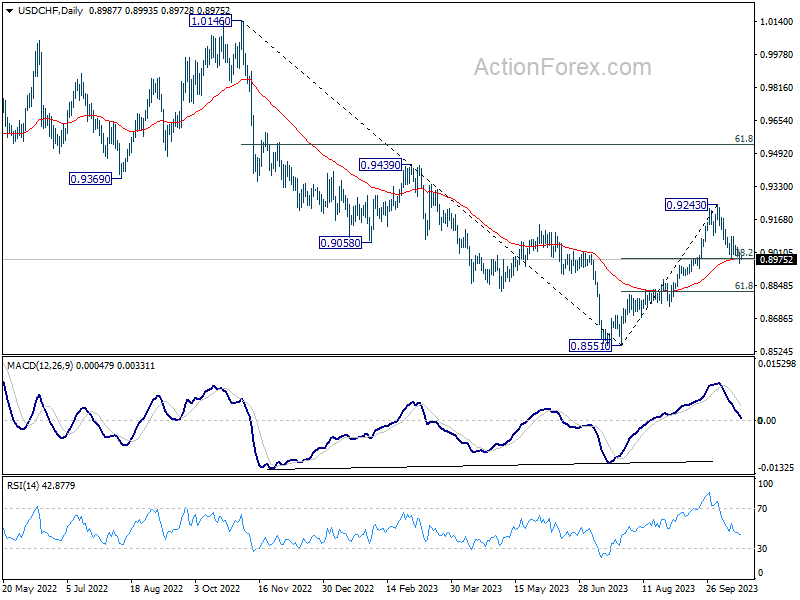
USD/CHF Daily Outlook
Daily Pivots: (S1) 0.8958; (P) 0.8987; (R1) 0.9021; More....
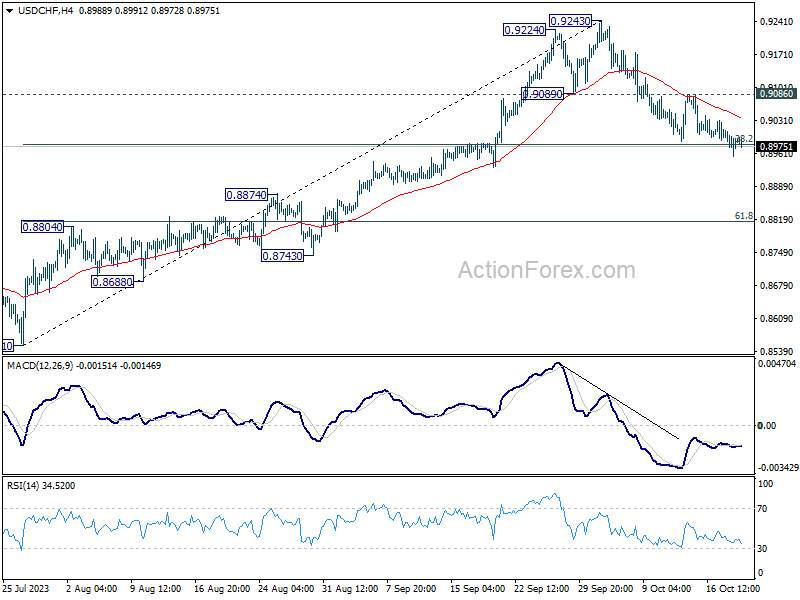
In the bigger picture, as long as 55 D EMA (now at 0.8976) holds rise from 0.8551 is viewed as reversing whole down trend from 1.0146 (2022 high). On resumption, further rise should be seen to 61.8% retracement of 1.0146 to 0.8551 at 0.9537 and above. However, sustained break of 55 D EMA will revive medium term bearishness, for retesting 0.8551 low at a later stage.