Sample Category Title
Technical Outlook and Review
DXY:
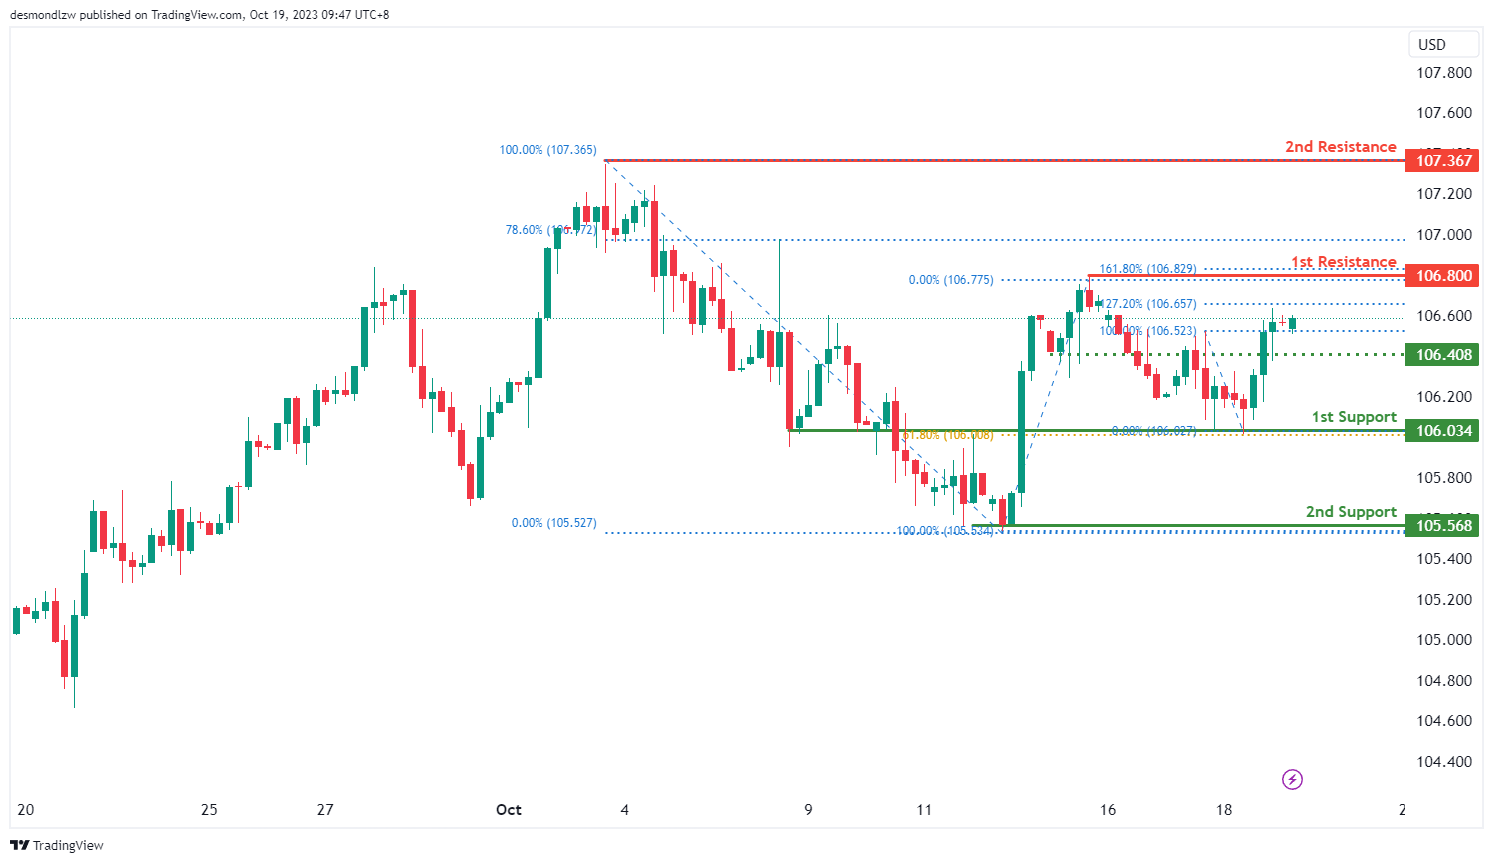
The DXY (US Dollar Index) chart currently displays a bullish overall momentum, suggesting the potential scenario of a bullish continuation towards the 1st resistance level.
The 1st support at 106.03 is considered significant as it aligns with an overlap support and coincides with the 61.80% Fibonacci Retracement level, providing a strong potential foundation of support. Additionally, the 2nd support at 105.56 is identified as a multi-swing low support, further reinforcing potential price support.
On the resistance side, the 1st resistance at 106.80 is characterized as a swing high resistance level, and beyond this, the 2nd resistance at 107.36 is identified as a swing high resistance.
Intermediate support at 106.40 also adds to the complexity of the technical levels, suggesting potential price interactions.
EUR/USD:
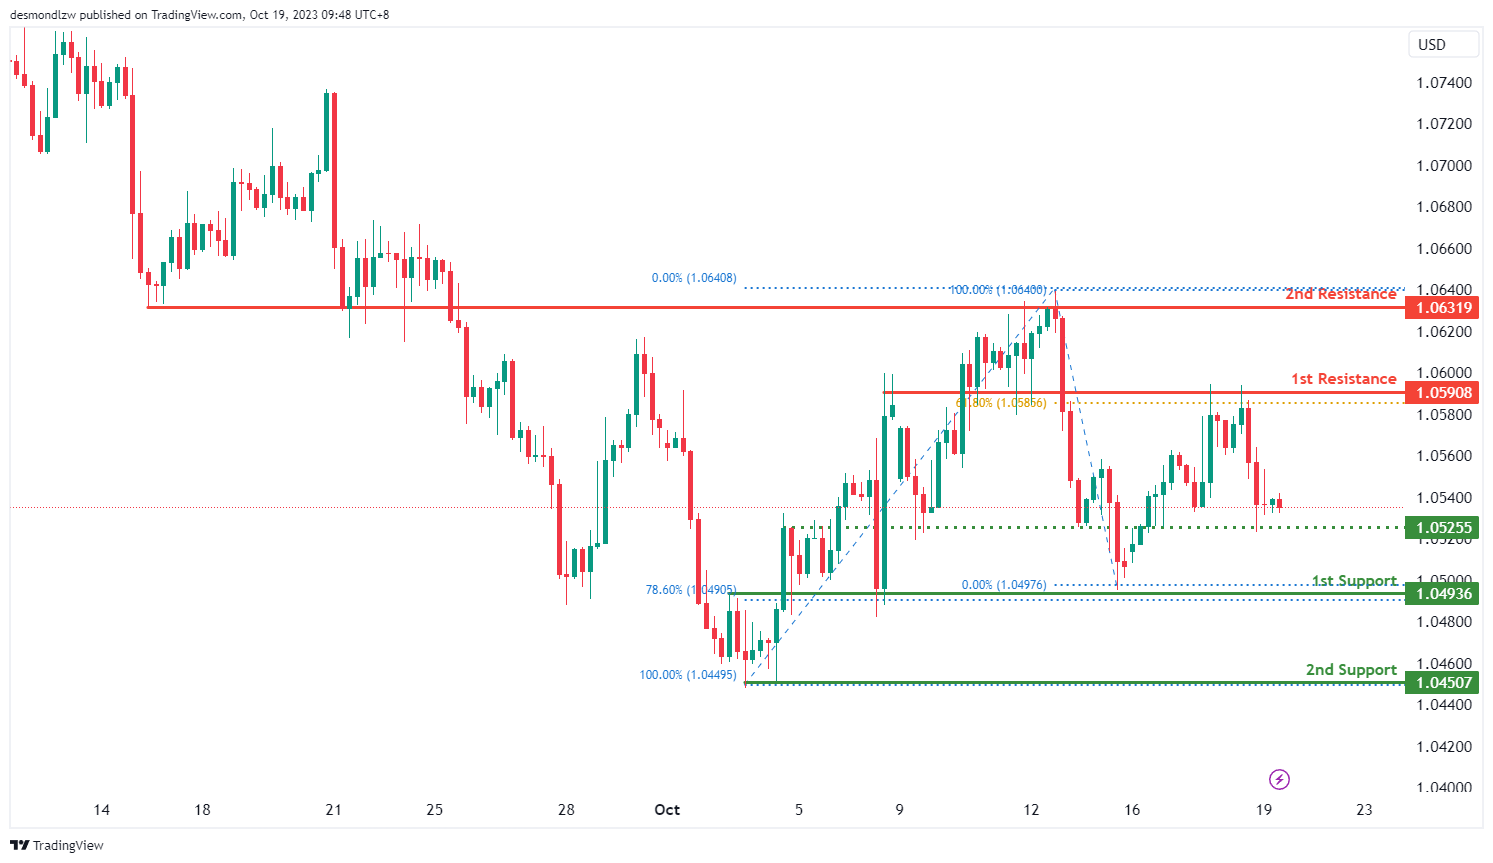
The EUR/USD chart currently demonstrates a bearish overall momentum, indicating the potential scenario of a bearish reaction off the 1st resistance level with a subsequent drop towards the 1st support.
The 1st support at 1.0493 is deemed significant as it aligns with an overlap support and coincides with the 78.60% Fibonacci Retracement level, providing a robust potential foundation of support. Additionally, the 2nd support at 1.0450 is identified as a swing low support, further reinforcing potential price support.
On the resistance side, the 1st resistance at 1.0590 is characterized as an overlap resistance and aligns with the 61.80% Fibonacci Retracement level. Beyond this, the 2nd resistance at 1.0631 is also identified as an overlap resistance.
Intermediate support at 1.0525 adds an additional layer to the technical levels, indicating potential price interactions.
EUR/JPY:
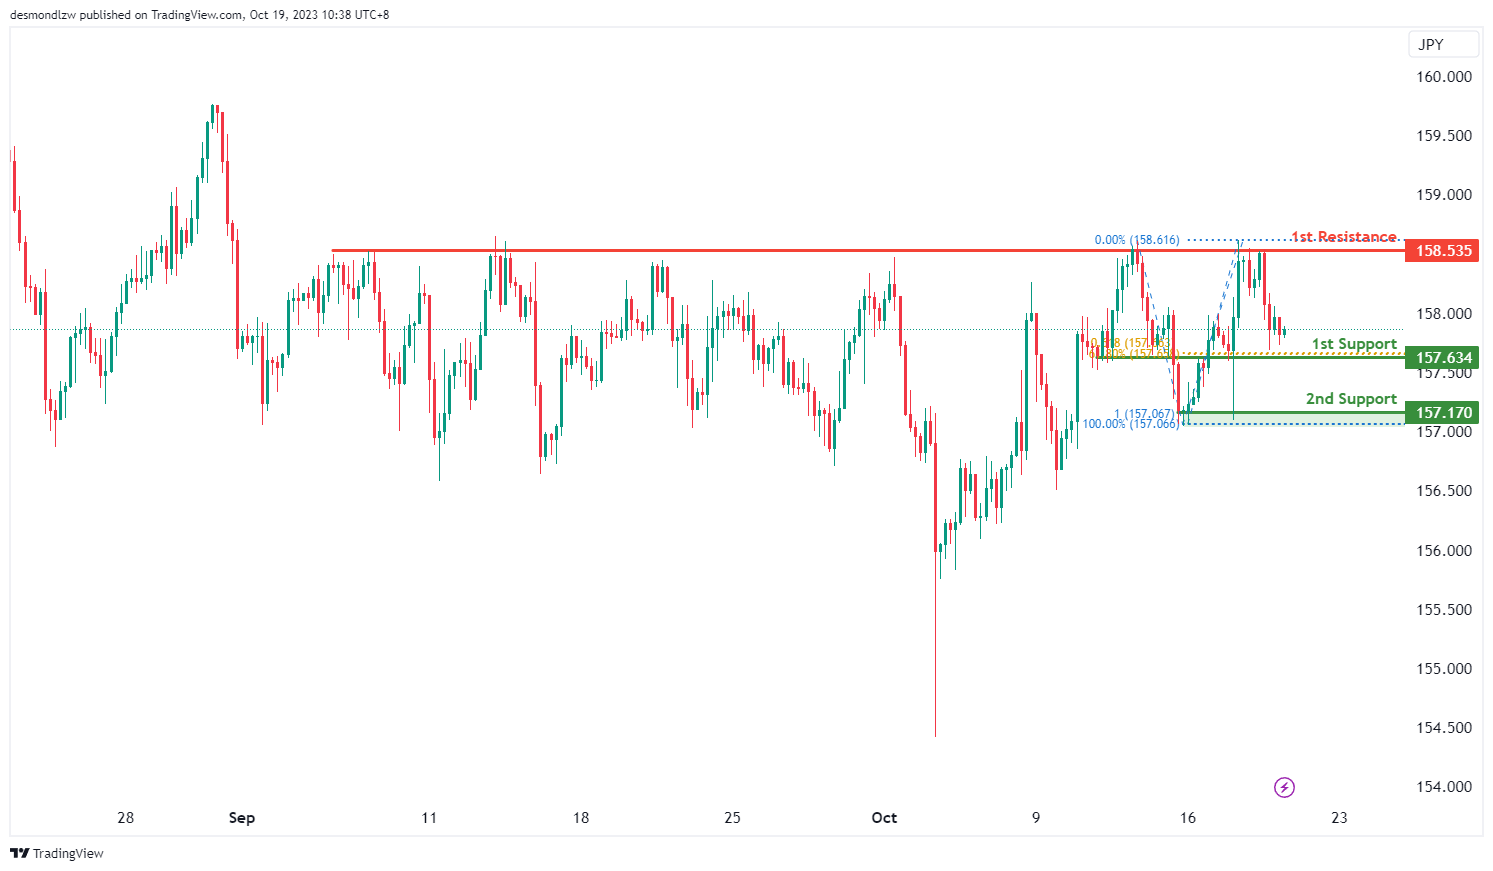
The instrument we are examining is EUR/JPY, and the overall momentum of the chart indicates a bearish trend.
There is a possibility that the price may continue in a bearish direction, potentially reaching the first support level.
The first support level is at 157.63, and it’s considered strong because it represents an overlap of support and aligns with a 61.80% Fibonacci Retracement and a 61.80% Fibonacci Projection, indicating a Fibonacci confluence.
The second support level is at 157.17, and it’s also significant as it marks a swing low support and corresponds to a 100% Fibonacci Projection.
On the resistance side, the first resistance level is at 158.53, and it’s noteworthy because it represents a multi-swing high resistance.
EUR/GBP:
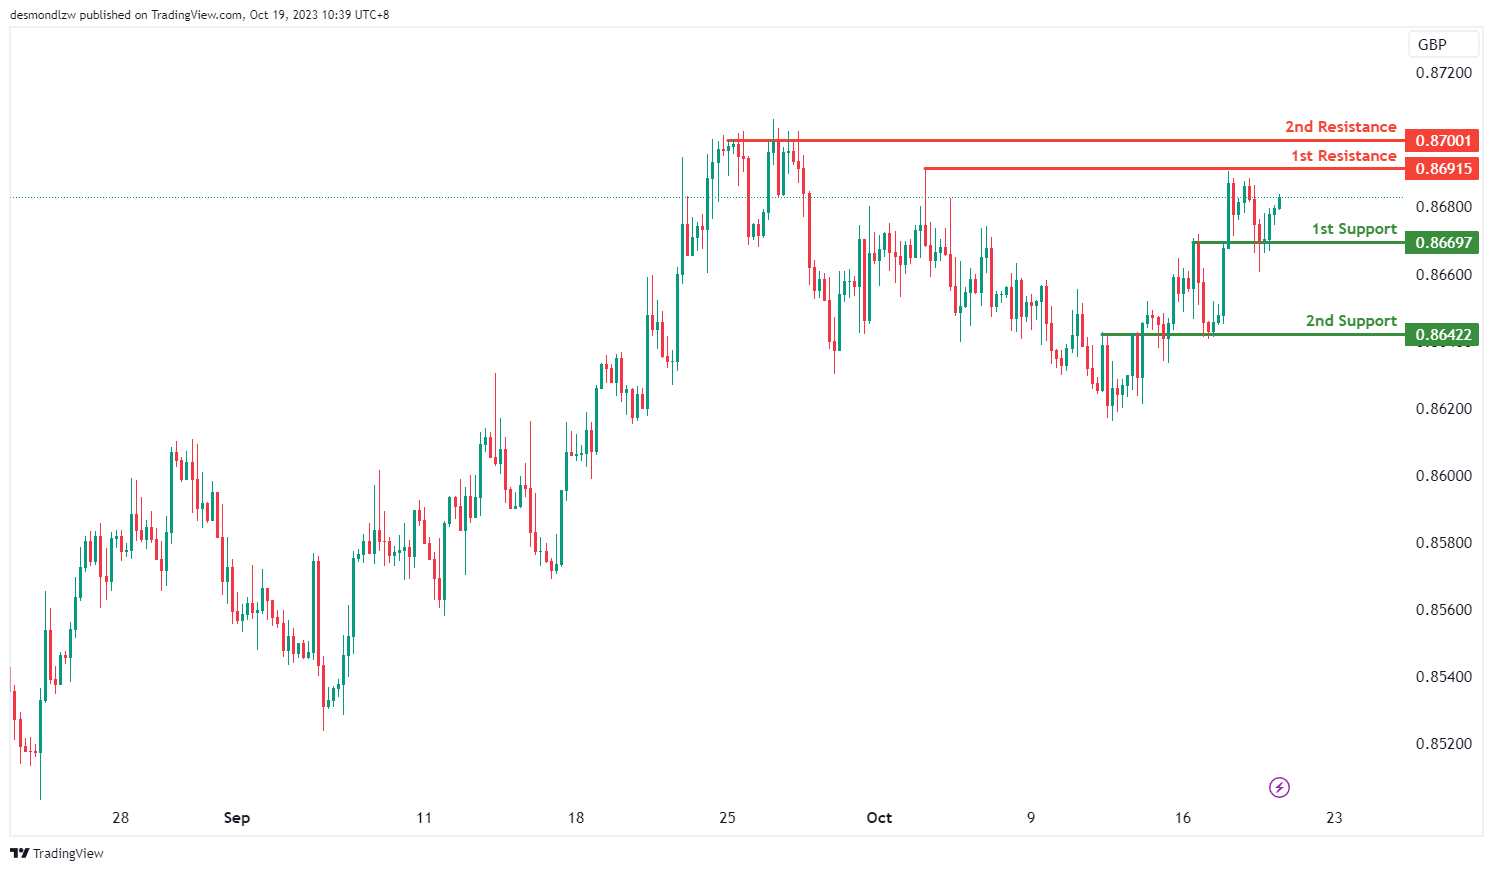
The instrument under analysis is EUR/GBP, and the overall momentum of the chart indicates a bullish trend.
There is a possibility that the price may continue in a bullish direction, potentially reaching the first resistance level.
The first support level is at 0.8669, and it’s considered strong because it represents an overlap of support.
The second support level is at 0.8642, and it’s also significant as it marks another overlap of support.
On the resistance side, the first resistance level is at 0.8691, and it’s noteworthy because it represents a multi-swing high resistance.
The second resistance level is at 0.8700, and it’s significant as well, as it also functions as a multi-swing high resistance.
GBP/USD:
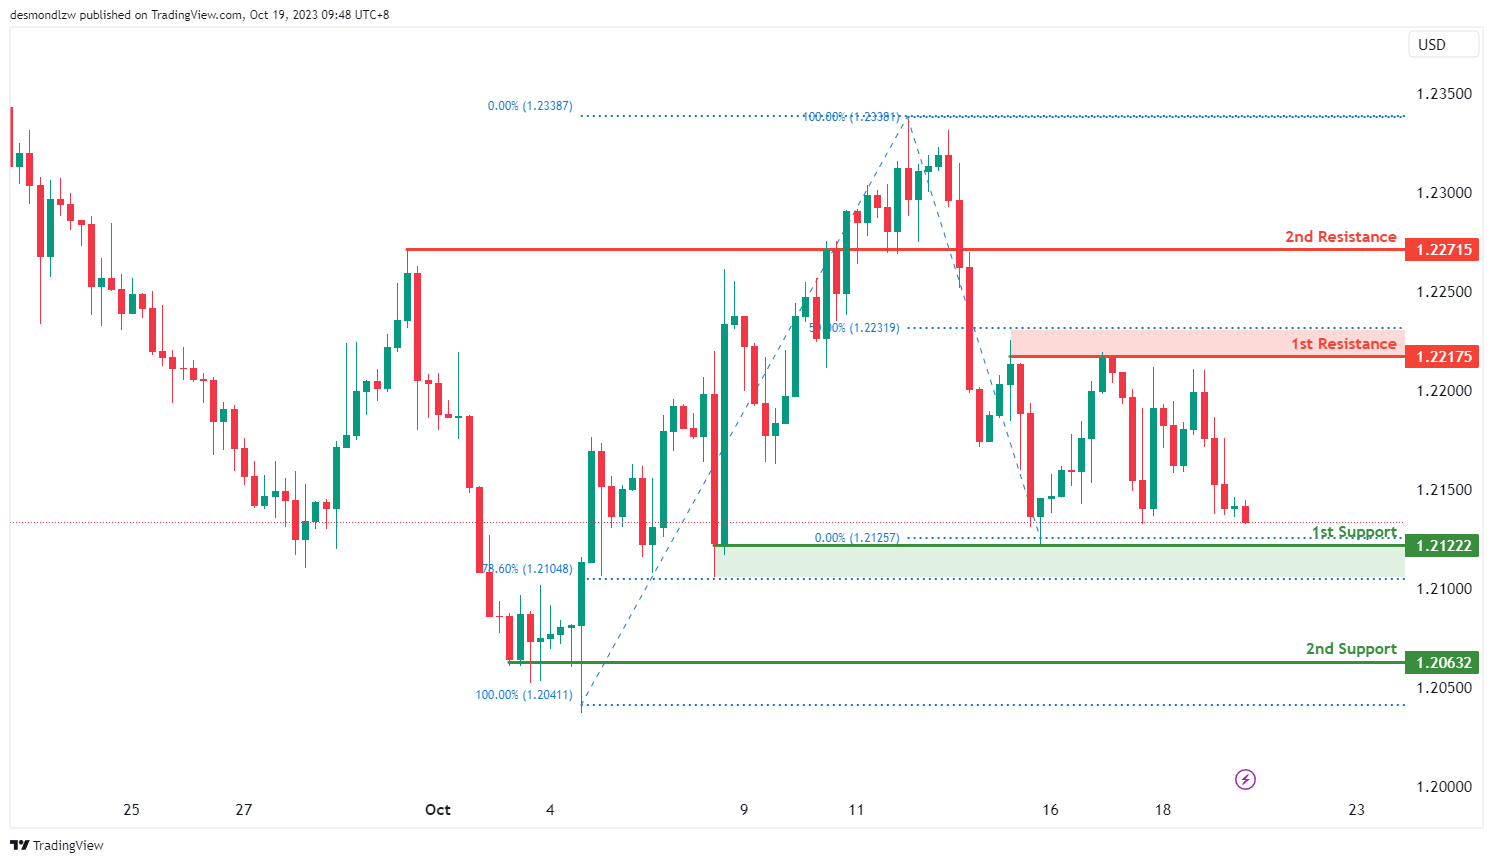
The GBP/USD chart is currently in a neutral state, suggesting the potential for price to fluctuate between the 1st resistance and 1st support levels.
The 1st support at 1.2122 is considered significant as it aligns with a multi-swing low support level and coincides with the 78.60% Fibonacci Retracement level, providing a strong potential support zone. Additionally, the 2nd support at 1.2063 is identified as a multi-swing low support, adding another layer of potential price support.
On the resistance side, the 1st resistance at 1.2217 is characterized as a multi-swing high resistance level, and beyond this, the 2nd resistance at 1.2271 is identified as an overlap resistance.
GBP/JPY:
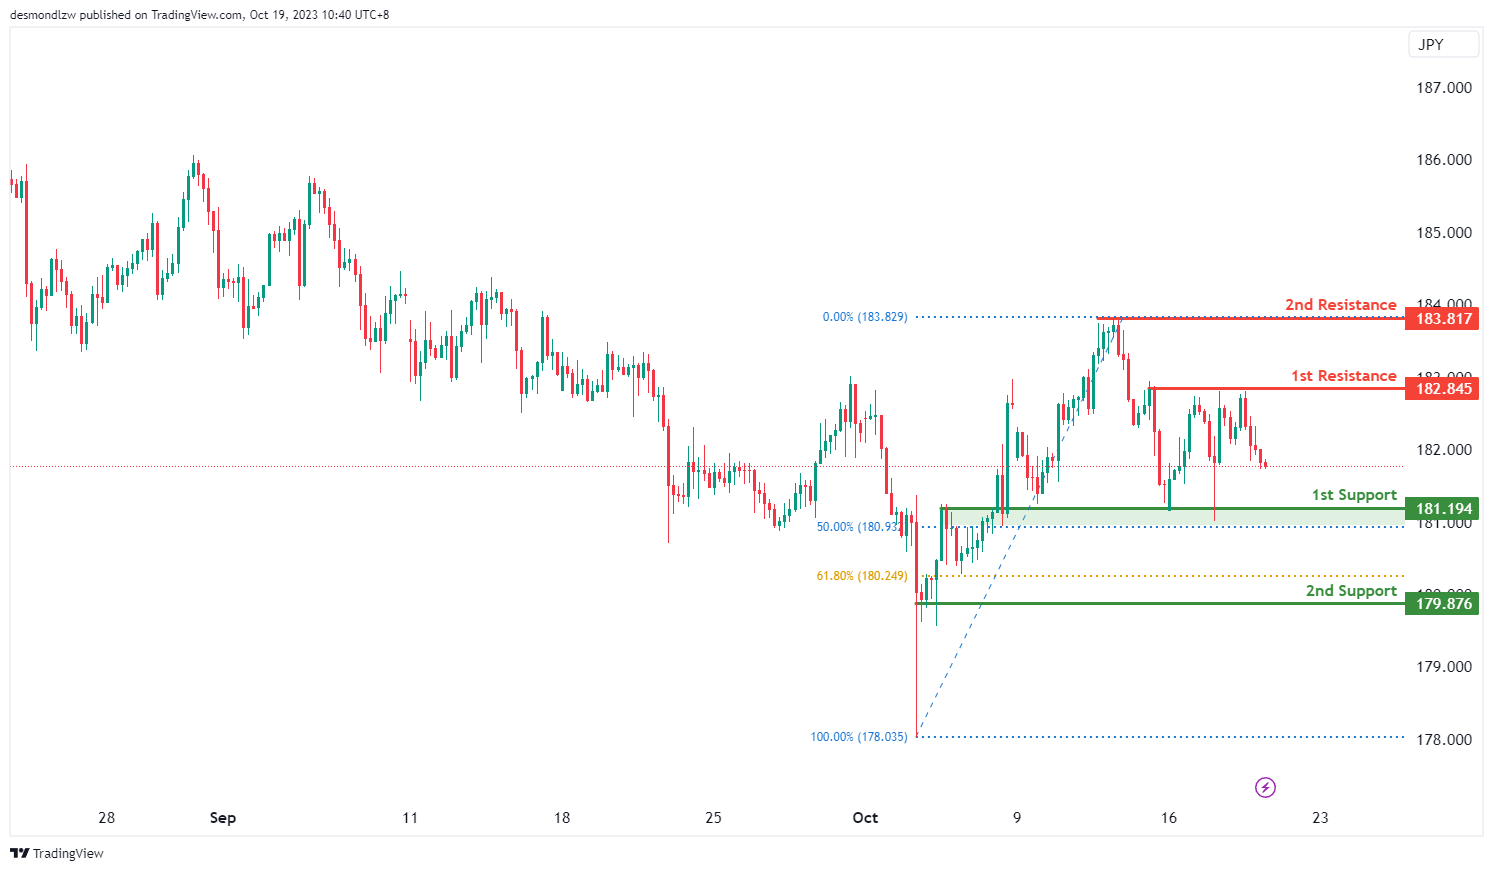
The instrument being analyzed is GBP/JPY, and the overall momentum of the chart indicates a bearish trend.
There is a possibility that the price may continue in a bearish direction, potentially reaching the first support level.
The first support level is at 181.19, and it’s considered strong because it represents an overlap of support and aligns with a 50% Fibonacci Retracement.
The second support level is at 179.87, and it’s also significant as it marks a swing low support and corresponds to a 61.80% Fibonacci Retracement.
On the resistance side, the first resistance level is at 182.84, and it’s noteworthy because it represents a multi-swing high resistance.
The second resistance level is at 183.81, and it’s significant as well, as it represents a swing high resistance.
USD/CHF:
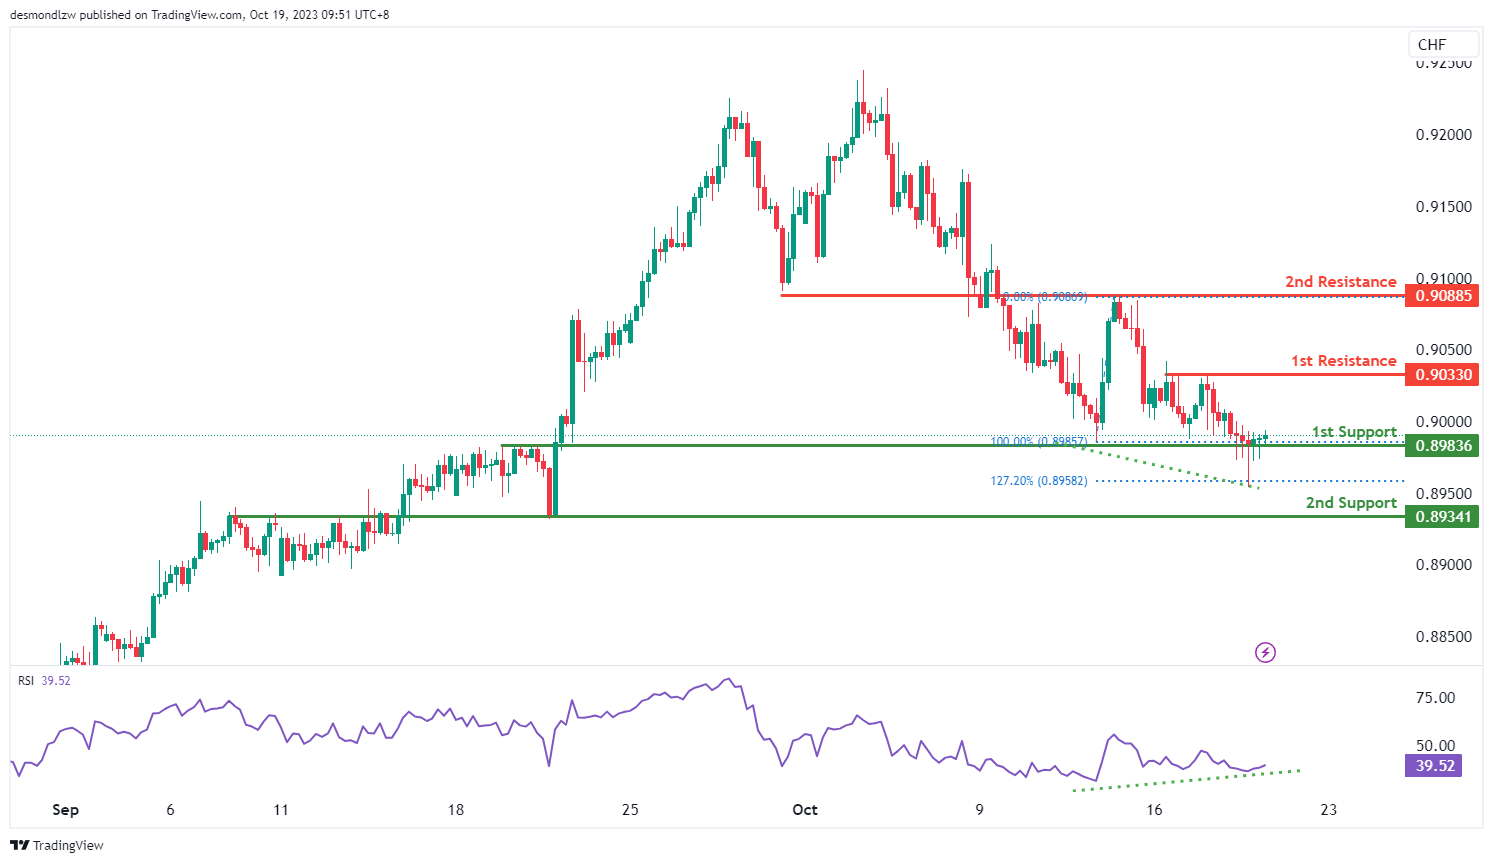
The USD/CHF chart currently indicates a bullish momentum, with the potential scenario of a bullish bounce off the 1st support level towards the 1st resistance.
The 1st support at 0.8983 is considered significant as it aligns with an overlap support level. Additionally, the 2nd support at 0.8934 is identified as an overlap support, reinforcing the strength of potential support.
On the resistance side, the 1st resistance at 0.9033 is characterized as a multi-swing high resistance level, and beyond this, the 2nd resistance at 0.9088 is identified as an overlap resistance.
In addition, the Relative Strength Index (RSI) is displaying bullish divergence versus price, indicating the likelihood of a rapid increase in price. This divergence adds further weight to the potential for a bullish move.
USD/JPY:
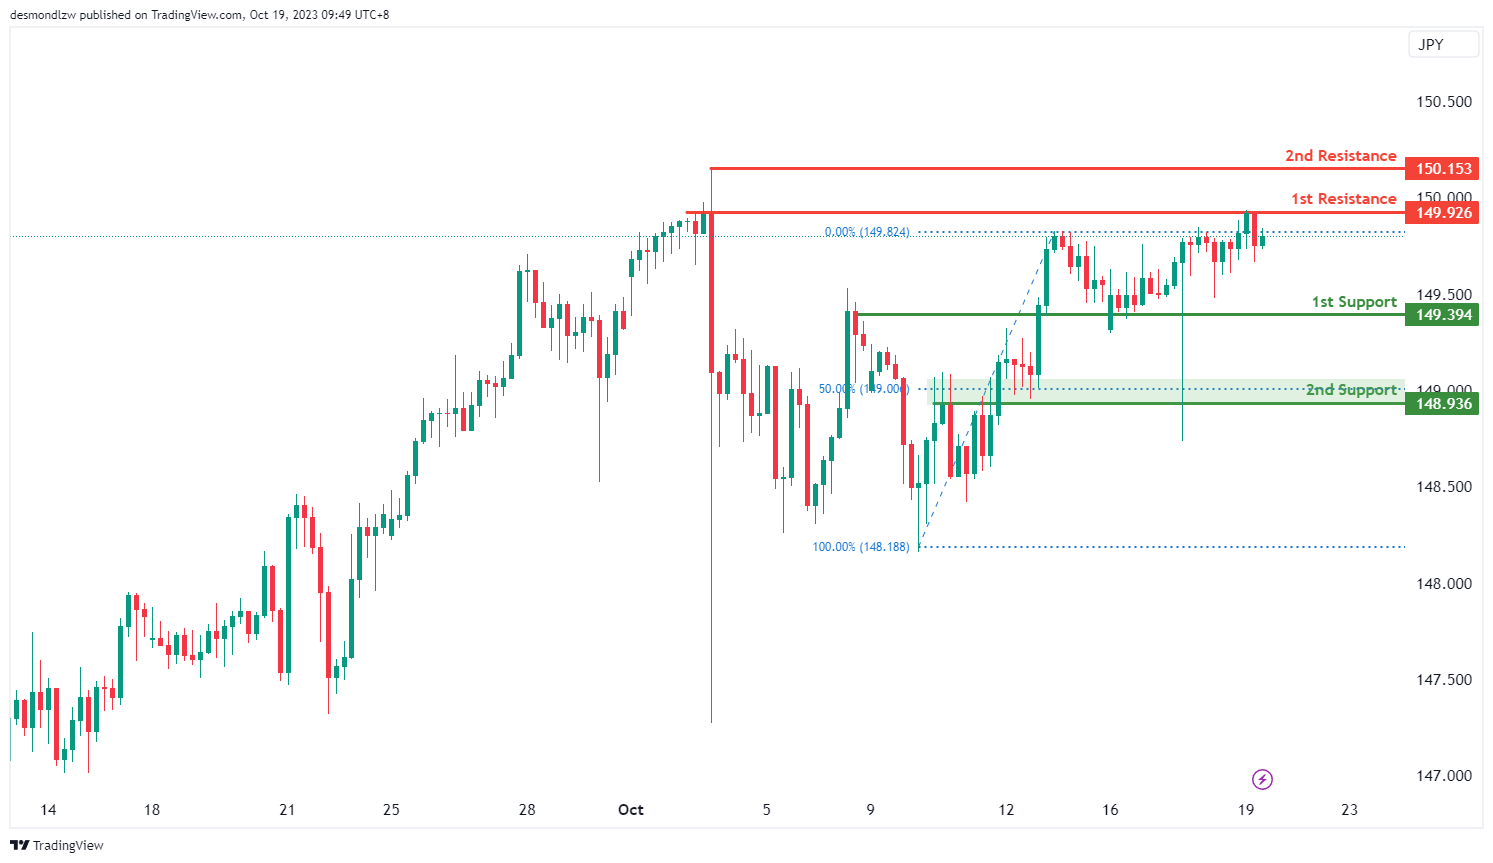
The USD/JPY chart currently shows a bearish momentum, with the potential scenario of a bearish continuation towards the 1st support level.
The 1st support at 149.39 is considered significant as it aligns with an overlap support level. Additionally, the 2nd support at 148.93 is identified as an overlap support and coincides with the 50% Fibonacci Retracement level, providing a strong foundation of potential support.
On the resistance side, the 1st resistance at 149.92 is characterized as a multi-swing high resistance level, and beyond this, the 2nd resistance at 150.15 is identified as a swing high resistance.
USD/CAD:
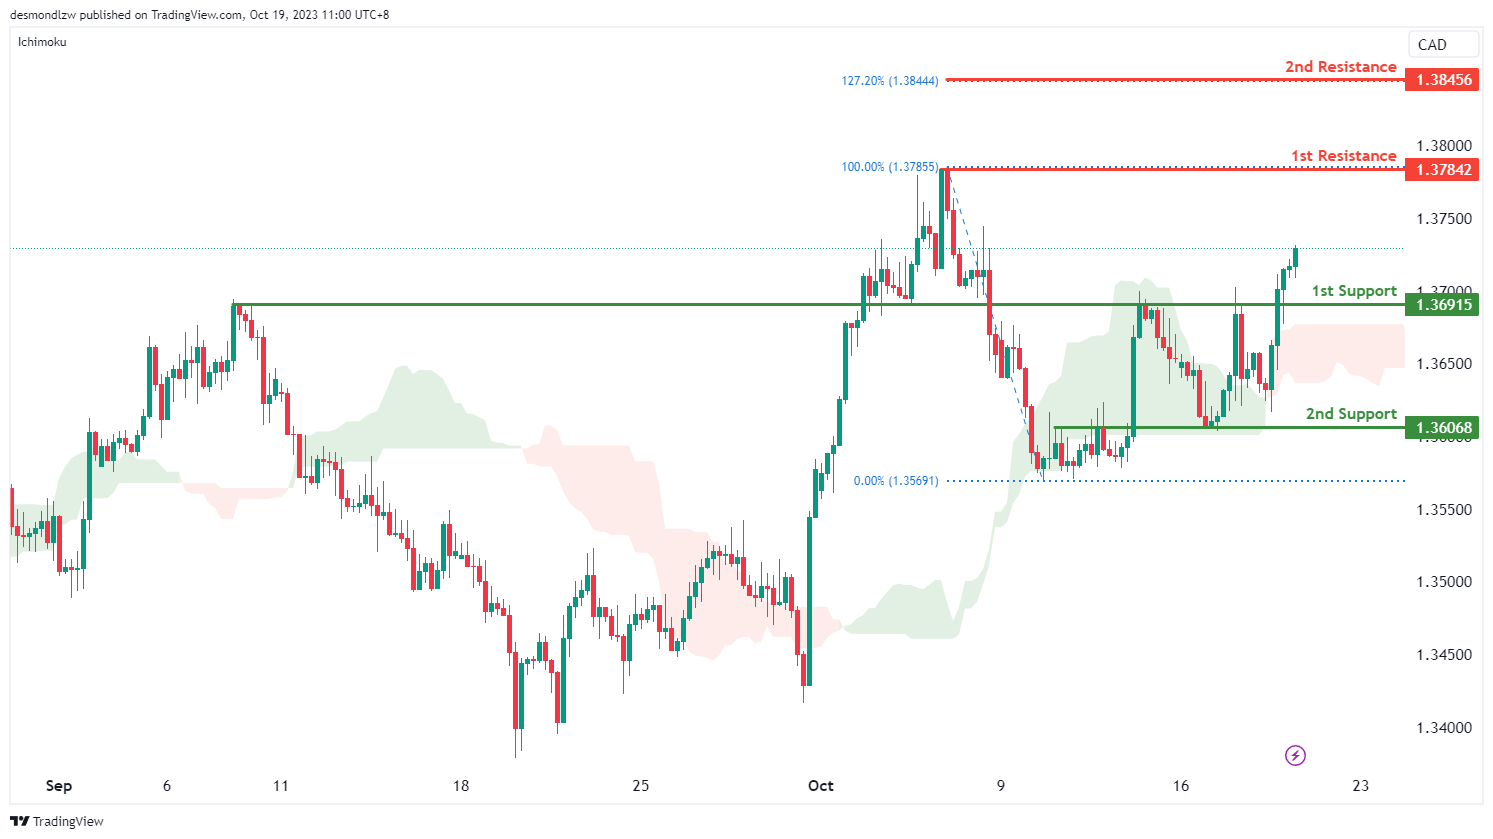
The USD/CAD chart currently exhibits a bullish momentum, suggesting a potential scenario for price to make a bullish continuation towards the 1st resistance level.
The 1st resistance level at 1.3784 is identified as a swing-high resistance. Higher up, the 2nd resistance level at 1.3846 is noted as a resistance level that aligns with the 127.20% Fibonacci extension level, potentially acting as a barrier to further bullish advances.
To the downside, the 1st support level at 1.3692 is identified as an overlap support. Additionally, the 2nd support level at 1.3607 is also noted as an overlap support, adding to its significance as a potential support zone.
AUD/USD:
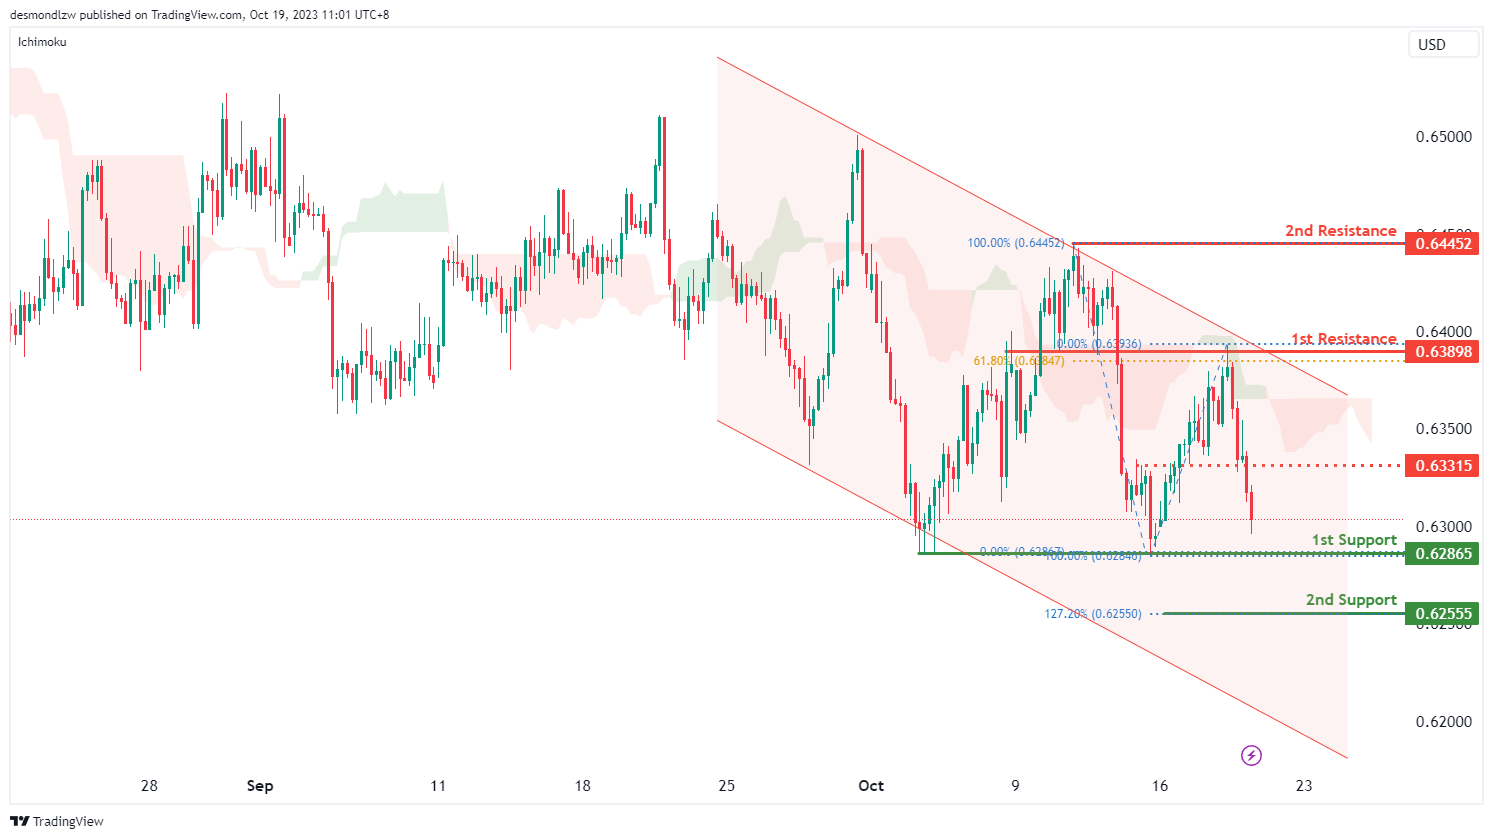
The AUD/USD chart currently exhibits a bearish momentum, with price trading within a bearish channel and under the bearish Ichimoku cloud. These factors indicate a potential scenario for price to make a bearish continuation towards the 1st support level.
The 1st support level at 0.6287 is identified as a multi-swing-low support. Additionally, the 2nd support level at 0.6256 is marked as a support level that aligns with the 127.20% Fibonacci extension level, further reinforcing its importance as a potential support area.
To the upside, the intermediate resistance level at 0.6332 is identified as an overlap resistance while the 1st resistance level at 0.6389 is also noted as an overlap resistance that aligns the 61.80% Fibonacci retracement level. Beyond this, the 2nd resistance level at 0.6445 is marked as a swing-high resistance, making it a potentially strong resistance level.
NZD/USD
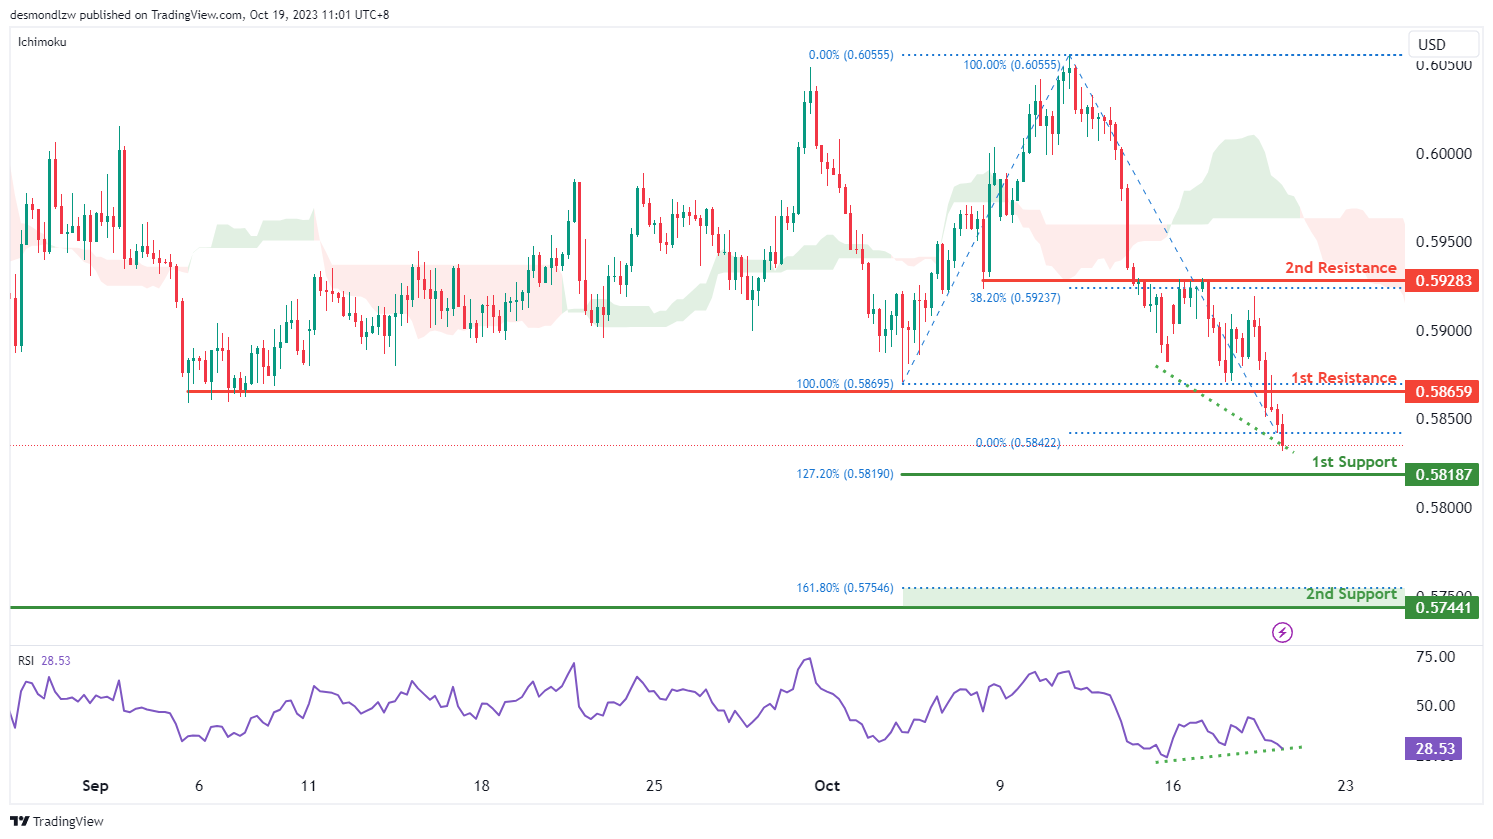
The NZD/USD chart currently exhibits a bearish momentum, suggesting a potential scenario for price to make a bearish continuation towards the 1st support level. However, the Relative Strength Index (RSI) is displaying a bullish divergence versus price. This divergence suggests that there is a potential scenario for price to reverse course in the near-term.
The 1st support level at 0.5819 is identified as a support level that aligns with the 127.20% Fibonacci extension level. Further below, the 2nd support level at 0.5744 is noted as a pullback support level that aligns with the 161.80% Fibonacci extension level, indicating a potential support zone.
To the upside, the 1st resistance level at 0.5866 is identified as a pullback resistance. Beyond this, the 2nd resistance level at 0.5928 is marked as an overlap resistance that aligns with the 38.20% Fibonacci retracement level, making it a potentially strong resistance level.
DJ30:
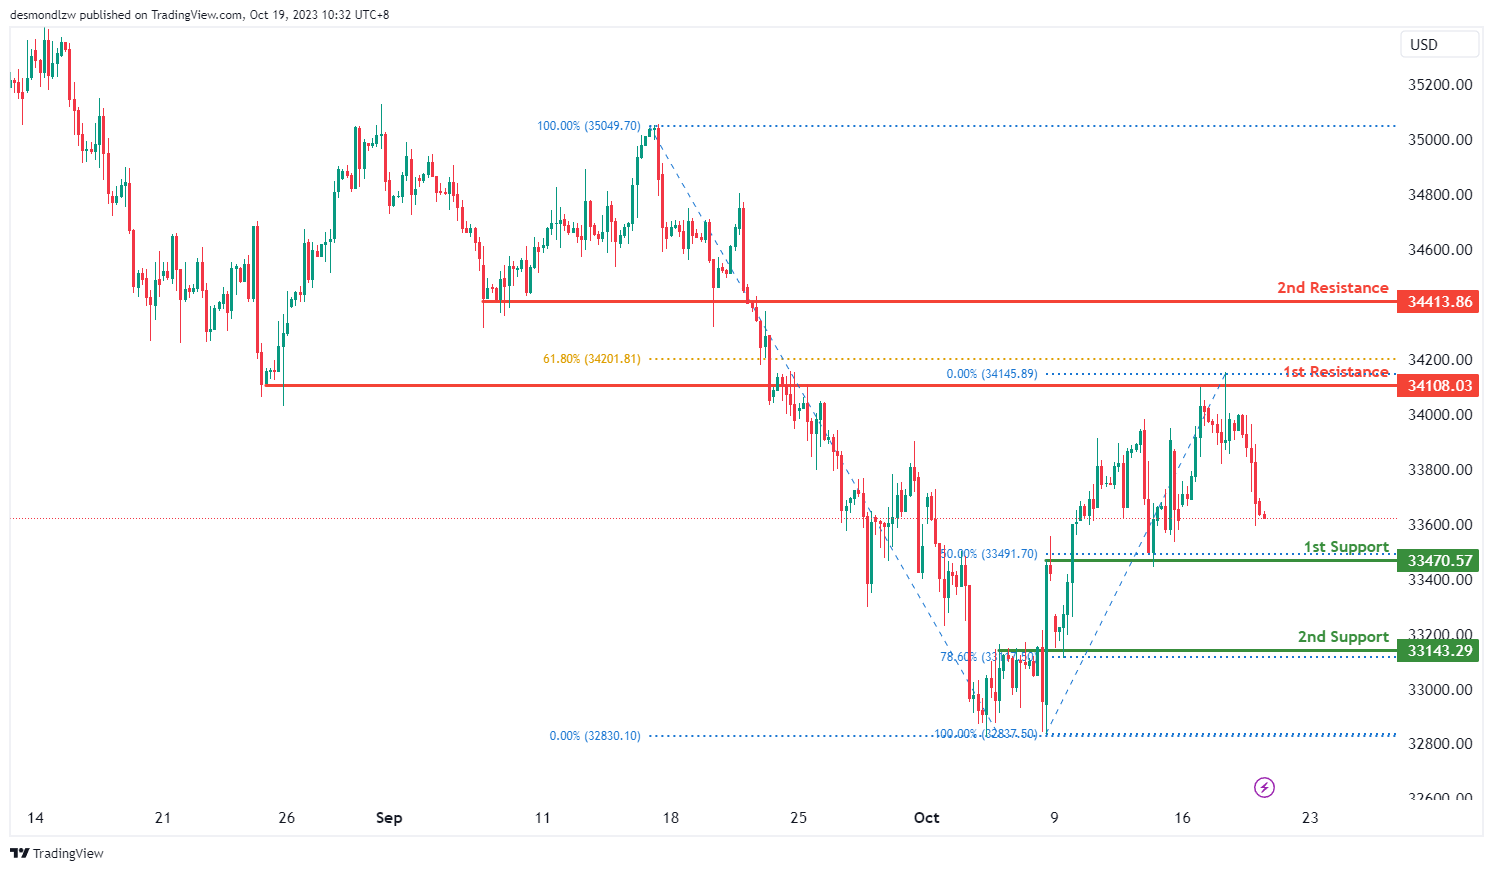
The instrument being analyzed is DJ30, and the current overall momentum of its chart is bearish.
There is a potential scenario where the price could make a bearish continuation towards the 1st support level, which is at 33,470.57.
The 1st support at 33,470.57 is considered significant because it represents an overlap support and aligns with a 50% Fibonacci Retracement. This suggests that it’s a strong level of potential price support.
Additionally, there is a 2nd support level at 33,143.29, which is valuable as it functions as an overlap support and corresponds to a 78.60% Fibonacci Retracement. This provides an additional layer of potential support.
On the resistance side, the 1st resistance level at 34,108.03 is considered important because it represents an overlap resistance, which could potentially act as a barrier to further price increases.
Moreover, there is a 2nd resistance level at 34,413.86, which is significant as it represents a pullback resistance. These resistance levels suggest potential areas where the price might encounter selling pressure, contributing to the overall bearish outlook for DJ30.
GER40:
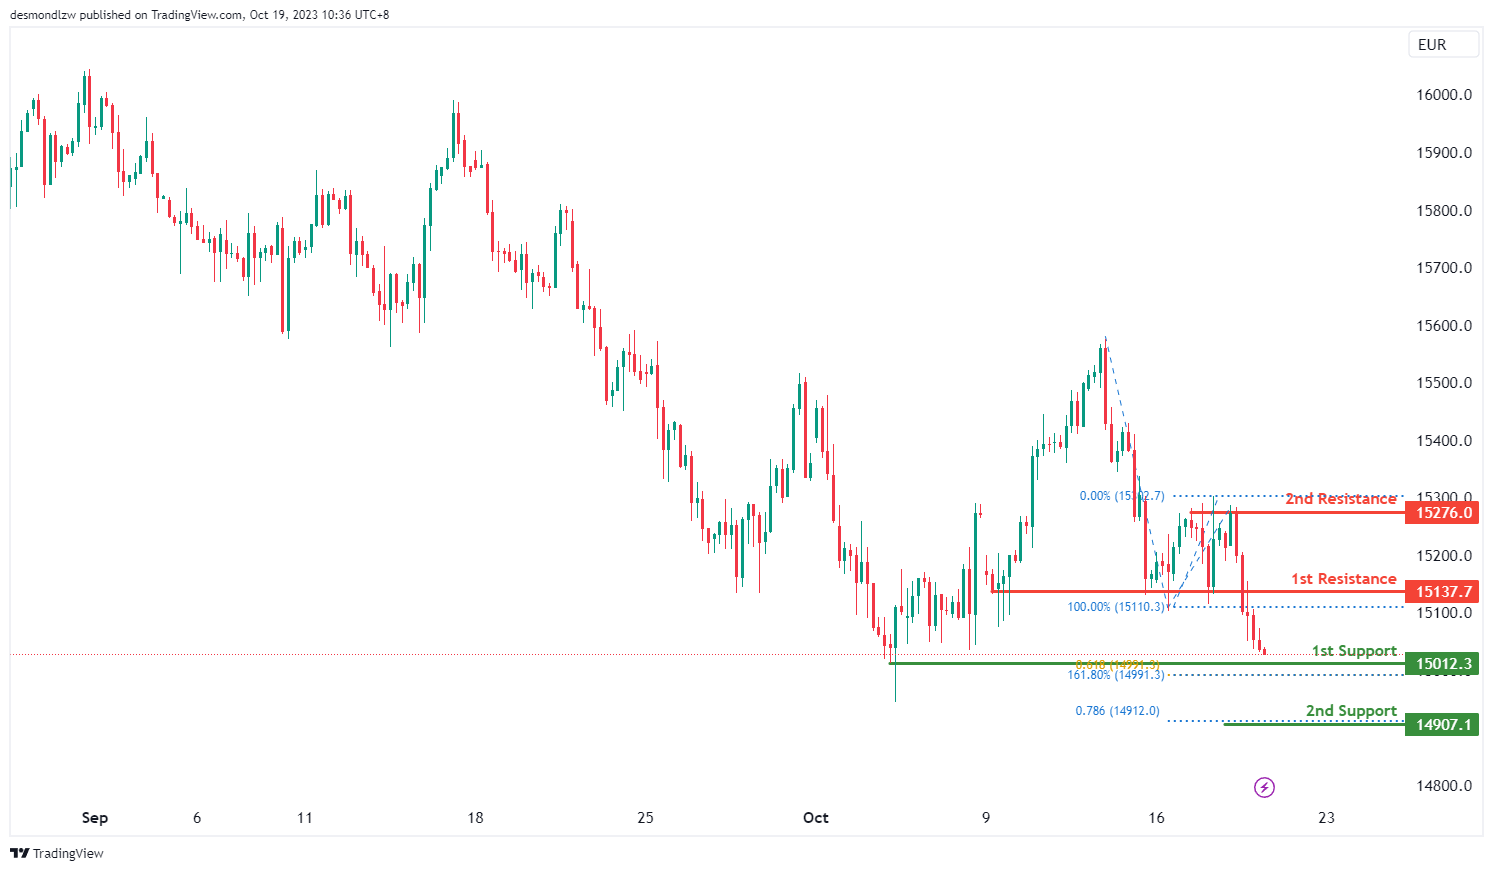
The instrument under analysis is GER40, and the prevailing momentum on its chart is currently bearish.
In a possible scenario, the price is expected to continue in a bearish direction, moving towards the 1st support level at 15,012.30.
This 1st support level at 15,012.30 holds significance for several reasons. First, it represents a swing low support, indicating that it has previously acted as a level where the price found support. Additionally, it aligns with a 61.80% Fibonacci Projection and a 161.80% Fibonacci Extension, which implies a high degree of Fibonacci confluence. This suggests a strong potential for this level to provide support to the price.
Furthermore, there is a 2nd support level at 14,907.10, which is also notable due to its alignment with a 78.60% Fibonacci Projection. This reinforces its potential as a support level.
On the resistance side, the 1st resistance level at 15,137.70 is significant as it acts as a pullback resistance, suggesting it may present a challenge to upward price movement.
Moreover, there is a 2nd resistance level at 15,276.00, which is considered important because it represents multi-swing high resistance. These resistance levels indicate areas where the price might encounter selling pressure, contributing to the bearish momentum of GER40.
US500
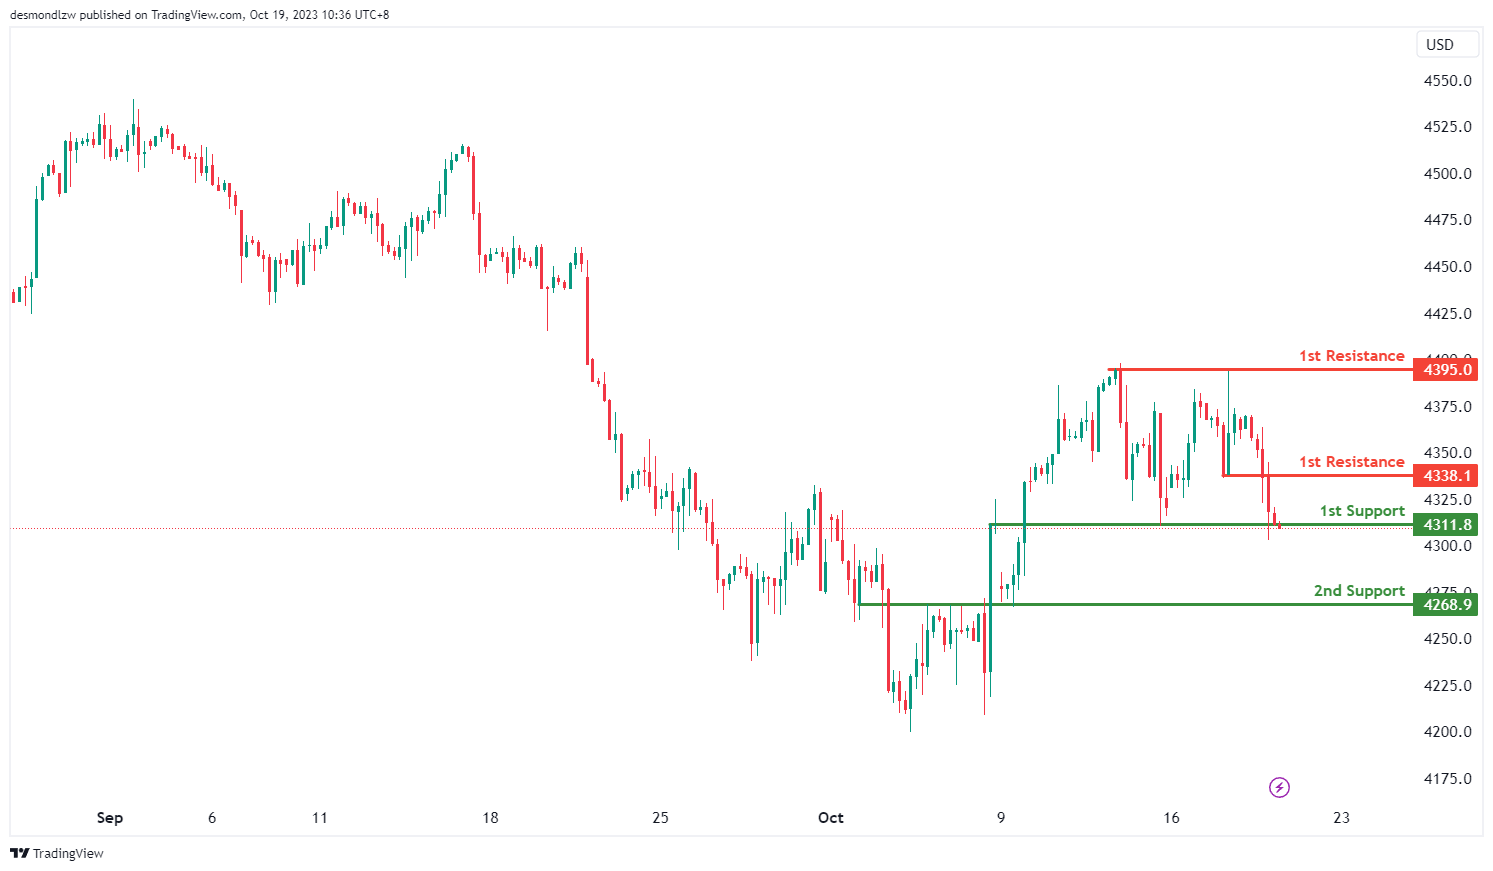
The instrument under analysis is US500, and the overall momentum on its chart is currently bearish.
In a possible scenario, the price is expected to experience a bearish break off the 1st support level at 4311.8 and drop towards the 2nd support at 4268.9.
The 1st support level at 4311.8 is considered significant as it aligns with an overlap support. This indicates that it has previously acted as a level where the price found support, which adds to its importance as a potential price floor.
Additionally, there is a 2nd support level at 4268.9, which is also an overlap support. The presence of two overlap support levels suggests that this area may provide strong support for the price.
On the resistance side, the 1st resistance level at 4338.1 is important as it is a pullback resistance. This implies that it could pose a challenge to upward price movement.
Furthermore, there is a 2nd resistance level at 4395.0, which is described as a multi-swing high resistance. These resistance levels represent areas where selling pressure may emerge, contributing to the overall bearish momentum of US500.
BTC/USD:
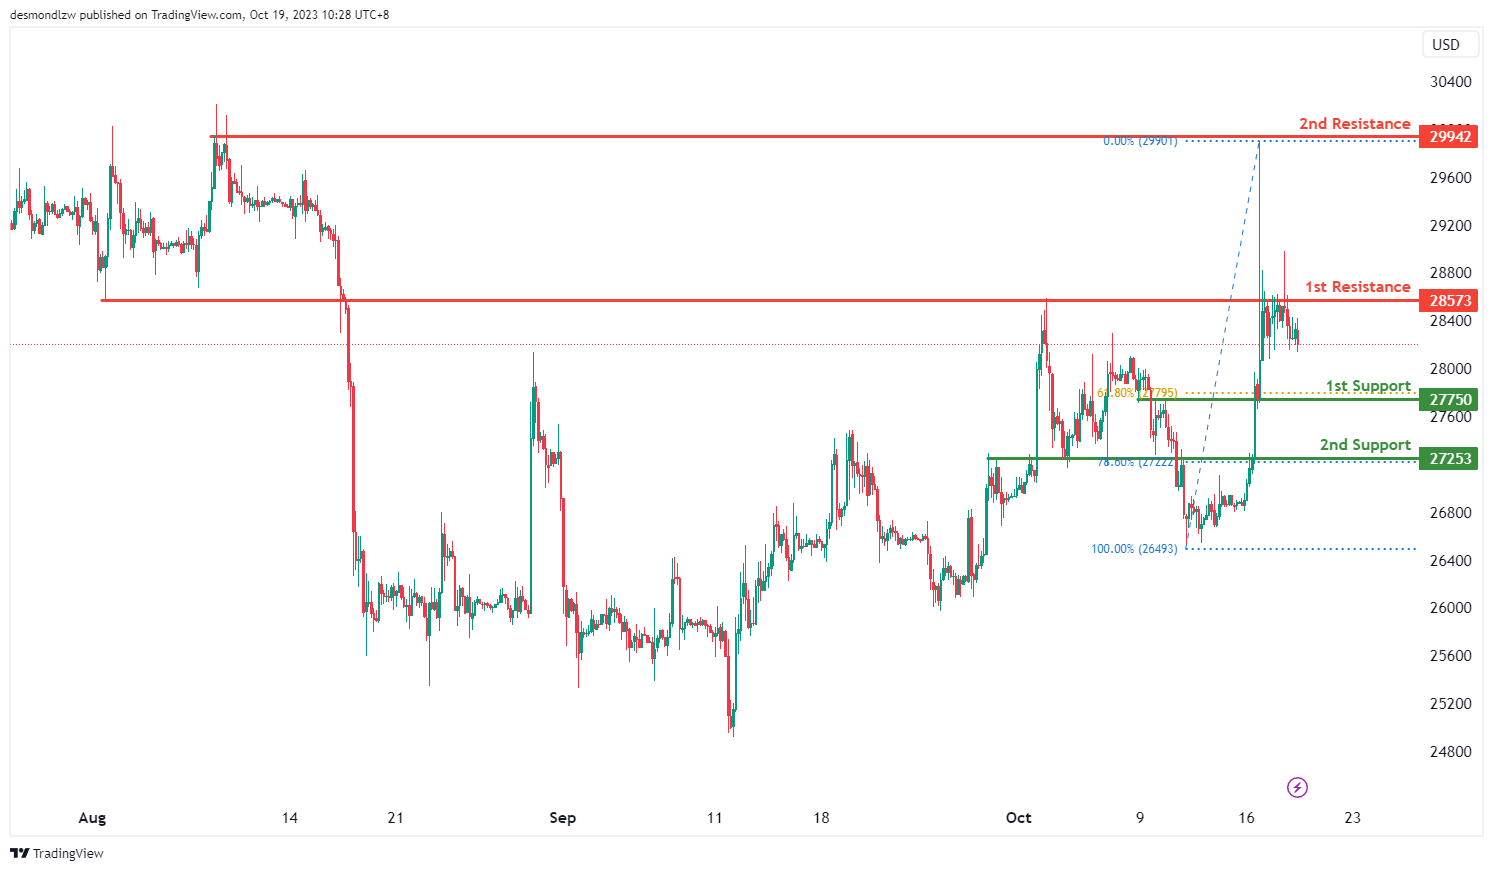
The instrument being analyzed is BTC/USD, and the current overall momentum of its chart is bearish.
There is a potential scenario where the price could make a bearish continuation towards the 1st support level, which is at 27,750.
The 1st support at 27,750 is considered significant because it represents an overlap support and aligns with a 61.80% Fibonacci Retracement. This suggests that it’s a strong level of potential price support.
Additionally, there is a 2nd support level at 27,253, which is valuable as it functions as a pullback support and corresponds to a 78.60% Fibonacci Retracement. This provides an additional layer of potential support.
On the resistance side, the 1st resistance level at 28,573 is considered important because it represents an overlap resistance, which could potentially act as a barrier to further price increases.
Moreover, there is a 2nd resistance level at 29,942, which is significant as it represents a multi-swing high resistance. These resistance levels suggest potential areas where the price might encounter selling pressure, contributing to the overall bearish outlook for BTC/USD.
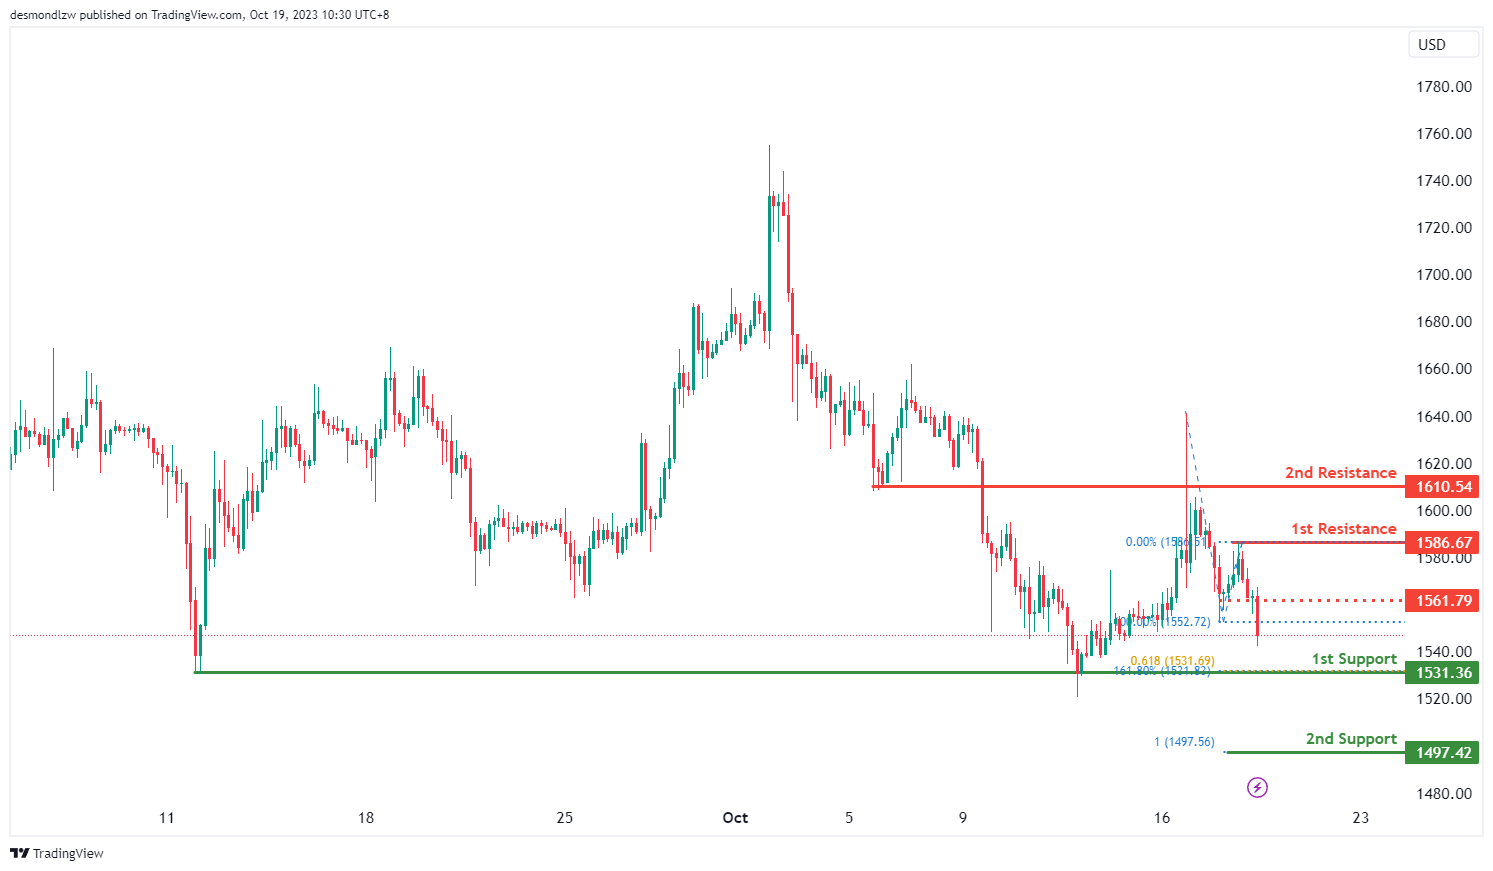
ETH/USD:
The instrument being analyzed is ETH/USD, and the current overall momentum of its chart is bearish.
There is a potential scenario where the price could make a bearish continuation towards the 1st support level, which is at 1,531.36.
The 1st support at 1,531.36 is considered significant because it represents a multi-swing low support, indicating a level where price may find support during a bearish move.
Additionally, there is a 2nd support level at 1,497.42, which is important as it aligns with a 100% Fibonacci Projection, suggesting it’s a strong potential support level.
On the resistance side, the 1st resistance level at 1,586.67 is considered important because it represents a swing high resistance. This level may act as a barrier to further price increases.
Furthermore, there is a 2nd resistance level at 1,610.54, which is significant as it represents an overlap resistance.
Additionally, there’s an intermediate resistance level at 1,561.79, which is valuable as it functions as a pullback resistance. These levels provide potential areas where price might encounter resistance, contributing to the overall bearish outlook for ETH/USD.
WTI/USD:
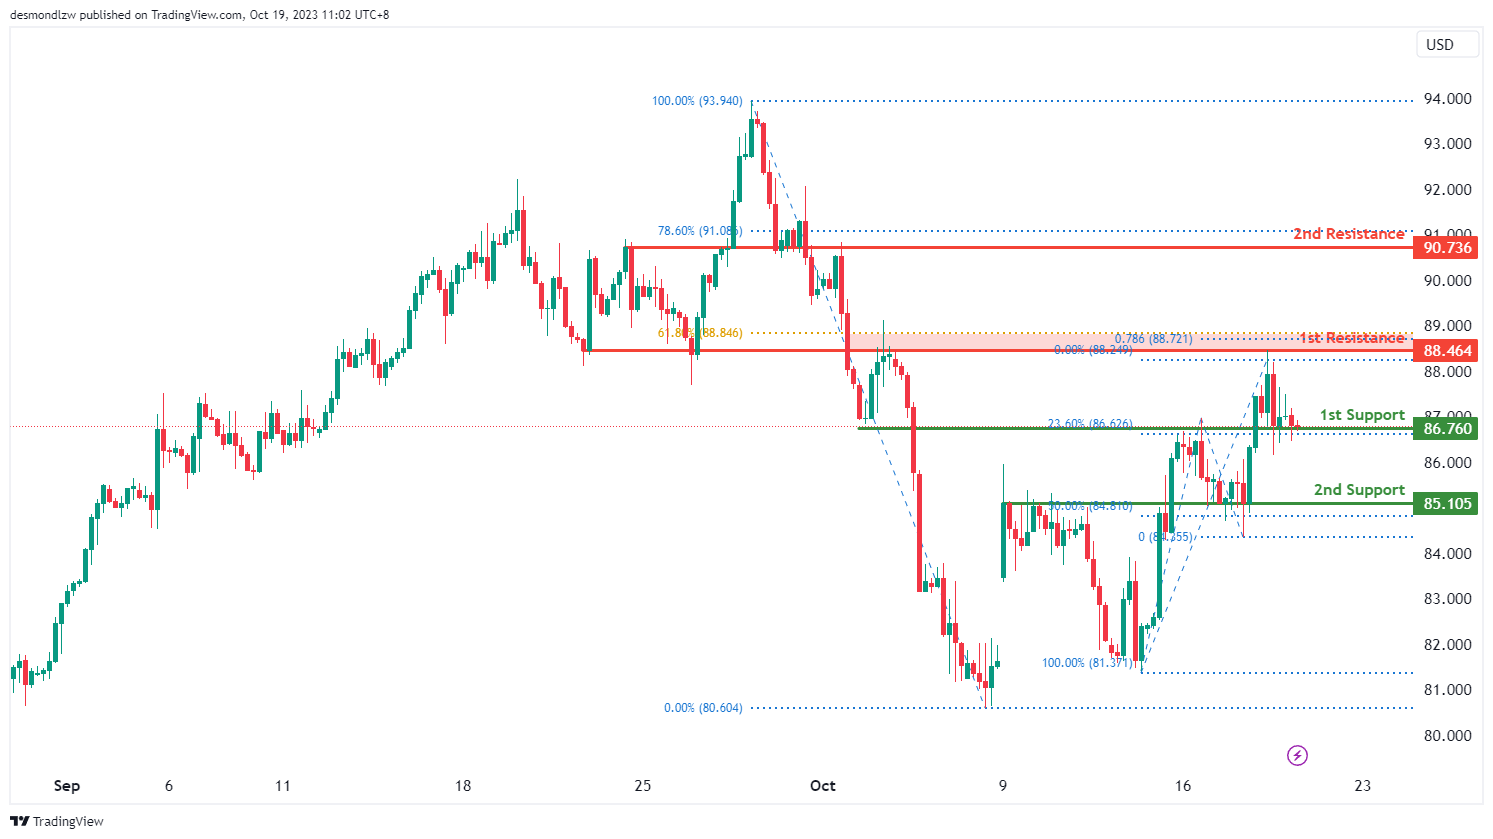
The WTI chart currently shows a weak bullish momentum, indicating a potential scenario for price to make a bullish bounce off the 1st support level and make a bullish continuation towards the 1st resistance level.
The 1st support level at 86.76 is identified as an overlap support level that aligns with the 23.60% Fibonacci retracement level. Additionally, the 2nd support level at 85.11 is also noted as an overlap support that aligns with the 50.00% Fibonacci retracement level, indicating a potential support zone.
To the upside, the 1st resistance level at 88.46 is identified as an overlap resistance that aligns with a confluence of Fibonacci levels i.e. the 61.80% retracement and the 78.60% projection levels. Beyond this, the 2nd resistance level at 90.74 is also marked as an overlap resistance level that aligns close to the 78.60% Fibonacci retracement level.
XAU/USD (GOLD):
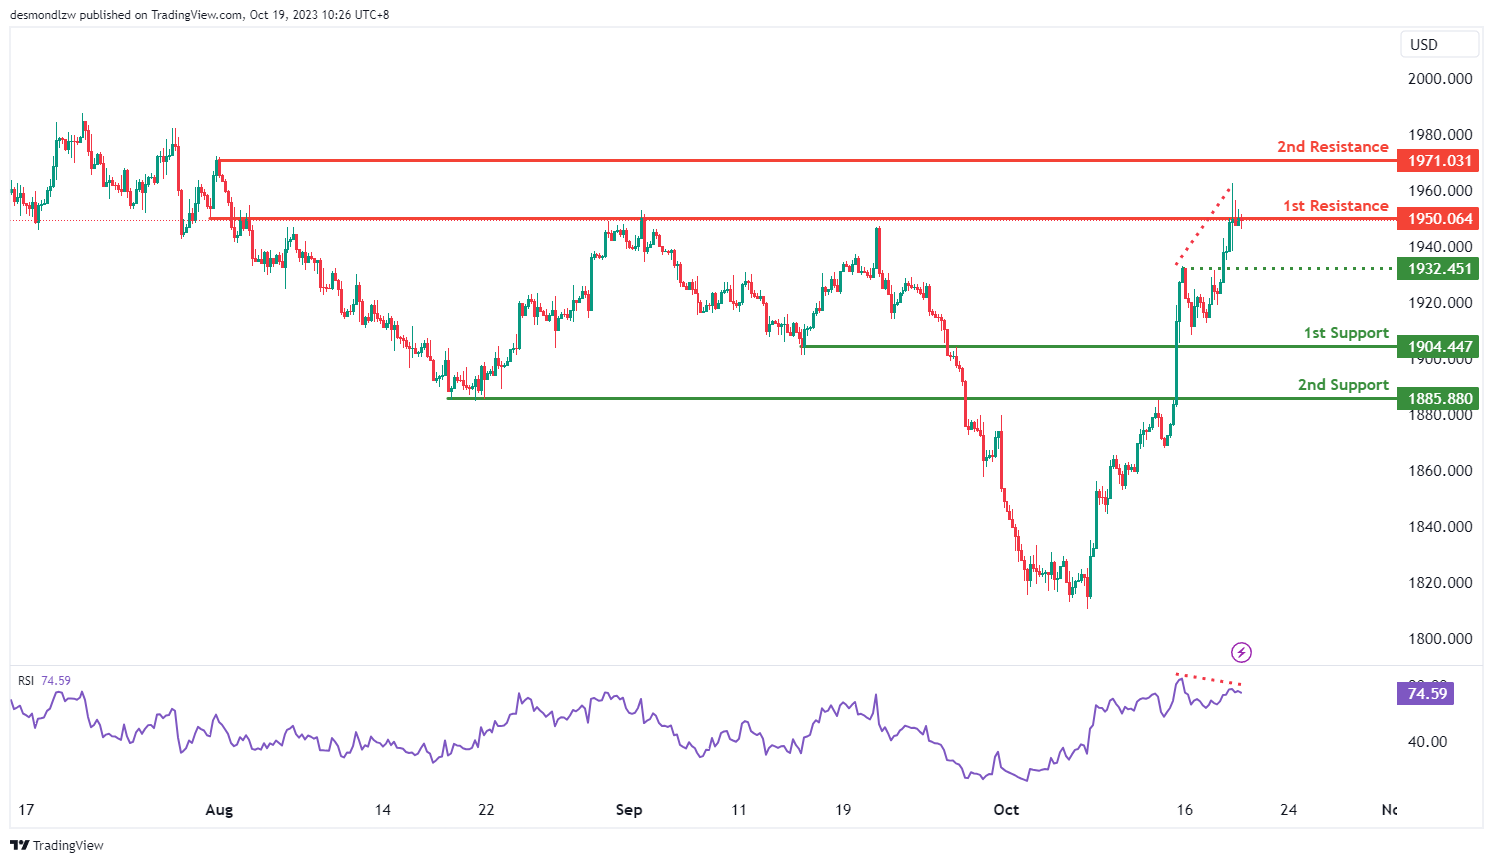
The XAU/USD chart currently exhibits a bearish momentum, with the potential scenario of a bearish reaction off the 1st resistance level and a drop towards the 1st support.
The 1st support at 1904.44 is considered significant as it aligns with a pullback support level. Additionally, the 2nd support at 1885.88 is identified as a pullback support.
On the resistance side, the 1st resistance at 1950.06 is characterized as an overlap resistance and coincides with the 161.80% Fibonacci Retracement level, providing a strong potential resistance point. Beyond this, the 2nd resistance at 1071.00 is identified as a swing high resistance.
It’s worth noting that the RSI is also displaying bearish divergence versus price, suggesting the possibility of a reversal occurring soon.
Ethereum (ETH) Faces Uphill Task, Can Bulls Push It Above $1,600?
Key Highlights
- Ethereum trimmed most gains and settled below $1,650.
- ETH price is struggling to climb above $1,600 and $1,635 on the 4-hour chart.
- Bitcoin price is reversing gains that occurred after fake news of spot ETF approval.
- Gold price extended its rally and climbed above the $1,950 resistance.
Ethereum Technical Analysis
Ethereum started a fresh decline below the $1,650 support. ETH price tested the $1,500 region and is currently attempting a fresh increase. However, it is facing many hurdles near $1,600.
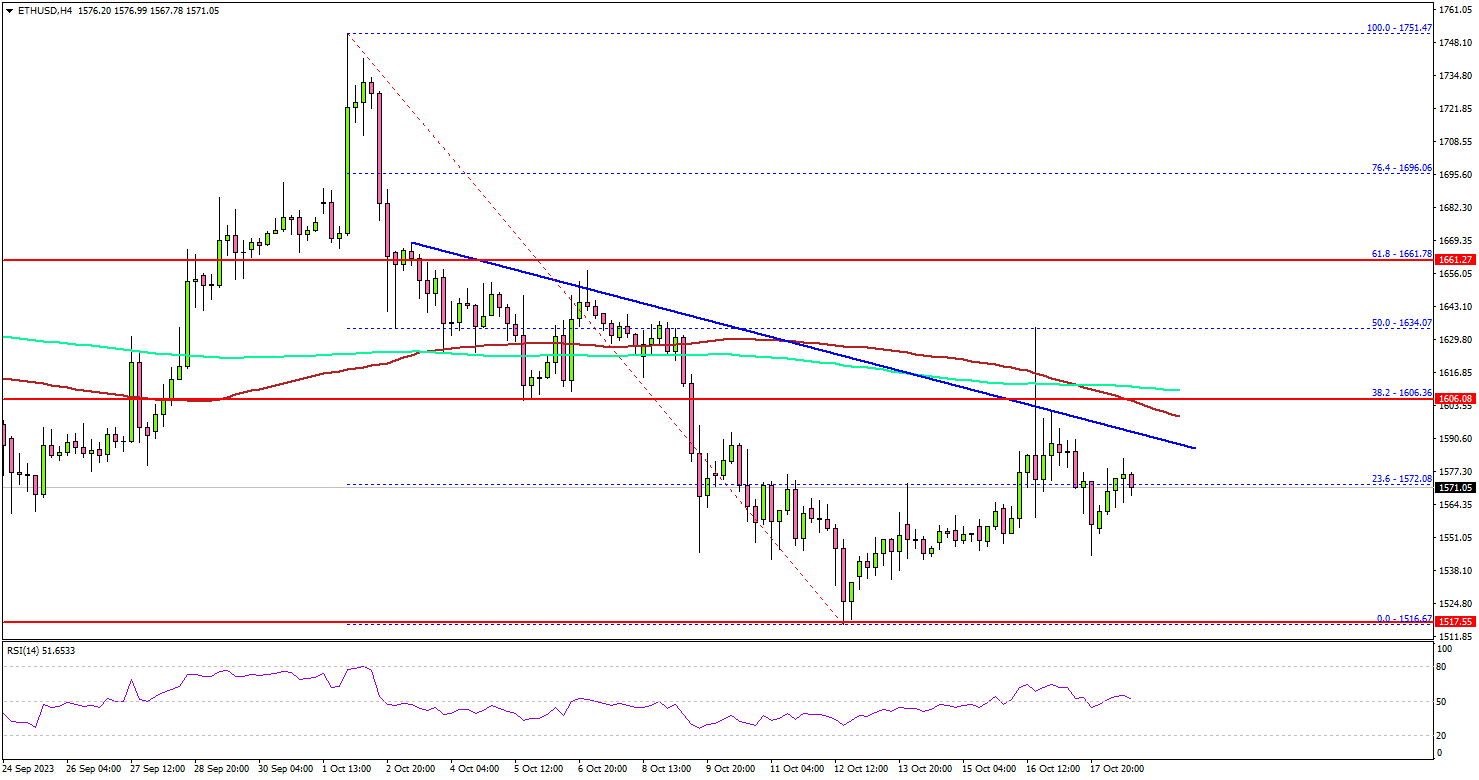
Looking at the 4-hour chart, the price recovered from $1,515. There was a move above the $1,550 resistance. The price even spiked toward $1,630 along with Bitcoin after fake news of spot ETF approval hit the market.
Ether trimmed all gains and failed to clear the 50% Fib retracement level downward move from the $1,751 swing high to the $1,516 low.
It is now trading below a key bearish trend line with resistance near $1,590. It seems like Ethereum bulls are facing many hurdles near $1,600 and the 100 simple moving average (red, 4 hours). The next major resistance is near $1,630.
A successful close above the $1,630 level might spark a decent increase. In the stated case, the price may perhaps rise toward the $1,660 level. The next stop for the bulls may perhaps be near the $1,750 level.
If not, the price might continue to decline toward the $1,530 level. The next major support is near $1,500, below which the price could slide toward $1,420.
Looking at gold prices, there was a strong increase above the $1,940 and $1,950 resistance levels amid the ongoing Israel-Hamas war.
Economic Releases
- US Initial Jobless Claims - Forecast 212K, versus 209K previous.
- Fed's Chair Powell speech.
Australia’s business confidence shows uptick, but inflationary concerns persist
Australian businesses are displaying signs of renewed optimism, as revealed by NAB Quarterly Business Confidence index for Q3. The index improved, moving up from -4 in the second quarter to -1 in the third. Moreover, the gauge for Current Business Conditions also indicated better sentiment, rising from 11 to 13.
However, an undercurrent of concern persisted regarding cost dynamics. Labour cost growth experienced an increase, shifting up to 1.8% from the 1.3% witnessed in Q2. On the other hand, purchase costs growth showed a modest climb, reaching 1.4% from the 1.3% seen in the previous quarter. In a positive sign, fewer businesses highlighted materials as a limiting factor, with the percentage dropping to 32% from the 36% reported in Q2.
NAB's Chief Economist Alan Oster noted, "Price growth remained elevated in Q3. This is in line with our expectation for a reasonably strong inflation print of 1.1% for the quarter when the full Q3 CPI is released next week."
However, he tempered the immediate inflationary concerns with a longer-term view, adding, "Still, we do expect inflation to moderate gradually as the economy slows."
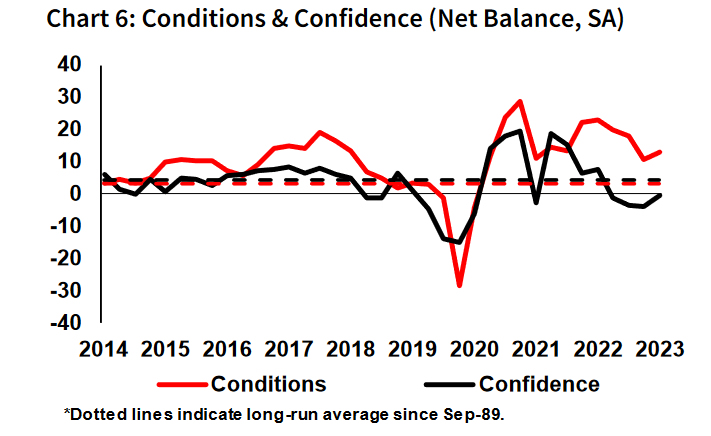
Full Australia NAB Quarterly Business Confidence release here.
Australia employment grows a mere 6.7%, unemployment rate ticks down
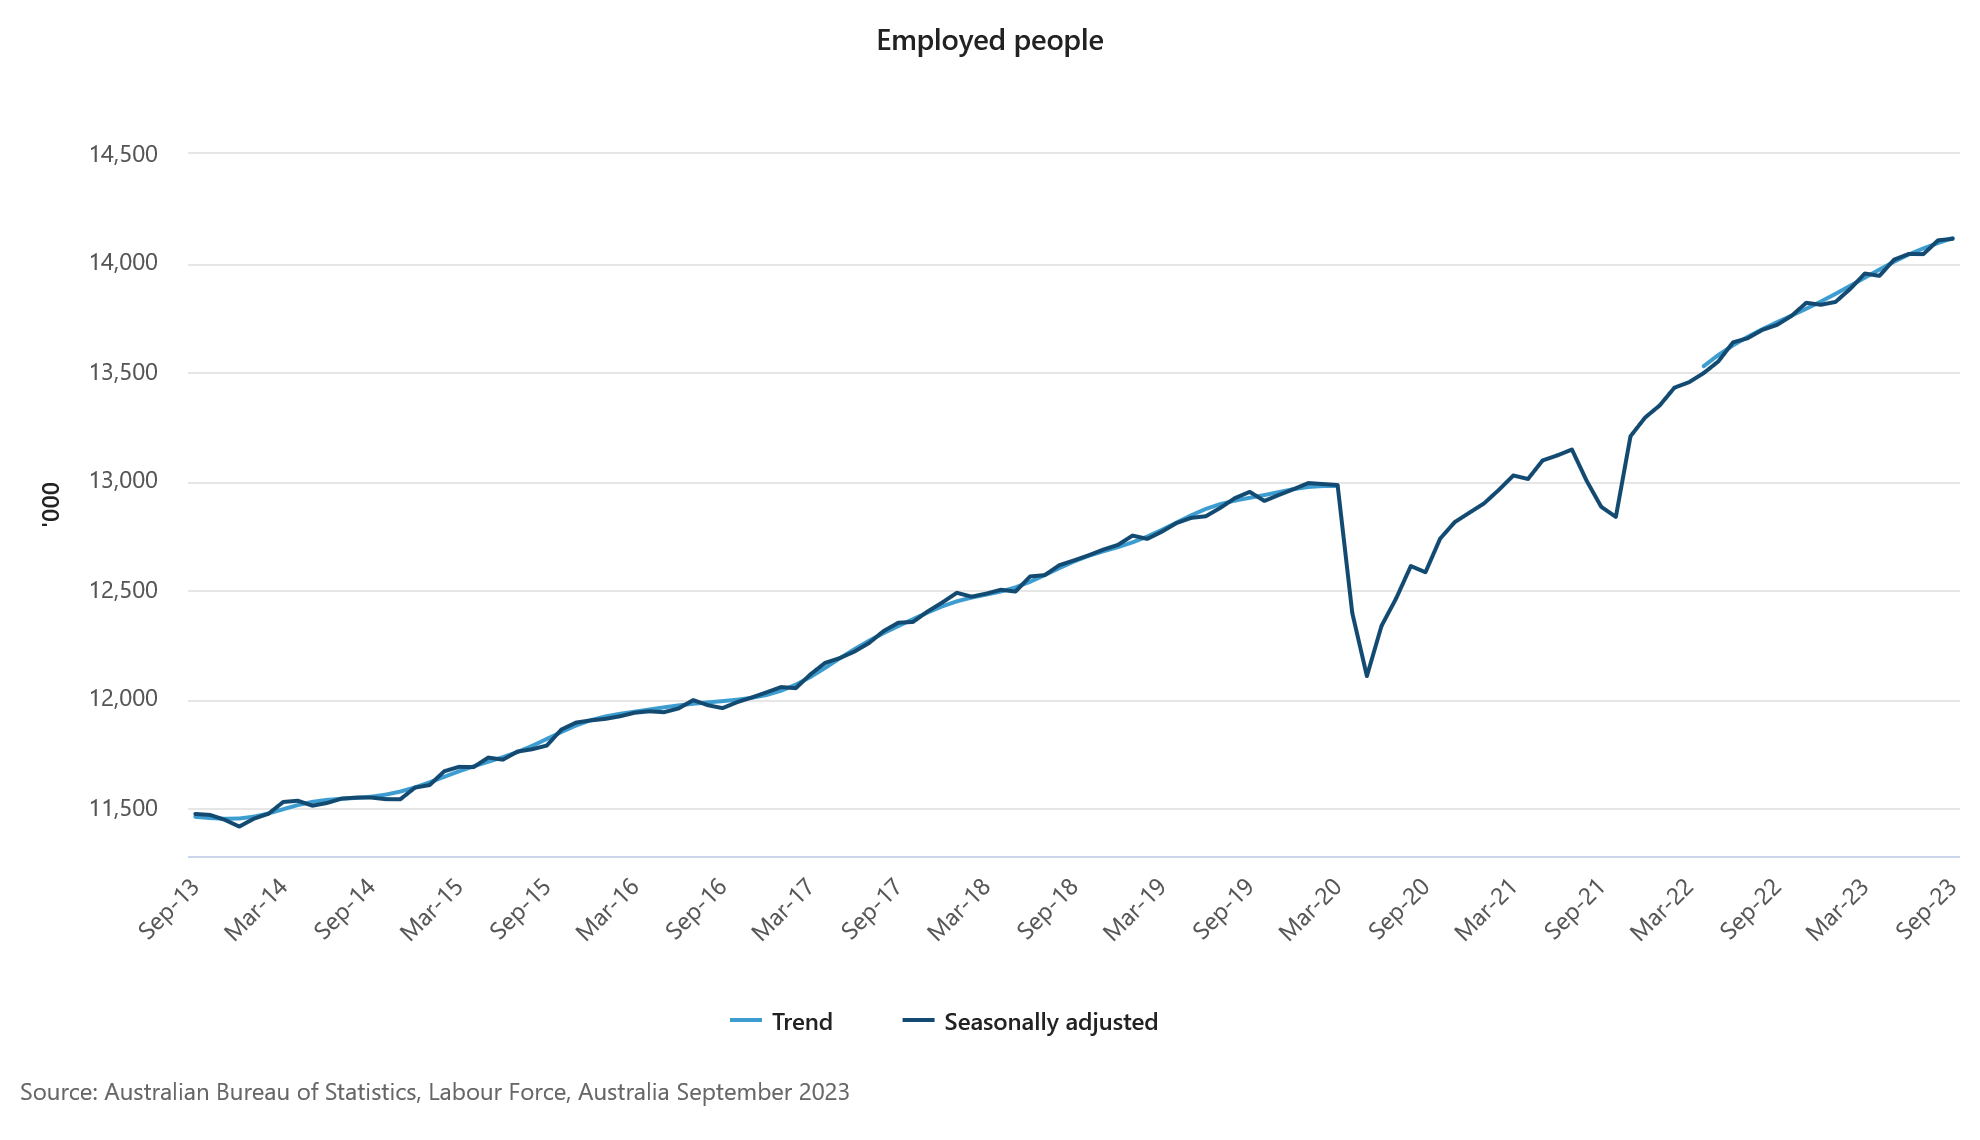
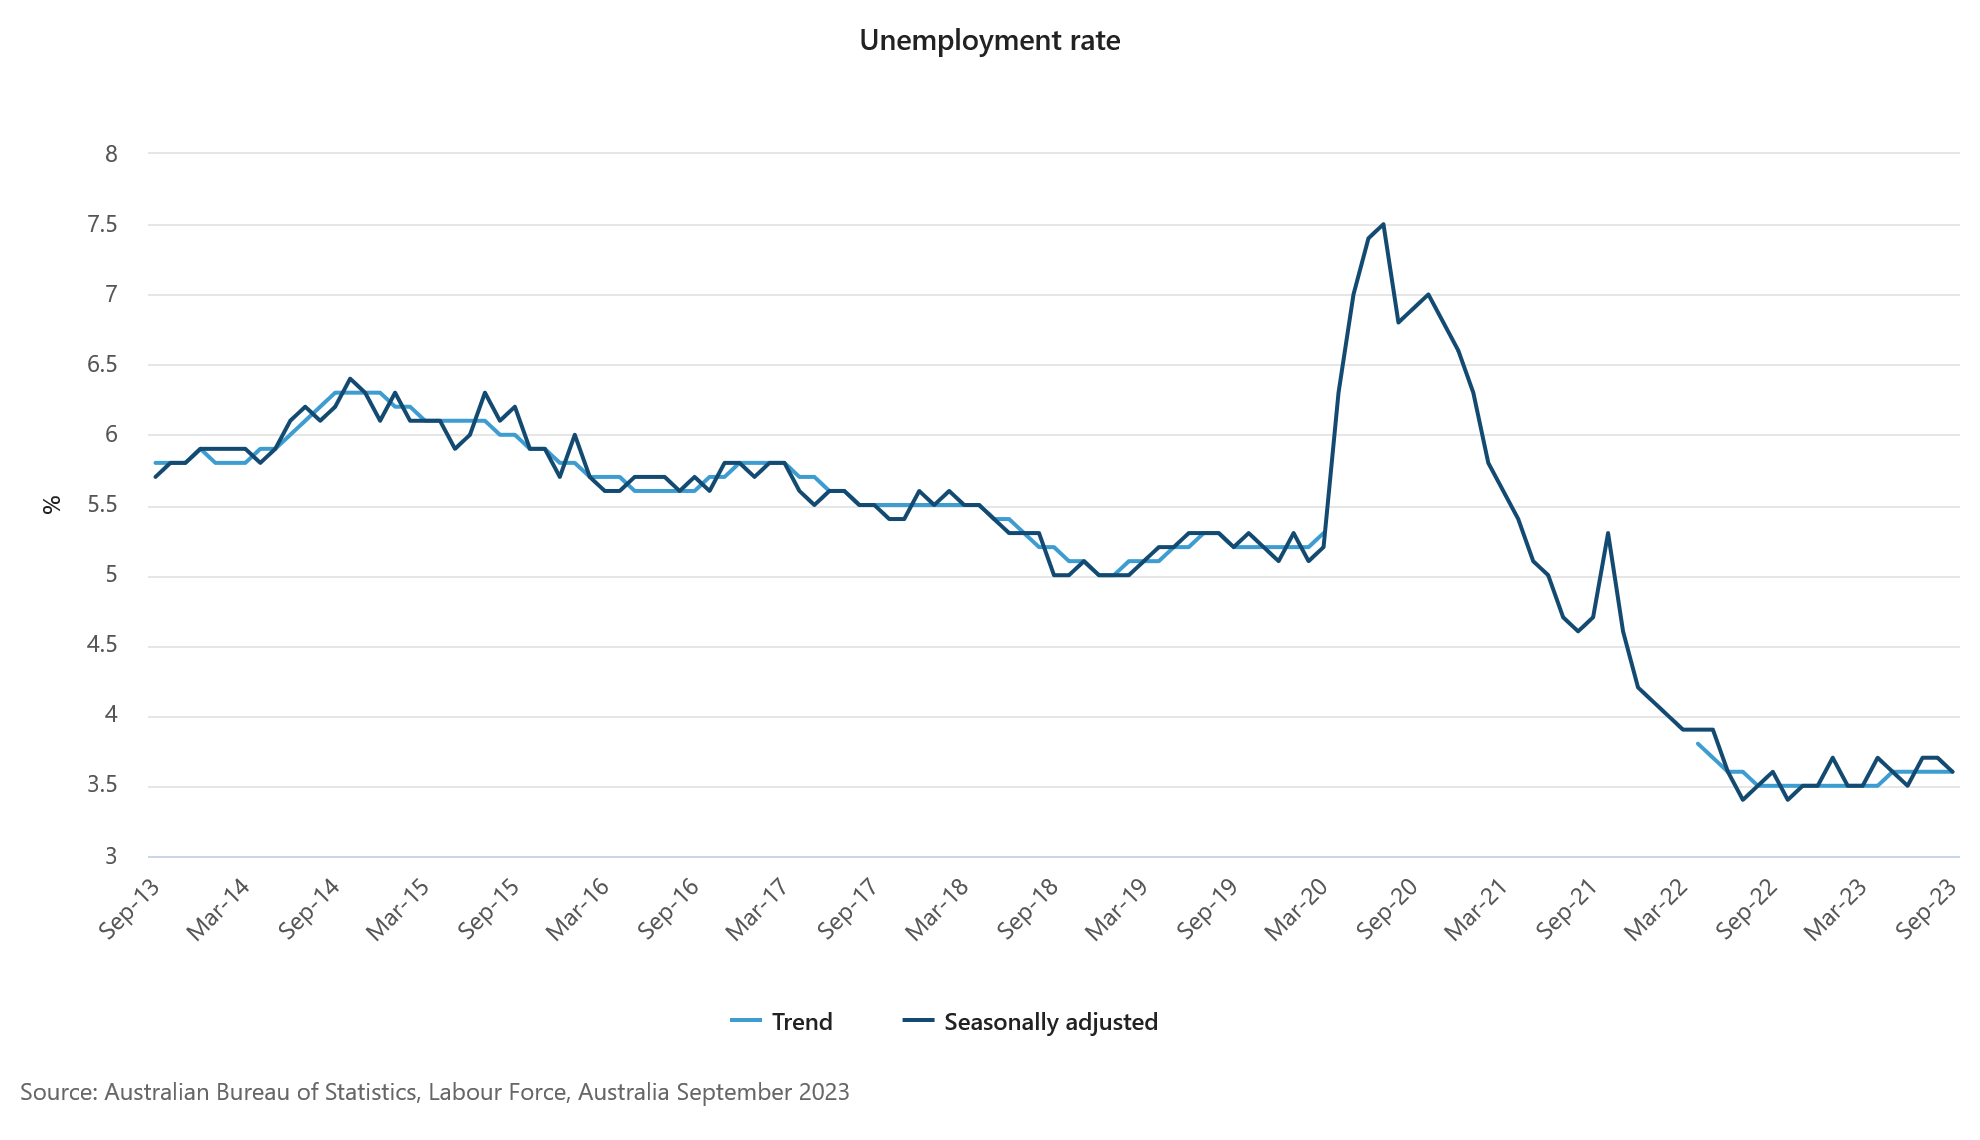
Australia's job market portrayed a mixed picture in September, with a significant undershoot in employment growth countered by a lower-than-expected unemployment rate.
The country added a mere 6.7k jobs in the month, a far cry from the anticipated 20.3k. Delving deeper into the data, full-time employment took a hit, shrinking by -39.9k. However, this was partly offset by increase in part-time roles, which swelled by 46.5k.
Unemployment rate showed slight improvement, ticking down to 3.6% from previous 3.7%, despite expectations that it would remain steady. Yet, this decline could be attributed to a drop in participation rate, which receded from 67.0% to 66.7%. Meanwhile, total monthly hours worked contracted by -0.4% mom, equivalent to a reduction of 8 million hours.
Kate Lamb, ABS's head of labour statistics, highlighted that, when considering the last two months, the average monthly employment growth stood at 35k, in line with the yearly average growth. However, Lamb also drew attention to the declining unemployment rate in September, indicating it primarily resulted from a shift of people from the unemployed category to being outside the labor force altogether.
Furthermore, she noted, "The recent softening in hours worked, relative to employment growth, may suggest an easing in labour market strength."
Japan’s export rose 4.3% yoy in Sep amid US and European demand
Japan saw a welcomed increase in exports in September, breaking a two-month declining trend and outpacing forecasts. Exports rose by 4.3% yoy to JPY 9198B, surpassing the anticipated growth of 3.1% yoy.
A closer examination of the trade partners reveals a contrasting scenario. Exports to China, Japan's prominent trading partner, dipped by -6.2% yoy, marking the tenth consecutive month of decline. A staggering -58% yoy drop in food shipments contributed significantly to this contraction. Conversely, trade ties with US and Europe exhibited robustness, with exports expanding by 13.0% yoy and 12.9% yoy respectively.
On the import front, Japan reported a decline of -16.3% yoy to JPY 9136B, a steeper fall than the anticipated -12.9% yoy. Trade dynamics shifted, with Japan posting a trade surplus of JPY 62.4B.
When assessed in seasonally adjusted terms, exports went up by 7.2% mom to JPY 8910B, while imports climbed by 5.4% mom, reaching JPY 9345B. Consequently, trade deficit was reduced to JPY -434B.
Final Countdown to Swiss 2023 General Election
- Far right could regain lost votes
- EU-Swiss talks to resume after election
- Election impact on Swiss franc could be limited
Switzerland rarely makes headlines but the Federal election, which is scheduled to take place on Sunday October 22 might be worthy to have a look even though the impact on the Swiss Franc could be negligible.
The Swiss Federal Council
The Federal Council, a seven-member government board, assigns two seats to the three largest parties and one seat to the fourth largest party. Interestingly, the Federal council presidency rotates annually, subject to election by the Federal Assembly. Hence, the president is leading but has no more power than the other six governing members or, in other words, he is not the head of the state.
Election polls
Recent polling suggests the popular far-right Swiss People’s Party will remain at the top with 28% of votes, preserving its two seats. The pro-European Social Democratic Party will probably remain the second largest party with 18% of votes. The centrist FDP Liberals could compete for third place with the Center party, leaving the environmentalist Green Party, which faced a surprising surge during the 2019 election, probably outside the Federal council.
Why the Swiss franc may not react
If forecasts are correct, the far-right Swiss People’s party will probably regain lost support from 2019 due to rising immigration concerns and the increasing health insurance costs. But overall, the results are not expected to lead to a sharp shift to the right as polls in Germany, France and Italy are showing, especially if the Greens give their seat to a centrist party. In this case, the election will be considered as a corrective vote.
As regards the reaction in the markets, the election results may not shake the safe-haven Swiss franc, unless there is a surprise huge deviation from the polls and an aggressive shift to the right, which could complicate relations with Brussels.
EU-Swiss political tensions
In 2021, Switzerland walked out of a seven-year-round of talks with the EU over closer trading relations, which would replace the existing 100 bilateral treaties with a new framework despite being offered better terms than the post-Brexit deal the UK was offered. A solution has yet to be found, and the process has been further delayed because of elections.
The final ballot (new Federal Assembly) will be determined in a vote on December 13th, when all 246 deputies will be elected. But with European parliamentary elections looming in June 2024, this leaves the two sides with just a couple of months to find common ground before talks start all over again.
It's worthy to note that Switzerland depends heavily on bilateral agreements with the EU, while its universities desire access to the EU’s Horizon funding programs. In addition, if energy supply problems worsen in Europe and become broader, negatively affecting Switzerland, the Swiss government could be less willing to go against the EU and start new disputes with the block.
EUR/CHF
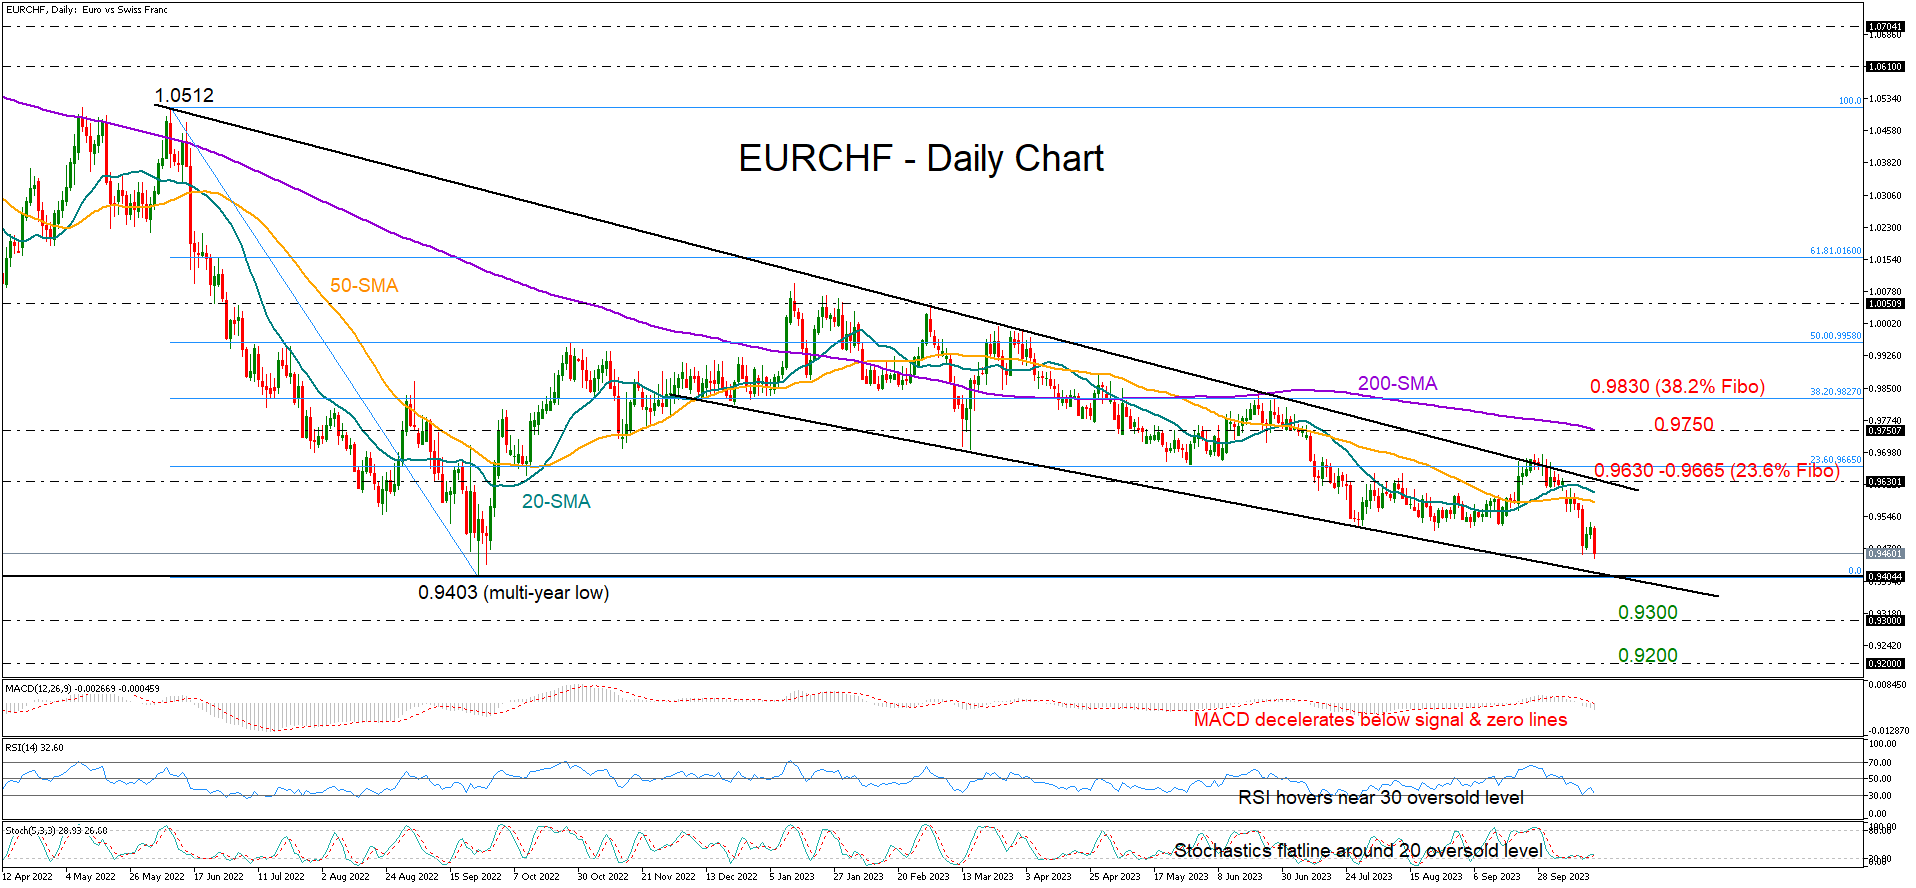
In FX markets, EURCHF has been set on a bearish course since the start of the year, erasing the rebound from the multi-year low of 0.9400 registered in September 2022. Technically, the price is trading within the oversold zone, making an upside correction likely in the short-term. Still, if the bears strengthen the downtrend below the 2022 bottom of 0.9400, the 0.9300 and 0.9200 psychological levels could next come on the radar.
Otherwise, the pair will have to crawl back above the resistance trendline from June 2022 at 0.9630 and then extend sustainably higher than the 200-day SMA at 0.9750 to signal a positive trend reversal.
AUDNZD Wave Analysis
- AUDNZD reversed from support level 20.70
- Likely to rise to resistance level 23.50
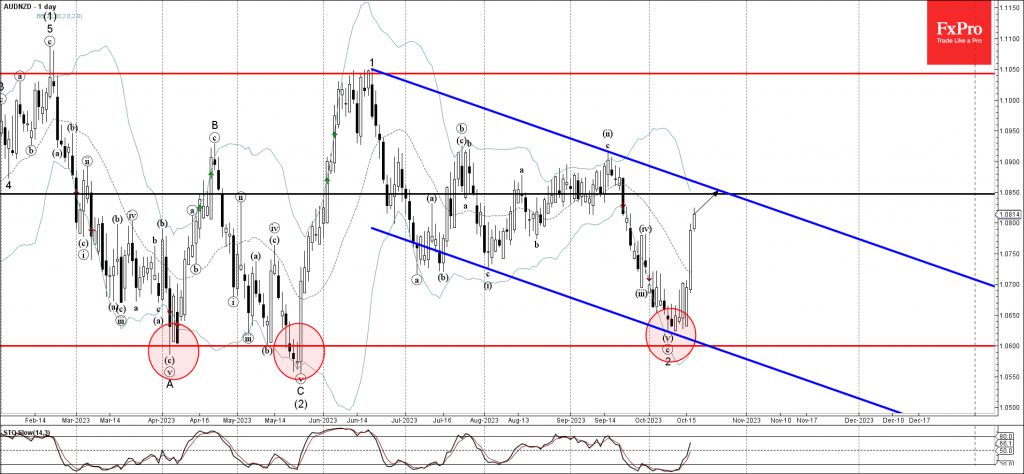
AUDNZD recently reversed up sharply from the powerful support level 1.0600 (which has been reversing the pair from April) intersecting with the lower daily Bollinger Band and the support trendline of the weekly down channel from June.
The upward reversal from the support level 1.0600 stopped the previous intermediate ABC correction (2).
Given the strength of the active impulse wave 3, AUDNZD can be expected to rise further toward the next resistance level 1.0850.
NZDCHF Wave Analysis
- NZDCHF falling inside weekly impulse 3
- Likely to fall to support level 0.5200
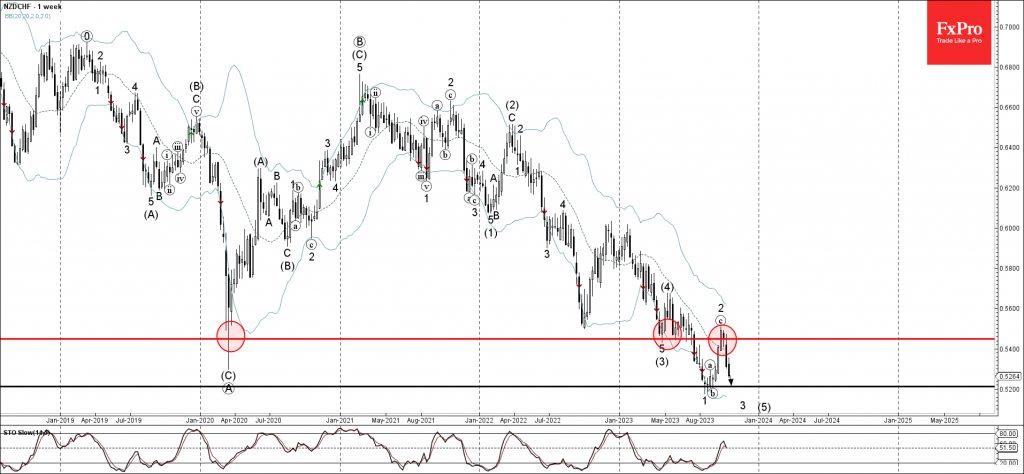
NZDCHF continues to fall inside the sharp weekly downward impulse 3, which started earlier from the key resistance level 0.5450 (former strong support from the middle of this year).
The downward reversal from the resistance level 0.5450 continues the strong multi-year downtrend inside which the pair has been moving from the start of 2022.
Given the widespread CHF gains and NZD outflows, NZDCHF can be expected to fall further toward the next support level 0.5200 (low of the previous impulse wave 1).
USD/JPY: Dollar Holds Gains Post 20-Year Auction and Beige Book
- Two-year Treasury rises 0.7bps to 5.216%, 10-year higher by 7.2bps to 4.906%, and the 30-year gains 7.0bps to 4.995%
- Beige book sees US outlook as stable or slightly weaker
- Treasury market unraveled by growth in supply; today’s auction saw surprisingly better demand
The dollar is holding onto most of its gains as the surge in Treasury yields stalls after a historic bond market slide. A 20-year bond auction saw strong demand, bucking the tepid demand we saw last week. This auction was awarded at 5.245%, which is 65 bps more than what happened in September. Investors are still buying bonds, but geopolitical risks and US deficit concerns, along with a potential government shutdown could keep yields rising.
Beige Book:
The Beige book showed business are struggling to pass on costs to the consumer. Economic weakness is happening, but that will only be more noticeable if we see a stronger cooling of the labor market.
Jobs
Overall, employment continued to increase modestly, though employment declined among retailers. Although layoffs were generally not occurring in the region, an upstate New York employment agency pointed to a slight softening in conditions in recent weeks.
Prices
Inflationary pressures moderated slightly in recent weeks. Service sector contacts reported some slowing in the pace of input price increases, while manufacturers indicated the pace of input price increases was little changed. The pace of selling price increases slowed somewhat among both manufacturing and service firms. Fewer businesses expect rising prices in the months ahead. Still, inflation remains a significant concern, and contacts noted that higher prices are taking a toll on household balance sheets and limiting discretionary income.
Consumer
Consumer spending increased at a slightly slower pace in the latest reporting period with some shifts in the composition of purchases. Spending on apparel, interior furnishings, home electronics, and appliances grew at a steady clip after a period of stagnation
USD/JPY Daily Chart
The dollar appears well positioned for short-term strength as growth prospects for Q4 remain robust. USD/JPY appears poised to test the waters above the 150 level.