

Sample Category Title
USD/CAD Daily Outlook
Daily Pivots: (S1) 1.3292; (P) 1.3323; (R1) 1.3381; More....
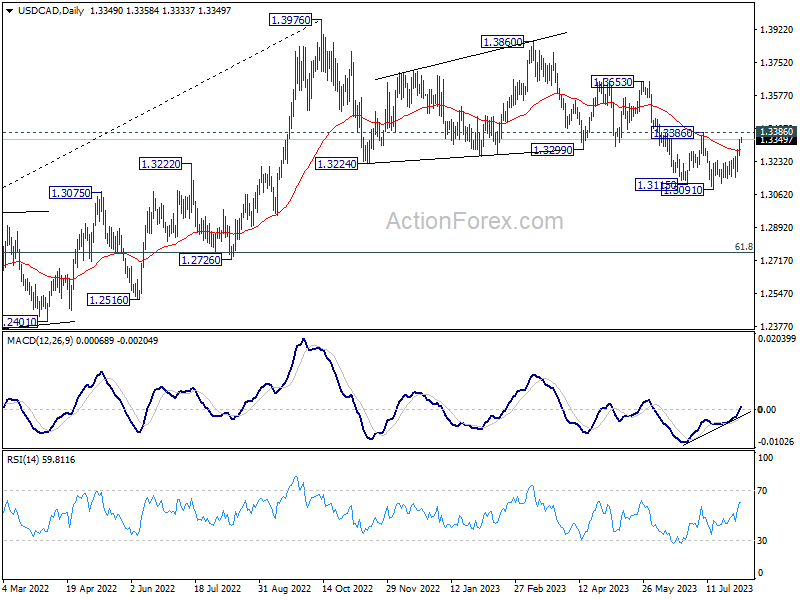
Intraday bias in USD/CAD stays neutral first as range trading continues. As long as 1.3386 resistance holds, further decline is mildly in favor. Below 1.3242 minor support should resume larger decline through 1.3091 low. Nevertheless, on the upside, firm break of 1.3386 will indicate near term reversal and turn outlook bullish.
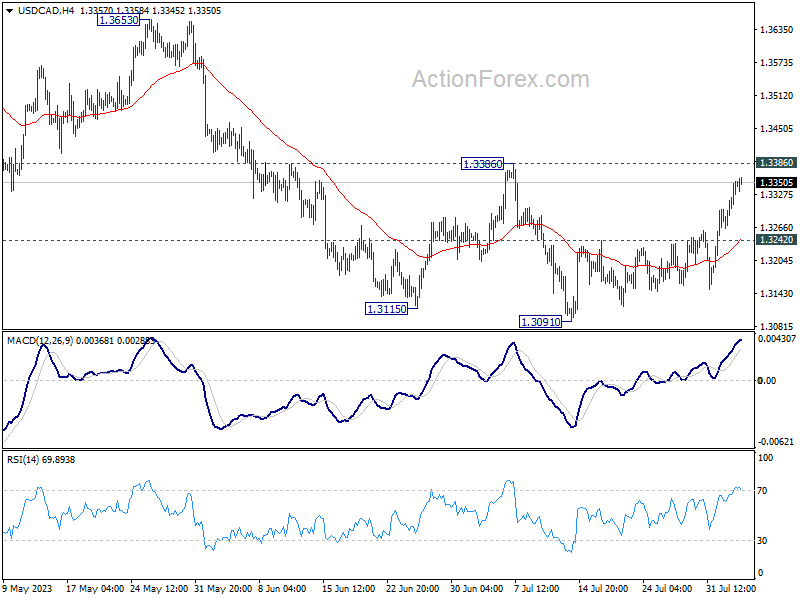
In the bigger picture, price actions from 1.3976 are viewed as a correction to up trend from 1.2005 (2021 low) only. But even so, deeper decline is expected as long as 1.3386 resistance holds. Further fall could be seen to 61.8% retracement of 1.2005 to 1.3976 at 1.2758. Meanwhile, break of 1.3386 will be a sign that the correction has completed and bring stronger rally back to retest 1.3976.
AUD/USD Daily Report
Daily Pivots: (S1) 0.6500; (P) 0.6565; (R1) 0.6603; More...
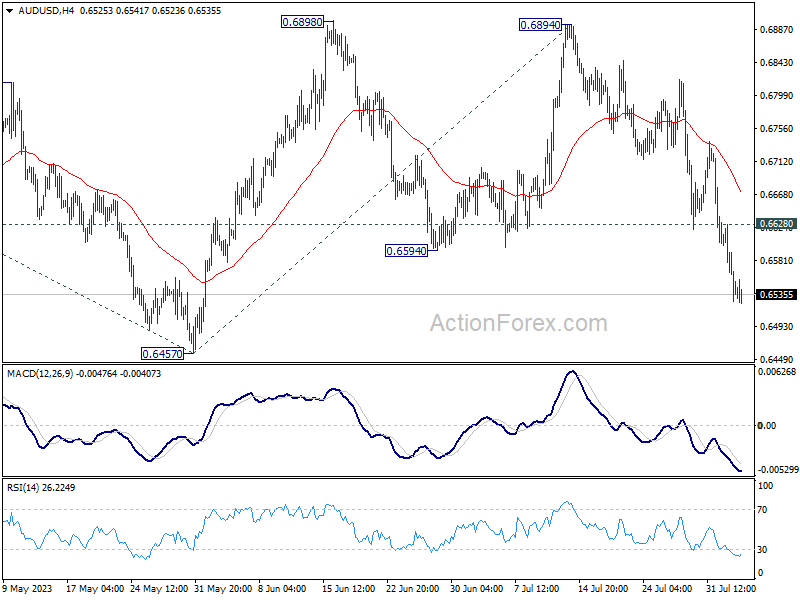
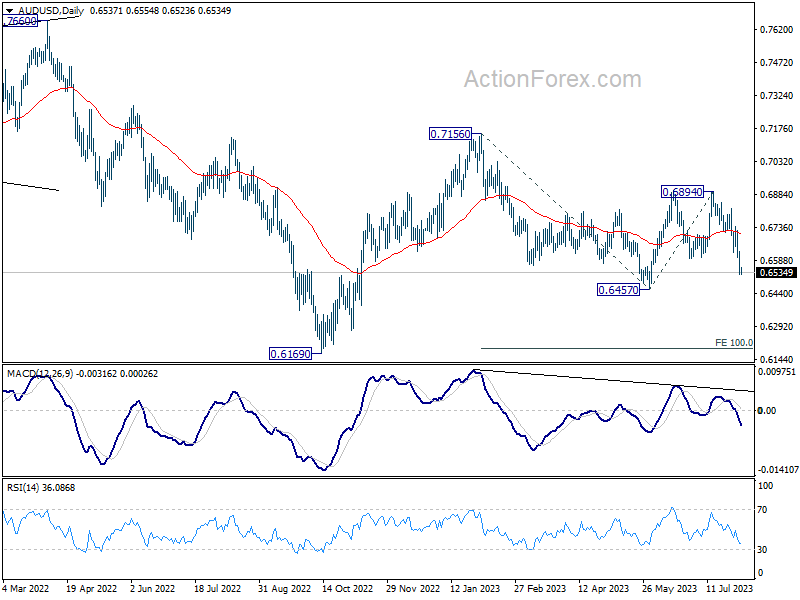
Intraday bias in AUD/USD remains on the downside for the moment. Rebound from 0.6457 could have completed at 0.6894 already. Deeper fall would be seen to retest 0.6457 first. Break there will resume the fall from 0.7156 to 100% projection of 0.7156 to 0.6457 from 0.6894 at 0.6195. On the upside, above 0.6628 minor resistance will turn intraday bias neutral first.
In the bigger picture, outlook is mixed for now as AUD/USD failed to sustain above both 55 D EMA (now at 0.6701) and 55 W EMA (now at 0.6784). On the upside, break of 0.65898 resistance will solidify the case that down trend from 0.8006 (2021 high) has already completed, and target 0.7156 resistance for confirmation. However, break of 0.6457 will likely resume the down trend through 0.6169 (2022 low).
USD/JPY Daily Outlook
Daily Pivots: (S1) 142.56; (P) 143.01; (R1) 143.79; More...
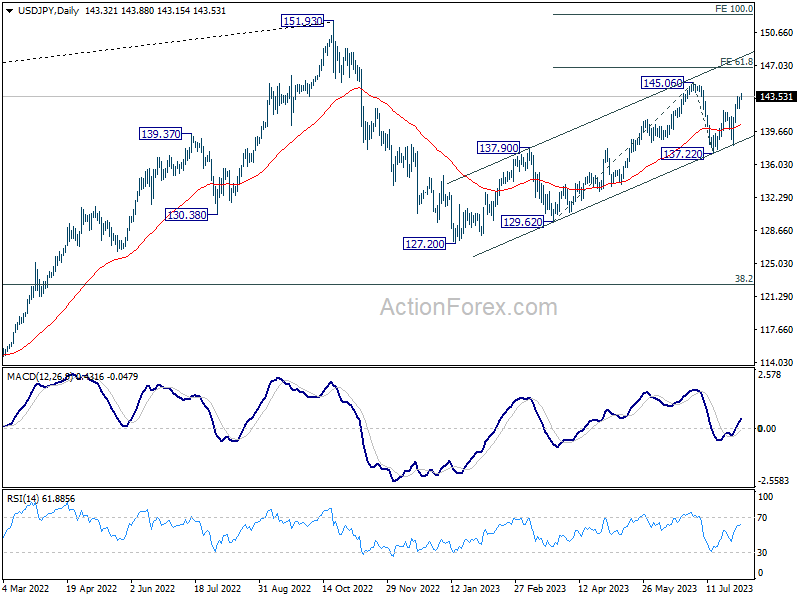
Intraday bias in USD/JPY remains on the upside as rise from 137.22 is in progress. Further rally should be seen to retest 145.60 resistance first. Decisive break there will resume whole rally from 172.20. Next target is 61.8% projection of 129.62 to 145.06 from 137.22 at 146.76. On the downside, below 141.99 minor support will mix up the outlook and turn intraday bias neutral first.
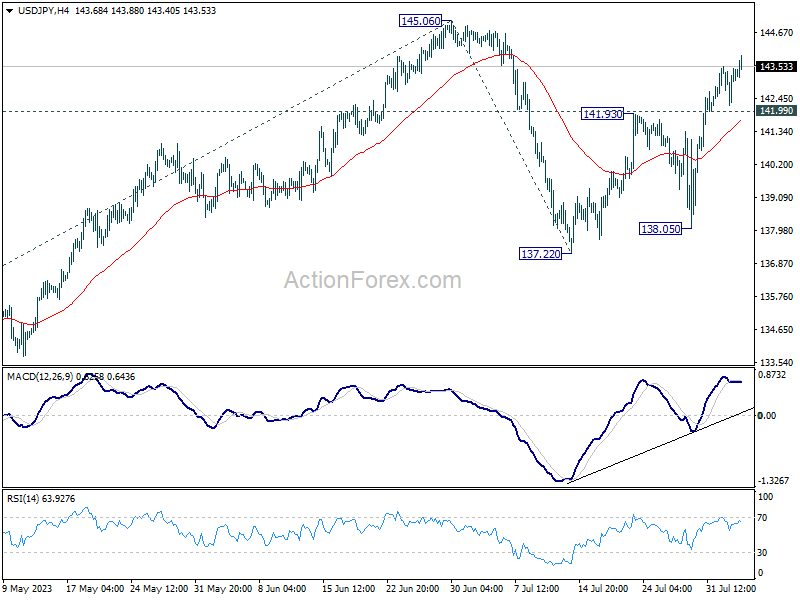
In the bigger picture, overall price actions from 151.93 (2022 high) are views as a corrective pattern. Rise from 127.20 is seen as the second leg of the pattern and could still be in progress. But even in case of extended rise, strong resistance should be seen from 151.93 to limit upside. Meanwhile, break of 137.22 support should confirm the start of the third leg to 127.20 (2023 low) and below.
USD/CHF Daily Outlook
Daily Pivots: (S1) 0.8727; (P) 0.8766; (R1) 0.8814; More....
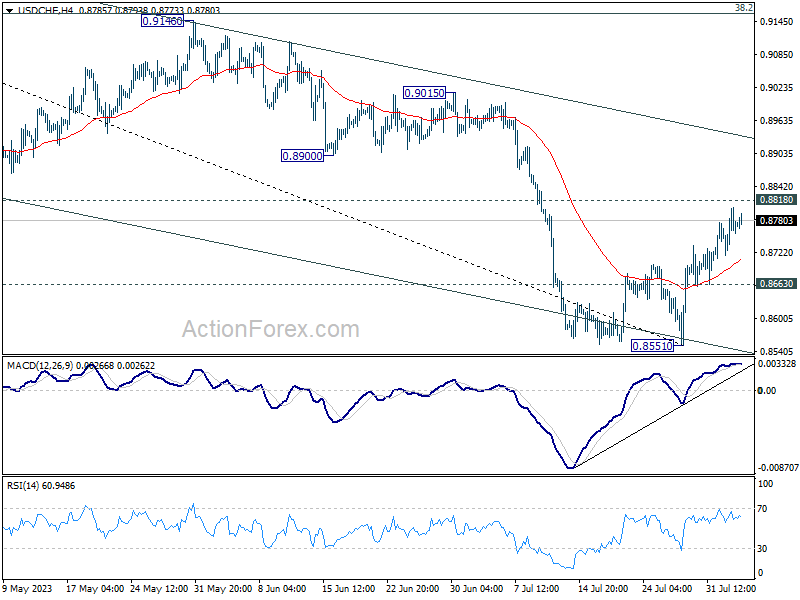
Intraday bias in USD/CHF stays on the upside as rise from 0.8551 is in progress. Rejection by 0.8818 support turned resistance will maintain near term bearishness. Further break of 0.8863 minor support will turn bias back to the downside for retesting 0.8551. Nevertheless, decisive break of 0.8818 will carry larger bullish implication, and target 0.9146 cluster resistance
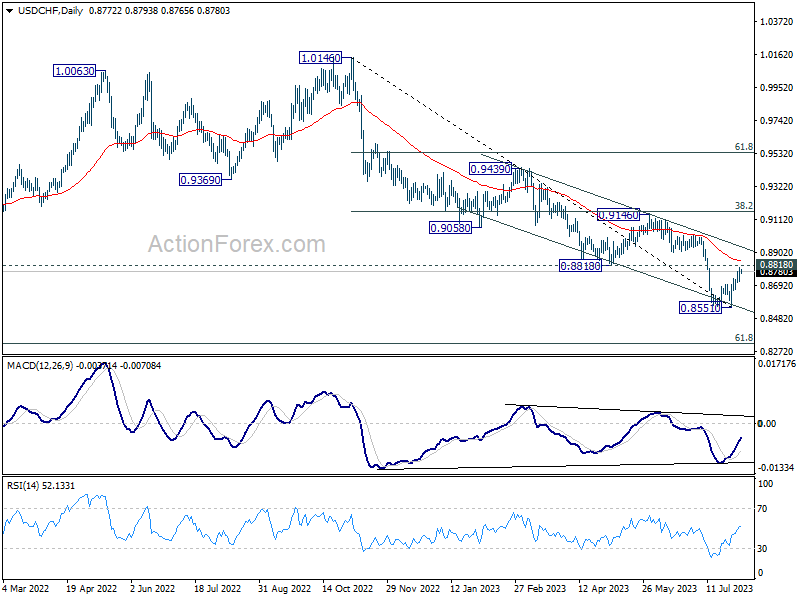
In the bigger picture, down trend from 1.0146 is seen as in progress as long as 0.8188 support turned resistance holds. Next target is 61.8% retracement of 0.7065 (2011 low) to 1.0342 (2016 high) at 0.8317. However, sustained break of 0.8818 should indicate medium term bottoming, and bring stronger rise back to 0.9146 cluster resistance (38.2% retracement of 1.0146 to 0.8551 at 0.9160), even as a correction.
GBP/USD Daily Outlook
Daily Pivots: (S1) 1.2659; (P) 1.2732; (R1) 1.2784; More...
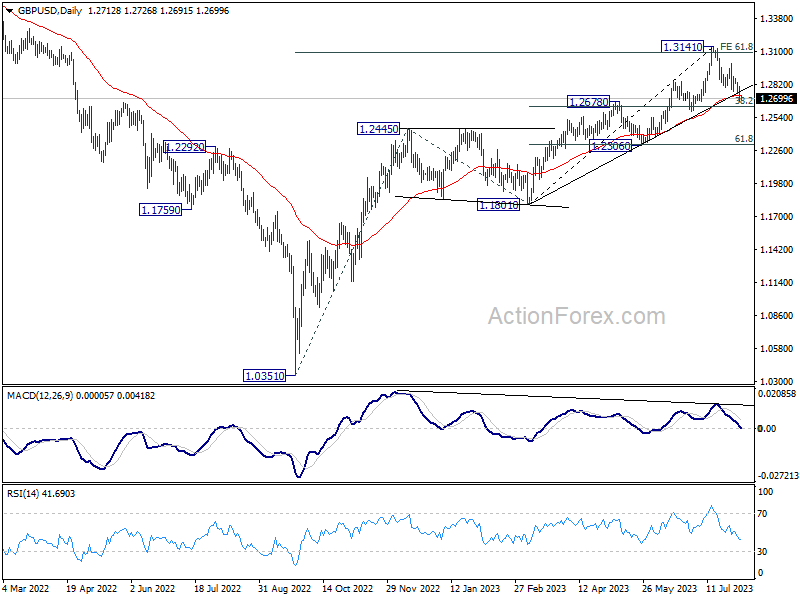
Intraday bias in GBP/USD stays on the downside as fall from 1.3141 is in progress. Deeper decline would be seen to 38.2% retracement of 1.1801 to 1.3141 at 1.2629, as a correction to rise from 1.1801. On the upside, above 1.2886 minor resistance will turn bias back to the upside for stronger rebound.
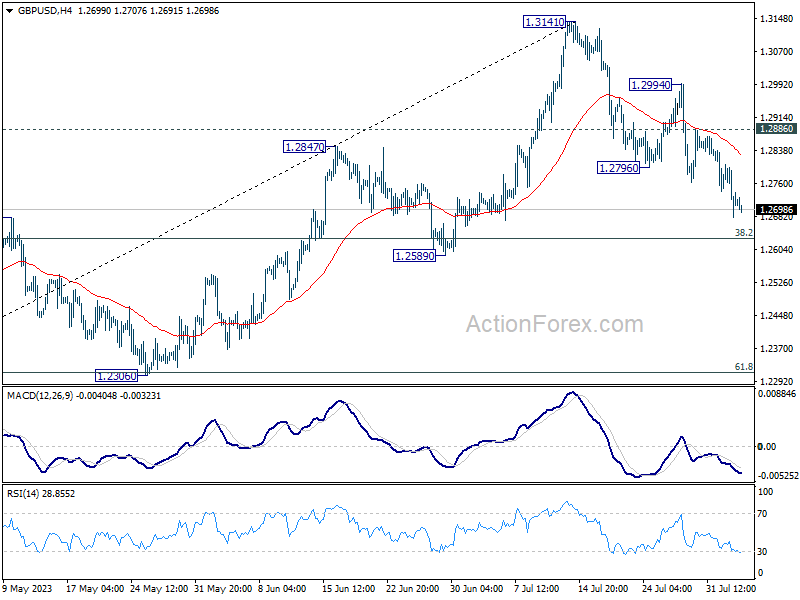
In the bigger picture, as long as 1.2678 resistance turned support holds, rise from 1.0351 (2022 low) is expected to continue through 1.3141 high at a later stage. However, sustained break of 1.2678 will argue that it's at least correcting this rally, with risk of bearish reversal. Deeper fall would be seen to 1.2306 support next.
GBP/USD Technical: Sell-off Almost Reached Key Support Ahead of BoE
- The recent weakness seen in the GBP is due to a broad-based strength in the US dollar as a short-term safe haven refuge triggered by global risk-off behaviour.
- The accumulated 462 pips decline seen in the GBP/USD since the 14 July high of 1.3142 has almost reached the key medium-term support of 1.2630.
- A clearance above 1.2740 on the GBP/USD may negate the current bearish tone.
The GBP/USD has shed an accumulated 462 pips in the past three weeks from its current 52-week high of 1.3142 reached on 14 July 2023. The losses seen so far this week have been accentuated by across-the-board US dollar strength triggered by a global risk-off behaviour yesterday, 2 August in the aftermath of Fitch’s US sovereign debt credit rating downgrade to AA+ from AAA.
Later today, the Bank of England (BoE) will announce its latest monetary policy decision and the consensus is calling for a 25 basis point hike to bring the policy interest rate to 5.25%, its highest level since the 2008 Great Financial Crisis.
Since the latest UK core inflation data for June has remained elevated at 6.9% year-on-year, the highest among G7, and nearly 3.5 times above BoE ‘s 2% target, most market participants think that BoE is not at or near their interest rate tightening cycle, in contrast with the US Federal Reserve and the European Central Bank.
The consensus is expecting a peak rate of 5.75% or 6% later in 2023 or early 2024 which implies another potential two to three hikes of 25 bps hike each by BoE after today’s meeting.
Hovering right above 1.2630 key medium-term support
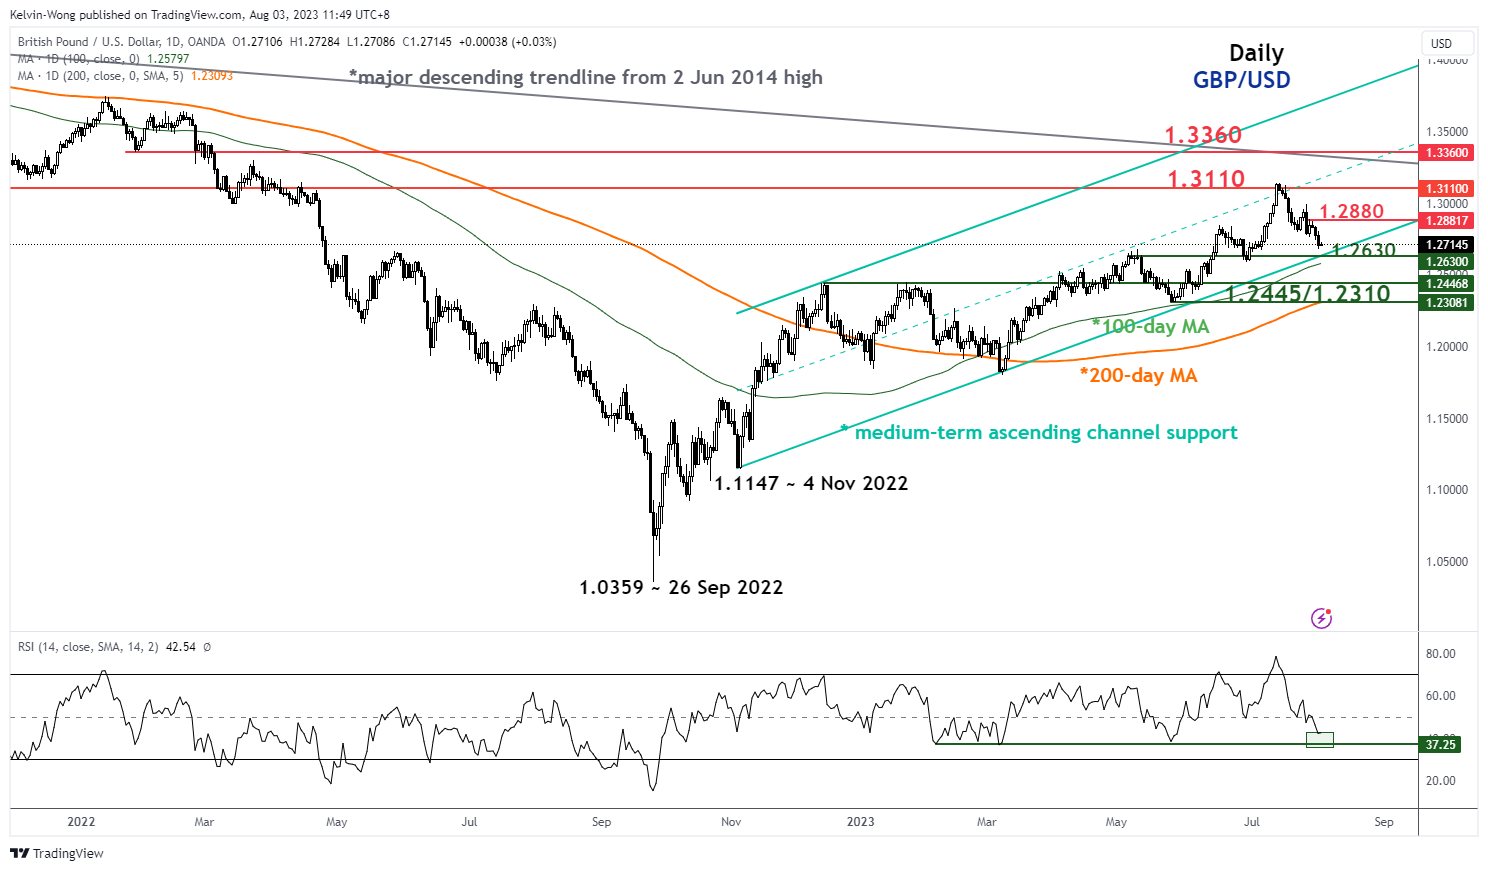
Fig 1: GBP/USD medium-term trend as of 3 Aug 2023 (Source: TradingView, click to enlarge chart)
Interestingly, yesterday’s intraday low of 1.2680 has almost reached a key medium-term support of 1.2630 which is being confluence by the lower limit of the medium-term ascending channel in place since 4 November 2022 low of 1.1147 and the upward sloping 100-day moving average.
Short-term downside momentum has reached an oversold condition
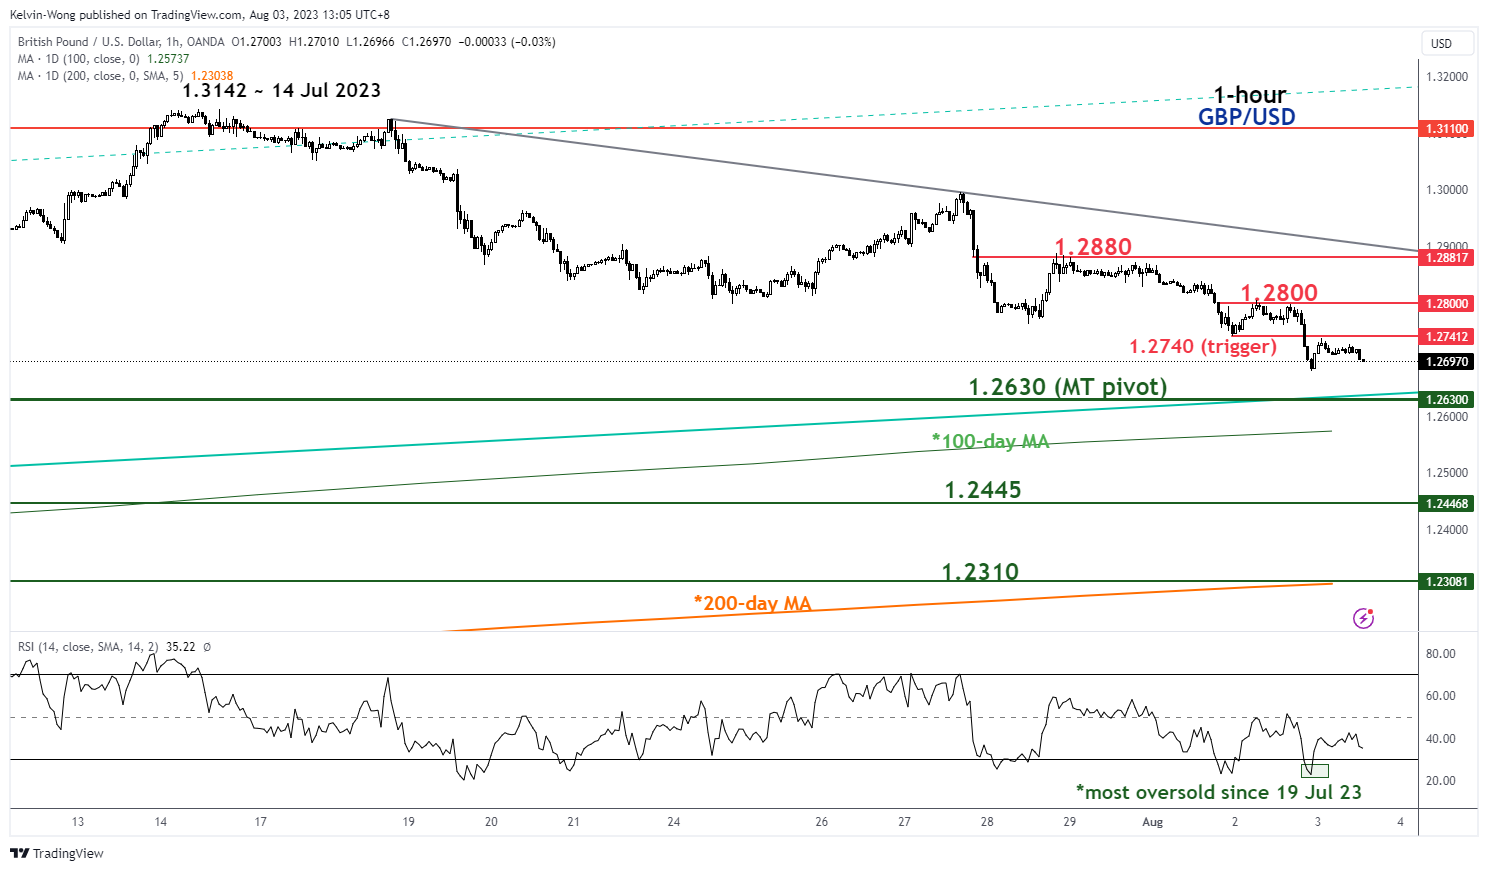
Fig 2: GBP/USD minor short-term trend as of 3 Aug 2023 (Source: TradingView, click to enlarge chart)
The hourly RSI oscillator reached an oversold level of 22.9 yesterday, 2 August, its lowest oversold condition since 19 July 2023. In addition, the daily RSI oscillator is also coming close to a parallel key support level of 37.
Watch the 1.2630 key medium-term pivotal support and a clearance above 1.2740 sees the next resistances coming in at 1.2800 and 1.2880.
On the other hand, a break below 1.2630 invalidates the minor rebound scenario to expose the next support at 1.2445 in the first step.
EUR/USD Daily Outlook
Daily Pivots: (S1) 1.0897; (P) 1.0959; (R1) 1.0999; More...
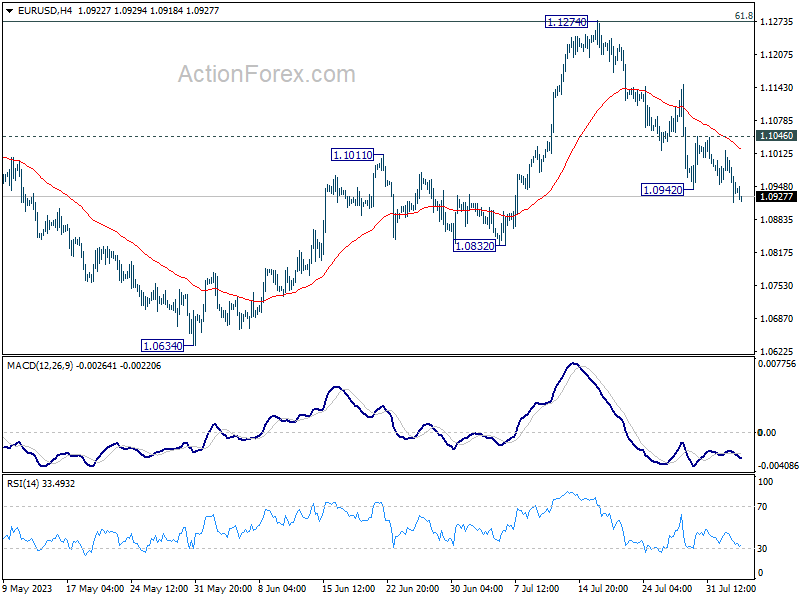
EUR/USD's decline from 1.1274 resumed by breaking through 1.0942 and intraday bias is back on the downside. Deeper fall would be seen to 1.0832 support. Sustained trading below there will target 1.0609/34 cluster support. On the upside, however, break of 1.1046 resistance will turn bias back to the upside for stronger rebound instead.
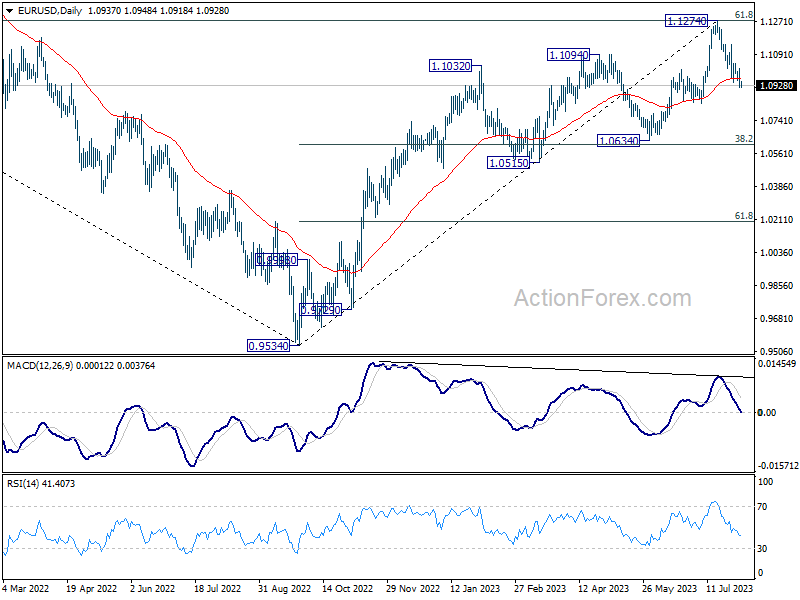
In the bigger picture, a medium term top could be formed at 1.1274, after failing to break through 61.8% retracement of 1.2348 (2021 high) to 0.9534 at 1.1273 decisively, on bearish divergence condition in D MACD. Sustained trading below 55 D EMA (now at 1.0963) will bring deeper correction to 1.0634 cluster support (38.2% retracement of 0.9534 to 1.1274 at 1.0609). Strong support could be seen there, at least on first attempt, to set the range for consolidation.
Dollar Rally Continues on Risk-Off Sentiment and Rising Yields; Markets Eye BoE Rate Decision
Dollar continues to strengthen today, bolstered by prevailing risk-off sentiment that has carried over from US to Asian markets. The surge in benchmark 10-year yields is providing additional support to the greenback, as even Euro has finally conceded a near-term support level against Dollar, further affirming the underlying momentum.
Meanwhile, the foreign exchange markets elsewhere are mixed inside yesterday's range. Sterling remains relatively indecisive as investors keenly await BoE rate decision. Elements of surprise, including the size of the interest rate hike, voting dynamics, and new economic projections, contribute to the uncertainty. Reactions in Sterling-European crosses will be pivotal, as these could dictate the momentum of the Pound elsewhere.
For this week so far, Dollar is outperforming, followed by Canadian, and then Euro. Conversely, Australian dollar is underperforming, trailed by Yen and New Zealand Dollar.
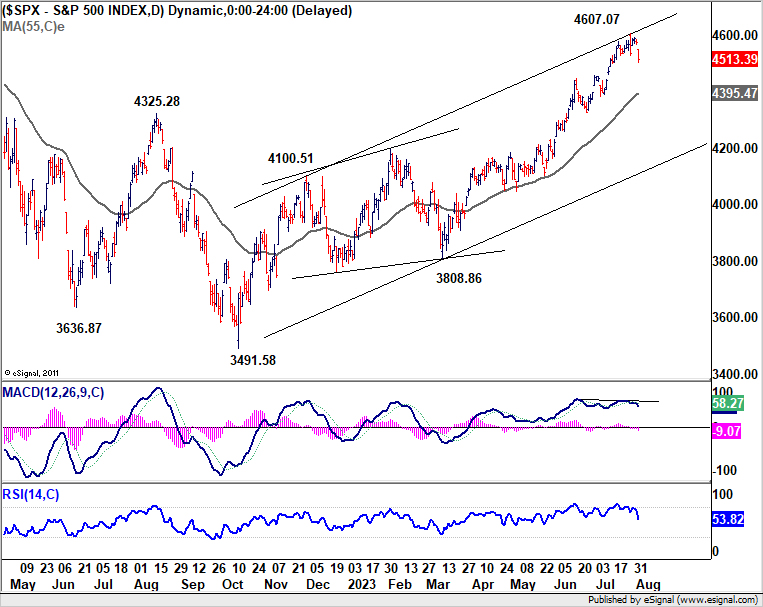
Technically, it's likely that S&P 500 has made a short term top at 4607.07, considering mild bearish divergence condition in D MACD. Risk will now stay on the downside as long as yesterday's high at 4550.93 holds. Deeper fall is in favor towards 55 D EMA (now at 4395.347) as a correction to the larger rally from 3491.58. The down move could be solidified, if 10-year yield could break away from 4.091 resistance decisively. But after all, the next moves will be subject to market reactions to today's ISM services and tomorrow's NFP.
In Asia, at the time of writing, Nikkei is down -1.31%. Hong Kong HSI is up 0.11%. China Shanghai SSE is up 0.15%. Singapore Strait Times is down -0.06%. Japan 10-year JGB is up 0.0180 at 0.646. Overnight, DOW dropped -0.98%. S&P 500 dropped -1.38%. NASDAQ dropped -2.17%. 10-year yield hit as high as 4.126 then closed up 0.027 at 4.078.
BoE to hike for sure, but by 25bps or 50bps?
BoE is widely expected to continue tightening today, though the extent of interest rate hike remains a point of contention. Markets currently slightly favor a 25 bps increment to 5.25%. However, a more aggressive 50bps hike to 5.50% cannot be entirely dismissed. The Bank's unexpected 50bps raise in June took markets by surprise, leading some economists to posit a strategic shift in the institution's response strategy. Conversely, CPI for June, which slowed more-than-expected to 7.9%, was perceived as a positive development by BoE policymakers, and could argue for a return to slowing tightening.
Regardless of today's decision, it is widely understood that this will not conclude the ongoing tightening cycle. Compared to ECB and Fed, BoE is anticipated to continue tightening for an extended period. Nonetheless, expectation of terminal rate has been fluctuating widely recently though, swinging from as high as 6.5% to 5.75% in a matter of weeks, suggesting a persisting uncertainty about the path ahead.
In addition to the anticipated rate decision, market observers will be closely watching two key aspects. First, today's voting could provide insight into the approach of MPC's newest member, Megan Greene, who recently succeeded known dove Silvana Tenreyro. If Greene presents a less dovish stance, Swati Dhingra may stand out as the only dissenter, making the vote an 8-1 majority.
Secondly, BoE is also set to release its new economic forecasts. Governor Andrew Bailey has repeatedly suggested that inflation is expected to decline fairly swiftly in the second half of the year, prompting keen interest in whether this prediction will still be reflected in the forthcoming projections.
Here are some readings on BoE:
- Will BoE Go Back to 25bps Interest Rate Increments?
- Bank of England Preview – Topside Risk to EUR/GBP With a Return to 25bp Steps
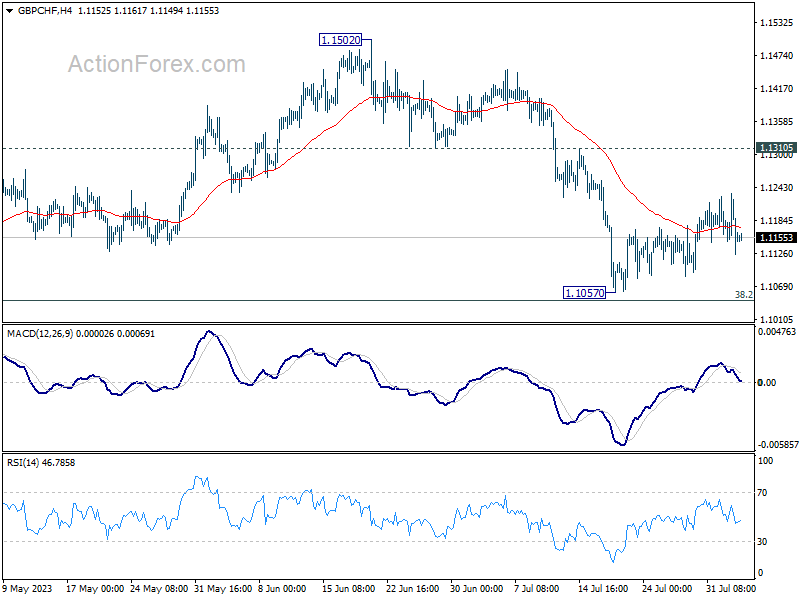
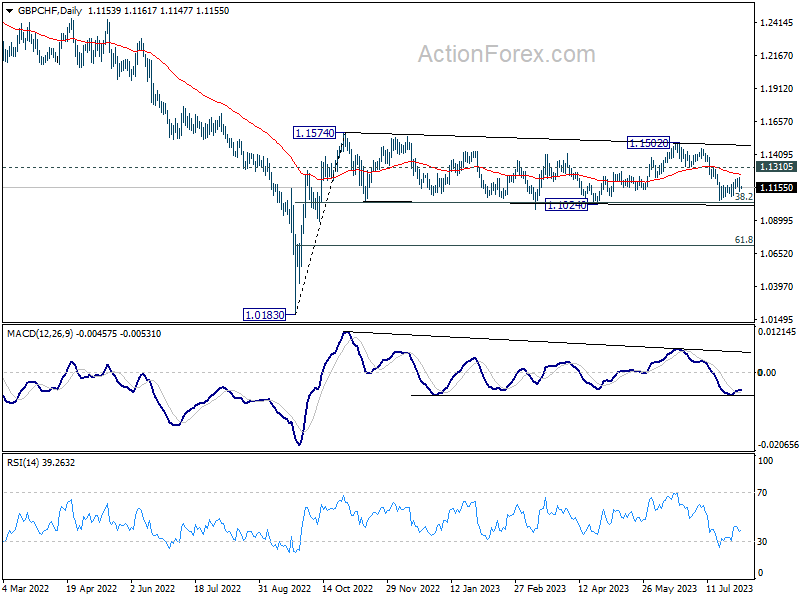
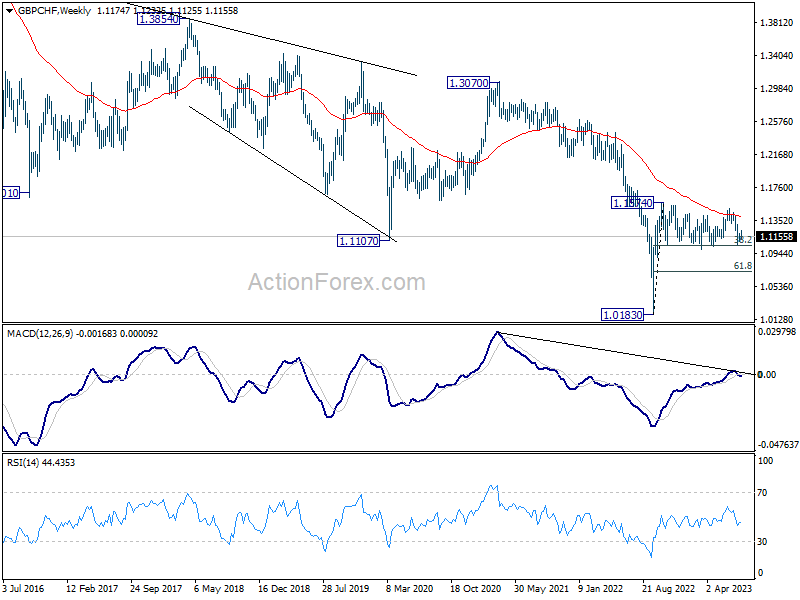
GBP/CHF's technical picture is mixed for now, with some dovish favor. From the near term angle, recovery from 1.1057 is clearly corrective looking, favoring a downside breakout. But the pair has been trading in medium term range of 1.1024/1574 since last October, keeping it neutral-at-worst. Yet, prior rejection by 55 W EMA is keeping the long term outlook bearish to neutral-at-best.
Still, further fall is more likely than not as long as 1.3105 support turned resistance zone. Decisive break of 1.1024 will bring deeper decline to 38.2% 1.0183 to 1.1574 at 1.0714 in rather quick manner. Let's see how GBP/CHF would reaction to today's BoE announcement.
China's Caixin PMI composite fell to 51.9, lowest since Jan
China's Caixin PMI Services increased slightly from 53.9 to 54.1 in July, surpassing the anticipated figure of 52.5. However, this reading fell short of the 55.5 average seen over the previous six months. Concurrently, PMI Composite dropped from 52.5 to 51.9, its lowest mark since January.
Commenting on the latest figures, Wang Zhe, a Senior Economist at Caixin Insight Group, expressed that the uneven recovery of the service and manufacturing industries remains a prominent concern. He noted, "Although the manufacturing sector was a drag, the steady expansion of the services industry still helped overall output, demand, and employment remain in positive territory."
The contraction in exports appeared pronounced, and while input costs saw a slight uptick, output prices registered a minor drop. Despite these challenges, expectations for future output remained on the optimistic side, though this metric recorded a new low since November.
On the broader economic landscape, Wang Zhe noted, "Although the data for industrial production and investment in June showed some signs of recovery, macroeconomic growth remained sluggish, and considerable downward pressure on the economy persisted."
Turning to policy recommendations, he emphasized the need for employment guarantees, stabilization of expectations, and boosting household income. He further argued that "At present, monetary policy only has a limited effect on boosting supply. An expansionary fiscal policy that targets demand should be prioritized."
On the data front
Swiss CPI will be a main feature in European session. Eurozone will release PMI services final and PPI. UK will also release PMI services final.
Later in the day, US jobless claims, non-farm productivity, ISM services and factory orders will be published.
EUR/USD Daily Outlook
Daily Pivots: (S1) 1.0897; (P) 1.0959; (R1) 1.0999; More...
EUR/USD's decline from 1.1274 resumed by breaking through 1.0942 and intraday bias is back on the downside. Deeper fall would be seen to 1.0832 support. Sustained trading below there will target 1.0609/34 cluster support. On the upside, however, break of 1.1046 resistance will turn bias back to the upside for stronger rebound instead.
In the bigger picture, a medium term top could be formed at 1.1274, after failing to break through 61.8% retracement of 1.2348 (2021 high) to 0.9534 at 1.1273 decisively, on bearish divergence condition in D MACD. Sustained trading below 55 D EMA (now at 1.0963) will bring deeper correction to 1.0634 cluster support (38.2% retracement of 0.9534 to 1.1274 at 1.0609). Strong support could be seen there, at least on first attempt, to set the range for consolidation.
Economic Indicators Update
| GMT | Ccy | Events | Actual | Forecast | Previous | Revised |
|---|---|---|---|---|---|---|
| 01:30 | AUD | Trade Balance (AUD) Jun | 11.32B | 10.50B | 11.79B | |
| 01:45 | CNY | Caixin Services PMI Jul | 54.1 | 52.5 | 53.9 | |
| 06:00 | EUR | Germany Trade Balance (EUR) Jun | 15.5B | 14.4B | ||
| 06:30 | CHF | CPI M/M Jul | -0.10% | 0.10% | ||
| 06:30 | CHF | CPI Y/Y Jul | 1.50% | 1.70% | ||
| 07:45 | EUR | Italy Services PMI Jul | 52.3 | 52.2 | ||
| 07:50 | EUR | France Services PMI Jul F | 47.4 | 47.4 | ||
| 07:55 | EUR | Germany Services PMI Jul F | 52 | 52 | ||
| 08:00 | EUR | Italy Retail Sales M/M Jun | 0.00% | 0.70% | ||
| 08:00 | EUR | Eurozone Services PMI Jul F | 51.1 | 51.1 | ||
| 08:30 | GBP | Services PMI Jul F | 51.5 | 51.5 | ||
| 09:00 | EUR | Eurozone PPI M/M Jun | -0.20% | -1.90% | ||
| 09:00 | EUR | Eurozone PPI Y/Y Jun | -1.50% | |||
| 11:00 | GBP | BoE Interest Rate Decision | 5.25% | 5.00% | ||
| 11:00 | GBP | MPC Official Bank Rate Votes | 7--0--2 | 7--0--2 | ||
| 11:30 | USD | Challenger Job Cuts Y/Y Jul | 25.20% | |||
| 12:30 | USD | Initial Jobless Claims (Jul 28) | 223K | 221K | ||
| 12:30 | USD | Nonfarm Productivity Q2 P | 1.10% | -2.10% | ||
| 12:30 | USD | Unit Labor Costs Q2 P | 2.70% | 4.20% | ||
| 13:45 | USD | Services PMI Jul F | 52.4 | 52.4 | ||
| 14:00 | USD | ISM Services PMI Jul | 53 | 53.9 | ||
| 14:00 | USD | Factory Orders M/M Jun | 0.20% | 0.30% | ||
| 14:30 | USD | Natural Gas Storage | 18B | 16B |
Technical Outlook and Review
DXY:
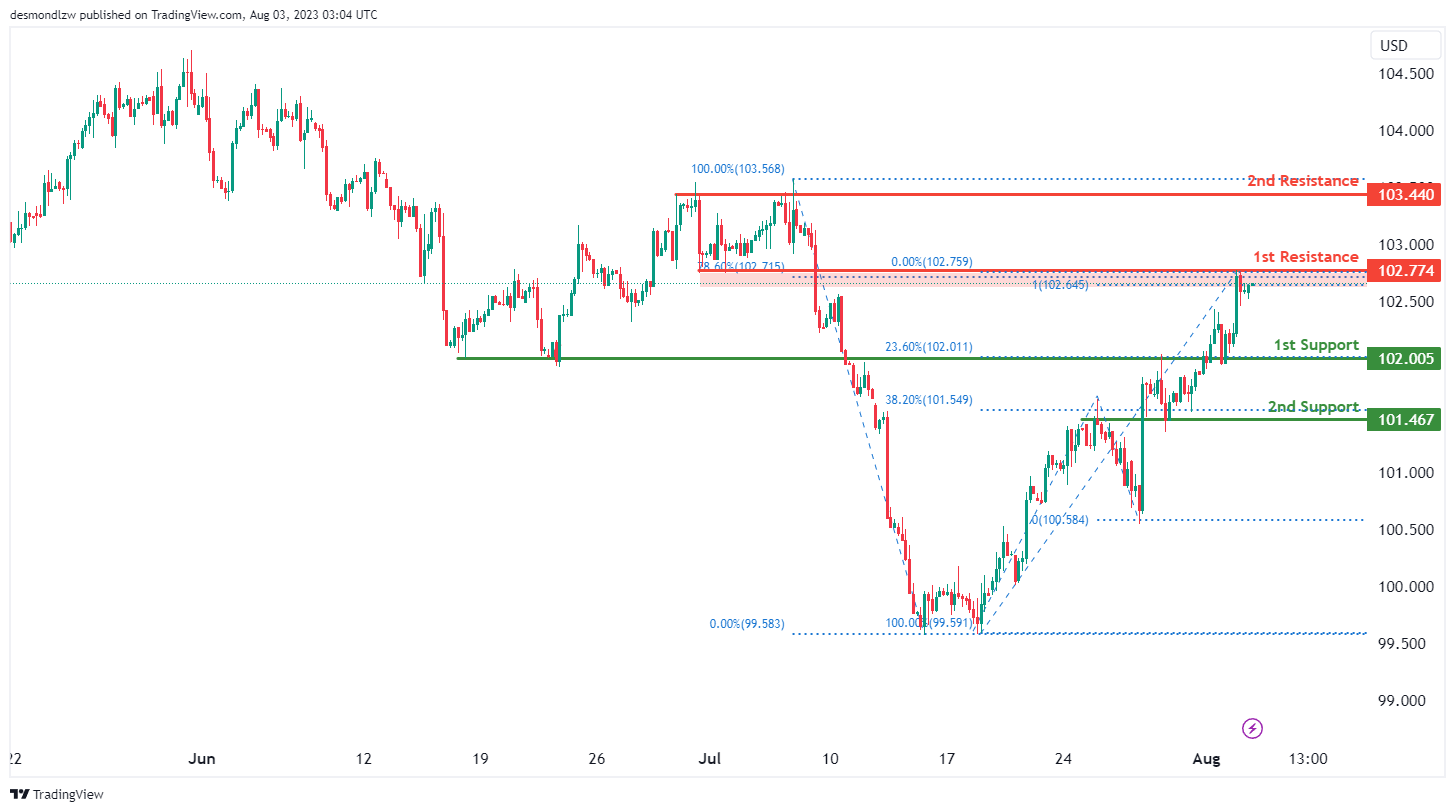
The US dollar index (DXY) chart indicates a bullish momentum, suggesting a potential bullish continuation towards the 1st resistance level at 102.77 which is an overlap resistance and also coincides with the 78.60% Fibonacci retracement and the 100% Fibonacci projection levels, indicating Fibonacci confluence. Additionally, should the bullish momentum extend further, the 2nd resistance at 103.44 represents an overlap resistance that could hinder its progress.
The 1st support at 102.01 is considered an overlap support and aligns with the 23.60% Fibonacci retracement level, making it a crucial level to watch for potential bounces. Additionally, the 2nd support at 101.47 acts as another significant support area, coinciding with the 38.20% Fibonacci retracement level, further reinforcing its importance.
EUR/USD:
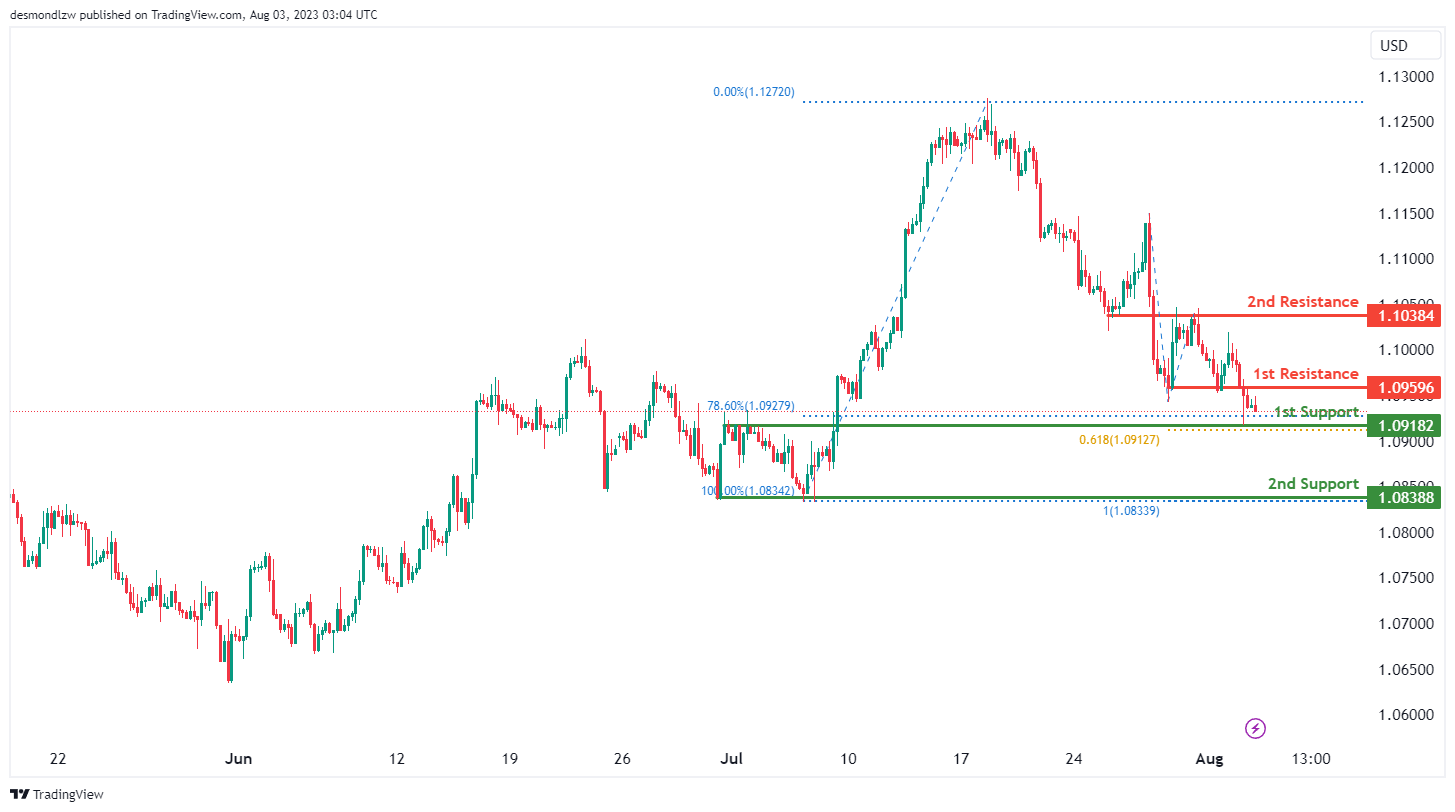
The EUR/USD chart is currently demonstrating a bearish trend, suggesting a likely continuation of this bearish movement towards the first support level at 1.0918. This support level is significant as an overlap support and is aligned with both the 78.60% Fibonacci retracement and the 61.80% Fibonacci projection levels, indicating a Fibonacci confluence.
If the price were to fall further, the second support level at 1.0839, also acting as an overlap support, aligns with the 100% Fibonacci projection level and could serve as a solid barrier against further decline.
However, if there is a reversal in the trend, the first resistance level at 1.0959, which is an overlap resistance, could pose a challenge for bullish price movements. If the price breaks past this level, the second resistance level at 1.1038, also an overlap resistance, could present a significant obstacle to further price increases.
EUR/JPY:
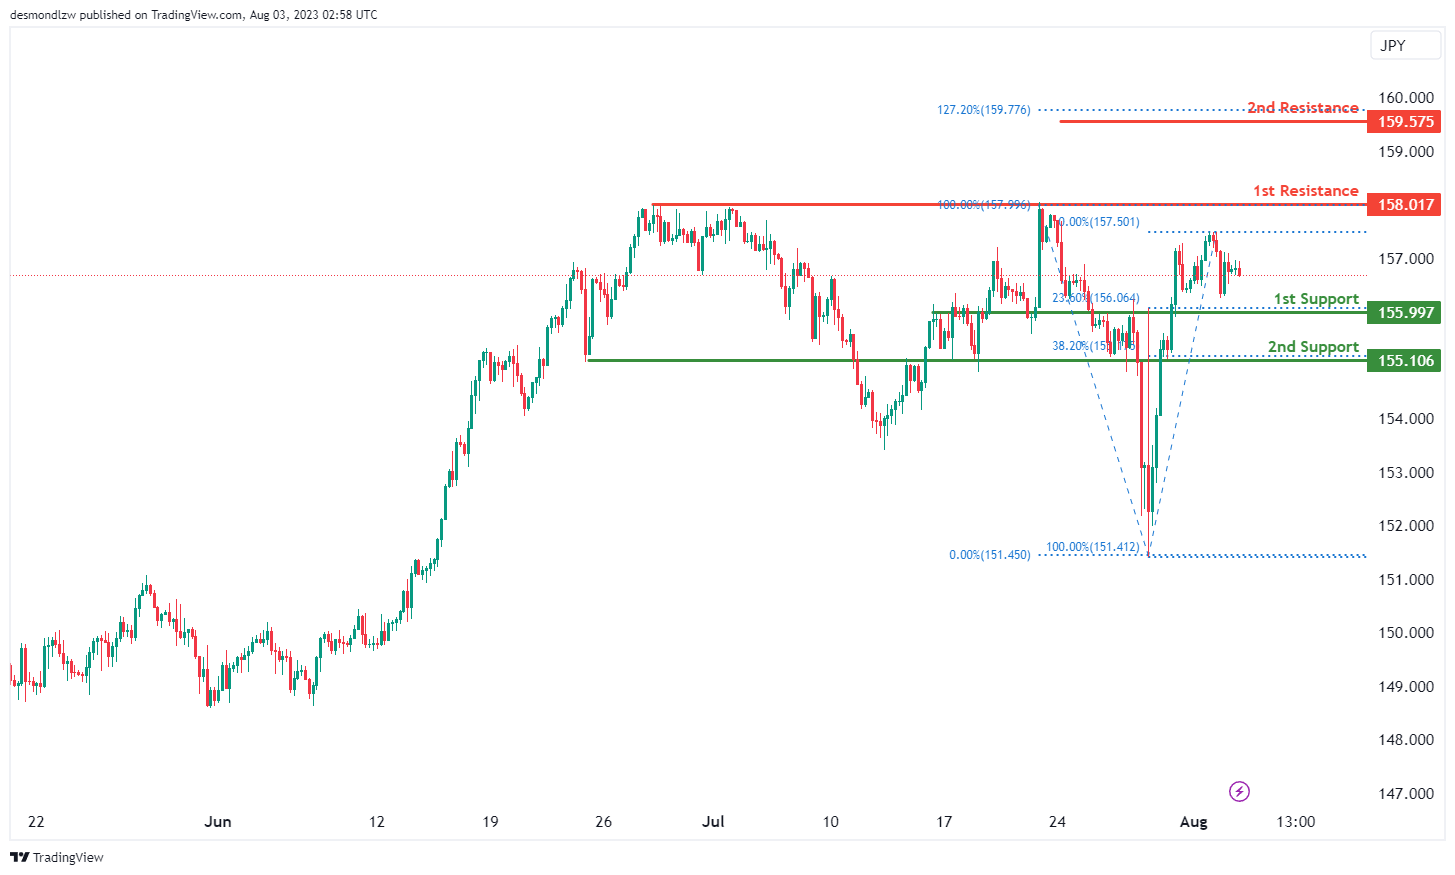
The EUR/JPY instrument currently shows a neutral momentum, suggesting the price could potentially fluctuate between the first resistance level and the first support level.
The first support level at 155.99 is significant due to its role as an overlap support and its alignment with the 23.60% Fibonacci retracement level. Should the price drop further, the second support level at 155.10, also functioning as an overlap support, aligns with the 38.20% Fibonacci retracement level and could act as a firm barrier against additional losses.
On the upside, the first resistance level is located at 158.01. This level is significant due to its role as a multi-swing high resistance and could provide a robust barrier to bullish movements.
If the price manages to breach the first resistance level, the second resistance level at 159.57 could present a substantial obstacle to further upward momentum. This resistance level is notable due to its alignment with the 127.20% Fibonacci extension level.
EUR/GBP:
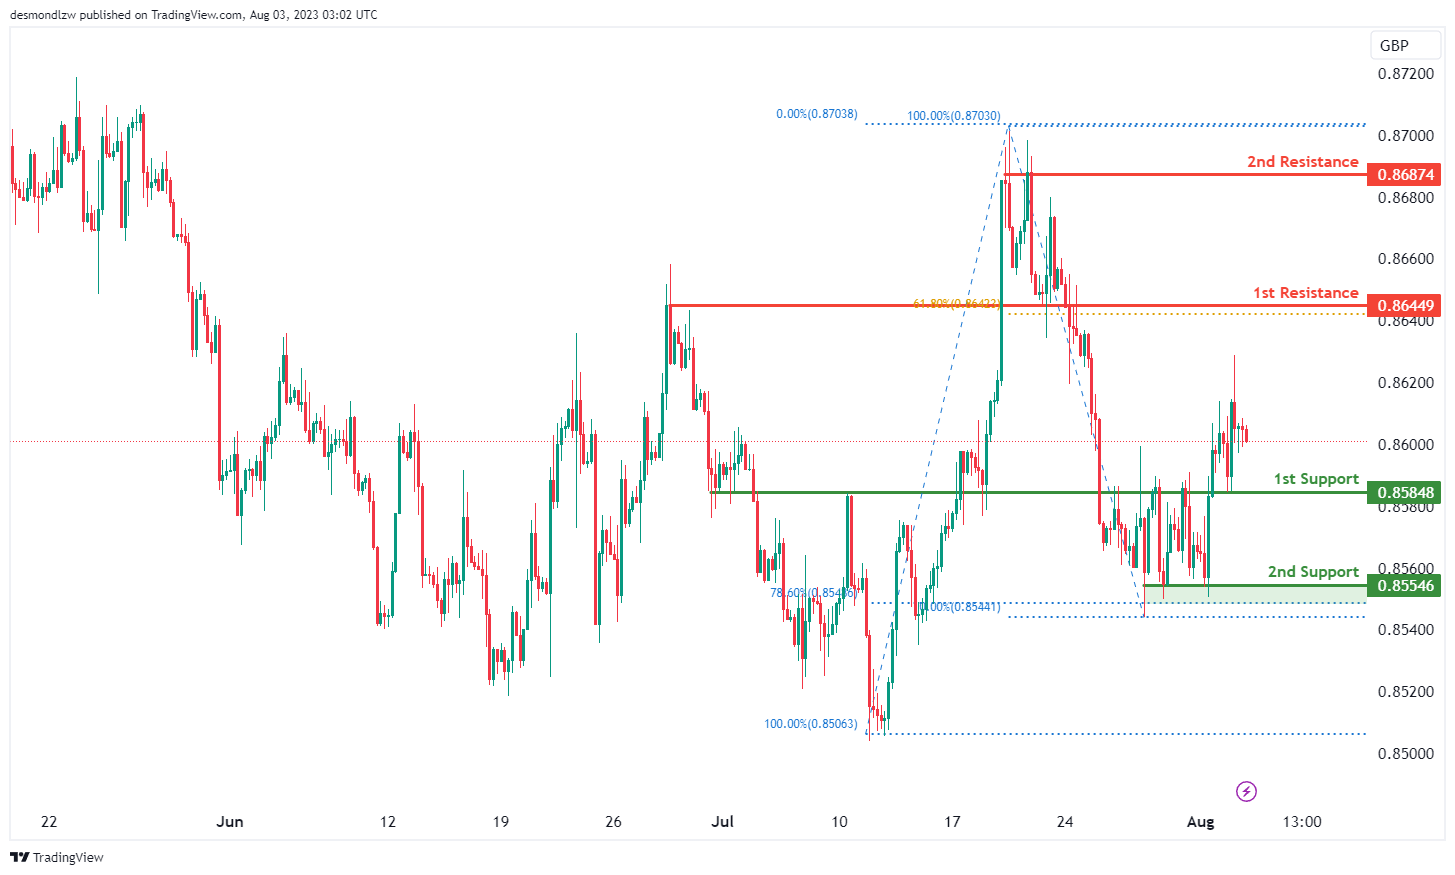
The EUR/GBP instrument currently exhibits a bearish momentum, indicating that the price could potentially continue its bearish trend towards the first support level at 0.8584. This support level is noteworthy due to its role as an overlap support.
Should the price fall further, the second support level at 0.8554, which functions as a multi-swing low support, aligns with the 78.60% Fibonacci retracement level and could provide a solid floor against further price decline.
On the upside, the first resistance level at 0.8644, serving as an overlap resistance, coincides with the 61.80% Fibonacci retracement level and could pose a substantial barrier to bullish movements.
Further up, the second resistance level at 0.8687, identified as a multi-swing high resistance, could also serve as a significant obstacle to further price increases.
GBP/USD:
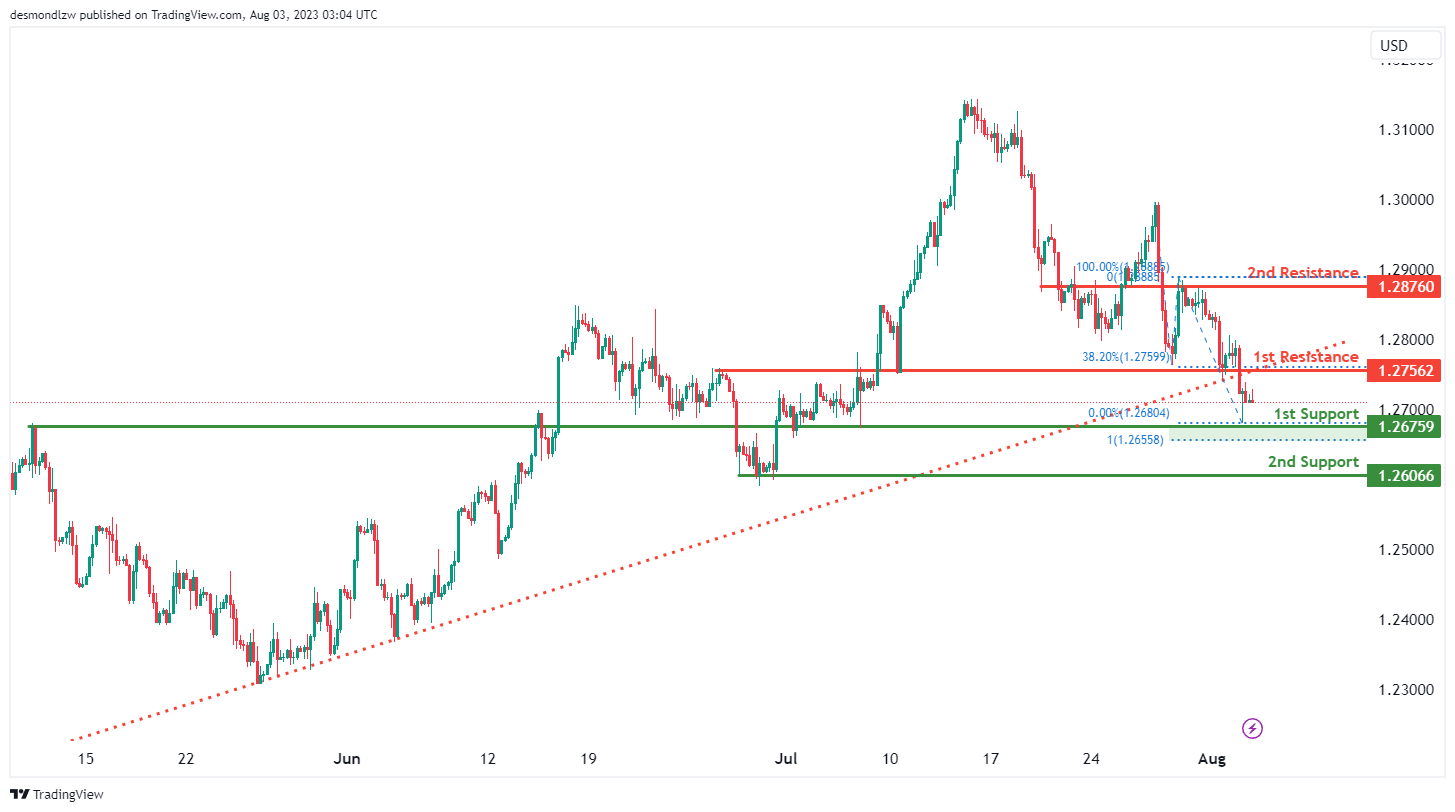
The GBP/USD chart is demonstrating a bearish momentum, bolstered by the price breaking below an ascending support line, signaling a potential bearish move. There’s an expectation for this bearish trend to continue towards the first support level at 1.2676, notable for being an overlap support and aligning with the 100% Fibonacci projection level.
If the price declines further, the second support level at 1.2607, also an overlap support, could act as a barrier to more losses.
However, in the event of a price reversal, the first resistance level at 1.2756, recognized as an overlap resistance and aligned with the 38.20% Fibonacci retracement level, may provide a significant hurdle. If the price breaks past this level, the second resistance at 1.2876, another overlap resistance, may present further challenges to price increases.
GBP/JPY:
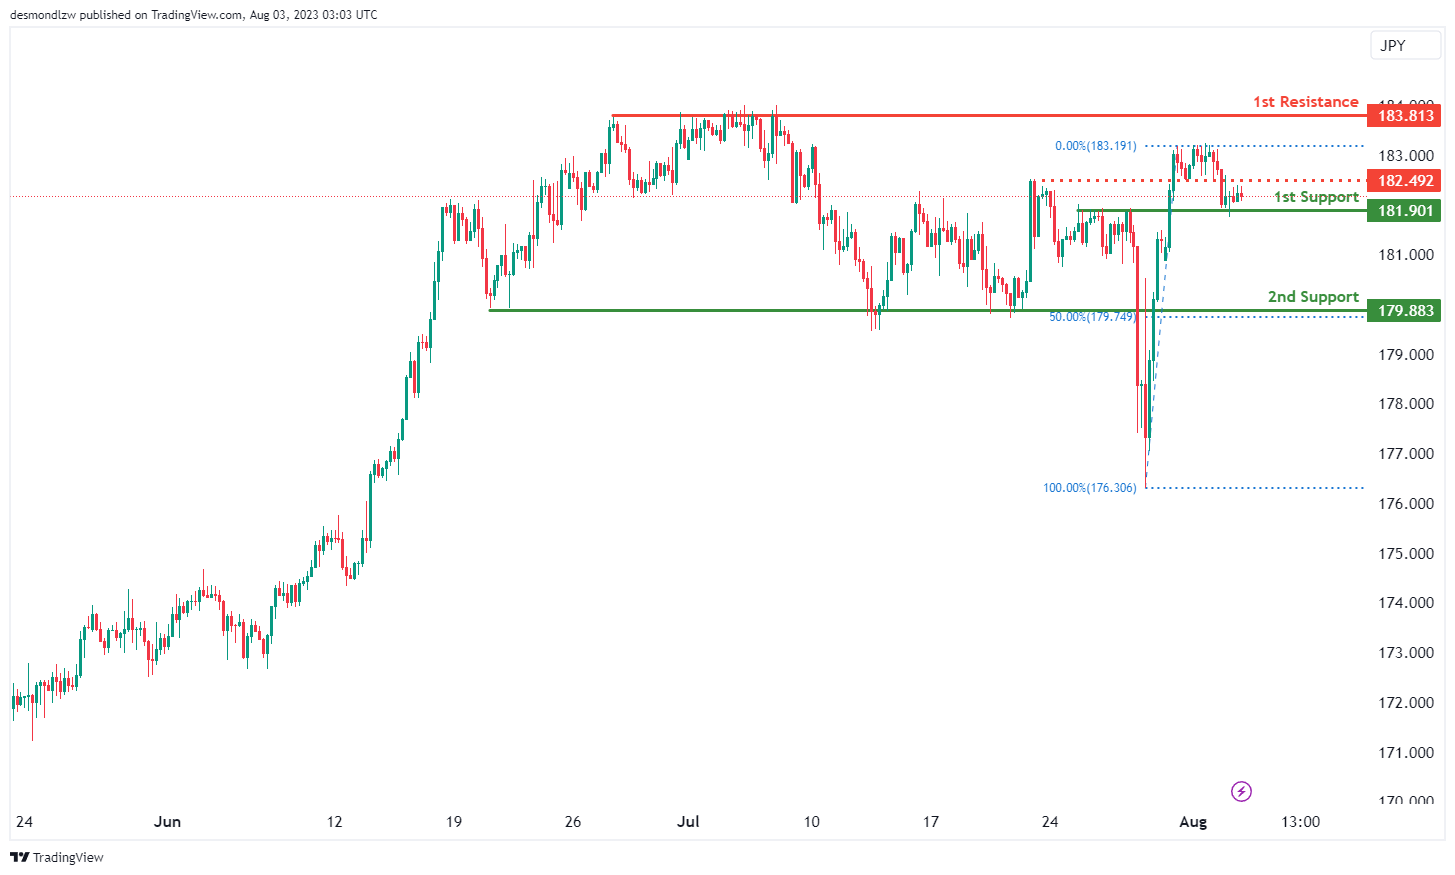
The GBP/JPY instrument is currently exhibiting a bullish momentum, indicating a possible bullish bounce off the first support level at 181.90, which acts as a pullback support, and heading towards the first resistance level at 183.81. This resistance level is significant due to its role as a multi-swing high resistance.
If the price begins to decline, the second support level at 179.88, acting as an overlap support and aligning with the 50% Fibonacci retracement level, could act as a solid barrier against further price drop.
In the interim, the price might encounter an obstacle at the intermediate resistance level of 182.49, which serves as an overlap resistance and could pose a significant hurdle for the bullish price movement.
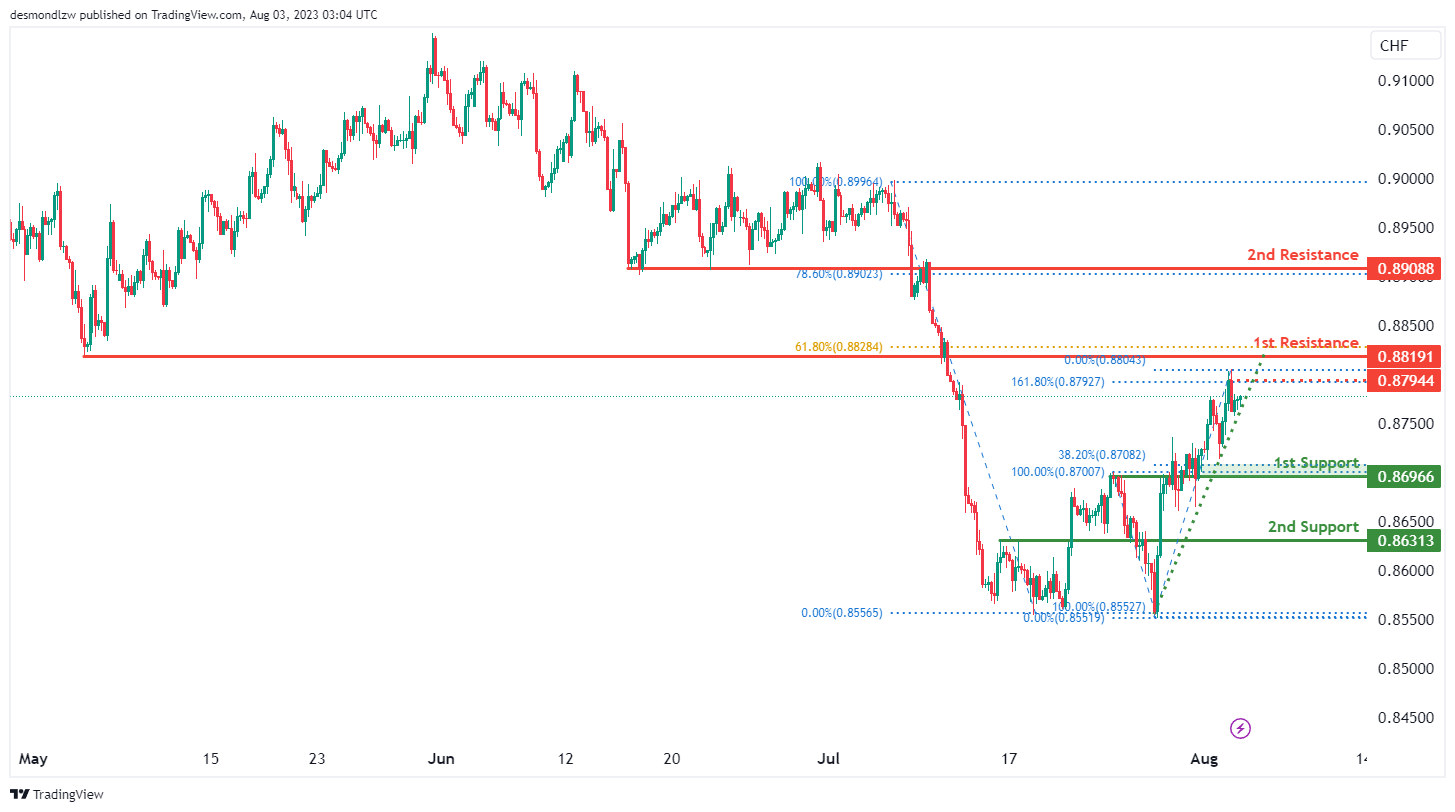
USD/CHF:
The USD/CHF chart is showing a bullish trend, supported by the price positioning above a major ascending trend line, hinting at the possibility of more bullish momentum.
This trend is expected to continue towards the first resistance level at 0.8819, which is significant due to its role as an overlap resistance and its alignment with the 61.80% Fibonacci retracement level. An intermediate resistance level is also present at 0.8794, which is an overlap resistance and aligns with the 161.80% Fibonacci extension level.
If the price manages to break past the first resistance, the second resistance at 0.8909 could pose a significant challenge. This level is an overlap resistance and aligns with the 78.60% Fibonacci retracement level.
In the case of a downturn, the first support level is at 0.8697, recognized for being an overlap support and aligning with the 38.20% Fibonacci retracement level. This could prevent further price decline. If the price drops past this level, the second support level at 0.8631, another overlap support, could provide a more substantial price floor.
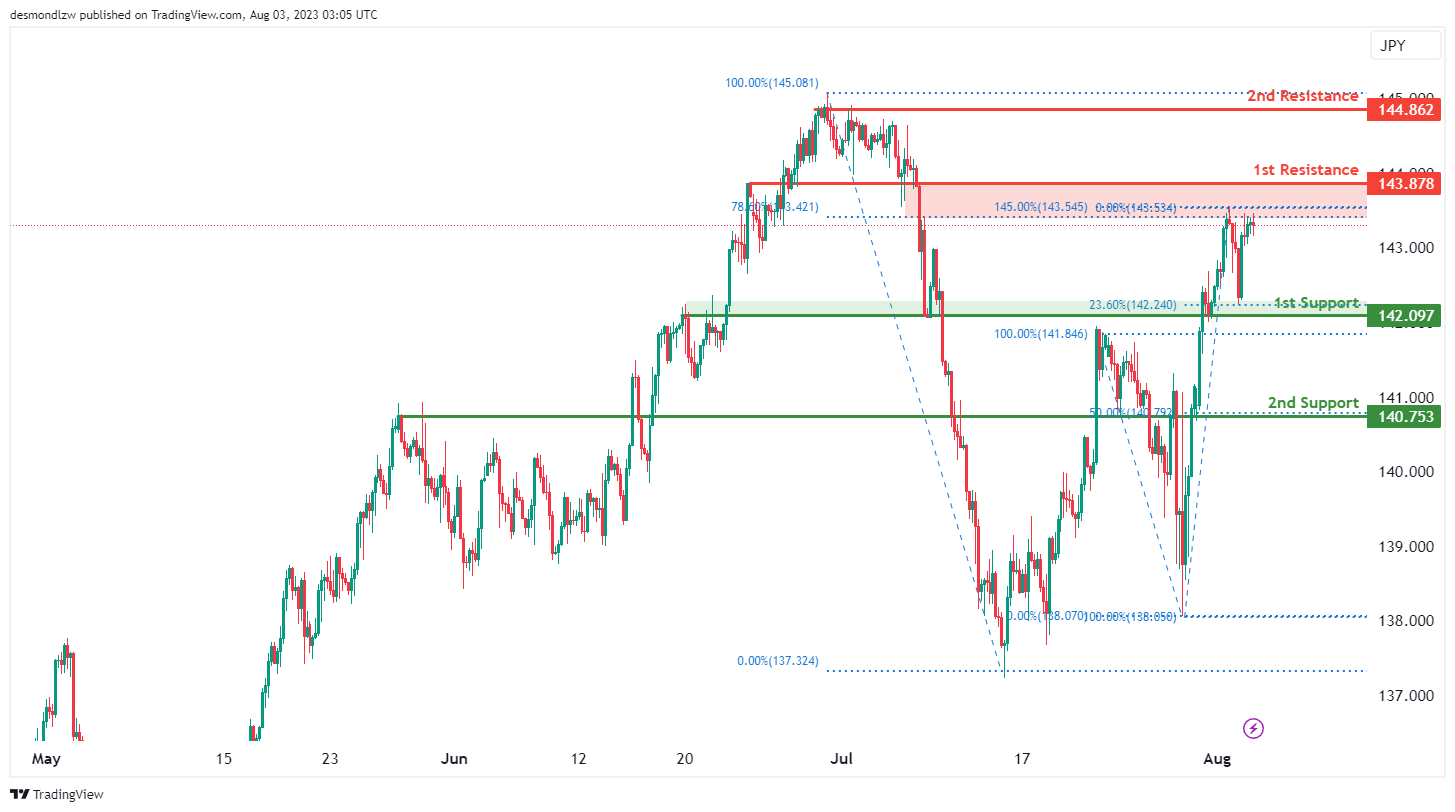
USD/JPY:
The USD/JPY is showing a bullish momentum, suggesting a likely bullish continuation towards the first resistance level at 143.88. This resistance is notable due to its role as an overlap resistance, and its alignment with the 78.60% Fibonacci retracement and 145.00% Fibonacci projection levels, indicating a Fibonacci confluence.
If the price breaks past the first resistance, the second resistance level at 144.86, marked by a swing high resistance, may present a significant challenge to further bullish momentum.
In terms of support, the first level is at 142.09, recognized as an overlap support and coinciding with the 23.60% Fibonacci retracement level. The second support level is at 140.75, another overlap support, aligned with the 50% Fibonacci retracement level. These could prevent further price decline.
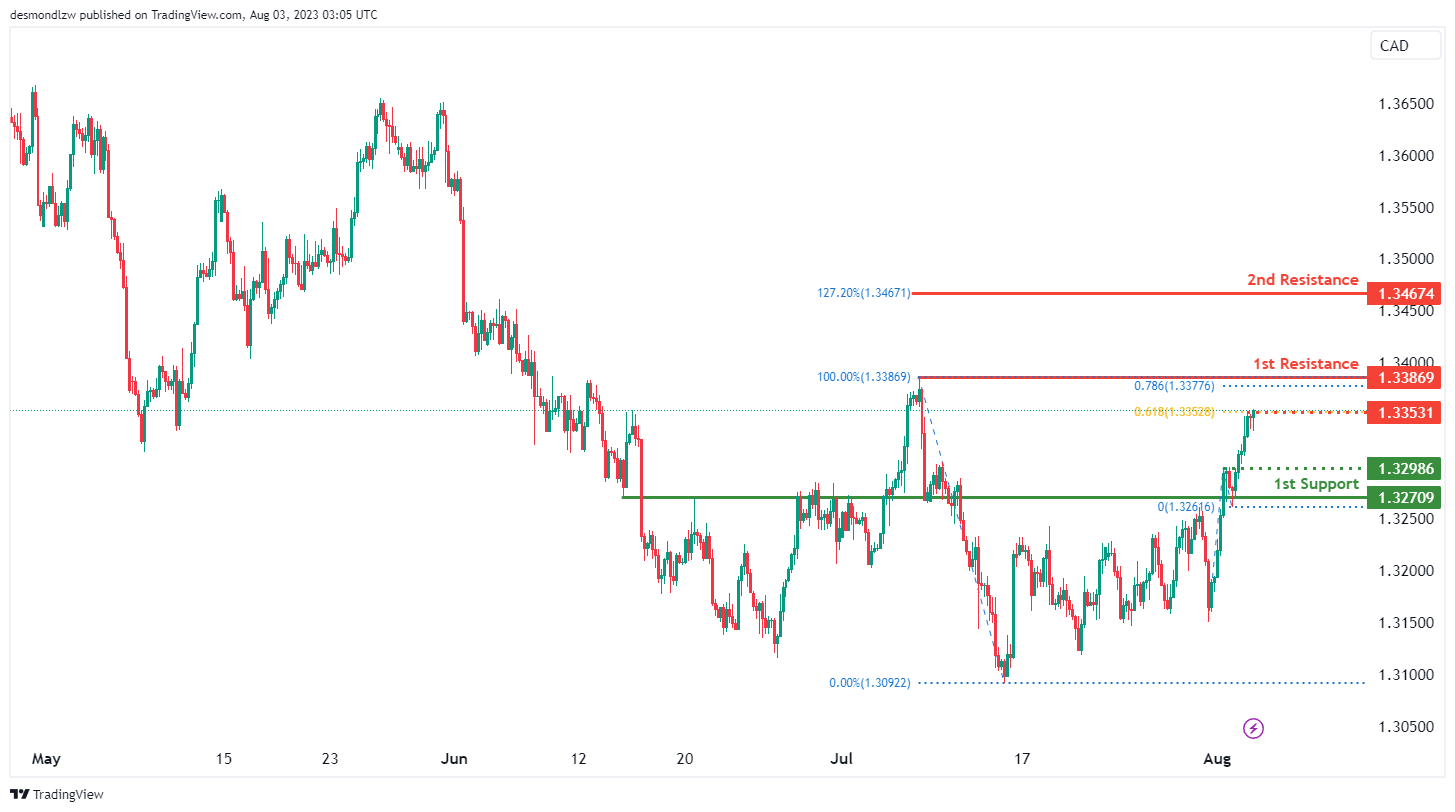
USD/CAD:
The USD/CAD chart is showing a bullish momentum, suggesting a potential bullish continuation towards the first resistance level at 1.3387. This resistance is notable as an overlap resistance and aligns with the 78.60% Fibonacci projection level. Before reaching the first resistance, price could encounter some resistance at 1.3353, which serves as an intermediate resistance level, due to its role as an overlap resistance and its alignment with the 61.80% Fibonacci projection level.
Looking upwards, if the price breaks past the first resistance, the second resistance level is at 1.3467, defined by the 127.20% Fibonacci extension level. This could present a substantial obstacle to continued bullish momentum.
The first support level is at 1.3271, which is an overlap support. Before the 1st support, an additional support level can be found at 1.3299, serving as an intermediate support point and could potentially halt a price decline.
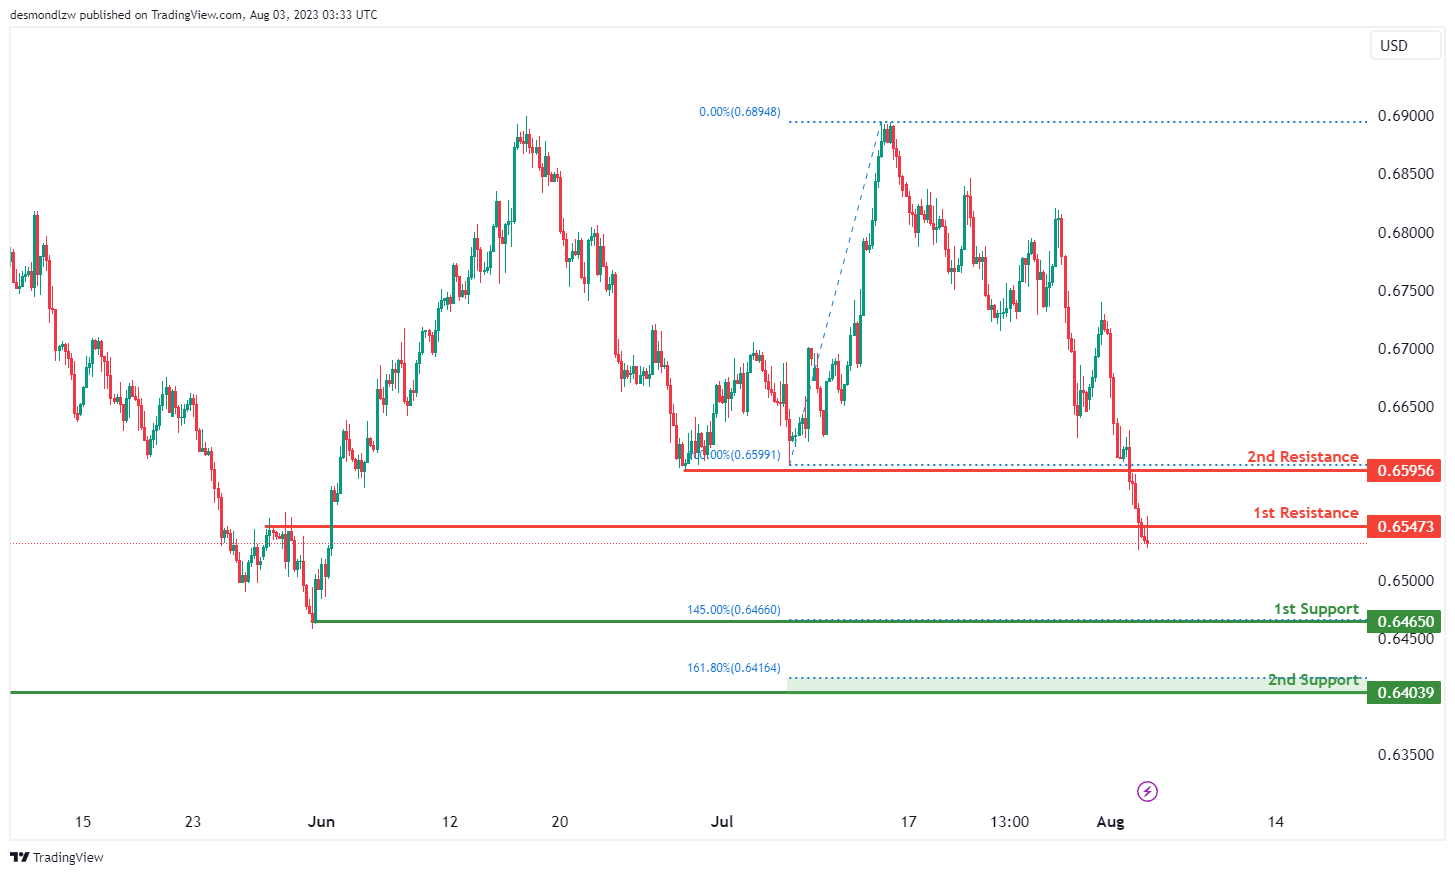
AUD/USD:
The AUD/USD instrument is currently in a bearish trend, and it’s likely that the price may continue to move downwards to the first support level at 0.6465. This level acts as a swing low support and coincides with the 145.00% Fibonacci extension level, adding additional significance.
Should the price drop beyond the first support, the second support at 0.6403, functioning as an overlap support, is expected to halt further decline. This level also aligns with the 161.80% Fibonacci extension level.
In case of a price reversal, the first resistance level is at 0.6547, which is an overlap resistance, and could present an obstacle to bullish price movements. If the price breaks past this resistance, the second resistance at 0.6595, acting as an overlap resistance, might further impede the price’s upward progression.
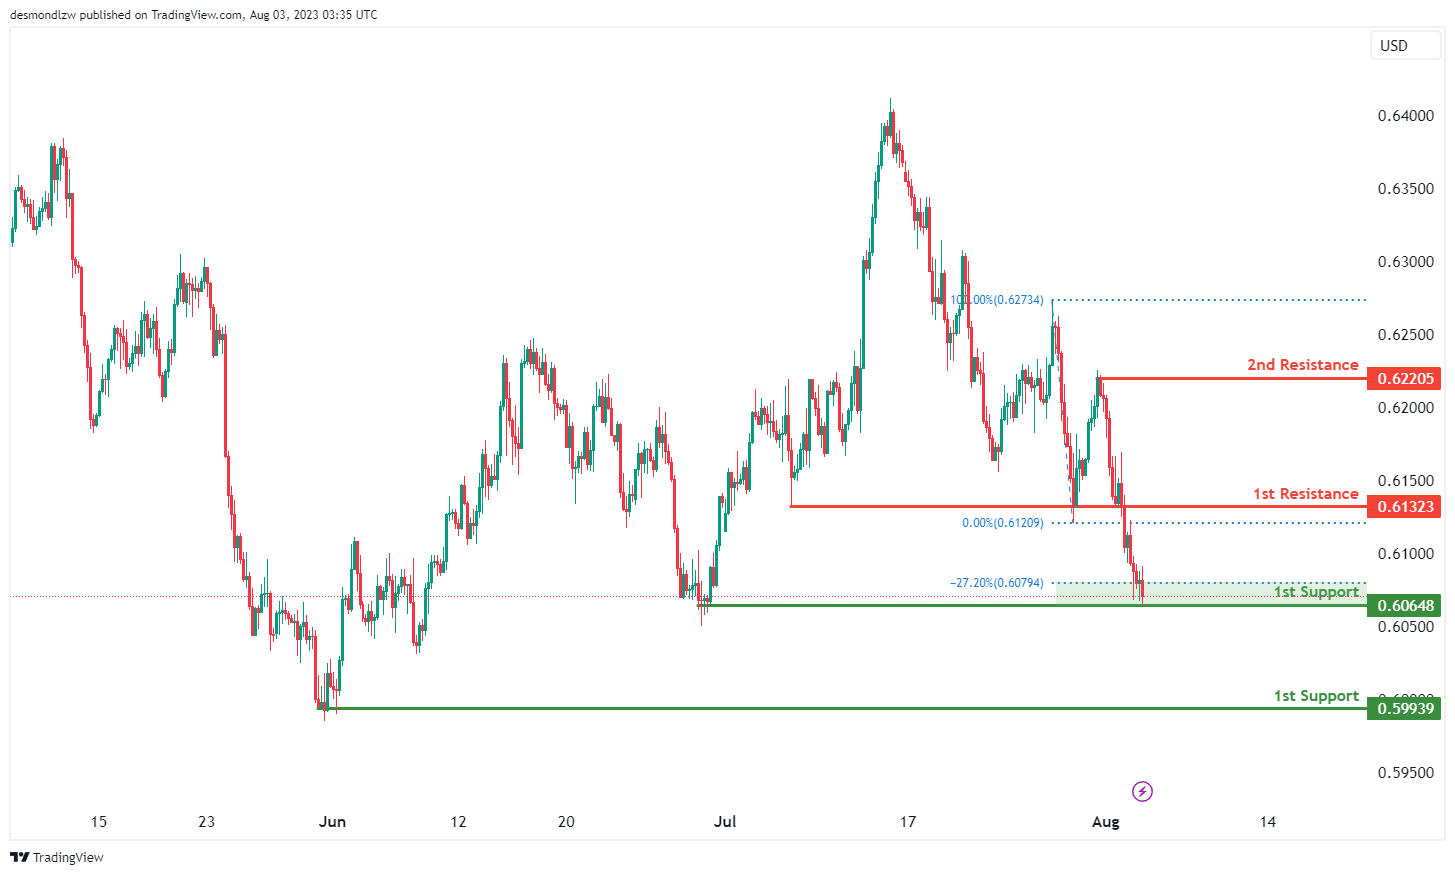
NZD/USD
The NZD/USD instrument is currently in a bullish trend, with a potential for a bullish bounce off the first support level at 0.6065 and a move towards the first resistance. This support level acts as a swing low support and aligns with the -27.20% Fibonacci expansion level.
If the price declines past the first support, the second support level at 0.5993, also acting as a swing low support, is expected to prevent further decline.
On the other hand, if the price starts to rise, the first resistance at 0.6132, functioning as an overlap resistance, might hinder bullish progression. If the price surges past this resistance, the second resistance at 0.6221, which corresponds to a swing high resistance, could pose an additional obstacle.
DJ30:
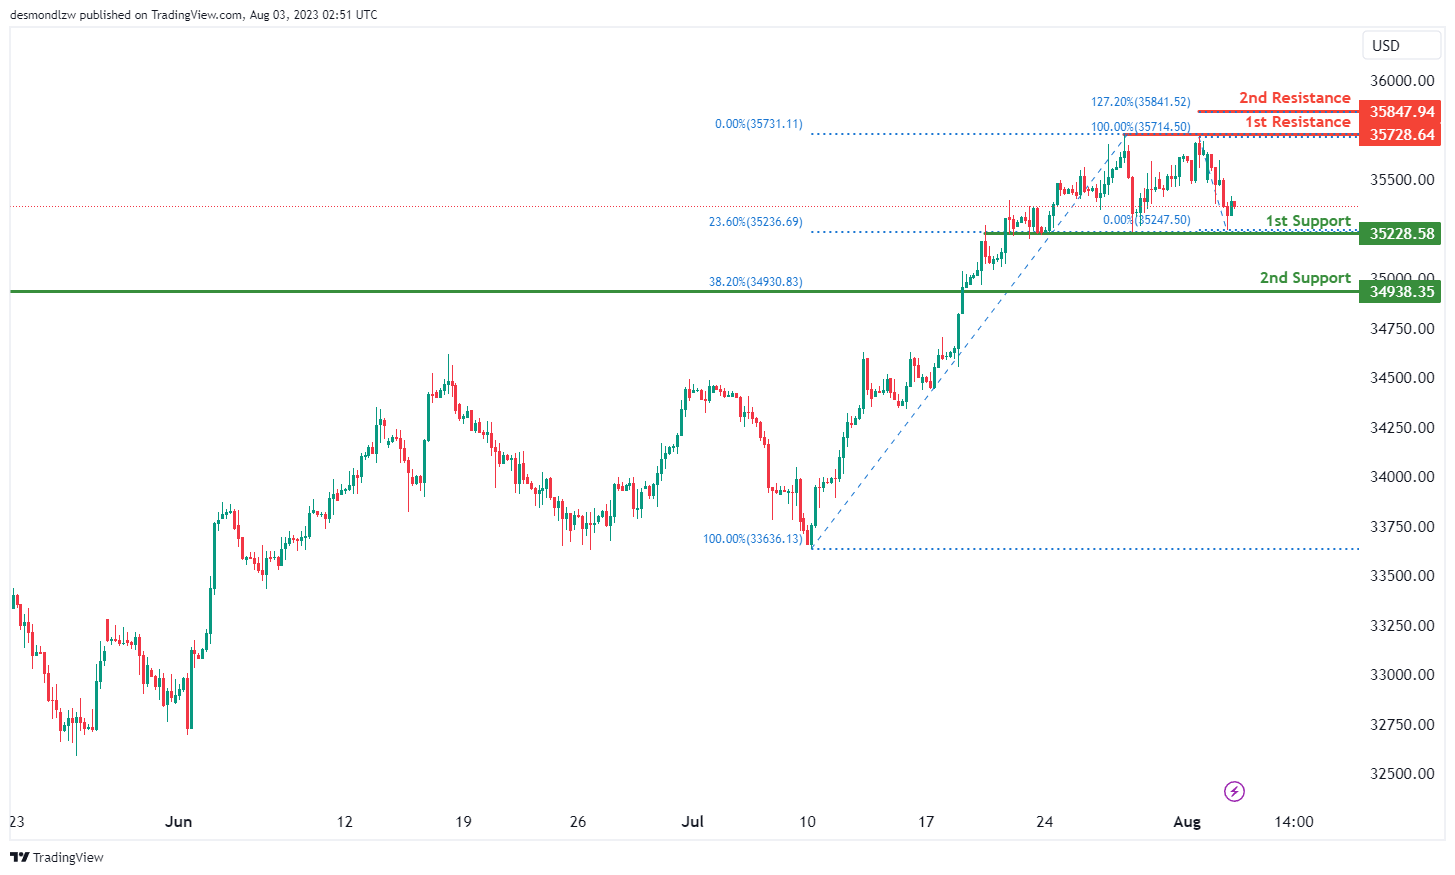
The DJ30 instrument currently exhibits a bullish trend, implying a potential bullish bounce off the first support level at 35228.58, and a subsequent movement towards the first resistance level at 35728.64. The first support level is noteworthy due to its role as a pullback support and its alignment with the 23.60% Fibonacci retracement level.
If the price descends further, the second support level at 34938.35, which also acts as a pullback support and aligns with the 38.20% Fibonacci retracement level, could provide a firm floor to prevent additional losses.
On the bullish side, the first resistance level is significant for its role as a multi-swing high resistance. If the price attempts to break this level, it might encounter a significant hurdle at the second resistance level at 35847.94, aligning with the 127.20% Fibonacci extension level.
GER30:
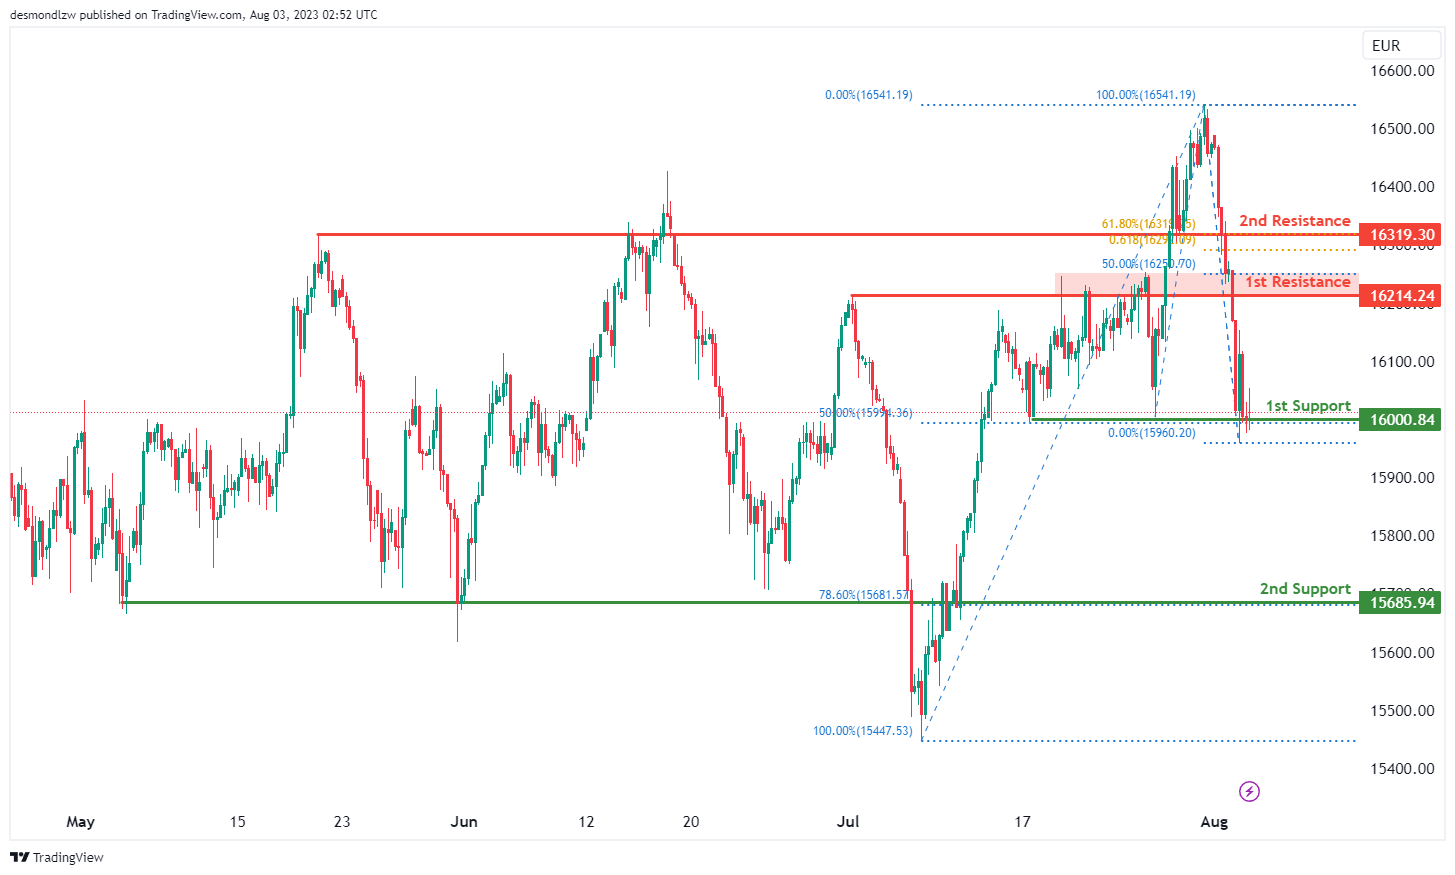
The GER30 instrument currently shows a weak bullish momentum with low confidence, suggesting a possible bullish bounce from the first support level at 16000.84 towards the first resistance level at 16214.24. The first support level is significant as a multi-swing low support and aligns with the 50% Fibonacci retracement level.
If the price drops further, the second support level at 15685.94, which serves as an overlap support and coincides with the 78.60% Fibonacci retracement, could potentially halt further losses.
In terms of upward resistance, the first resistance level at 16214.24, an overlap resistance, aligns with the 50% Fibonacci retracement level. Beyond this, the second resistance level at 16319.30 is crucial due to its role as an overlap resistance. This level is also in line with the 61.80% Fibonacci retracement and projection, indicating a potential Fibonacci confluence that might pose challenges to bullish movements.
US500
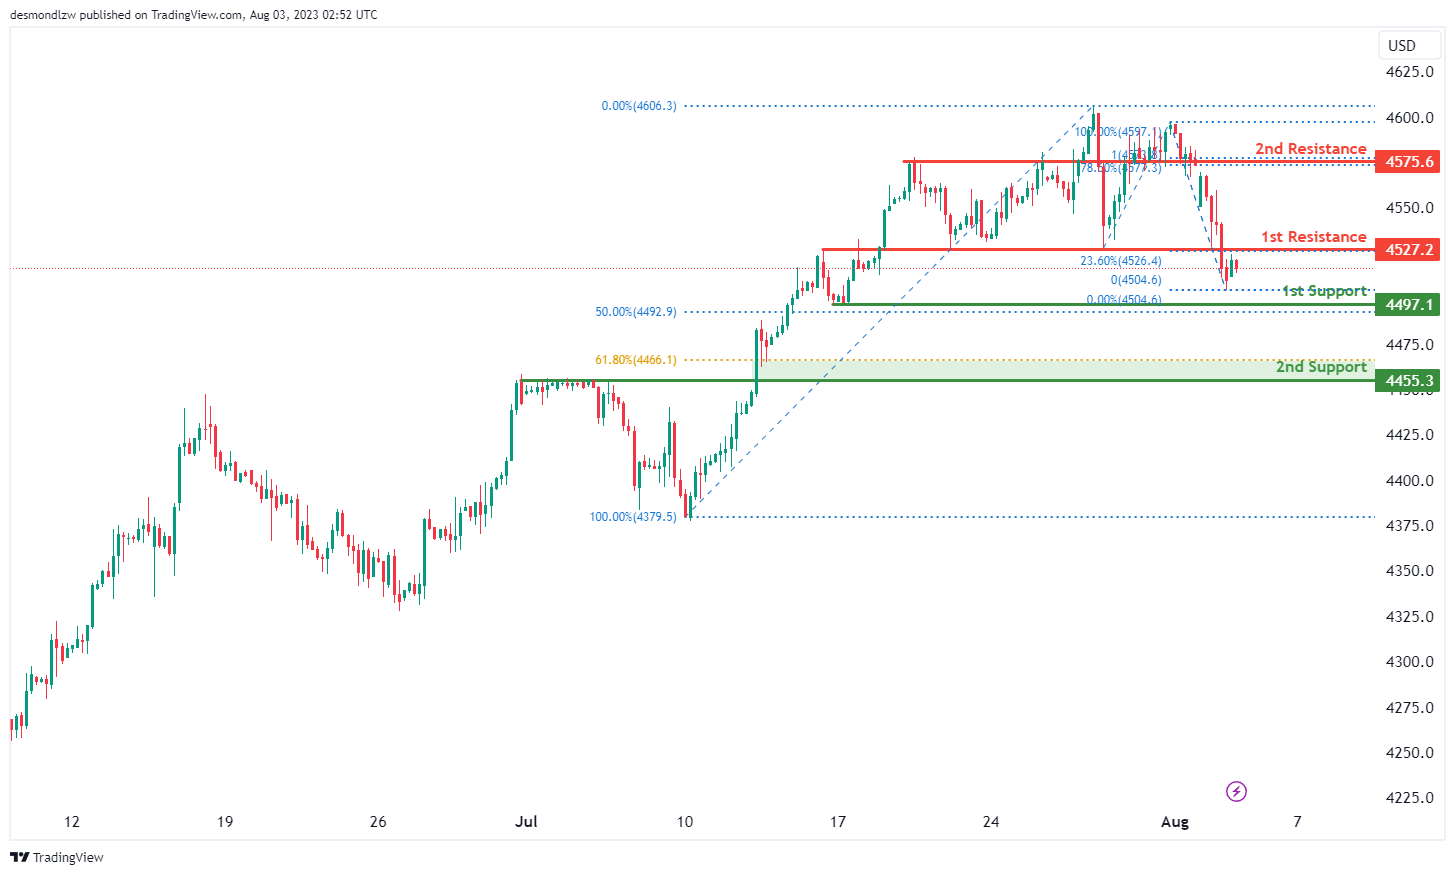
The US500 instrument currently exhibits a bullish momentum, suggesting a potential bullish continuation towards the first resistance level at 4527.2. This resistance level is notable due to its role as an overlap resistance and its alignment with the 23.60% Fibonacci retracement level.
In terms of support, the first support level at 4497.1 functions as a swing low support and aligns with the 50% Fibonacci retracement level, providing a potential floor for any price decline. Should the price drop further, the second support level at 4455.3, serving as a pullback support, aligns with the 61.80% Fibonacci retracement level and could provide additional support against further losses.
If the price exceeds the first resistance level, the second resistance level at 4575.6, which serves as an overlap resistance, is of interest due to its alignment with the 78.60% Fibonacci retracement level and 100% Fibonacci projection. This Fibonacci confluence could present a significant obstacle for further bullish momentum.
BTC/USD:
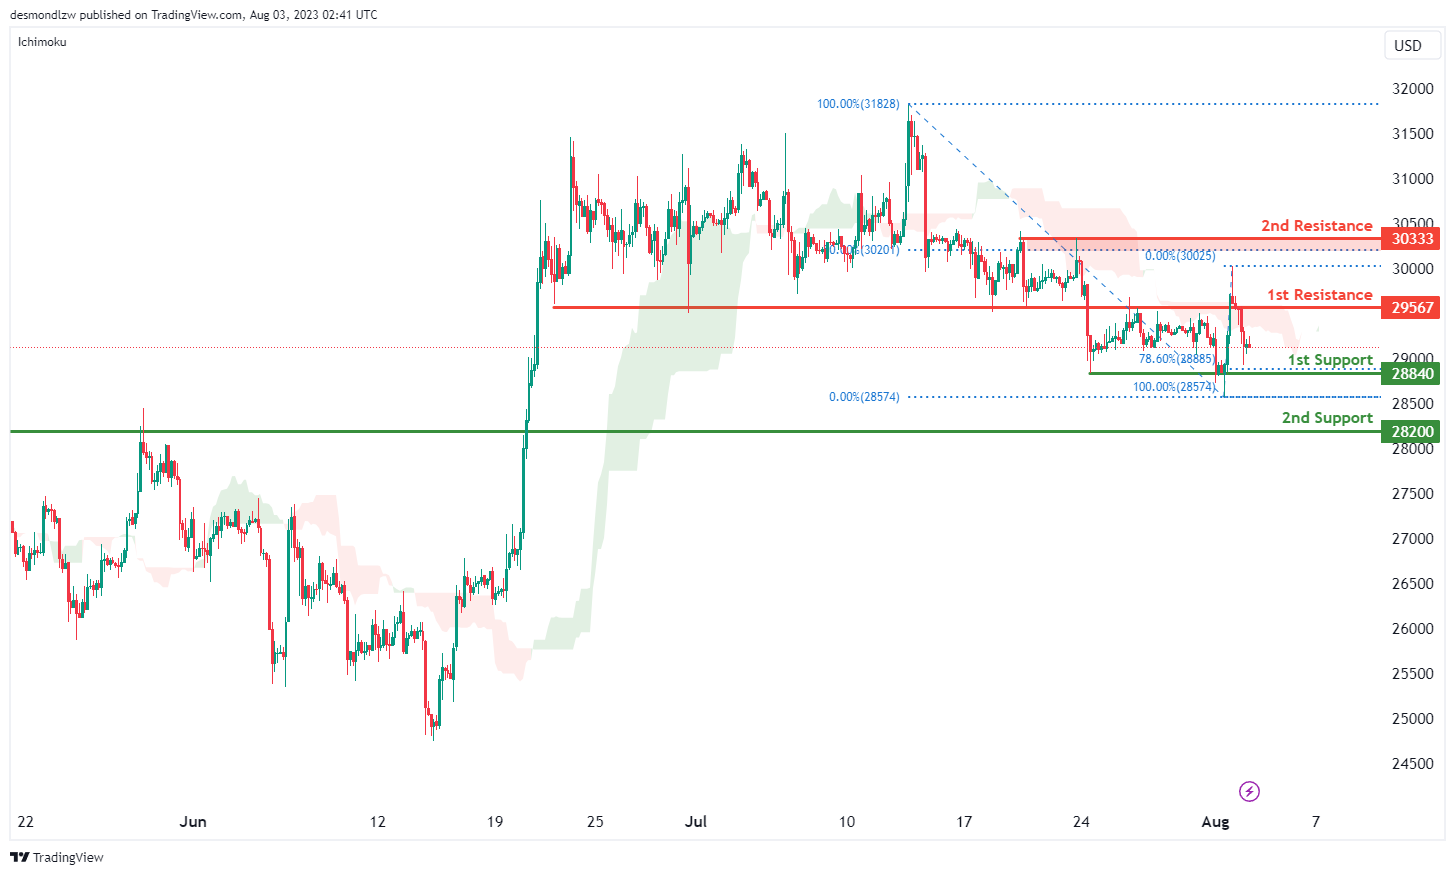
The BTC/USD instrument is presently in a bearish trend, as indicated by its position below the bearish Ichimoku cloud. This suggests a potential bearish continuation towards the first support level at 28840, which is considered significant due to its role as a multi-swing low support and its alignment with the 78.60% Fibonacci retracement level.
If the price drops further, the second support level at 28200, acting as a pullback support, could serve to limit further decline.
On the resistance side, the first resistance level at 29567 is considered significant due to its role as an overlap resistance. If the price moves past this level, it could face a challenge from the second resistance level at 30333. This level is notable as a multi-swing high resistance and aligns with the 50% Fibonacci retracement level, suggesting it could present a significant obstacle for any potential bullish movements.
ETH/USD:
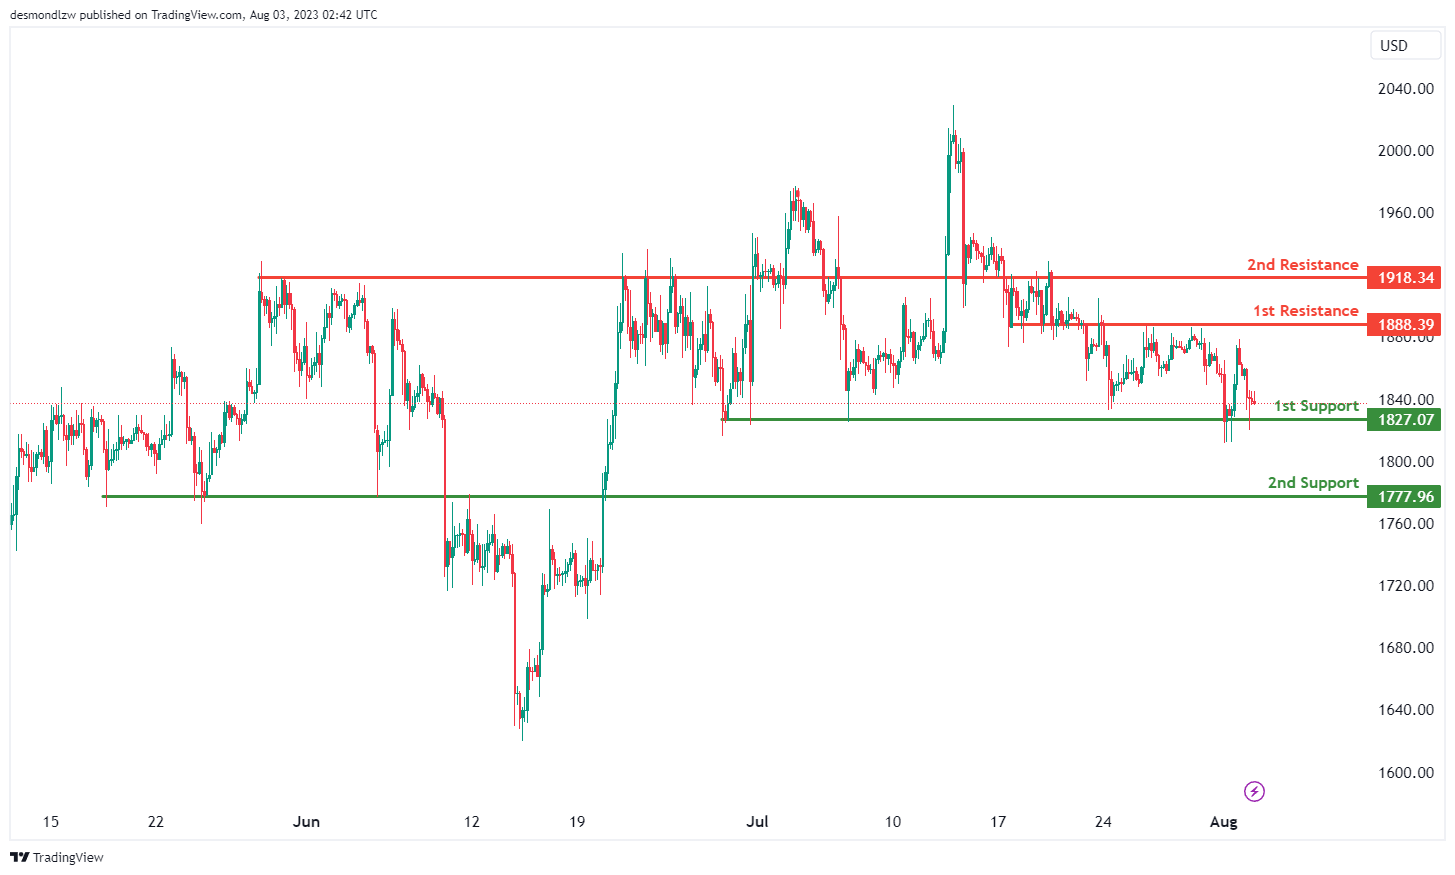
The ETH/USD instrument currently exhibits a bearish momentum, suggesting a possible bearish continuation towards the first support level at 1827.07. This support level is significant due to its role as a multi-swing low support.
Should the price descend further, the second support level at 1777.96 could come into play. This level is notable as an overlap support and may serve as a barrier to further losses.
On the upside, the first resistance level is at 1888.39. This level holds significance due to its role as an overlap resistance and could provide a challenge to bullish movements. If the price breaks past this level, it might face another hurdle at the second resistance level at 1918.34, which is also identified as an overlap resistance.
WTI/USD:
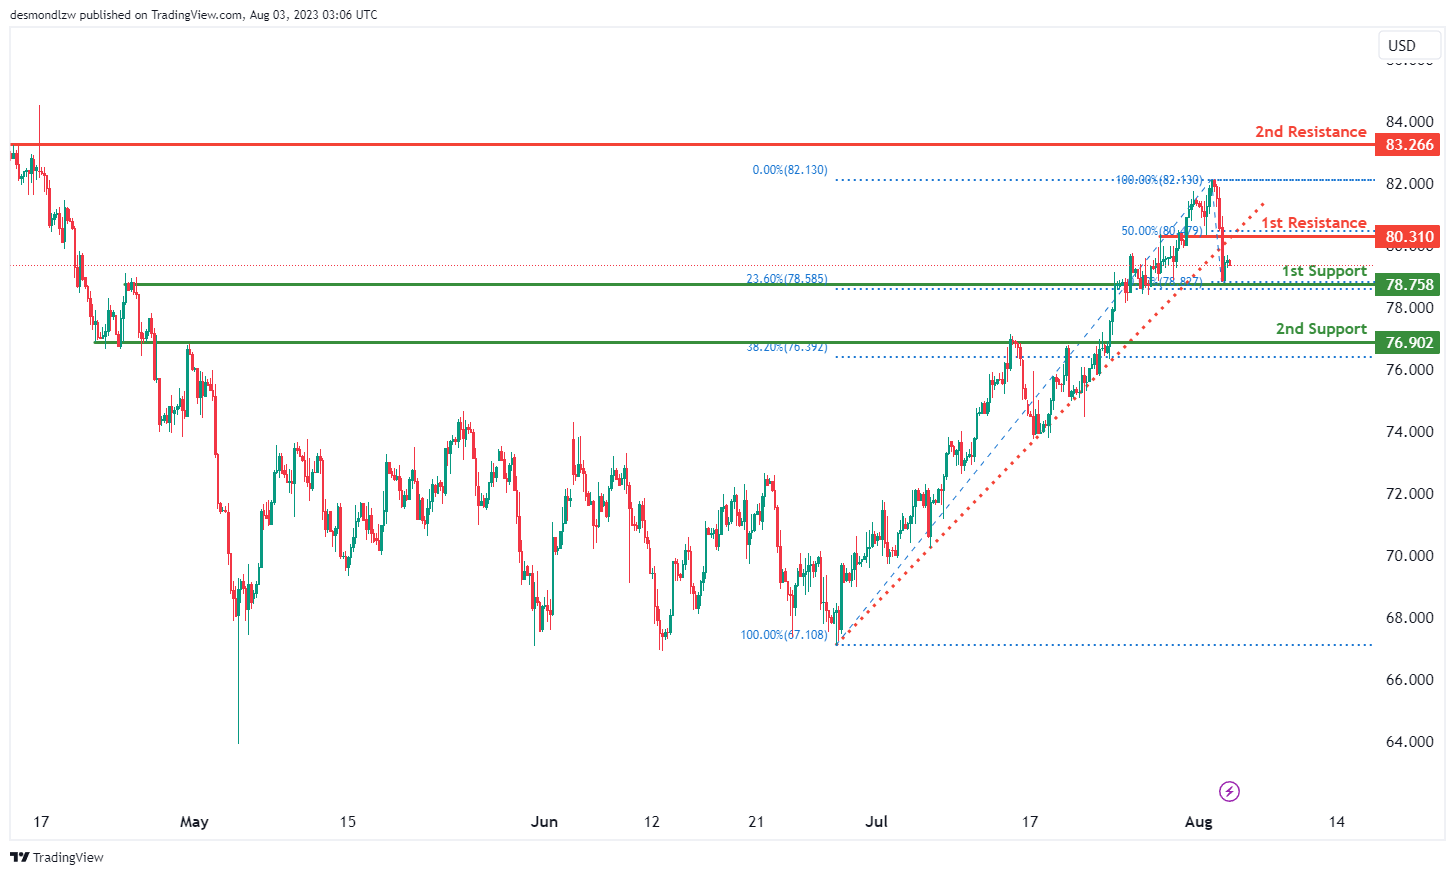
The WTI/USD chart is currently exhibiting a bearish momentum on the chart, primarily influenced by its recent break below an ascending support line. This break has triggered the potential for a bearish move in the market.
As a result of this bearish momentum, the price could possibly continue its downward trajectory, heading towards the first support level located at 78.76. This support level holds significant weight due to its role as a pullback support, complemented by its alignment with a 23.60% Fibonacci retracement level.
In addition to the first support, there is a second support level at 76.91, which gains strength from its identity as an overlap support and its association with a 38.20% Fibonacci retracement level.
On the flip side, the market faces resistance levels that could impede any upward movement. The first resistance, situated at 80.31, is reinforced by its status as an overlap resistance and its alignment with a 50.00% Fibonacci retracement level. Lastly, the second resistance, found at 83.27, is noteworthy for being a multi-swing high resistance point.
XAU/USD (GOLD):
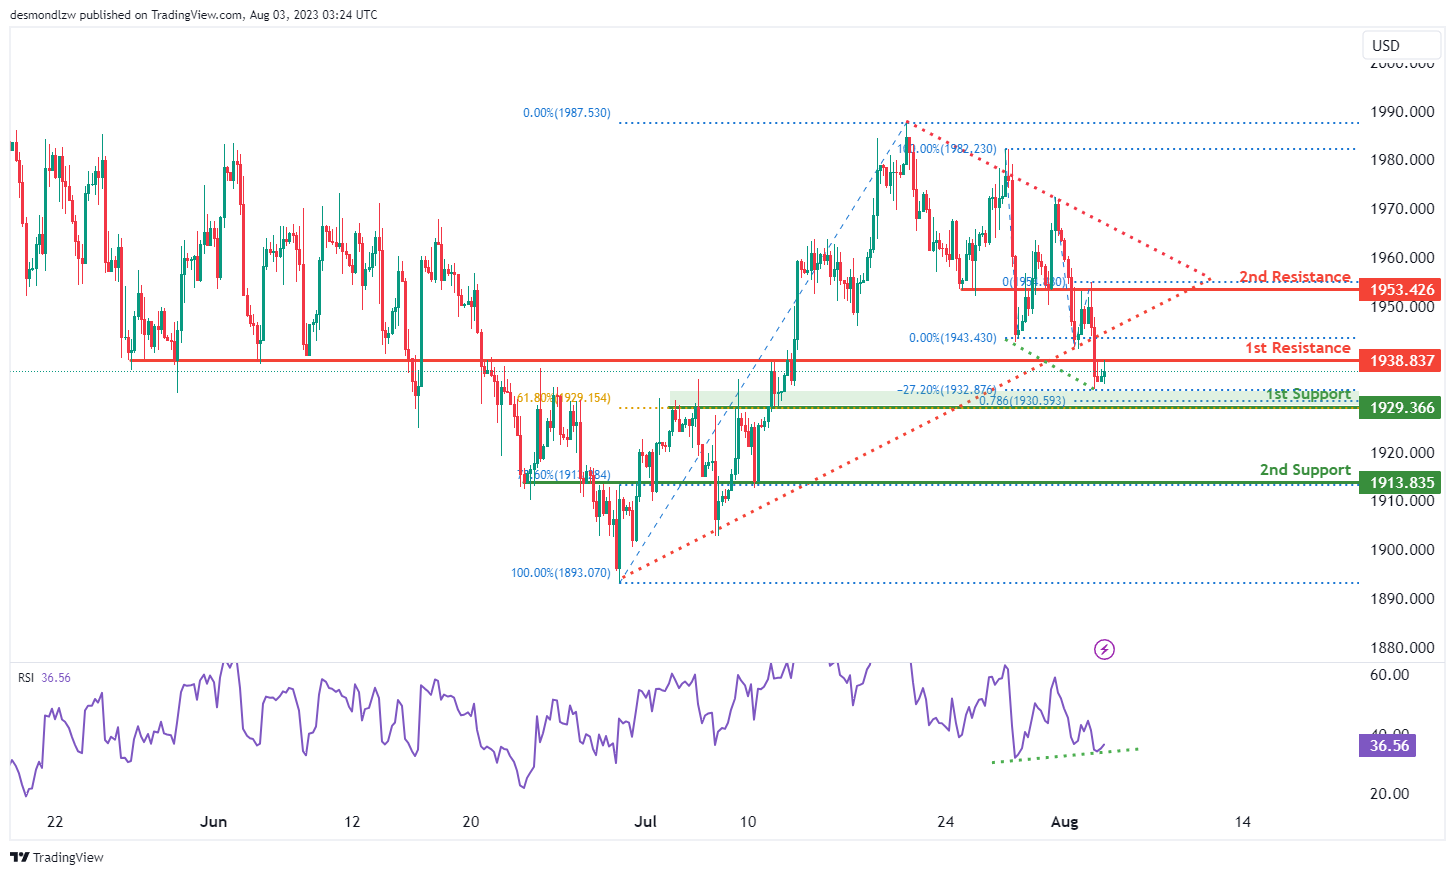
Gold (XAU/USD) is currently experiencing a bearish trend, accentuated by the price breaking below an ascending support line, suggesting potential bearish movements. The expectation is for the bearish trend to continue towards the first support level at 1929.37. This support level is significant because it serves as a pullback support and aligns with both the 61.80% Fibonacci retracement and 78.60% Fibonacci projection levels, indicating a Fibonacci confluence.
Should the price drop even further, the second support level at 1913.84, functioning as an overlap support, aligns with the 78.60% Fibonacci retracement level, and may limit further losses.
In case of a price rebound, the first resistance level is at 1938.84, recognized as an overlap resistance, which could pose a challenge. Beyond that, the second resistance level is at 1953.43, another overlap resistance, which may offer additional resistance to upward movement.
Additionally, the Relative Strength Index (RSI) is displaying a bullish divergence compared to the price, suggesting a potential bounce in the near future.
NZD/USD Settles Below Key Support, More Losses Ahead?
Key Highlights
- NZD/USD is gaining bearish momentum below the 0.6120 support.
- A major bearish trend line is forming with resistance near 0.6140 on the 4-hour chart.
- EUR/USD is moving lower below the 1.0920 support level.
- The USD ISM Services Index could decline from 53.9 to 53.0 in July 2023.
NZD/USD Technical Analysis
The New Zealand Dollar started a fresh decline from the 0.6400 zone against the US Dollar. NZD/USD declined below the 0.6320 and 0.6250 support levels.
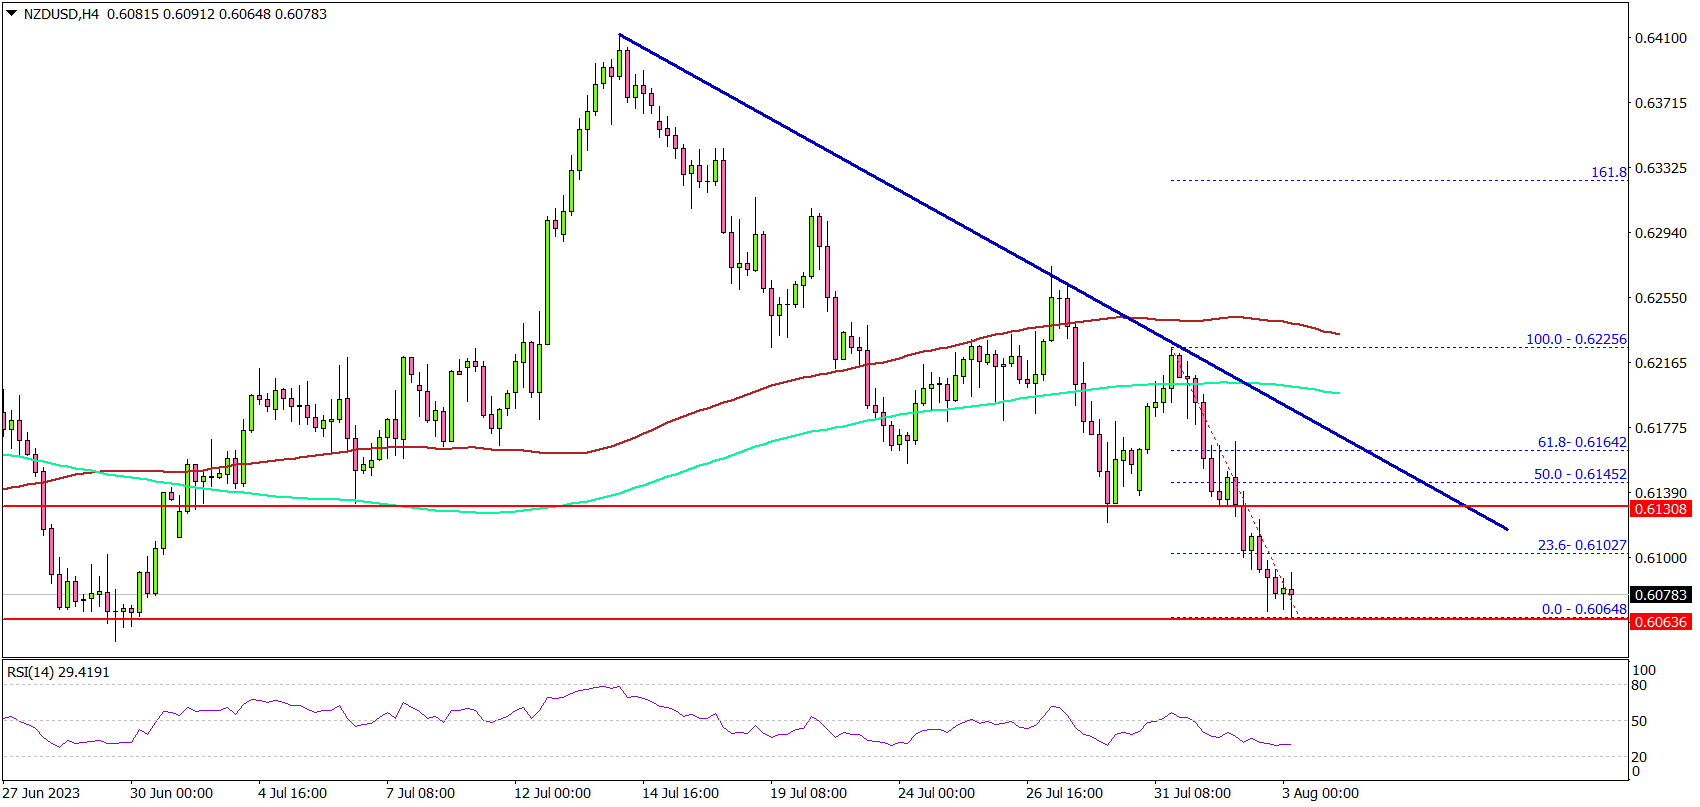
Looking at the 4-hour chart, the pair gained bearish momentum after it broke the 0.6120 support. There was a close below the 0.6100, the 100 simple moving average (red, 4 hours), and the 200 simple moving average (green, 4 hours).
The pair is now consolidating near the 0.6065 zone. A downside break and close below the 0.6065 zone could set the pace for a sustained decline.
The next major support is near 0.6000, below which NZD/USD could slide toward the 0.5950 zone. On the upside, the pair is facing resistance near the 0.6100 level.
The first major resistance is near 0.6120. There is also a major bearish trend line forming with resistance near 0.6140 on the same chart. A close above the 0.6740 resistance could push the pair toward 0.6200 or the 100 simple moving average (red, 4 hours). Any more gains could start a fresh increase toward the 0.6250 level.
Looking at EUR/USD, the pair is moving lower and there is a risk of more downsides below the 1.0900 level in the near term.
Economic Releases
- US ISM Services Index for July 2023 – Forecast 53.0, versus 53.9 previous.
- US Initial Jobless Claims - Forecast 227K, versus 221K previous.
- BoE Interest Rate Decision - Forecast 5.25%, versus 5.0% previous.