

Sample Category Title
GBPJPY Battles With 50-SMA after Violating Crucial Trendline
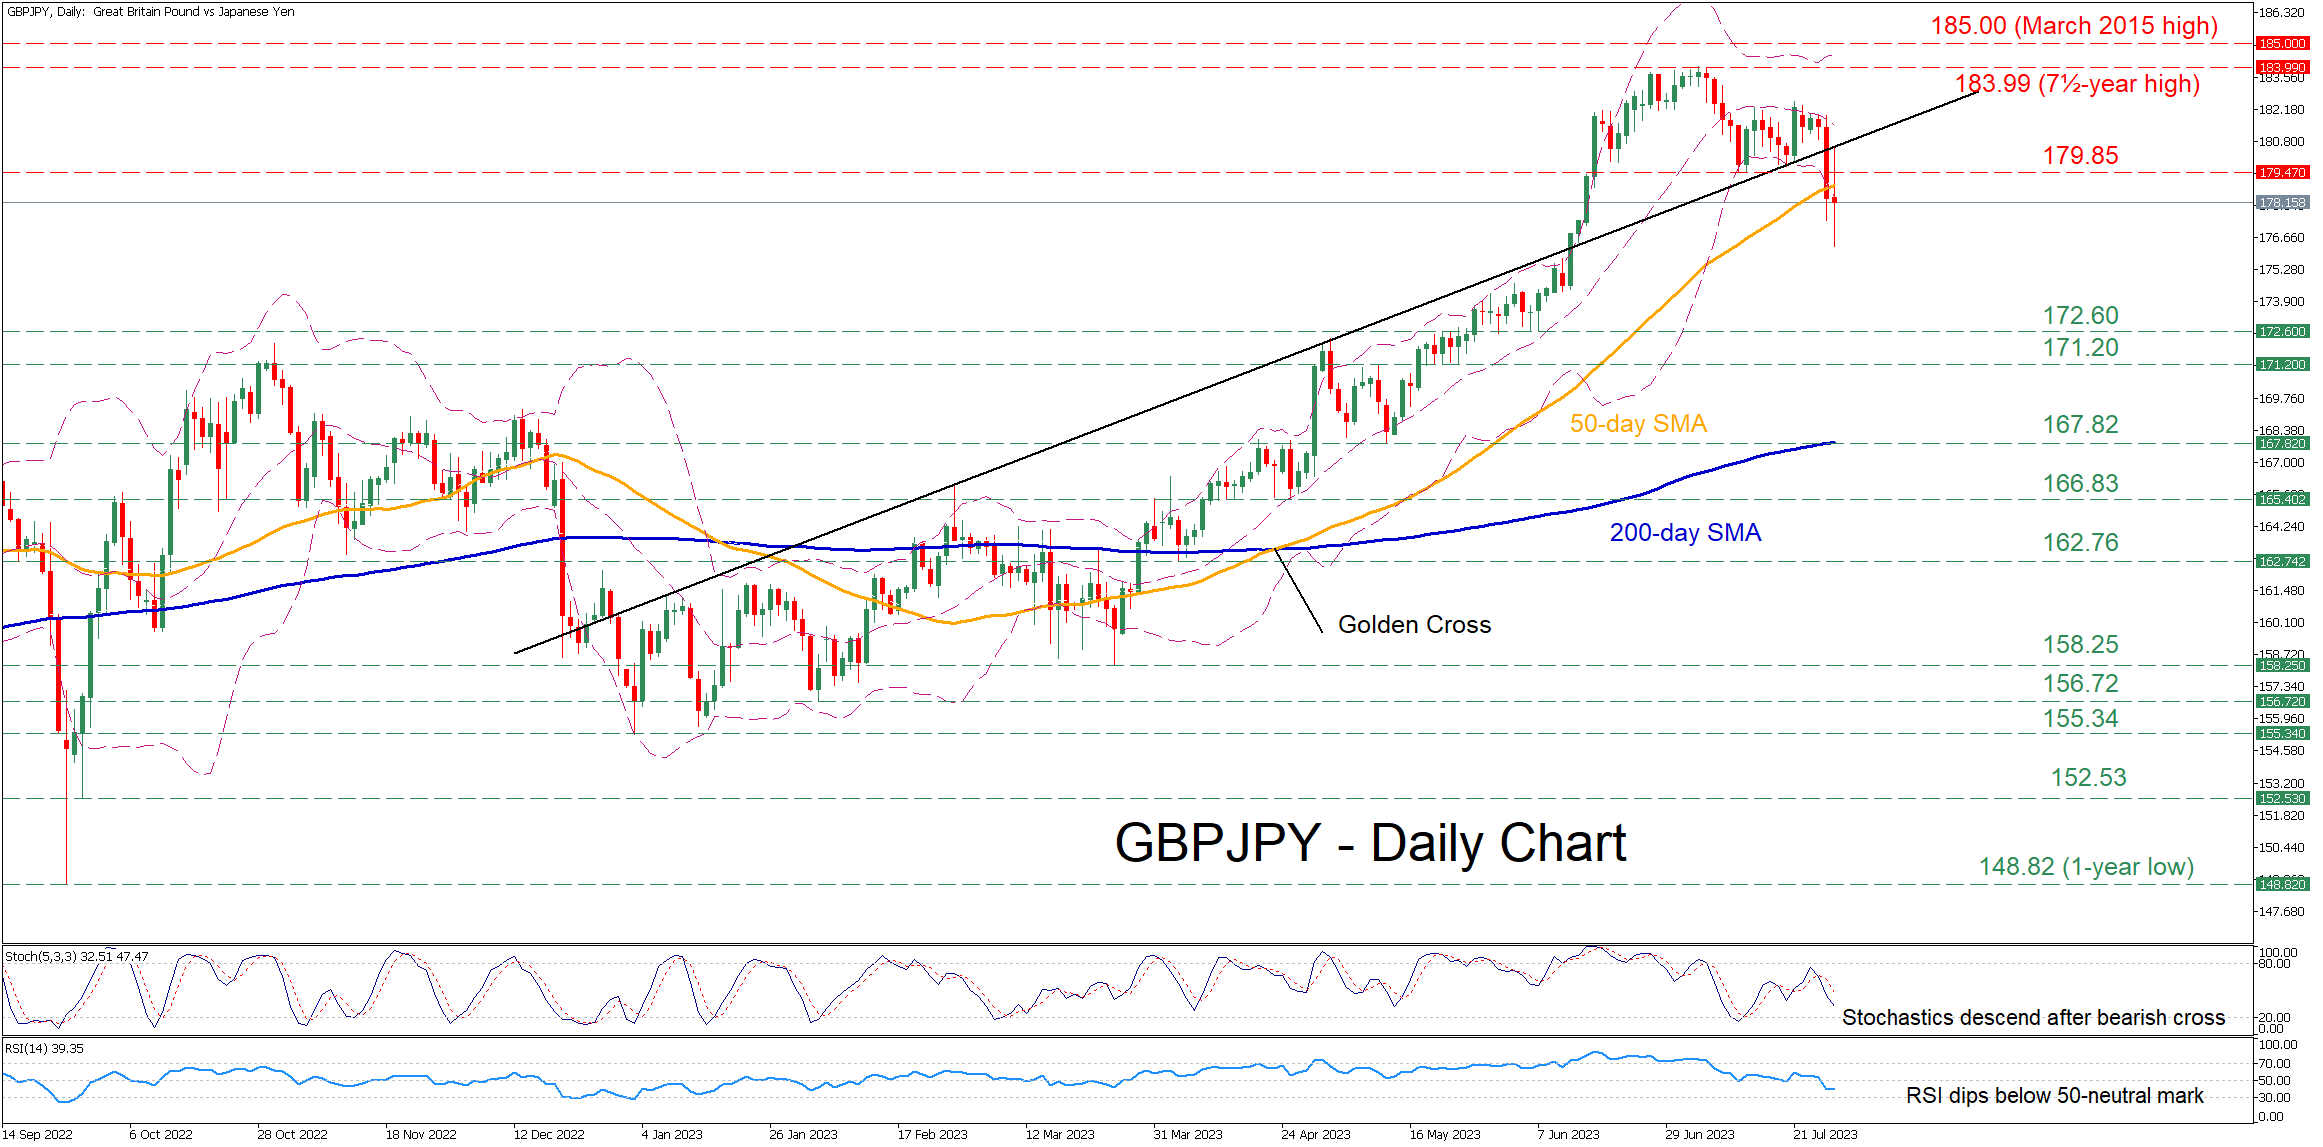
GBPJPY had been stuck in a prolonged uptrend since the beginning of the year, generating a structure of consecutive multi-year highs. However, the pair has been experiencing a downside correction in the short term after posting a fresh 7½-year peak of 183.99, with the price breaching a crucial ascending trendline.
The momentum indicators currently suggest that bearish forces are intensifying. Specifically, the stochastic oscillator is descending after posting a bearish cross, while the RSI dipped below its 50-neutral mark.
If selling interest persists and the pair drops beneath its 50-day simple moving average (SMA), the June low of 172.60 could provide initial downside protection. Breaking below that zone, the price might face the May support of 171.20 before 167.82 gets tested. A violation of the latter could open the door for 166.83, which acted as both resistance and support during 2023.
Alternatively, should the price reverse back higher, the bulls could attack the recent support zone of 179.85, which could serve as resistance in the future. Piercing through that wall, the pair could attempt to jump above the upward sloping trendline that connects its higher highs since January before the 7½-year high of 183.99 comes under examination. Even higher, the March 2015 peak of 185.00 may curb further advances.
In brief, GBPJPY has been undergoing a strong pullback, which intensified after the pair dipped below the ascending trendline. Hence, a clear close beneath the 50-day SMA could ignite more selling interest.
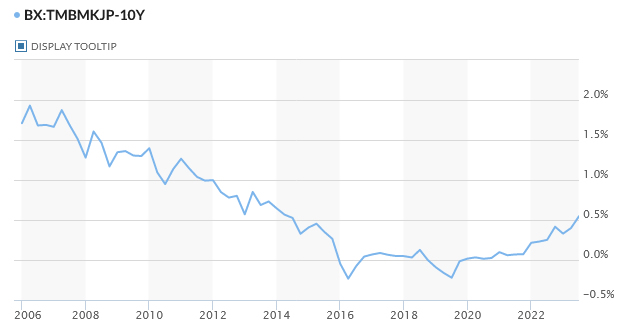
BoJ Ueda: We will not tolerate 10-year JGB yield above 1%
At the post-meeting press conference, BoJ Governor Kazuo Ueda explained the details of the changes on monetary policy announced today. That includes explaining the decision to buy 10-year JGB yields at 1% in fixed-rate operations, an increase from the previous rate of 0.5%.
"We will not tolerate an increase in the 10-year bond yield above 1% and will step in if it does," Ueda emphasized. While yield moves between 0.5% and 1%, BoJ will monitor the yield level, pace of change, and speed, and conduct various market operations to counter any excessive upward pressure on long-term interest rates.
He added, "We don't expect the yield to move up to 1%, but have set this cap as a pre-emptive measure."
Turning to inflation, Ueda confessed to underestimating the upward pressure on prices, leading to a significant upward revision of the inflation forecast for the current fiscal year. He noted that many board members perceive risks as skewed to the upside amid high uncertainty over the outlook.
Speaking on the Yield Curve Control (YCC), Ueda warned,"It would be pretty tough to deal with upside (inflation) risks once they materialise". Given the current stability in the bond market and high uncertainty over the outlook, he termed this as a fitting moment to adjust the policy framework.
But Ueda also reiterated the bank's unchanged view on the significant distance to achieving their price target as a trend and the appropriateness of maintaining an easy monetary policy. "As for what we will do ahead, if inflation overshoots, we will respond appropriately," he assured.
Bank of Japan Unexpectedly Made an Admittedly Little Tweak to Yield Curve Control
Markets
After a benign market reaction on Fed decision day, markets yesterday showed quite some volatile swings. This was both due to ECB communication but also result of the market interpreting strong US data in the light the Fed’s data dependency. Data dependency also became the ECB’s new mantra. The bank as expected raised its policy rates by 25 bps, bringing the depo rate to 3.75%. The ECB still sees inflation as remaining too high for too long. However, improvement is visible. The bank repeated it will set interest rates at a sufficiently restrictive level for as long as necessary. However, whether this will result in additional rate hikes (in September or later) will be fully depended on the incoming data. The shift to an open minded approach initially triggered a sharp decline in EMU yields, but most of this move was reversed later, partially due to global/US market moves. German yields closed between 3.8 bps lower for the 2-y yield while the 30-y added 1.5 bps. In the US, the post-Fed calm was abruptly overthrown by a set of strong US data (Q2 GDP growth at 2.4% Q/Qa, better than expected jobless claims and solid durable goods orders). US yields started a protracted uptrend, which was reinforced by a mediocre 7-y Treasury auction and a Nikkei report that the BoJ could tweak its yield curve control. US yields added between 7.7 bps (2-y) and 12.1 bps (10-y). The latter briefly surpassed the 4.0% barrier. Equities initially gained on the combination of a perceived soft data dependency from the Fed and the ECB combined with resilient US data. However, sentiment changed after the Nikkei report on a potential change in the BoJ’s YCC policy. The Eurostoxx 50 still closed at a new cycle top (+2.33%) but US indices more than reversed initial gains (S&P 500 -0.64%). Interest rate divergence triggered a sharp USD rally especially against the likes of the euro. EUR/USD tumbled from an intraday peak near 1.1150 to close at 1.0979. DXY jumped from the 100.60 to near 101.8. USD/JPY initially surpassed the 141 big figure post the US data but the yen jumped sharply on the aforementioned report (USD/JPY close 139.48).
Dubbed governor “Ueda’s first surprise”, the Bank of Japan this morning unexpectedly made an admittedly little tweak to its Yield Curve Control programme. The central bank loosens its grip on bond yields a bit by allowing the 10-y yield to move more flexibly around the unchanged 0% +/- 50 bps cap. In the recent past, the central bank intervened as soon as the 10y bond yield moved above the 0.50% topside. That happened on multiple occasions amid a global core bond yield surge and rising domestic inflation. Tokyo inflation in July this morning for example came in at 3.2% with core measures above the 2% target as well. Prices ex. food rose 3%. Leaving out energy as well, inflation even accelerated to 4%. The BOJ raised the rate to 1% for its fixed-rate bond buying operations, suggesting it is willing to accept 10-year rates to move to that level. In practice this comes down to the yield cap being raised from 50 bps to 100 bps. The reason the central bank did not just do that is that it probably didn’t want to send a too hawkish signal. The new forecasts underpin this. Inflation for this FY was dramatically revised up from 1.8% to 2.5%. For next year, however, a tiny 0.1 ppt downgrade to 1.9% means inflation in theory will not reach the 2% target. The FY+2 forecast was left unchanged at 1.6%. Growth for this year was marginally revised lower to 1.3% with the projections for FY+1 and +2 left stable at 1.2% and 1%. News of the possible YCC tweak was reported yesterday evening in US dealings already, triggering a yen surge already then. The Japanese currency continues to appreciate this morning, with USD/JPY in volatile trading currently hovering near 139. Additional euro weakness pushed EUR/JPY towards the lowest level since mid-June at 151.50 area. Japanese 10-y yields sear almost 10 bps.
The ‘tweak’ In the BOJ YCC of course is the dominant feature for trading in Asia this morning. However, the eco calendar in the US and Europe later today also has plenty of market moving potential. In the US, June spending and income data are expected to show decent growth (0.5% and 0.4%), but the focus will be on the Q2 employment cost index (expected at 1.1%). Fed chair Powell at the press conference on Wednesday mentioned this series as an important input in the Fed’s data dependent analysis. EMU member states including France, Spain, Belgium and Germany will report July CPI figures. German Y/Y HICP inflation is expected to slow to 6.6% from 6.8%, but the monthly dynamic is still seen at a strong 0.6% M/M. The move in the US market yesterday illustrated that after a soft market assessment of CB’s data dependent approach, markets are sensitive to upside surprises in data. On FX markets, a EUR/USD close below 1.1021/1.10 would deteriorate the ST technical picture.
French GDP grew strongly by 0.5% qoq, bolstered by foreign trade
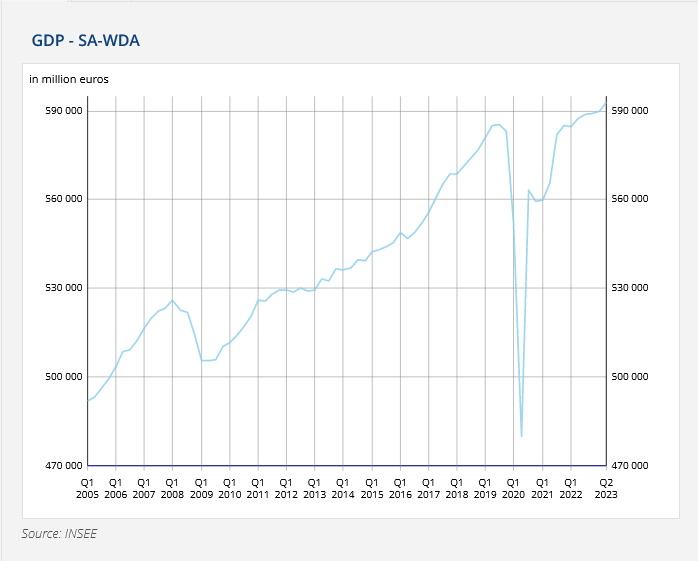
France's GDP surpassed expectations in Q2, growing by 0.5% qoq, significantly better than anticipated 0.1% qoq growth. French economy managed to outperform due to robust rebound in foreign trade activities.
According to the data, the main driver of this better-than-expected performance was the positive contribution from foreign trade, which added 0.7 points to GDP growth. Exports in particular saw a rebound this quarter, rising 2.6% after -0.8% contraction in the previous period. Meanwhile, imports also saw an increase, though less pronounced, rising by 0.4% after falling -2.0% in the prior period.
On the other hand, final domestic demand, excluding inventories, weighed on GDP growth once again, contributing a negative -0.1%, consistent with the previous quarter. This is largely attributed to a decrease in household consumption, which dropped by -0.4%. However, Gross Fixed Capital Formation (GFCF) noted a slight increase of 0.1%.
Contribution of inventory changes to GDP growth was minimally negative in Q2, at -0.1%.
Technical Outlook and Review
DXY:
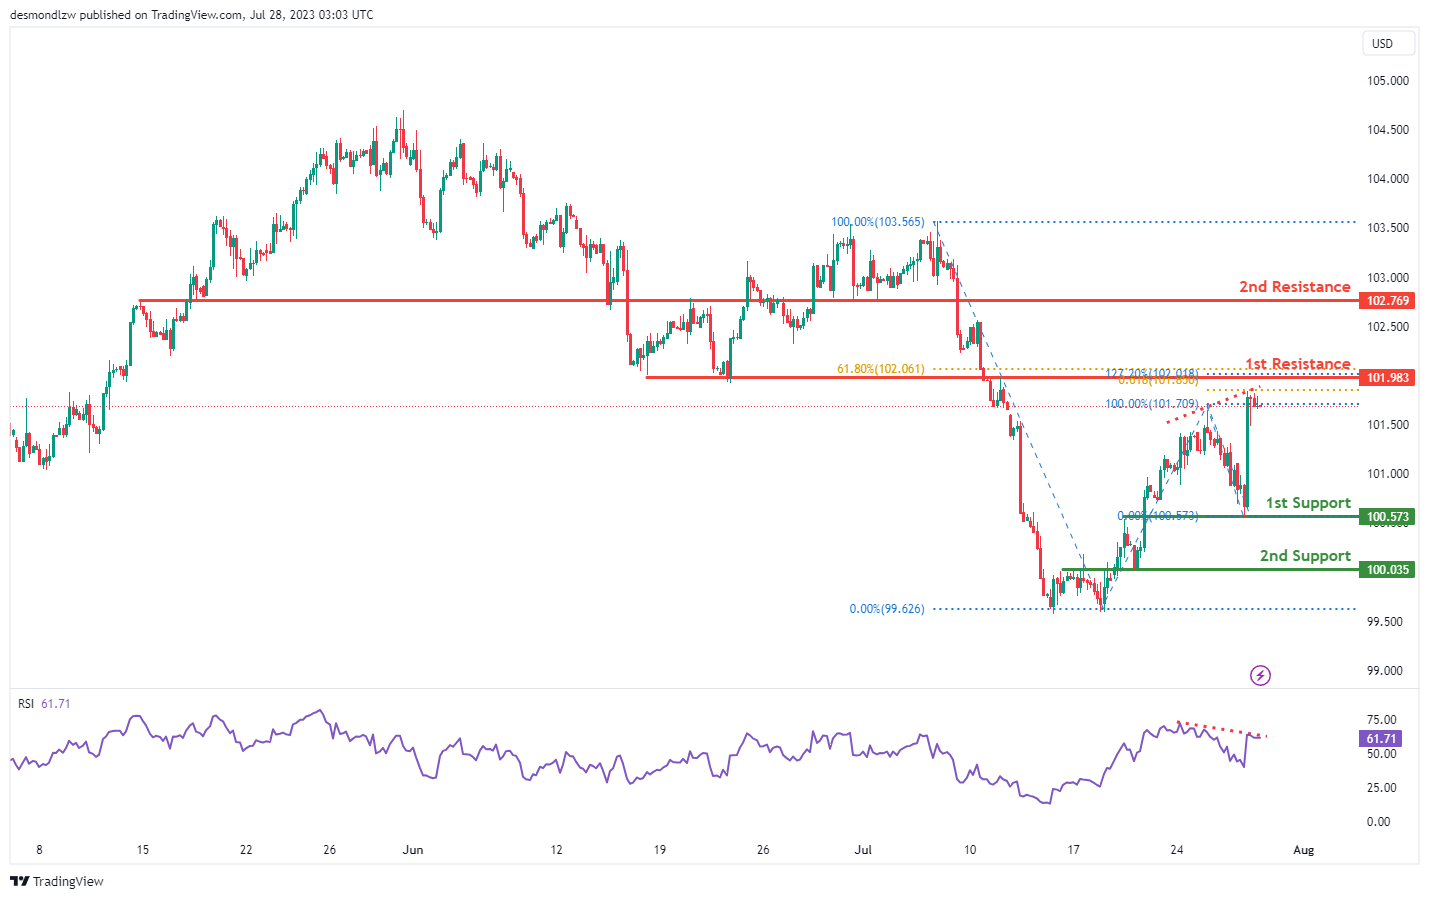
The U.S. Dollar Index (DXY) exhibits an overall bearish momentum and may potentially see a bearish reaction off the 1st resistance at 101.98, a level that is significant due to its alignment with the 61.8% Fibonacci retracement and is at the 127.2% Fibonacci extension, indicating a strong Fibonacci confluence. If this reaction occurs, the price may drop to the 1st support at 100.57, which is an overlap support level. The 2nd support level is at 100.03, another overlap that could reinforce the price floor. The 2nd resistance level is identified at 102.76, acting as a potential cap to upward movement due to its function as a pullback resistance. Notably, the Relative Strength Index (RSI) displays a bearish divergence against the price, suggesting that the bullish momentum may be weakening and a bearish price action could soon ensue.
EUR/USD:
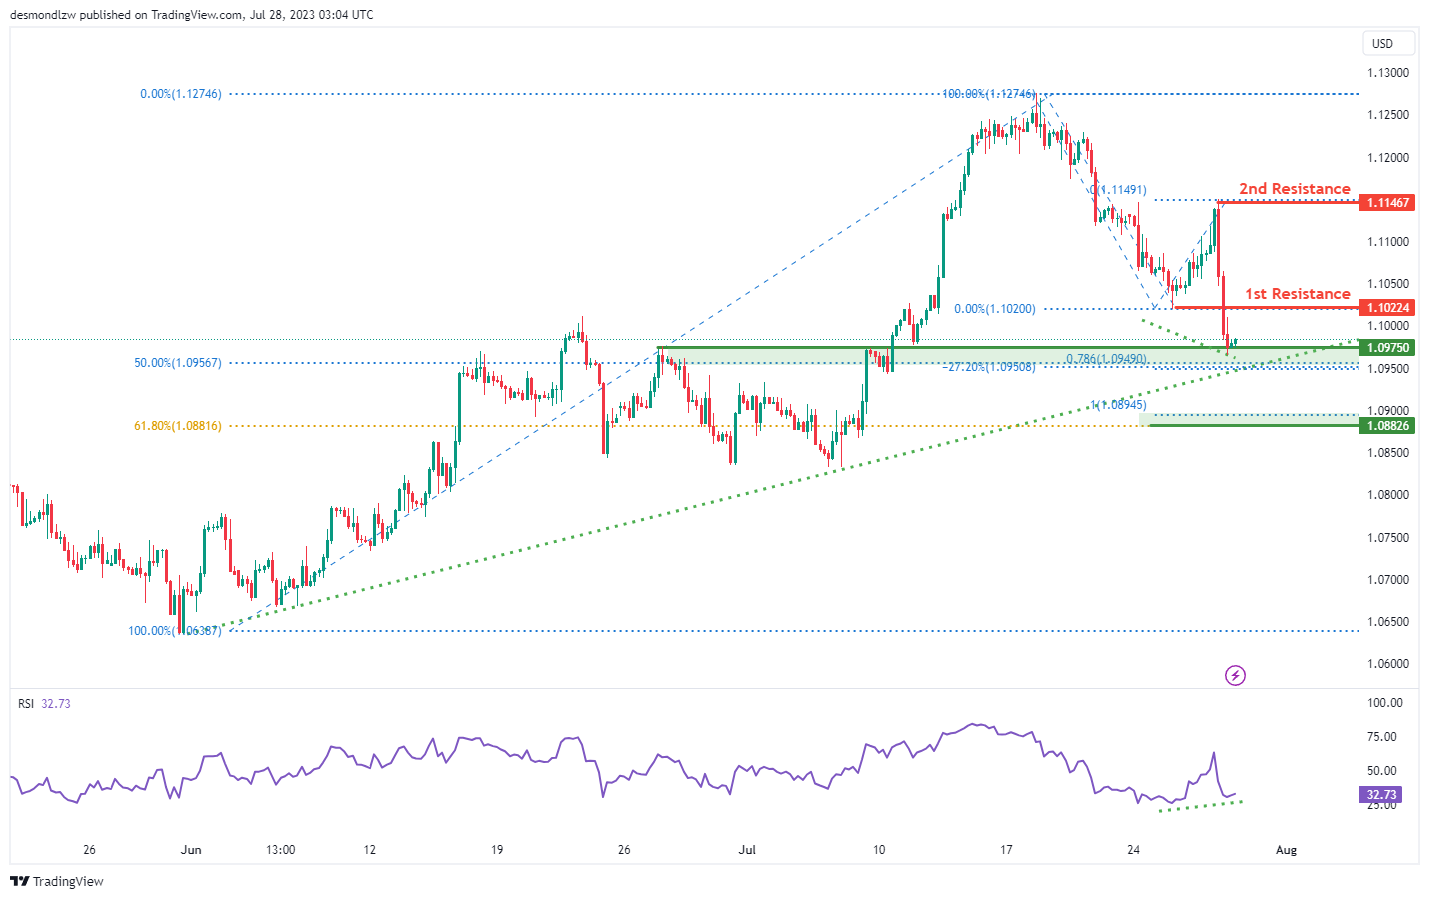
The EUR/USD currency pair exhibits a bullish momentum, with the price currently positioned above a major ascending trend line, indicating potential further bullish momentum. A potential scenario could be a bullish bounce off the 1st support level at 1.0975, moving towards the 1st resistance level. The 1st support level is significant because it aligns with the 50% Fibonacci retracement and the 78.6% Fibonacci projection, presenting a Fibonacci confluence. The 2nd support level is at 1.0882, which matches the 100% Fibonacci projection and the 61.8% Fibonacci retracement, indicating another Fibonacci confluence.
On the upside, the 1st resistance level is found at 1.1022, serving as a pullback resistance. The 2nd resistance is at 1.1146, which marks a swing high resistance.
Worth noting is the Relative Strength Index (RSI) which is displaying bullish divergence versus the price, suggesting that a bullish bounce might occur soon.
EUR/JPY:
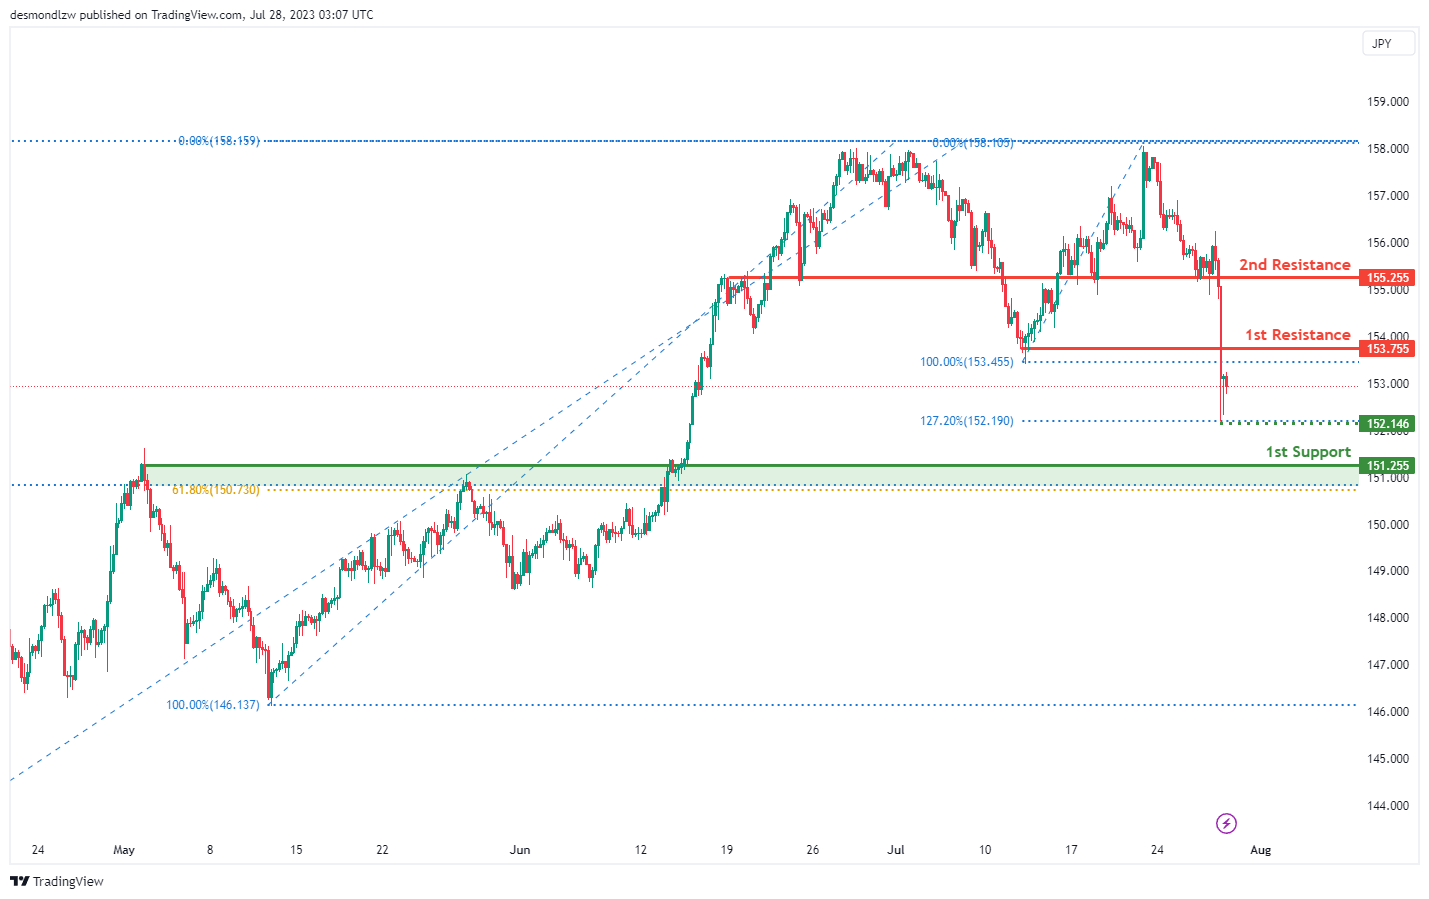
The EUR/JPY currency pair is currently showing a bearish momentum. It’s likely that the price could continue on a bearish trajectory towards the 1st support level at 151.25. This level serves as a pullback support and aligns with the 61.8% Fibonacci retracement, making it a strong potential turning point.
The intermediate support level is at 152.14, marking a swing low support and aligning with the 127.2% Fibonacci extension, providing further potential support for the price.
Looking upwards, the 1st resistance level is at 153.75, acting as a pullback resistance. A further advance in price could meet the 2nd resistance level at 155.25, which also serves as a pullback resistance. Both resistance levels could potentially halt the bullish momentum of the price.
EUR/GBP:
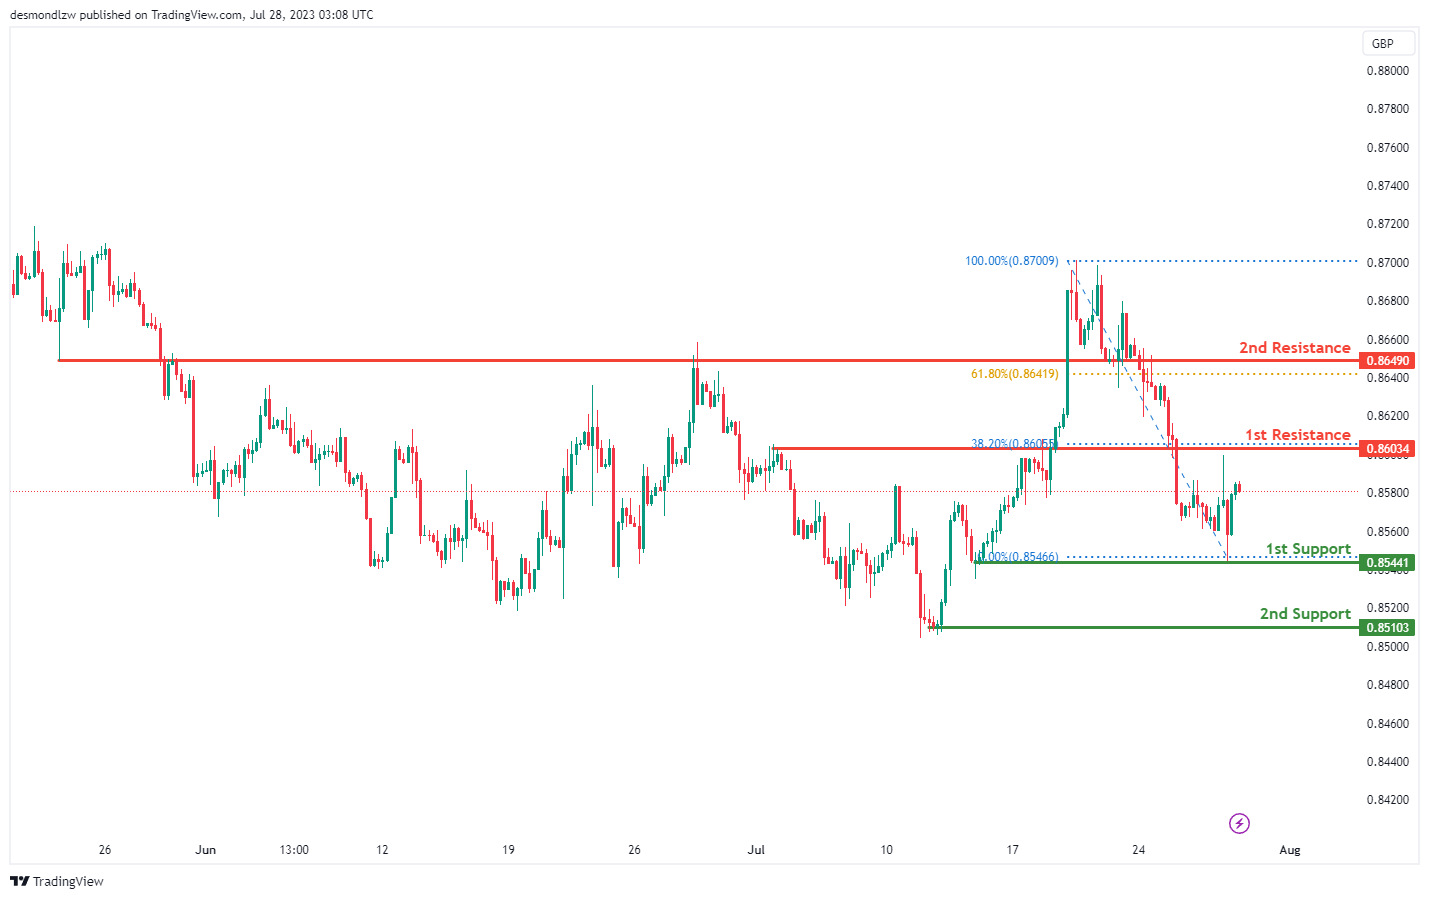
The EUR/GBP currency pair is currently showing bullish momentum. As a result, the price could continue to rise towards the 1st resistance level at 0.8603, which is seen as an overlap resistance.
The 1st support level is at 0.8544, offering a potential floor as it’s a swing low support. If the price falls further, the 2nd support level is at 0.8510, which is seen as a multi-swing low support. Both these levels could potentially halt a bearish momentum in the price.
On the upside, beyond the 1st resistance, there is a 2nd resistance level at 0.8510, acting as a multi-swing high resistance. This level could potentially impede further price increases.
GBP/USD:
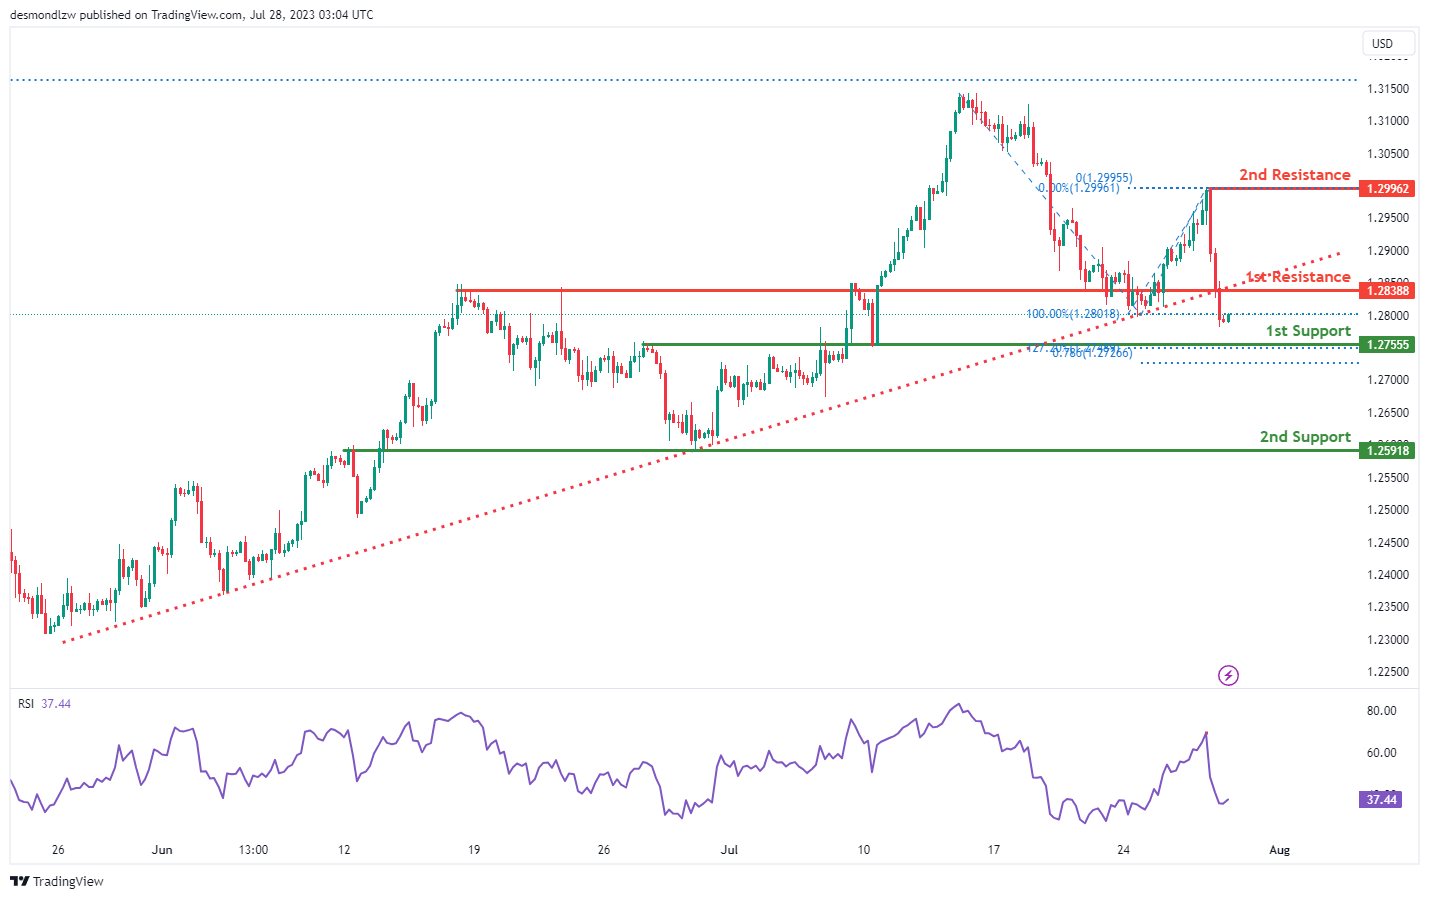
The GBP/USD currency pair presently demonstrates a bearish trend. It’s currently positioned below a significant descending trend line, suggesting that there might be a potential extension of the bearish momentum.
The price is likely to continue its bearish course towards the 1st support level, which is situated at 1.2755. This level is considered a key overlap support, which may potentially halt the price decline in the short term.
If the bearish momentum continues to persist and the price breaches the 1st support, the 2nd support level at 1.2591, which is another overlap support, could provide an additional level of security against a continued downtrend.
On the upside, if a reversal in momentum occurs, the 1st resistance level to watch is at 1.2838, which is categorized as a pullback resistance. This could provide an initial obstacle to any bullish movement.
Further up, the 2nd resistance level is observed at 1.2996. This level, known as a swing high resistance, could prove to be a substantial challenge to the price advancement.
GBP/JPY:
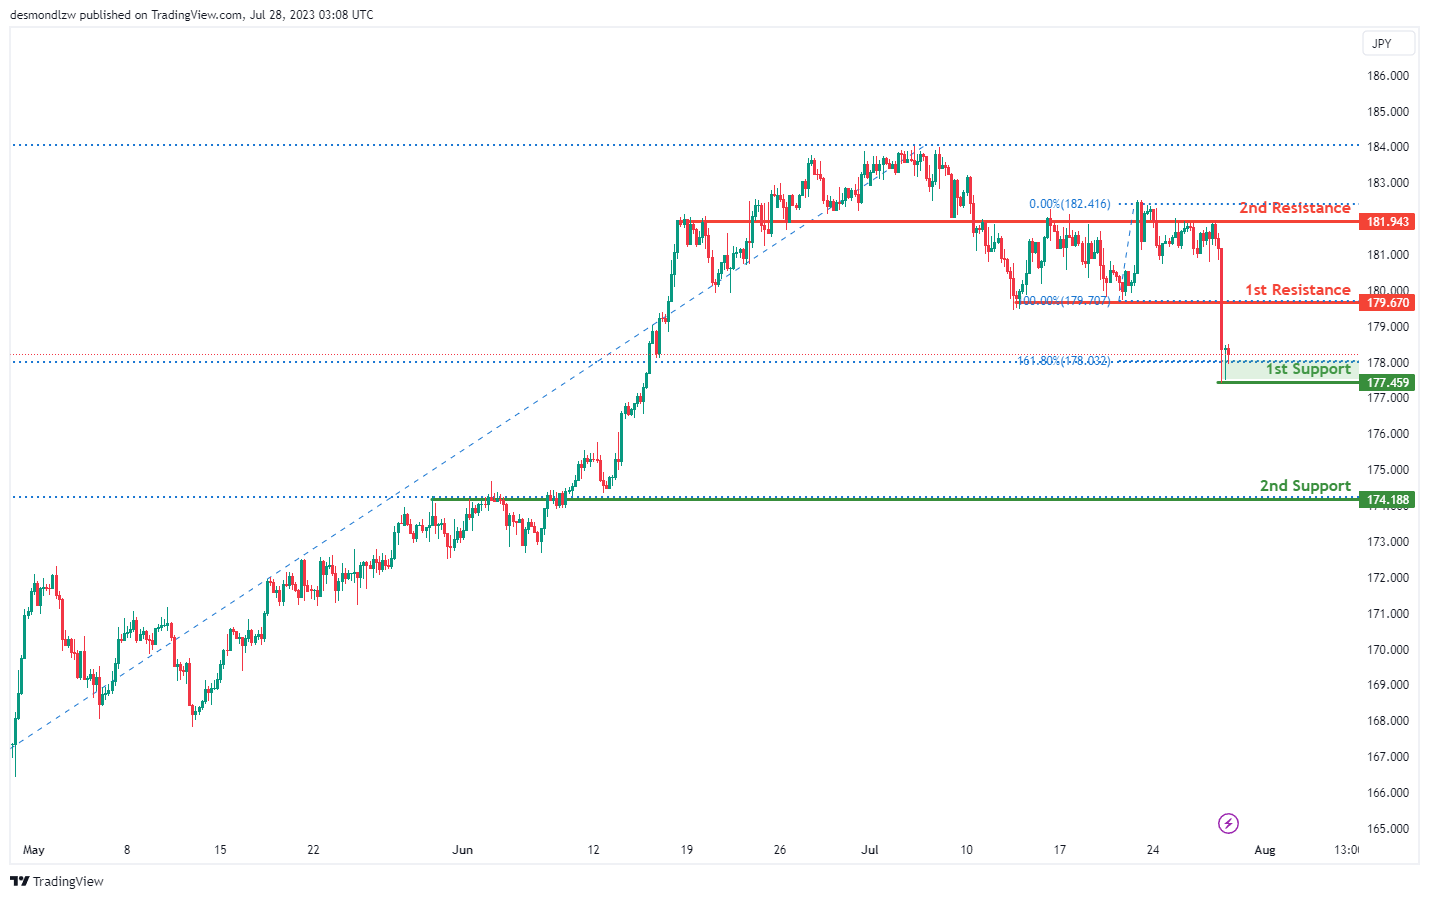
The GBP/JPY currency pair currently exhibits a bullish momentum. Given this dynamic, the price might bounce off the 1st support and make a move towards the 1st resistance.
The 1st support level is at 177.45 and it stands out due to its historical significance as a multi-swing low support. The support level also coincides with the 161.80% Fibonacci Extension and the 23.60% Fibonacci Retracement, indicating a Fibonacci confluence, which could provide a robust foundation for price support.
Should the price break below this level, the 2nd support comes into play at 174.18. This level serves as an overlap support and aligns with the 38.20% Fibonacci Retracement, which could provide additional defence against a more significant price decline.
On the upside, the initial hurdle for any bullish movement is the 1st resistance at 179.67, which is categorised as a pullback resistance.
Further up, the 2nd resistance is found at 181.94. This overlap resistance could pose a considerable challenge to the upward price movement.
USD/CHF:
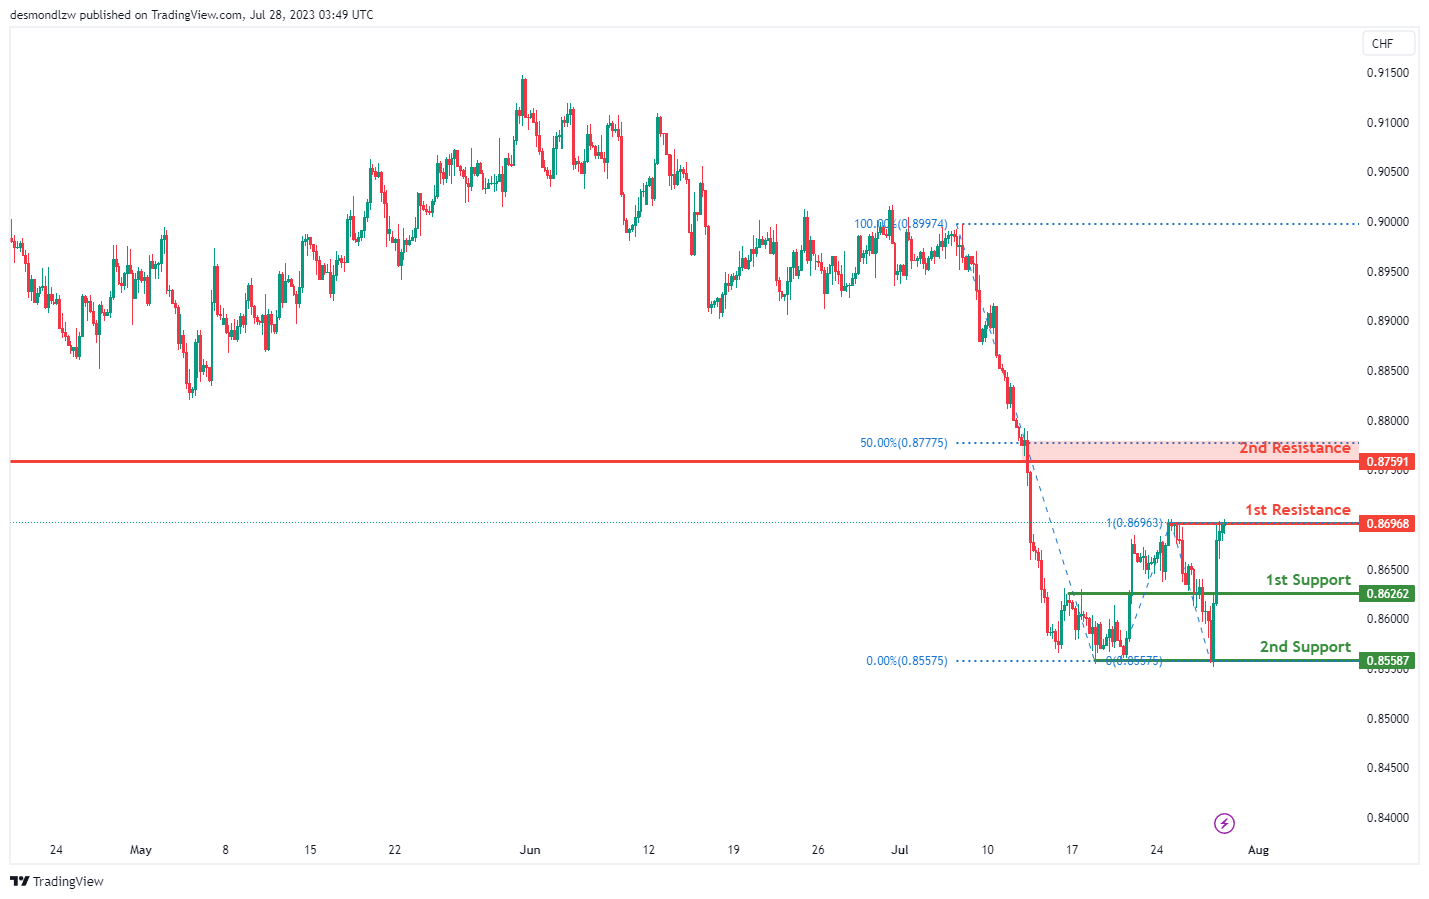
The USD/CHF currency pair is currently experiencing a bearish momentum. As such, it’s anticipated that we might see a bearish reaction off the 1st resistance level leading to a decline towards the 1st support level.
The 1st support level is identified at 0.8626, recognized as a pullback support. This area could provide a certain level of stabilization for the price in case of a downward movement.
If the price goes further down, the 2nd support is at 0.8558. This level has been acting as a multi-swing low support, indicating that it is a significant barrier that could potentially hinder further price depreciation.
On the upside, the 1st resistance level is at 0.8696. This level has acted as a multi-swing high resistance and aligns with the 100% Fibonacci Projection, reinforcing its importance.
Should the price manage to break above this, the 2nd resistance level at 0.8759 comes into play. This level functions as a pullback resistance and coincides with the 50% Fibonacci Retracement, making it a significant hurdle for the price to overcome.
USD/JPY:
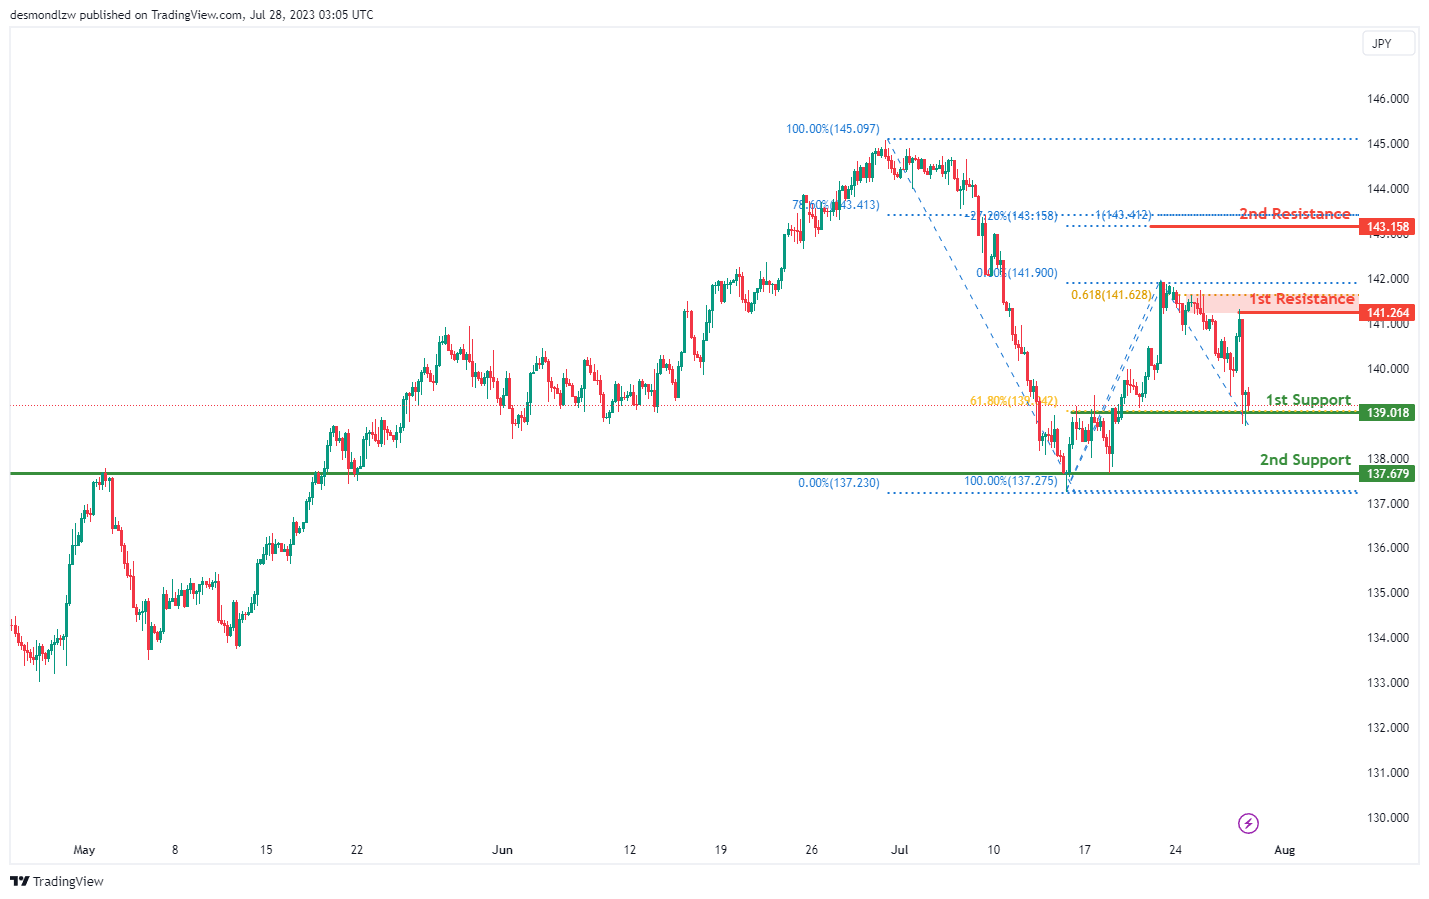
The USD/JPY currency pair is currently experiencing a bullish momentum. Traders can expect a potential bullish bounce off the 1st support level, leading the price towards the 1st resistance level.
The 1st support level is at 139.01, which is considered a significant level due to its nature as an overlap support, combined with its alignment with the 61.80% Fibonacci retracement level. This position indicates that the price may experience a bounce at this point.
In case the price breaks below this level, the 2nd support at 137.67, another overlap support, becomes relevant. This level could further halt the bearish progression.
On the upside, the 1st resistance level is at 141.26, which has served as a multi-swing high resistance in the past and aligns with the 61.80% Fibonacci projection. This level can be seen as a potential barrier to bullish progression.
If the price manages to surpass this level, the next target is the 2nd resistance at 143.15. This level aligns with the 78.60% Fibonacci retracement and the -27% Fibonacci expansion, indicating a Fibonacci confluence, which underscores its significance as a potential barrier.
USD/CAD:
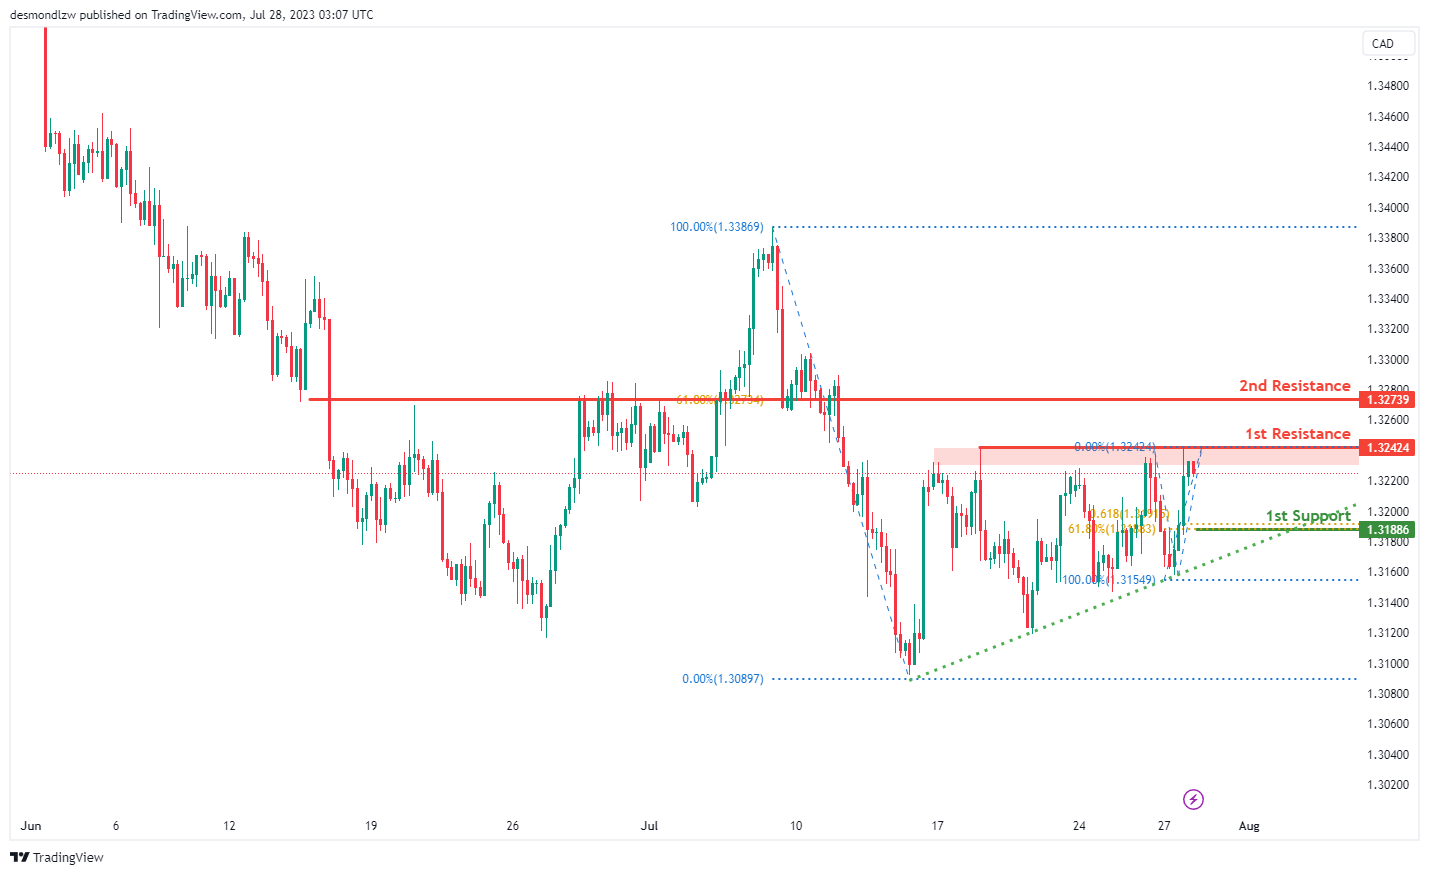
The USD/CAD chart demonstrates a bearish momentum, suggesting a potential bearish reaction off the 1st resistance level at 1.3242, which is identified as an overlap resistance.
In case of a downward movement, the 1st support at 1.3189 holds significance as it aligns with multiple factors of Fibonacci levels. These factors include being a pullback support that coincides with both the 61.80% Fibonacci retracement and the 61.80% projection levels, indicating a Fibonacci confluence. This convergence of Fibonacci levels strengthens the support’s significance.
On the upside, if the bearish reaction persists, the 2nd resistance at 1.3274 represents another important level to watch. It is identified as both an overlap resistance and coincides with the 61.80% Fibonacci retracement level, indicating its potential significance as a barrier for further upward movement.
AUD/USD:
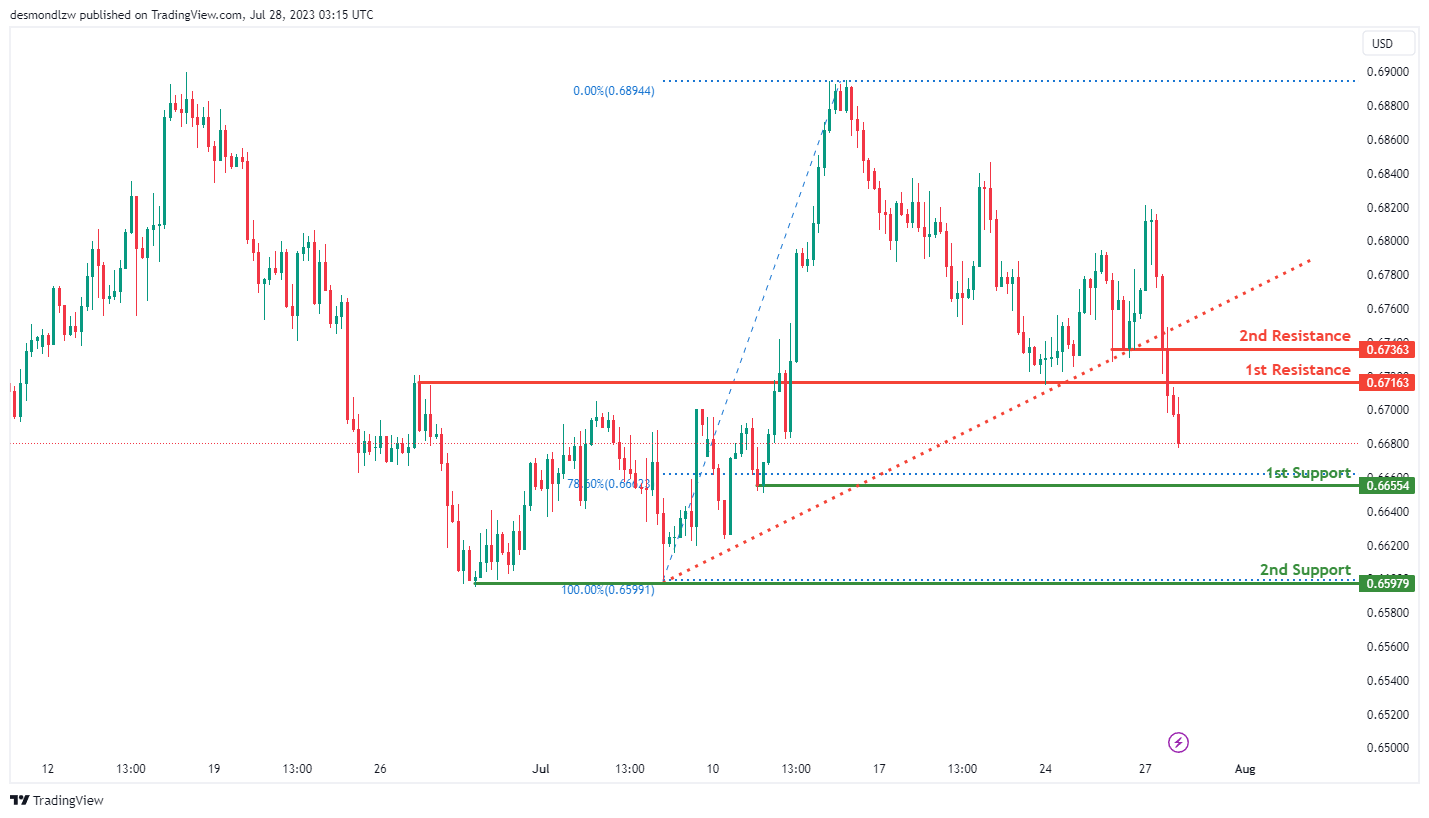
The AUD/USD chart displays a strong bearish momentum with high confidence, attributed to the price breaking below an ascending support line, indicating a potential bearish move.
A possible scenario is a bearish continuation towards the 1st support level at 0.6655, which is identified as a pullback support that aligns closely with the 78.60% Fibonacci retracement level. Should the bearish trend persist, the 2nd support at 0.6598 represents another significant level, acting as an overlap support.
On the upside, if there is any corrective move, the 1st resistance at 0.6716 is a crucial level to watch, identified as an overlap resistance. Additionally, the 2nd resistance at 0.6736 serves as another important area, acting as an overlap resistance.
NZD/USD
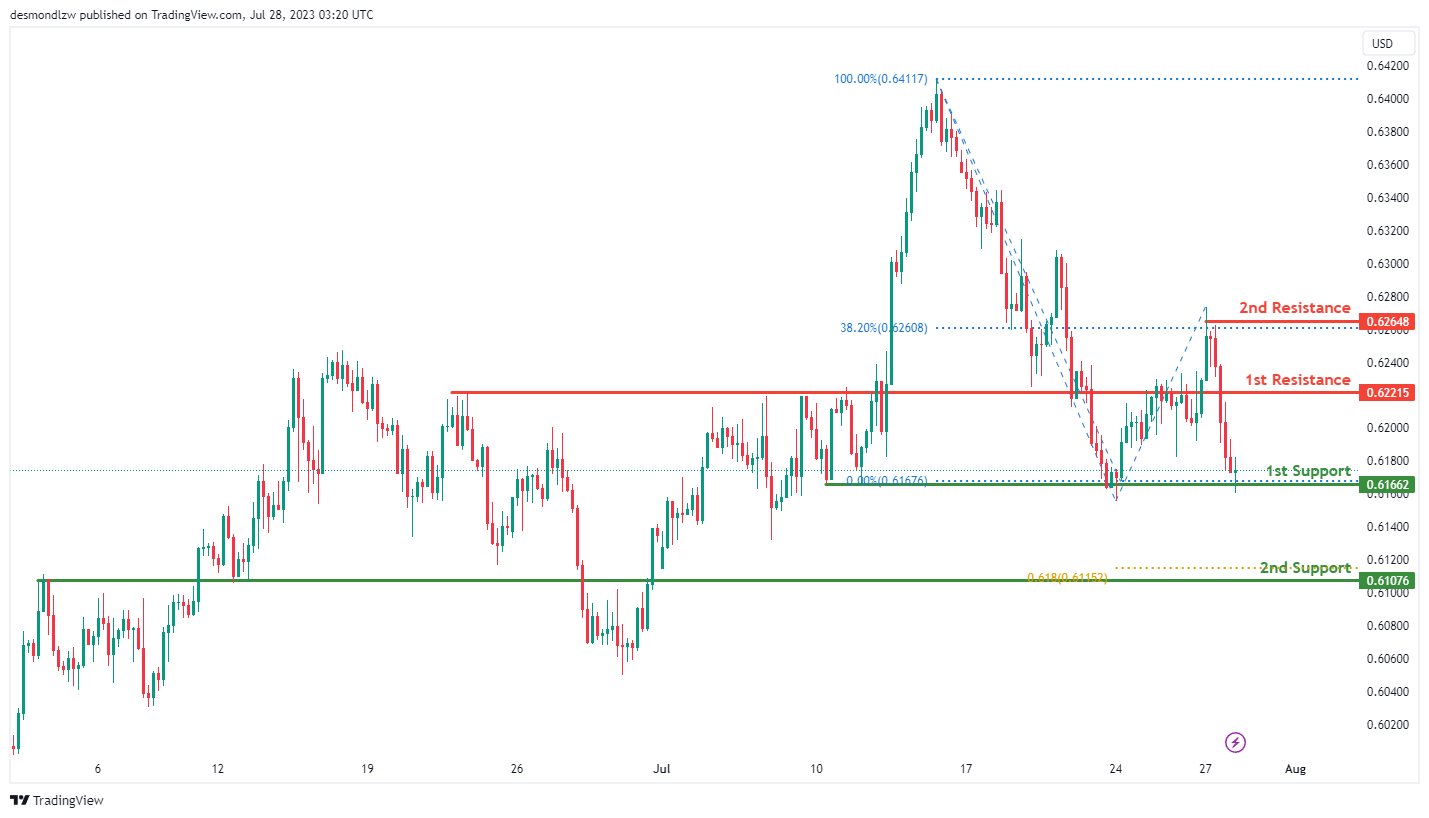
The NZD/USD chart currently demonstrates a weak bullish momentum with low confidence. A potential scenario suggests a further drop towards the 1st support level at 0.6166 in the short term, followed by a bounce from that level leading to an upward movement towards the 1st resistance at 0.6222.
The 1st support at 0.6166 is a significant area, acting as an overlap support. Furthermore, the 2nd support at 0.6108 represents another key level, serving as an overlap support and coinciding with the 61.80% Fibonacci Projection level.
On the upside, the 1st resistance at 0.6222 is a crucial level to watch, identified as an overlap resistance. Additionally, the 2nd resistance at 0.6265 is another important area, acting as a pullback resistance and coinciding with the 38.20% Fibonacci Retracement level.
DJ30:
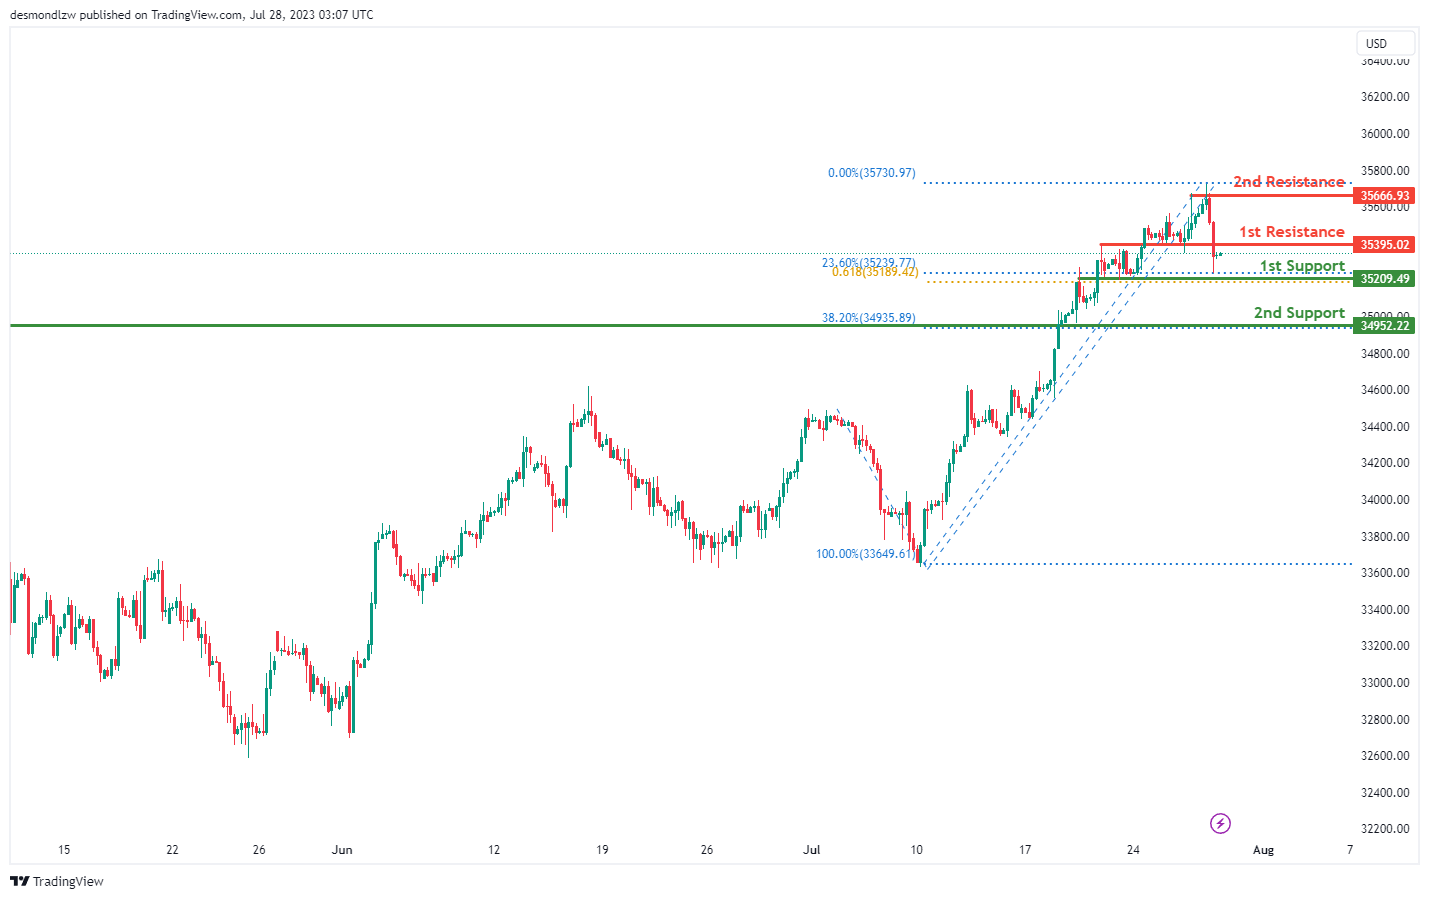
The DJ30 chart indicates a bearish momentum, suggesting a potential bearish continuation towards the 1st support at 35209.49. This support level is significant as it represents an overlap support, aligned with the 23.60% Fibonacci retracement and the 61.80% Fibonacci projection levels, indicating a Fibonacci confluence.
Moreover, the 2nd support at 34952.22 serves as another important area, acting as an overlap support and coinciding with the 38.20% Fibonacci retracement level.
On the upside, the 1st resistance at 35395.02 is a significant level, representing an overlap resistance. Additionally, the 2nd resistance at 35666.93 is another key area, functioning as an overlap resistance.
GER30:
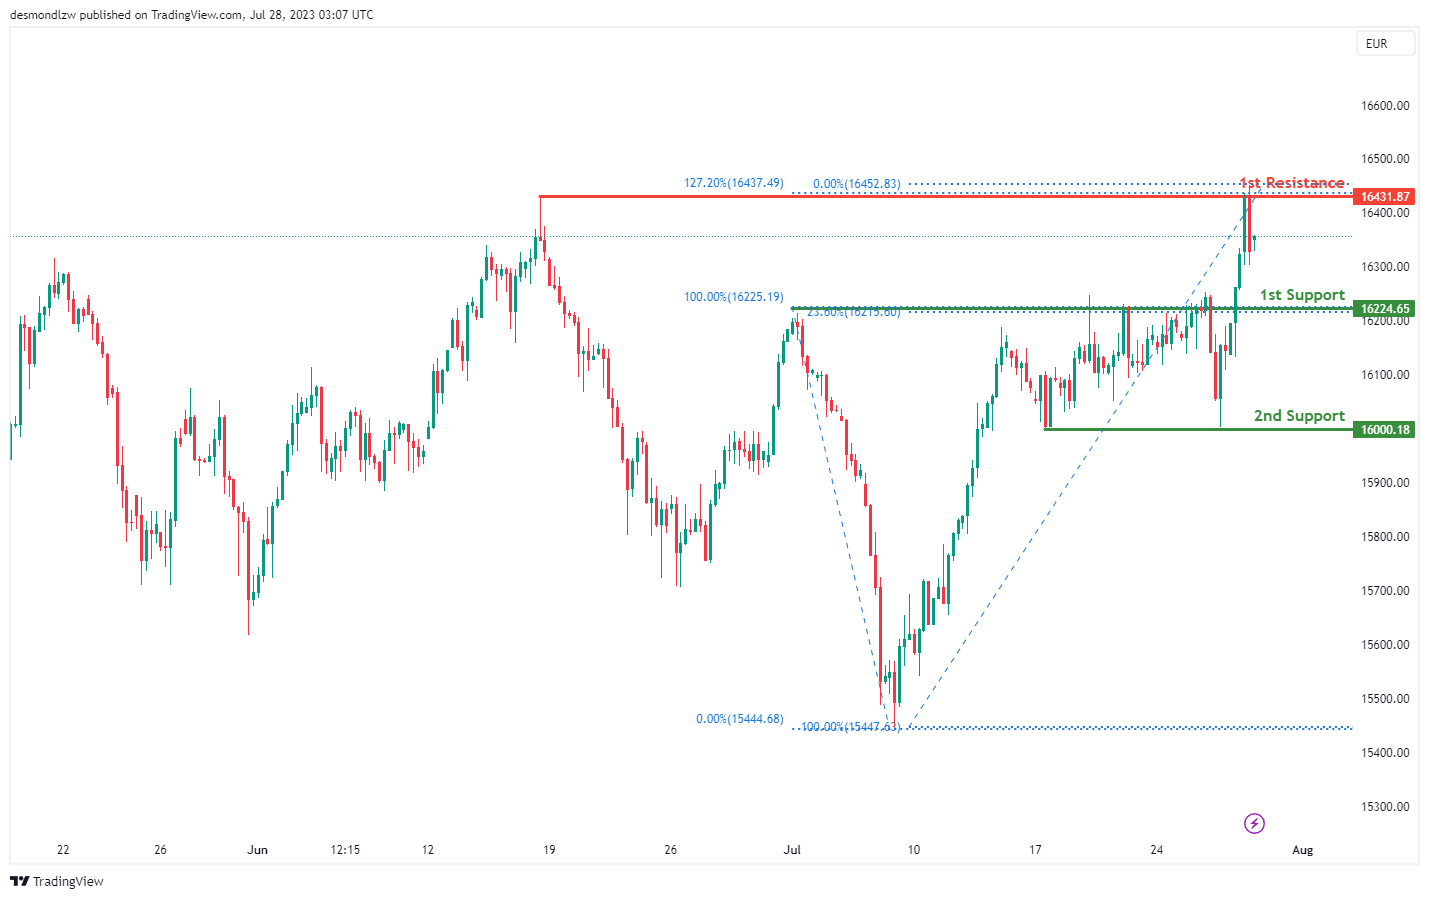
The GER30 chart is demonstrating a bullish momentum currently. We anticipate a potential bullish continuation towards the 1st resistance level.
The 1st support level lies at 16224.65, which is a substantial level as it acts as a pullback support and coincides with the 23.60% Fibonacci retracement level. If the price plunges further, the subsequent key level to watch is the 2nd support at 16000.18, which has served as a multi-swing low support in the past.
Looking upwards, the 1st resistance level is positioned at 16431.87. This level is notable as it represents a multi-swing high resistance and is also at the 127.20% Fibonacci extension level.
US500
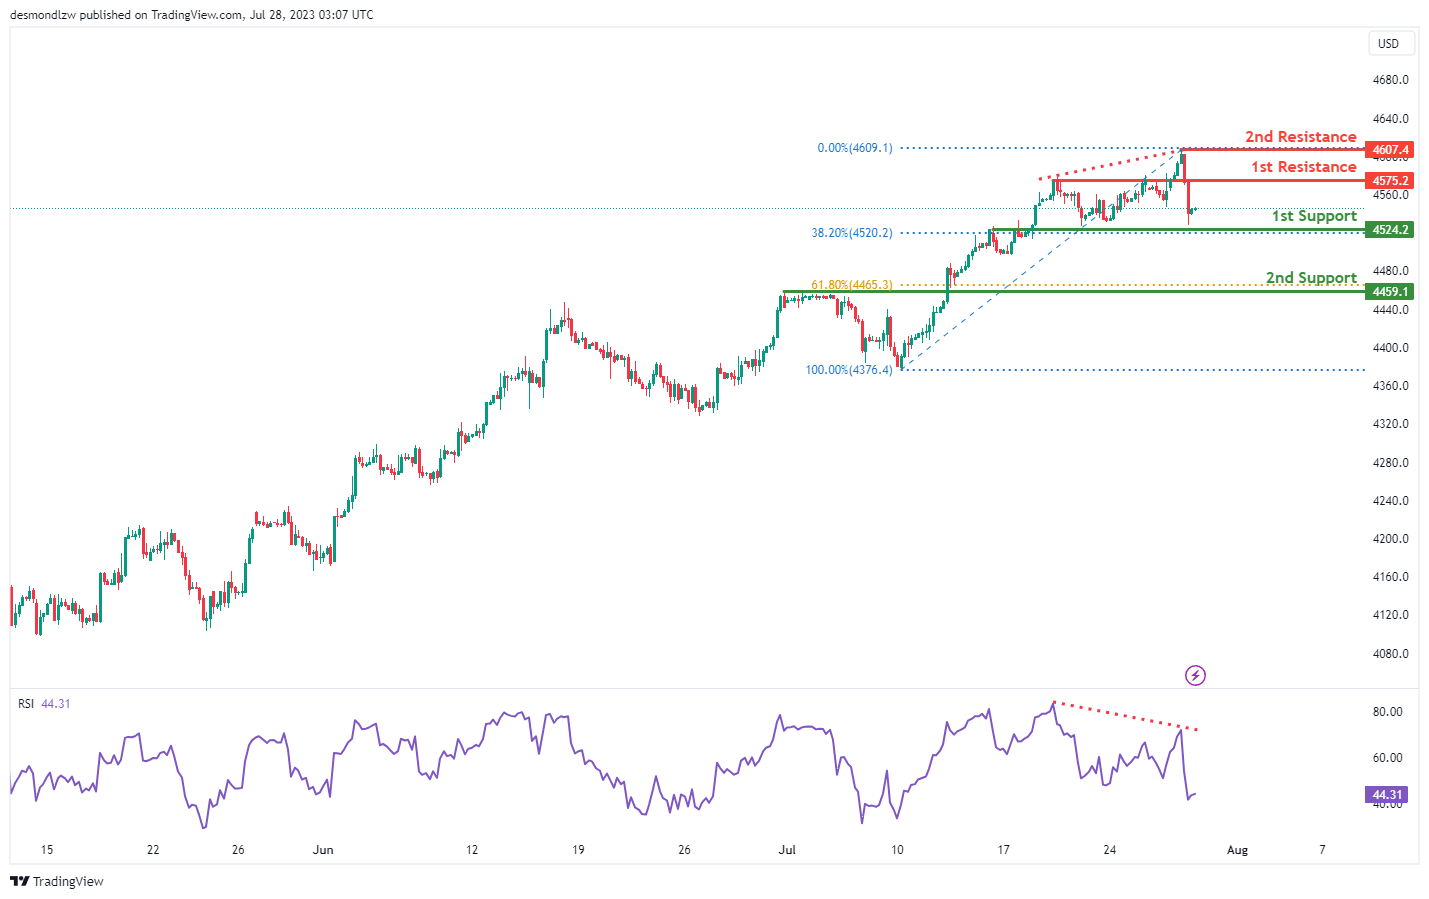
The US500 is currently showing a bearish trend. Despite this, in the short term, we could anticipate a rise towards the 1st resistance level before witnessing a reversal. This potential reversal could send the price dropping towards the 1st support level.
The initial support level is located at 4524.20, which is deemed a solid support due to its dual role as an overlap support and a 38.20% Fibonacci retracement point. If the price continues to drop, the next significant level to observe is the 2nd support at 4459.10. This level is also notable as it is an overlap support and coincides with the 61.80% Fibonacci retracement level.
On the upward trajectory, the 1st resistance level is at 4575.20, acting as a pullback resistance. If the price manages to surpass this, the next key level to watch is the 2nd resistance at 4607.40, which has been a swing high resistance in the past.
Adding to the complexity of the situation, the Relative Strength Index (RSI) is showing a bearish divergence versus the price. This implies that there could be a rapid decline in price in the near future.
BTC/USD:
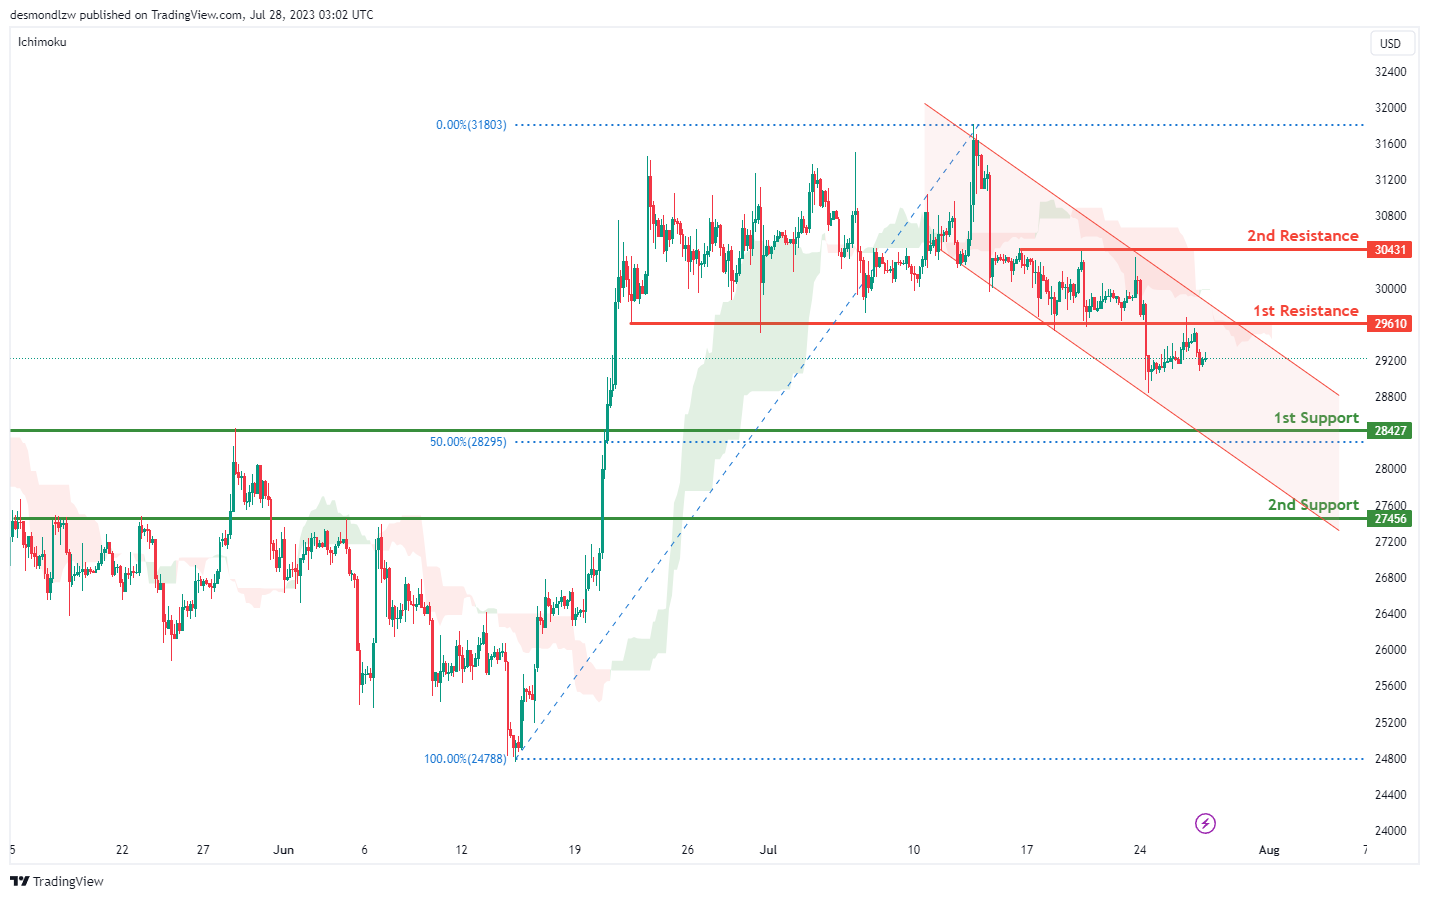
The BTC/USD chart indicates a bearish momentum, with the price currently within a bearish descending channel, which suggests the potential for further downward movement.
A possible scenario implies a bearish continuation towards the 1st support at 28,427.00. This support level is significant as it represents an overlap support and aligns with the 50% Fibonacci retracement level.
Furthermore, the 2nd support at 27,456.00 serves as another important area acting as an overlap support.
On the upside, the 1st resistance at 29,610.00 is a significant level as it represents an overlap resistance.
Additionally, the 2nd resistance at 30,431.00 is another key area, functioning as an overlap resistance.
ETH/USD:
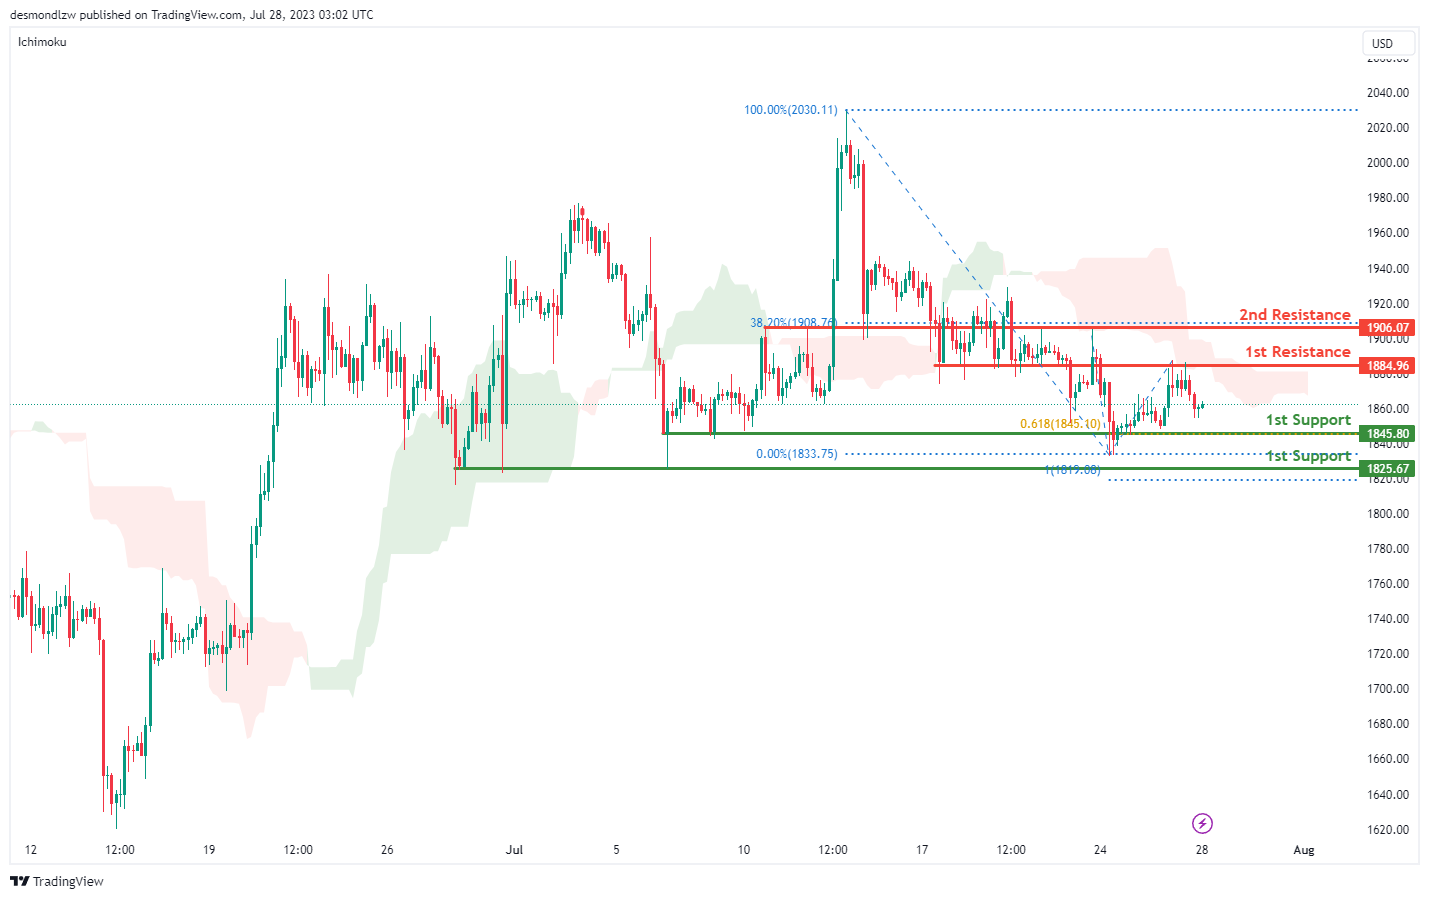
The ETH/USD chart displays a bearish momentum, with the price currently below the bearish Ichimoku cloud, which indicates the potential for further downward movement.
A possible scenario suggests a bearish continuation towards the 1st support at 1845.80. This support level is significant as it represents an overlap support and aligns with the 61.80% Fibonacci projection level. Furthermore, the 2nd support at 1825.67 serves as another important area, functioning as an overlap support and coinciding with the 100% Fibonacci projection level.
On the upside, the 1st resistance at 1844.96 is a significant level, acting as an overlap resistance. Additionally, the 2nd resistance at 1906.07 is another key area, representing an overlap resistance and aligning with the 38.20% Fibonacci retracement level.
WTI/USD:
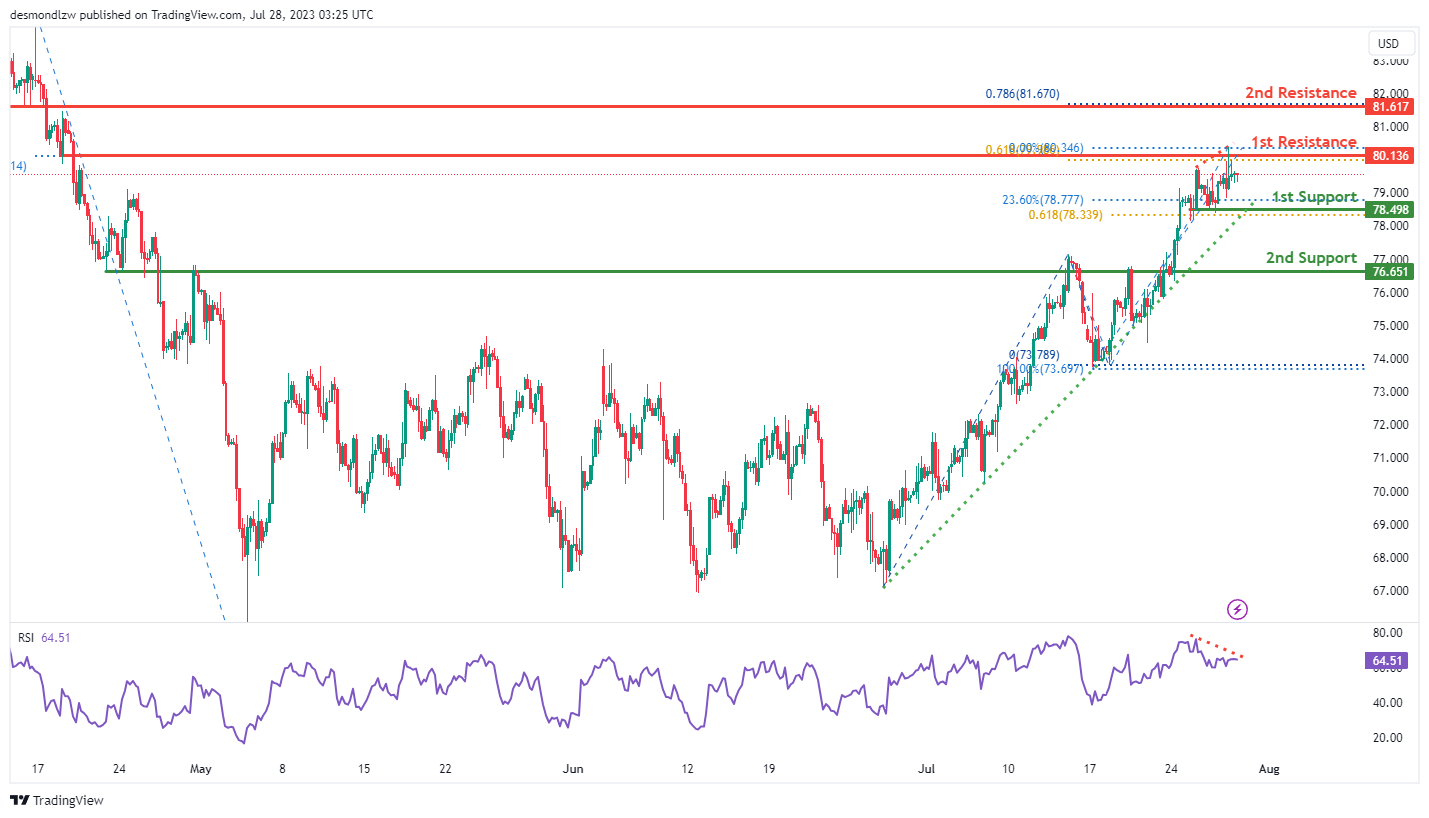
The WTI/USD chart currently shows a weak bullish momentum with low confidence. This is attributed to the price being above a major ascending trend line, suggesting the possibility of further bullish movement. However, it’s worth noting that the RSI is displaying bearish divergence versus price, suggesting a potential reversal might occur soon.
A potential scenario indicates a weak bullish continuation towards the 1st resistance at 80.14 which acts as a pullback resistance, coinciding with the 78.60% Fibonacci Retracement and the 61.80% Fibonacci Projection levels, indicating a Fibonacci confluence. Furthermore, the 2nd resistance at 81.62 is another key area, functioning as an overlap resistance and aligning with the 78.60% Fibonacci Projection level.
The 1st support at 78.49 is significant as it represents a pullback support, coinciding with the 23.60% Fibonacci Retracement and the 61.80% Fibonacci Projection levels, indicating a Fibonacci confluence. Additionally, the 2nd support at 76.65 serves as an overlap support.
XAU/USD (GOLD):
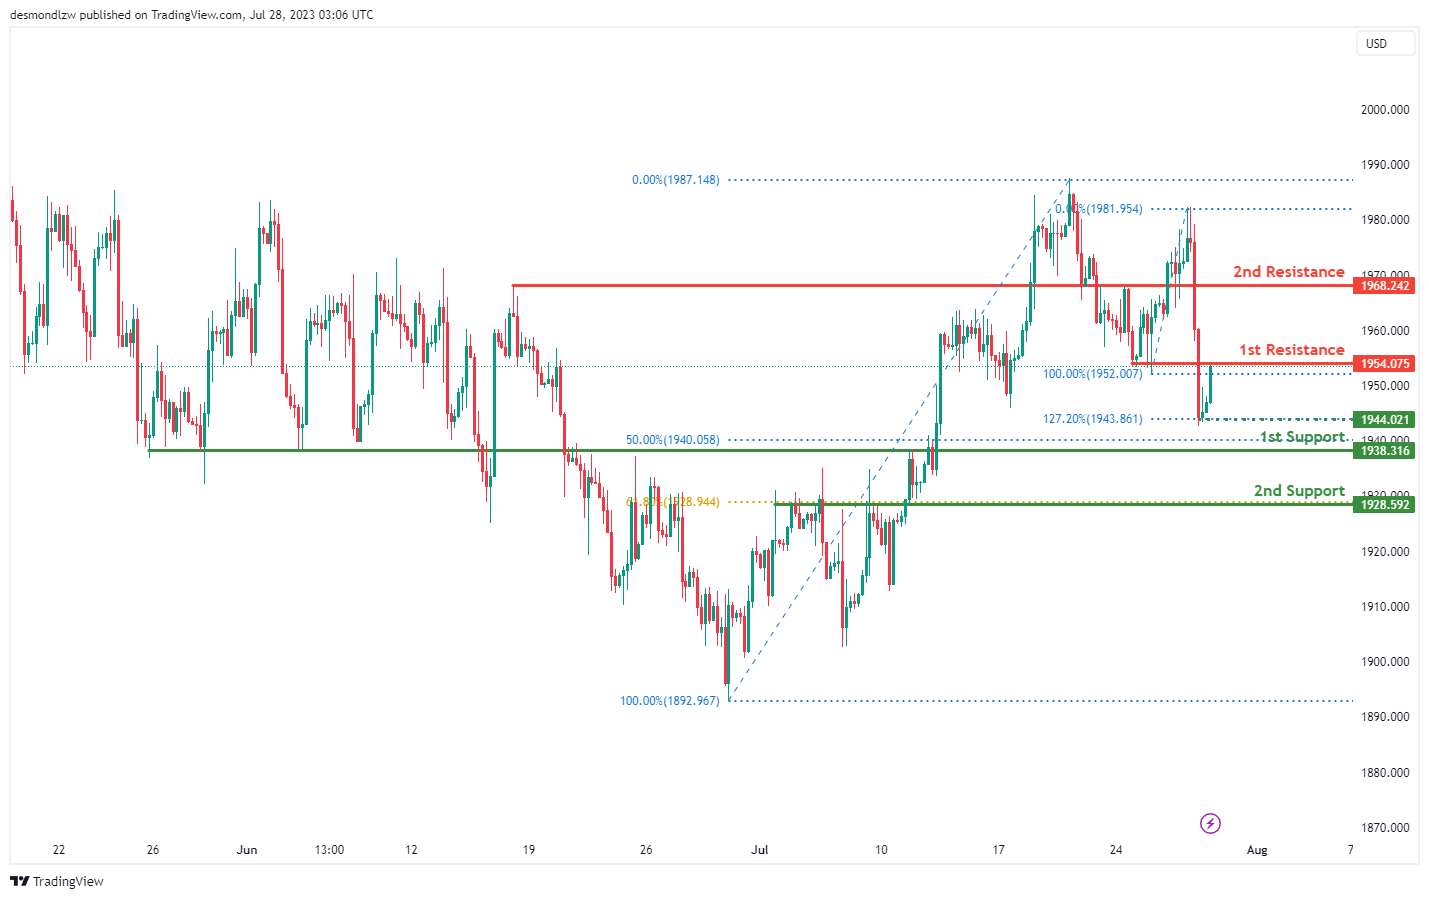
The XAU/USD pair, the chart’s overall momentum is bearish. Consequently, we could potentially witness a bearish reaction off the 1st resistance level, which would then cause the price to drop towards the 1st support level.
The 1st support level is located at 1938.31. This level is considered strong due to its dual role as both a pullback support and the 50% Fibonacci retracement level. These indicators suggest a possible price bounce at this point.
If the price breaches this level, the 2nd support at 1928.59 comes into play. This level doubles as an overlap support and the 61.80% Fibonacci retracement level, further enhancing its strength as a potential floor for price action.
Moving upwards, the 1st resistance level is found at 1954.07. This level has functioned as a pullback resistance in the past and could serve as a potential ceiling for price progression.
Beyond this level, the 2nd resistance level sits at 1968.24, which has also served as a pullback resistance previously, making it a significant hurdle for upward price movement.
EUR/USD Technical Analysis
On the hourly chart of EUR/USD at FXOpen, the pair started a fresh decline from the 1.1150 zone. The Euro declined below the 1.1060 and 1.1020 support levels against the US Dollar.
The pair settled below the 50-hour simple moving average and tested 1.0965. It is now consolidating losses and showing bearish signs. Immediate resistance is near 1.0990. A clear move above 1.0990 might send the pair toward 1.1020.
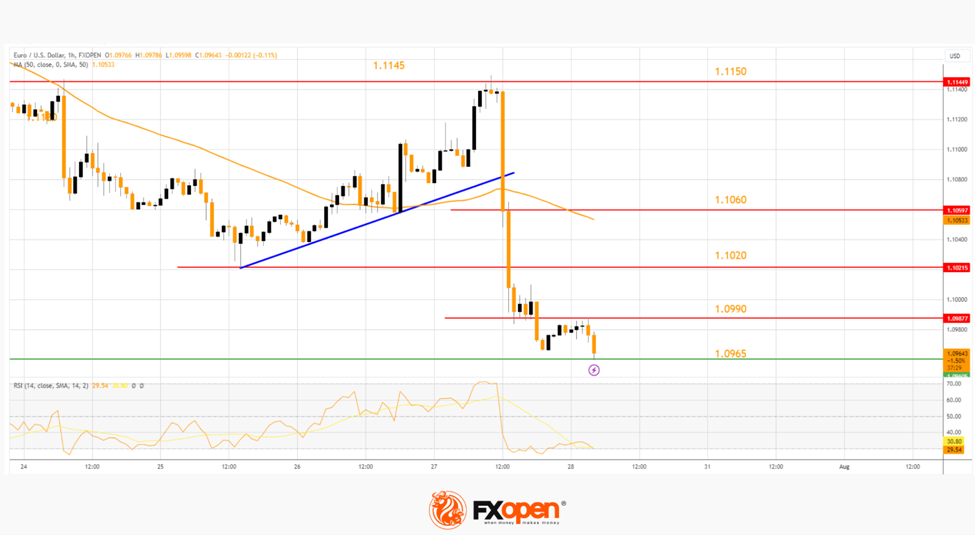
The next major resistance is near the 50-hour simple moving average at 1.1060. Any more gains might send the pair toward 1.1150.
Conversely, the pair might continue to move down below 1.0965. The next major support is near 1.0950, below which EUR/USD could test 1.0920. Any more losses could send the pair toward 1.0880.
This article represents the opinion of the Companies operating under the FXOpen brand only. It is not to be construed as an offer, solicitation, or recommendation with respect to products and services provided by the Companies operating under the FXOpen brand, nor is it to be considered financial advice.
USD/JPY Daily Outlook
Daily Pivots: (S1) 138.40; (P) 139.86; (R1) 140.95; More...
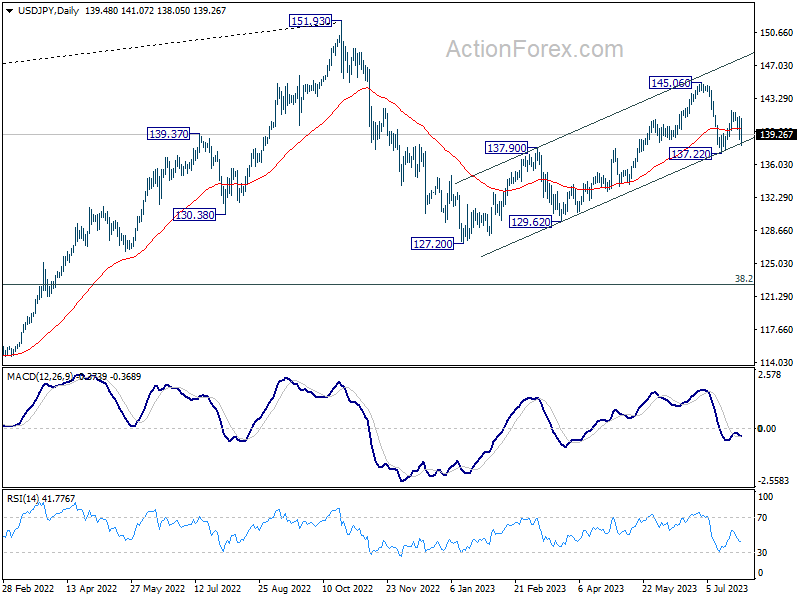
Intraday bias in USD/JPY is back on the downside with break of 139.37 temporary low. Further break of 137.22 will resume the whole decline from 145.06, and carries larger bearish implications. On the upside, though, break of 141.93 will resume the rebound from 137.22 and target a test on 145.06 high.
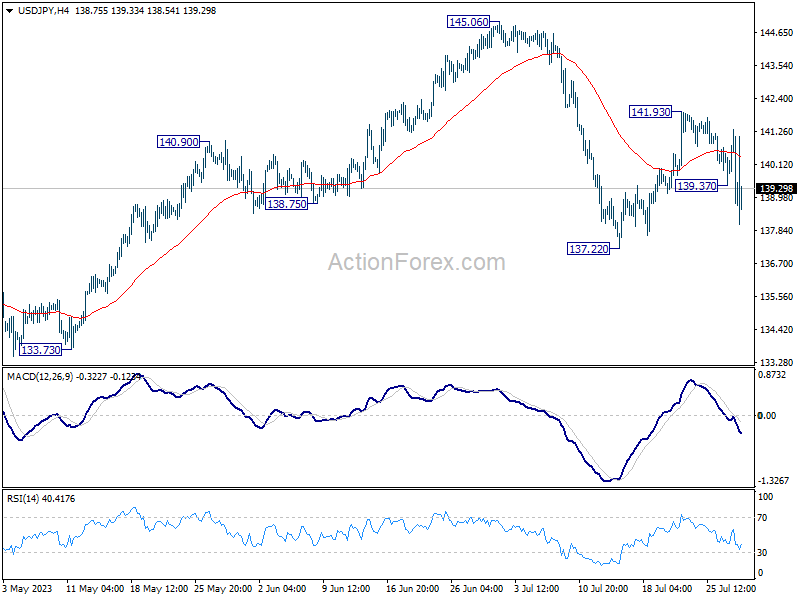
In the bigger picture, overall price actions from 151.93 (2022 high) are views as a corrective pattern. Current development suggests that the second leg (the rise from 127.20) might not be over yet. But even in case of extended rise, strong resistance should be seen from 151.93 to limit upside. Meanwhile, break of 137.22 support should confirm the start of the third leg to 127.20 (2023 low) and below.
GBP/JPY Daily Outlook
Daily Pivots: (S1) 176.61; (P) 179.27; (R1) 181.12; More...
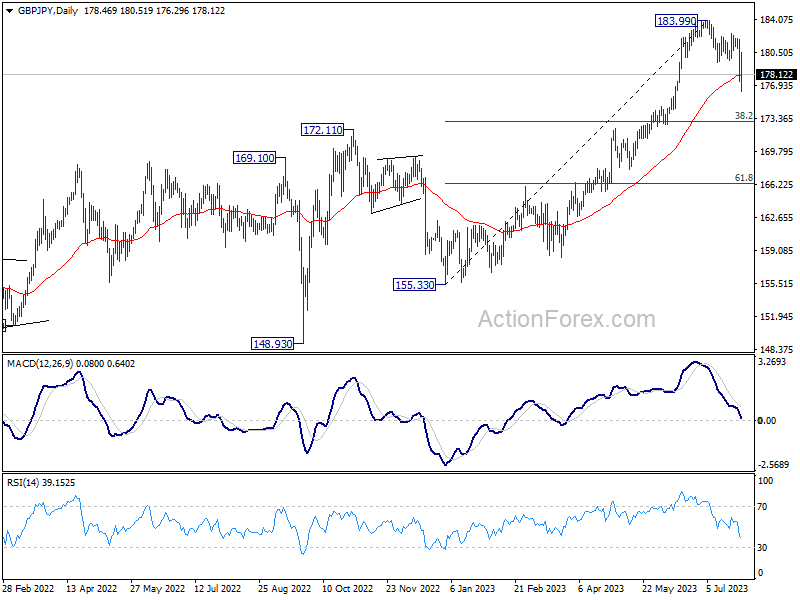
GBP/JPY's fall from 183.99 resumed by break through 179.45 and intraday bias is back on the downside. Sustained trading below 55 D EMA (now at 176.29) will pave the way to 38.2% retracement of 155.33 to 183.99 at 173.04. On the upside, above 180.51 minor resistance will turn intraday bias neutral first.
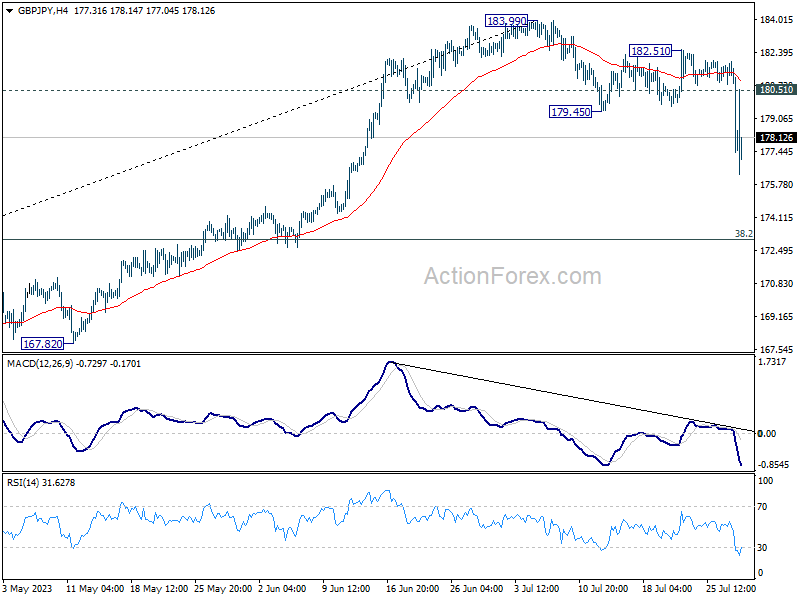
In the bigger picture, as long as 172.11 resistance turned support holds, up trend from 123.94 (2020 low) is expected to continue through 183.99 at a later stage, towards 195.86 (2015 high). Nevertheless, firm break of 172.11 will argue that larger correction is already underway.
EUR/JPY Daily Outlook
Daily Pivots: (S1) 151.45; (P) 153.84; (R1) 155.50; More....
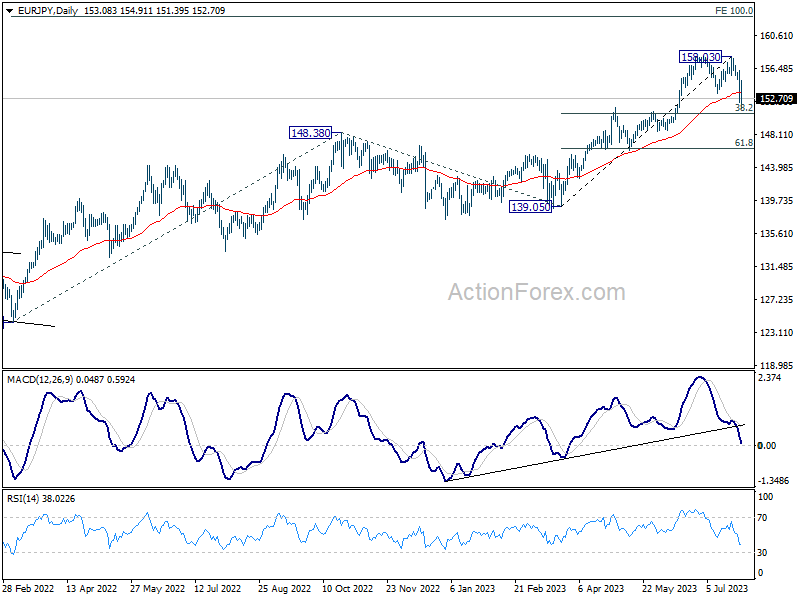
EUR/JPY's decline accelerates to as low as 151.39 so far and intraday bias stays on the downside. The break of 153.32 could have completed a double top pattern (157.99, 158.03). Deeper fall is now expected as long as 154.91 minor resistance holds. Next target is 38.2% retracement of 139.05 to 157.99 at 150.77. Sustained break there will target 61.8% retracement at 146.30. On the upside, above 154.91 will turn intraday bias neutral first.
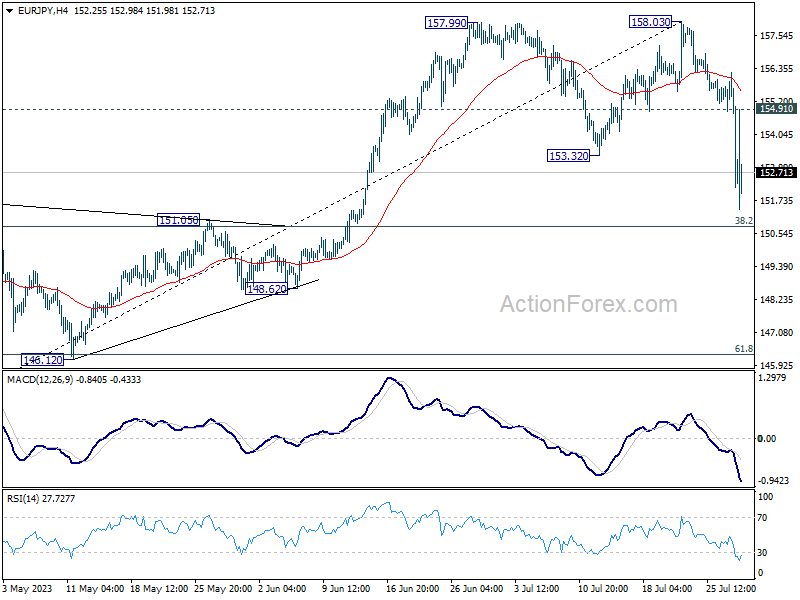
In the bigger picture, as long as 151.60 resistance turned support holds, rise from 114.42 (2020 low) is in progress. On resumption, next target is 100% projection of 124.37 to 148.38 from 138.81 at 162.82. Nevertheless, sustained break of 151.60 will argue that larger correction is already underway. Deeper decline would be seen to 55 W EMA (now at 145.19).
Yen Skyrockets as BoJ Moves a Step Towards Stimulus Exit, Dollar Staying Firm
Yen was already rallying ahead of BoJ policy decision, and managed to maintain most of its advances, despite some post-announcement jitters. Initial reactions saw some gains pared back as the policy appeared largely unchanged on the surface. However, some key alterations, including the central bank's decision to buy 10-year JGB yields at 1% in fixed-rate operations, up from previous rate of 0.5%, caught investors' attention. Additionally, BoJ's pledge to conduct yield curve control with "greater flexibility" and to "nimbly respond" to both upside and downside risks was noted. Collectively, these moves signal a shift towards an exit from BoJ's long-standing ultra-loose monetary policy.
Following Yen, Dollar holds the position of the week's second strongest currency so far, as it seeks to build on the rally prompted by yesterday's better than expected GDP data. Market participants will now be looking towards today's PCE inflation data for cues on Dollar's next move. Meanwhile, Canadian Dollar is the third strongest for the week, awaiting Canadian GDP data. In stark contrast, Euro is the worst performer, still reeling from the sell-off after yesterday's ECB announcement. Australian Dollar trails as the next weakest, followed by British Pound.
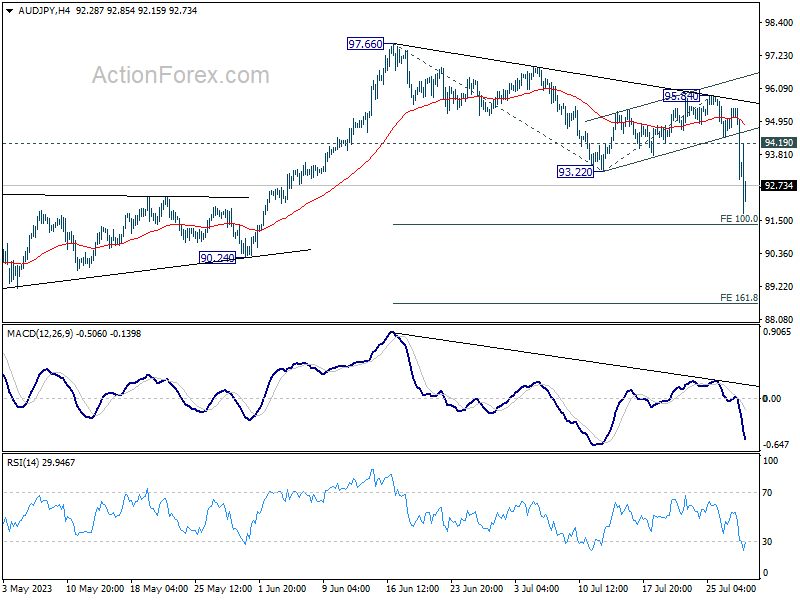
Technically, as a follow up on AUD/JPY, it's now the second top mover for the week so far. The strong break of 93.22 support formed resumed of the fall from 97.66. Further decline is now expected as long as 94.19 minor resistance holds. Next target is 100% projection of 97.66 to 93.22 from 95.84 at 91.40. Some support could be seen there to bring recovery. But decisive break of 91.40 will pave they way to 161.8% projection at 88.65 rather quickly.
In Asia, at the time of writing, Nikkei is down -1.46%. Hong Kong HSI is up 1.08%. China Shanghai SSE is up 1.66%. Singapore Strait Times is up 0.93%. Japan 10-year JGB yield is up 0.104 at 0.545, hitting the highest level since 2014. Overnight, DOW dropped -0.67%. S&P 500 dropped -0.64%. NASDAQ dropped -0.55%. 10-year yield rose 0.161 to 4.012, back above 4% level.
BoJ keeps policy unchanged, one member wants YCC tweak
BoJ keeps monetary policy unchanged today, despite some speculation of at least a minor tweak to the yield curve control. Short term policy rate is held at -0.10% and 10-year JGB yield target is kept at around 0%, by unanimous vote.
The band for 10-year JGB yield fluctuation is also kept at plus and minus 0.50% from the target level, by 8-1 majority vote. Nakamura Toyoaki dissented with preference for allowing greater flexibility in conducting YCC.
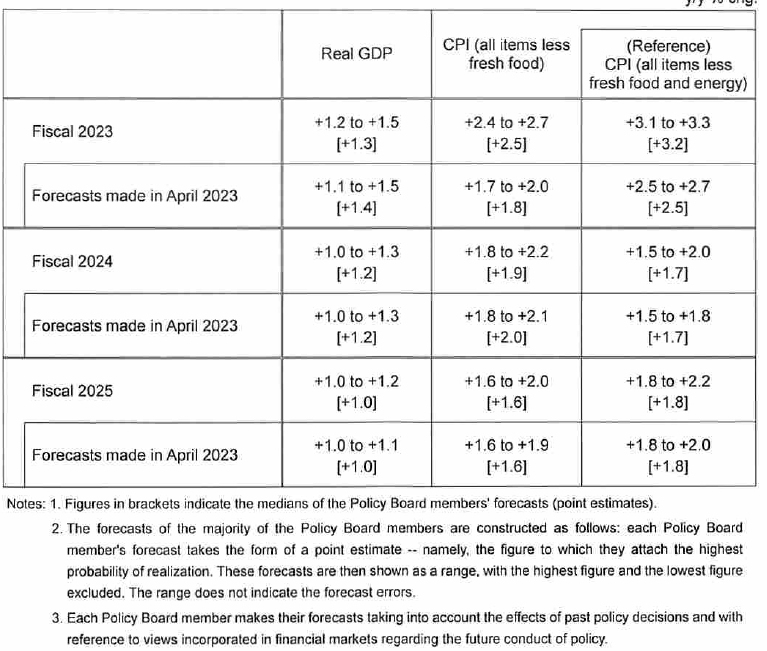
In the new economic forecasts, BoJ upgraded CPI core and CPI core-core forecasts for fiscal 2023, but other projections are kept largely unchanged.
- Real GDP growth at 1.3% in fiscal 2023, downgraded from 1.4% as made in April.
- Real GDP growth at 1.2% in fiscal 2024, unchanged.
- Real GDP growth at 1.0% in fiscal 2025, unchanged.
- CPI core at 2.5% in fiscal 2023, upgraded from 1.8%.
- CPI core at 1.9% in fiscal 2024, downgraded from 2.0%.
- CPI core at 1.6% in fiscal 2025, unchanged.
- CPI core-core at 3.2% in fiscal 2023, upgrade from 2.5%.
- CPI core-core at 1.7% in fiscal 2024, unchanged.
- CPI core-core at 1.8% in fiscal 2025, unchanged.
Australia retail sales down -0.8% mom in Jun, cost-of-living pressures weigh
Australia retail sales turnover fell -0.8% mom in June, much worse than expectation of 0% mom. Sales turnover rose 2.3% yoy compared with June 2022.
Ben Dorber, ABS head of retail statistics, said: "Retail turnover fell sharply in June due to weaker than usual spending on end of financial year sales. This comes as cost-of-living pressures continued to weigh on consumer spending.
"There was extra discounting and promotional activity in May, leading up to mid-year sales events. This delivered a boost in turnover for retailers, but that proved to be temporary as consumers pulled back on spending in June."
Looking ahead
Swiss KOF economic barometer, Eurozone economic sentiment, and Germany CPI flash will be released in European session. Later in the day, Canada GDP and US PCE inflation will be the main focuses. US will also release employment cost index and Chicago PMI.
EUR/JPY Daily Outlook
Daily Pivots: (S1) 151.45; (P) 153.84; (R1) 155.50; More....
EUR/JPY's decline accelerates to as low as 151.39 so far and intraday bias stays on the downside. The break of 153.32 could have completed a double top pattern (157.99, 158.03). Deeper fall is now expected as long as 154.91 minor resistance holds. Next target is 38.2% retracement of 139.05 to 157.99 at 150.77. Sustained break there will target 61.8% retracement at 146.30. On the upside, above 154.91 will turn intraday bias neutral first.
In the bigger picture, as long as 151.60 resistance turned support holds, rise from 114.42 (2020 low) is in progress. On resumption, next target is 100% projection of 124.37 to 148.38 from 138.81 at 162.82. Nevertheless, sustained break of 151.60 will argue that larger correction is already underway. Deeper decline would be seen to 55 W EMA (now at 145.19).
Economic Indicators Update
| GMT | Ccy | Events | Actual | Forecast | Previous | Revised |
|---|---|---|---|---|---|---|
| 23:30 | JPY | Tokyo CPI Y/Y Jul | 3.20% | 2.80% | 3.10% | |
| 23:30 | JPY | Tokyo CPI ex Fresh Food Y/Y Jul | 3.00% | 2.90% | 3.20% | |
| 23:30 | JPY | Tokyo CPI ex Food Energy Y/Y Jul | 4.00% | 3.80% | ||
| 01:30 | AUD | Retail Sales M/M Jun | -0.80% | 0.00% | 0.70% | 0.80% |
| 01:30 | AUD | PPI Q/Q Q1 | 0.50% | 0.90% | 1.00% | |
| 01:30 | AUD | PPI Y/Y Q1 | 3.90% | 3.90% | 5.20% | |
| 03:28 | JPY | BoJ Interest Rate Decision | -0.10% | -0.10% | -0.10% | |
| 07:00 | CHF | KOF Economic Barometer Jul | 90 | 90.8 | ||
| 09:00 | EUR | Eurozone Economic Sentiment Indicator Jul | 95 | 95.3 | ||
| 09:00 | EUR | Eurozone Industrial Confidence Jul | -7.5 | -7.2 | ||
| 09:00 | EUR | Eurozone Services Sentiment Jul | 5.3 | 5.7 | ||
| 09:00 | EUR | Eurozone Consumer Confidence Jul F | -15.1 | -15.1 | ||
| 12:00 | EUR | Germany CPI M/M Jul P | 0.30% | 0.30% | ||
| 12:00 | EUR | Germany CPI Y/Y Jul P | 6.20% | 6.40% | ||
| 12:30 | CAD | GDP M/M May | 0.30% | 0.00% | ||
| 12:30 | USD | Personal Income M/M Jun | 0.50% | 0.40% | ||
| 12:30 | USD | Personal Spending M/M Jun | 0.40% | 0.10% | ||
| 12:30 | USD | PCE Price Index M/M Jun | 0.10% | |||
| 12:30 | USD | PCE Price Index Y/Y Jun | 3.80% | |||
| 12:30 | USD | Core PCE Price Index M/M Jun | 0.20% | 0.30% | ||
| 12:30 | USD | Core PCE Price Index Y/Y Jun | 4.20% | 4.60% | ||
| 12:30 | USD | Employment Cost Index Q1 | 1.10% | 1.20% | ||
| 13:45 | USD | Chicago PMI Jul | 41.5 | |||
| 14:00 | USD | Michigan Consumer Sentiment Index Jul F | 72.6 | 72.6 |