Sample Category Title
Elliott Wave View: GBPUSD Zigzag Correction in Progress
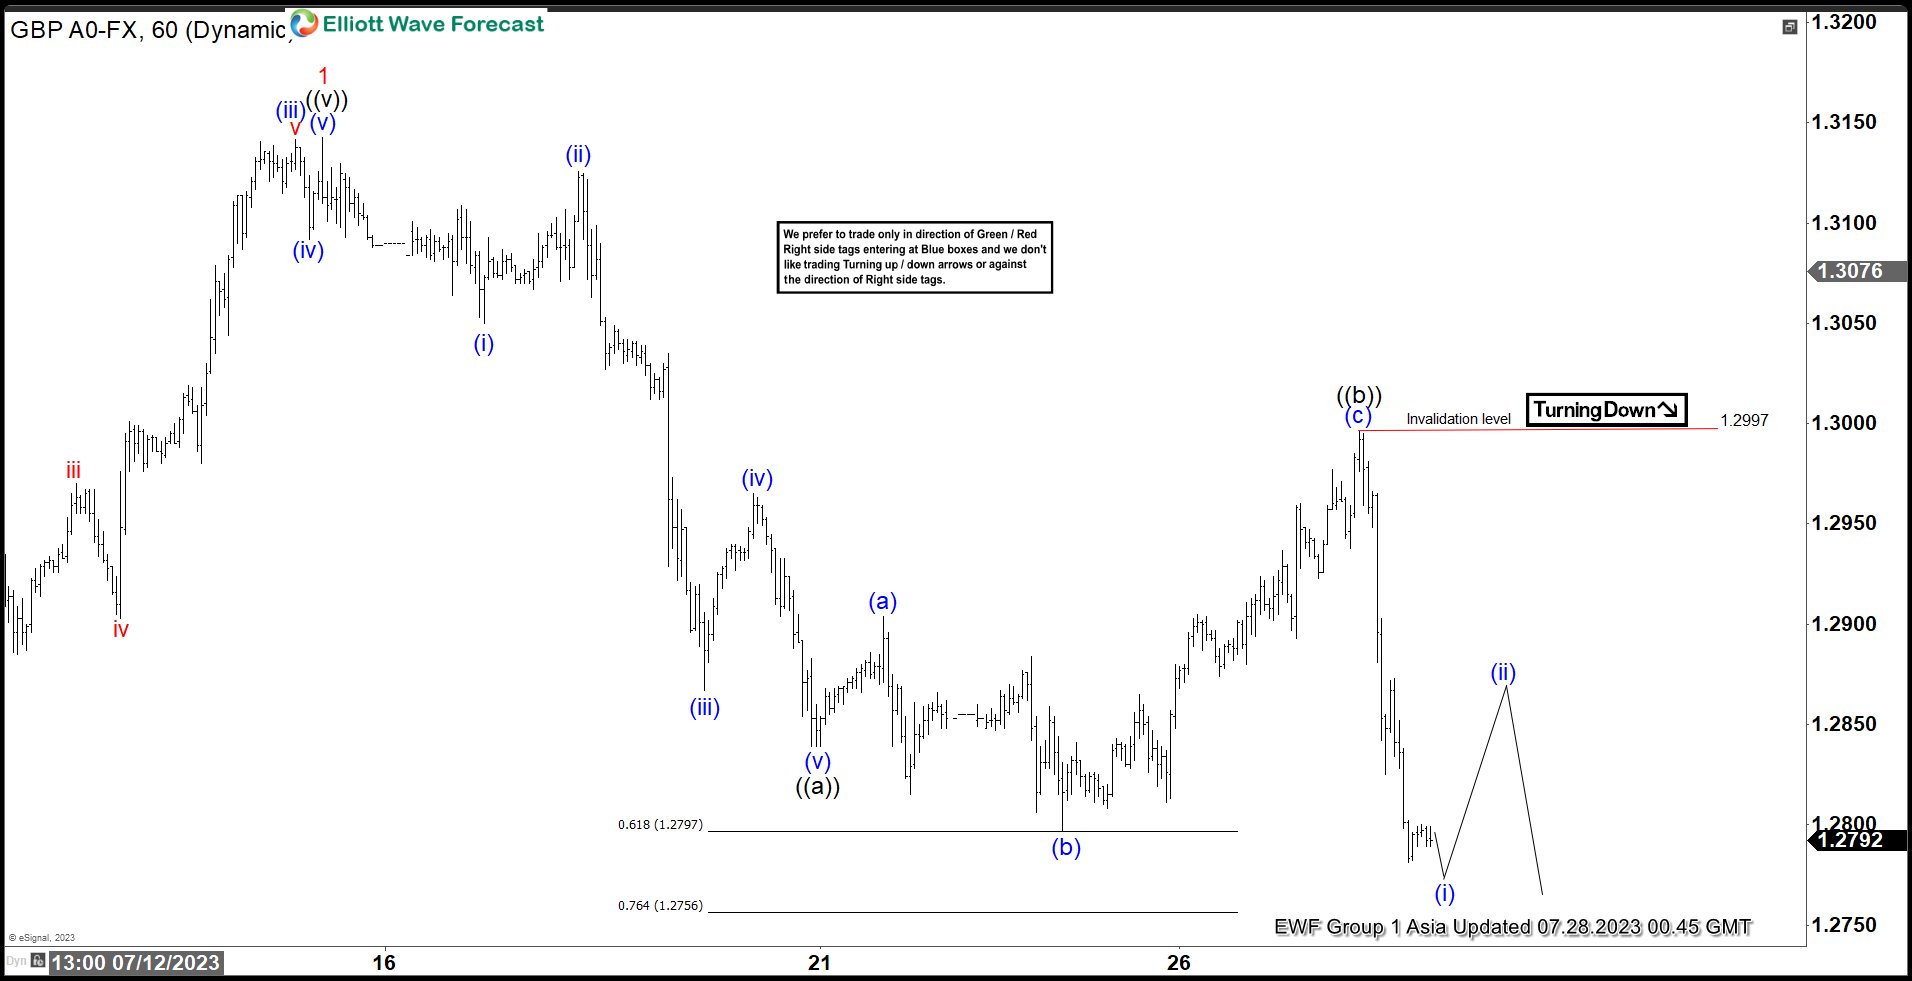
Short term view in GBPUSD suggests the rally to 1.3143 ended wave 1. Pullback in wave 2 is currently in progress as a zigzag Elliott Wave structure. Down from wave 1, wave (i) ended at 1.305 and rally in wave (ii) at 1.3126. Pair then declined in wave (iii) towards 1.2867 and rally in wave (iv) ended at 1.2965. Pair made the last leg lower wave (v) towards 1.2839 to end wave (v). This completed wave ((a)). Rally in wave ((b)) unfolded as an expanded flat structure. Up from wave ((a)), wave (a) ended at 1.2904, wave (b) ended at 1.2797, and wave (c) of ((b)) ended at 1.2997. Pair then extends lower in wave ((c)).
It has broken below the previous expanded flat wave (b) low at 1.2797, which suggests the next leg lower has started. Down from wave ((b)), expect wave (i) to complete soon. Pair should then rally in wave (ii) to correct wave (i) before it resumes lower again as far as it stays below 1.2997. Potential target for wave 2 lower is 100% – 161.8% Fibonacci extension of wave ((a)) which comes at 1.256 – 1.269. Near term, as far as pivot at 1.2997 high stays intact, expect rally to fail in 3, 7, or 11 swing for further downside.
GBPUSD 60 Minutes Elliott Wave Chart
GBPUSD Elliott Wave Video
https://www.youtube.com/watch?v=K4kOTIQLcrE
USD/JPY Climbs Higher, US GDP Jumps 2.4%
Key Highlights
- USD/JPY climbed higher above the 141.00 resistance zone.
- A major bearish trend line is forming with resistance near 142.50 on the 4-hour chart.
- EUR/USD reacted to the downside below the 1.1050 support.
- The US GDP surprised with 2.4% growth in Q2 2023 (Prelim).
USD/JPY Technical Analysis
The US Dollar remained well-bid above the 139.50 level against the Japanese Yen. USD/JPY started a decent increase above the 140.00 and 140.20 resistance levels.
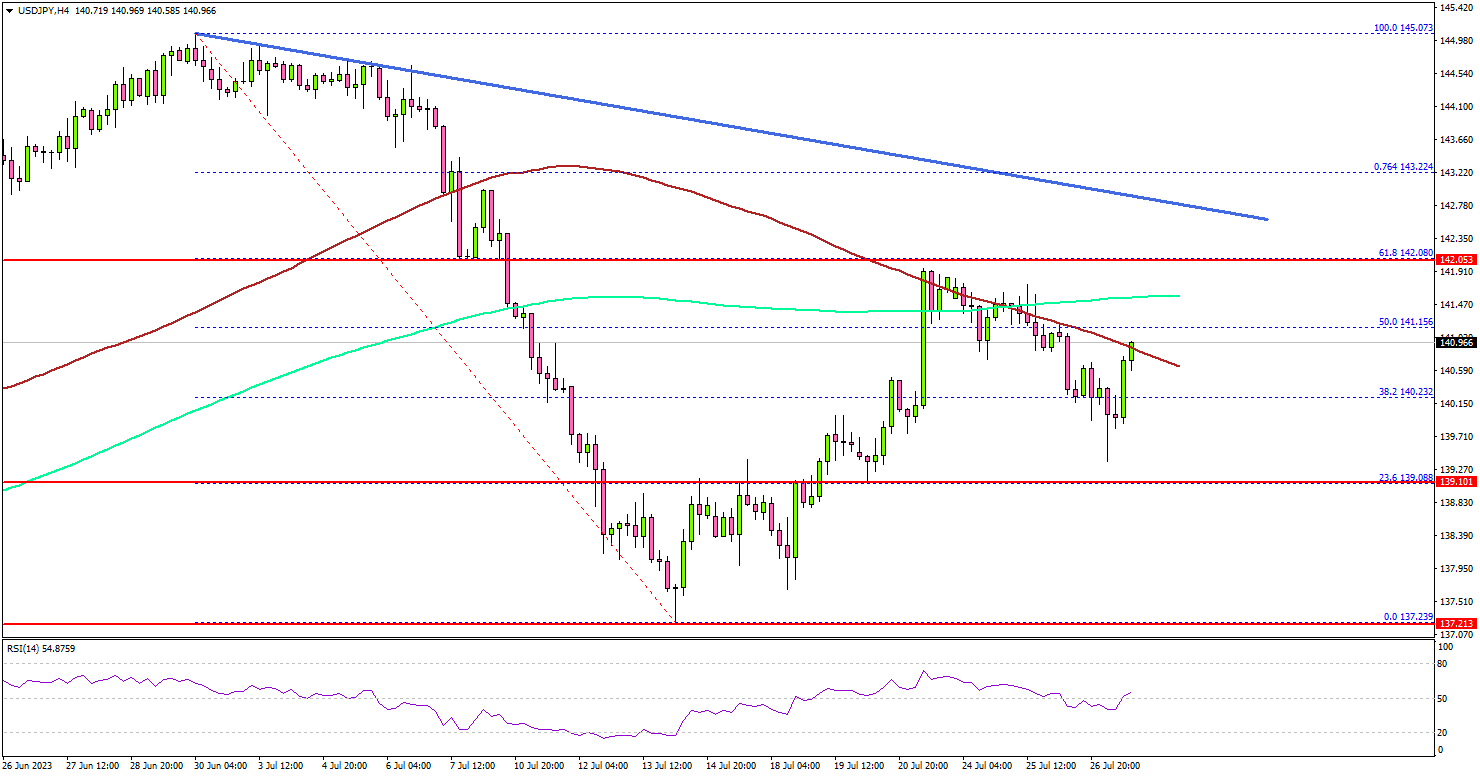
Looking at the 4-hour chart, the pair gained bullish momentum after a sharp 2.4% rise in the US GDP in Q2 2023. There was a move above the 141.00 resistance zone and the 100 simple moving average (red, 4 hours).
The first major resistance is near the 142.00 zone or the 200 simple moving average (green, 4 hours). There is also a major bearish trend line forming with resistance near 142.50 on the same chart.
Any more gains might send the pair toward the 143.20 level. On the downside, the pair might find bids near the 142.25 level. The next major support is near 140.00, below which USD/JPY could slide toward the 139.50 zone.
Looking at EUR/USD, there was a sharp bearish reaction below 1.1050 after the US GDP report and there is a risk of more losses.
Economic Releases
- German Consumer Price Index for July 2023 (YoY) – Forecast +6.2%, versus +6.4% previous.
- German Consumer Price Index for July 2023 (MoM) – Forecast +0.3%, versus +0.3% previous.
- US Personal Income for July 2023 (MoM) - Forecast +0.5%, versus +0.4% previous.
Australia retail sales down -0.8% mom in Jun, cost-of-living pressures weigh
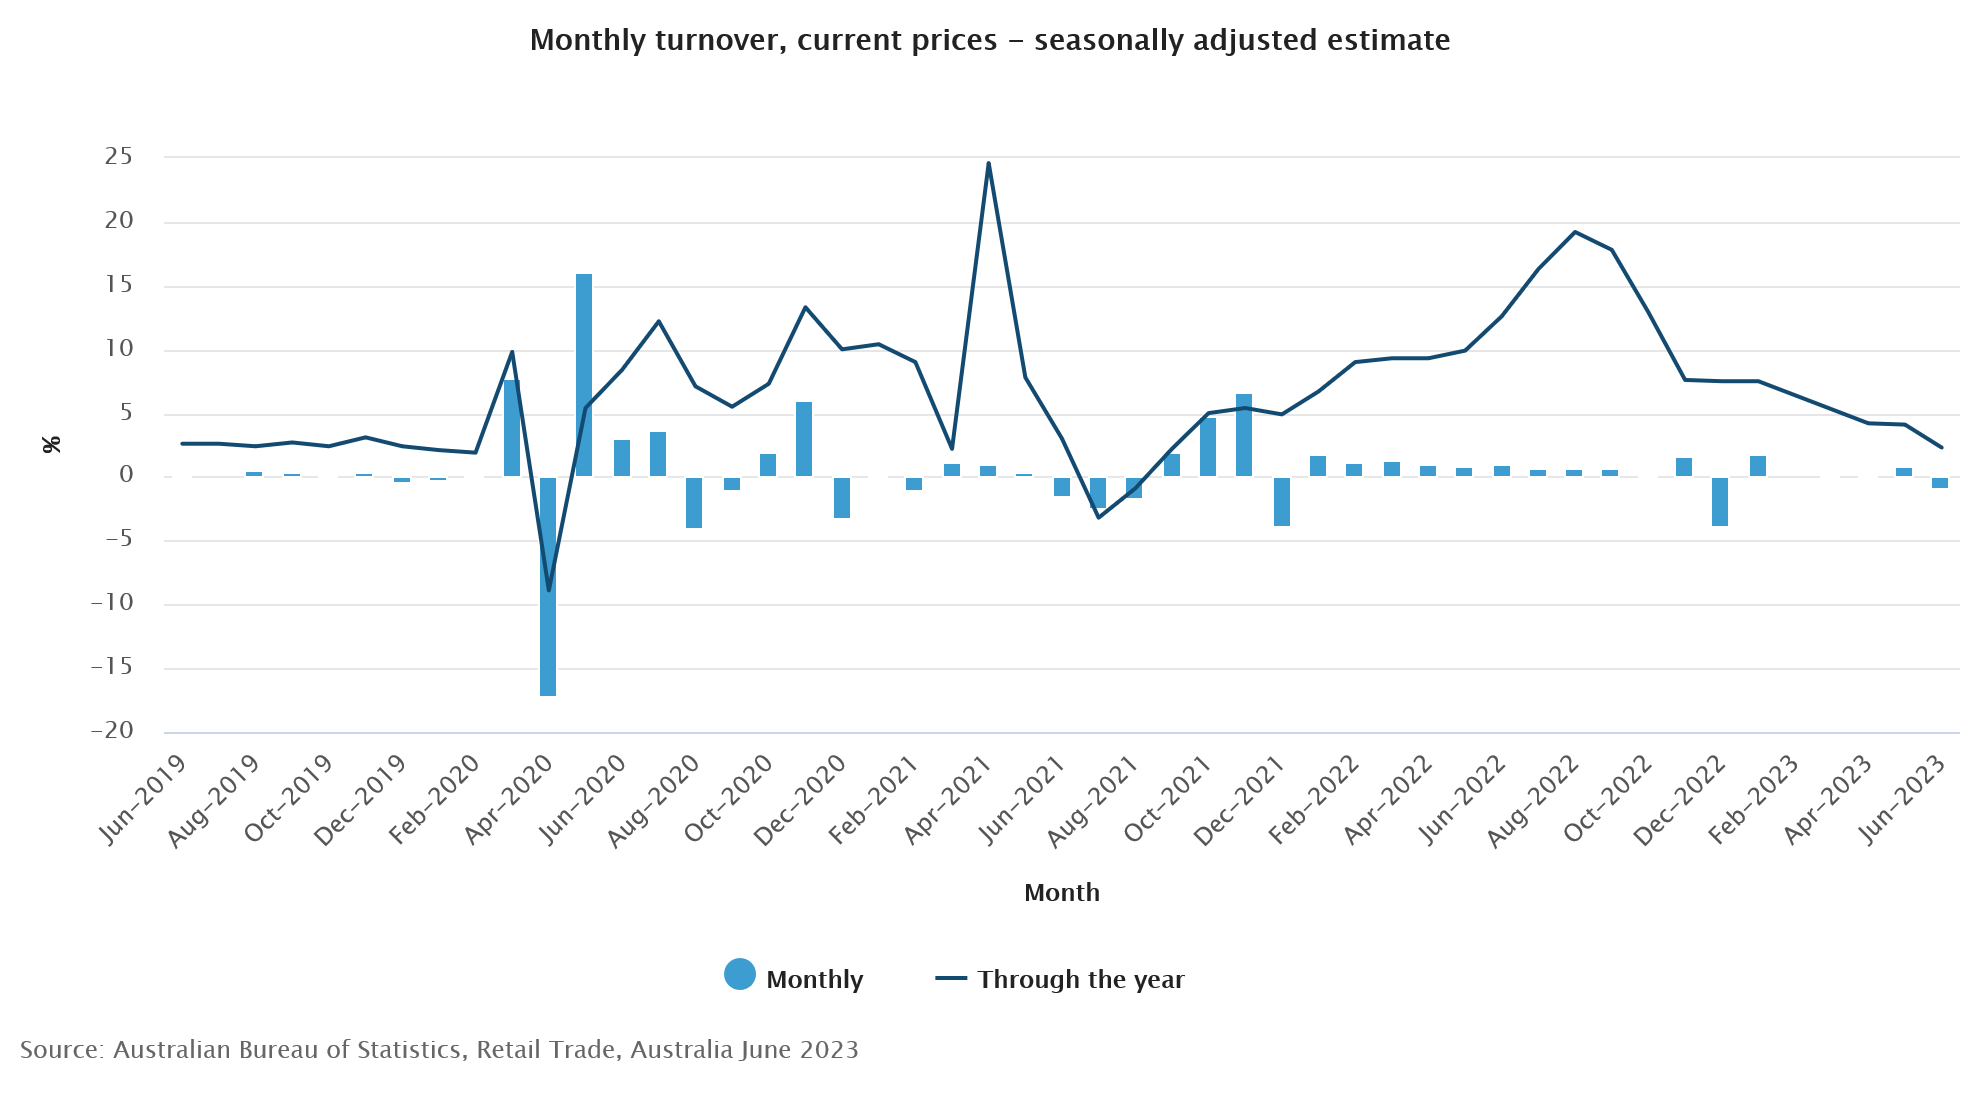
Australia retail sales turnover fell -0.8% mom in June, much worse than expectation of 0% mom. Sales turnover rose 2.3% yoy compared with June 2022.
Ben Dorber, ABS head of retail statistics, said: "Retail turnover fell sharply in June due to weaker than usual spending on end of financial year sales. This comes as cost-of-living pressures continued to weigh on consumer spending.
"There was extra discounting and promotional activity in May, leading up to mid-year sales events. This delivered a boost in turnover for retailers, but that proved to be temporary as consumers pulled back on spending in June."
RBA Board to Raise Cash Rate by 25 Basis Points at August Meeting, Maintain Tightening Bias
The Reserve Bank Board meets next week on August 1.
Westpac has consistently argued that a further increase in the cash rate should be the appropriate policy response at the August meeting and we confirm that view.
We also believe that the Board should maintain its tightening bias, repeating the sentence: "Some further tightening of monetary policy may be required to ensure that inflation returns to target in a reasonable timeframe."
Previously we had a firm view that a follow-up increase in September would be required. We are now comfortable that maintenance of the tightening bias beyond August should be sufficient.
Markets and most commentators have concluded that the better print on headline inflation for the June quarter will be sufficient for the Board to extend the pause that it began in July for another month.
That is a quite reasonable position to take given the policy approach taken by the Board at the June and July meetings. For both meetings the key factor behind the decision to hike in June and pause in July centred around the monthly headline inflation reports.
In June the annual headline from the monthly indicator lifted from 6.3% to 6.8%, prompting an increase of 0.25%; whereas in July the monthly indicator slowed from 6.8% to 5.6% prompting the decision to pause.
In both months other developments, particularly around the labour market and services inflation, were arguably consistent with a different decision (the most notable exception being the minimum wage decision delivered just prior to the June Board meeting).
So, how can we possibly not go with the market for August when the quarterly headline Inflation report was softer than expected and the monthly indicator showed a further modest reduction from 5.6% to 5.4%?
Headline inflation printed 6.0% for the year to June compared to the RBA's forecast of 6.3% when it released its forecasts in the May Statement on Monetary Policy, and down from 7.0% in the year to March.
The RBA Board will undoubtedly look more deeply into the June quarterly report for inflation than is possible with the monthly indicator.
It will find that the 5.9% print for core inflation (trimmed mean) compared to the RBA's forecast of 6.0% a much closer result. That print was down from 6.6% in the year to March.
Annual goods inflation fell from 7.6% to 5.8%. On the other hand, annual services inflation lifted from 6.1% to 6.3%.
The ABS calculated that quarterly services inflation slowed from 1.7% in March to 0.8% in June. June is a low seasonal quarter for services June 2023 was in fact higher than the gain in June 2022 (0.6%).
A more reliable measure of services inflation is "market services ex volatile items". This measure excludes the government administered prices therefore capturing the economic cycle. The quarterly increase in this measure lifted from 0.9% to 1.2%, while annual growth held steady at 6.8%.
The detail around services inflation and core inflation is less encouraging than the headline result.
Central banks favour the core number because it is a more reliable indicator of ongoing inflation momentum.
While the decision at the last two meetings was reliant on the monthly Indicator the decision at the August meeting can draw on the much more reliable and detailed information from the quarterly report.
We had a similar situation at the May Board meeting.
Following a material fall in annual headline inflation in the March inflation report, markets dismissed the possibility of a rate increase in May. After all, headline inflation had fallen from 7.8% to 7.0% in a single quarter.
But the Board surprised with a hike, having the benefit of the more detailed quarterly report, which showed a further lift in services inflation (5.5% to 6.1%).
The theme behind much of the Board's concern around its inflation challenge, at the May meeting and continuing, has been that "inflation was not expected to reach the top of the target band until mid-2025 … although this was consistent with the Bank's mandate and objectives, it left little room for upside surprises to inflation given that inflation would have been above target for around four years by that time." (May minutes).
This explanation was given as a central reason for the surprise rate hike in May.
Notably also, despite the March result, the staff did not lower its forecast track for inflation with underlying inflation still projected to reach 2.9% by June 2025.
The key to the August policy decision is whether the Board and staff feel comfortable enough to lower their inflation forecasts following the June inflation result.
The Bank' refreshed forecasts in August to be published in Fridays' Statement on Monetary Policy will be extended out to December 2025. It would be very difficult for the Board if the forecasts still did not have inflation reaching the 2.5% mid-point of the target by end 2025.
During my recent trip to the East Coast of the US; Europe; and London I noted consistent criticism of the Board's approach of being comfortable to reach the top of the target band after being outside the band for so long.
The current forecasts only have the core inflation rate falling from 3.1% to 2.9% ( 0.2ppts) over the first six months of 2025. Arguing for a much faster fall in the second half of 2025 is not credible given that growth is forecast to be picking up in 2025. So, to justify an earlier achievement of the target, the progress will need to be in 2023 H2 and 2024.
Following the analysis of the June quarter report, particularly taking account of the stickiness of services inflation, we see some moderation in the pace of inflation in the second half of 2023 as goods inflation unwinds at a faster pace but the services story still holds inflation at an elevated pace in 2024 our forecasts for both headline and trimmed mean inflation in that year remain unchanged at 3.2%yr and 3.3% respectively.
Other factors create inertia for inflation in 2023H2 and 2024.
This inertia in inflation, particularly in 2024, is due to the range of other factors that have become more apparent in recent months and the market appears to be overlooking. These include:
- The continued strength of labour markets we have recently upgraded our forecasts for employment growth and lowered our unemployment rate forecasts, to reflect the consistent upside surprises on jobs and the persistence of 50-year lows in the unemployment rate. The strength reflects the extraordinary backlog of unfilled jobs with job vacancies remaining at extreme highs. This is another direct legacy from the pandemic and an issue being faced by many developed economies coming out of COVID. This resilience in labour market outcomes boosts incomes and demand adding to pressure on wages growth.
- Slow productivity growth the 'productivity challenge' has been at the top of the Board's considerations consistently in the meeting minutes. This was most clearly identified in the minutes to the meeting in May, which noted: "Members observed that the forecast for inflation to return to the top of the target band by mid-2025 was predicated on productivity growth returning to around the modest pace recorded prior to the pandemic. If this did not occur, growth in unit labour costs would be uncomfortably fast." The latest update on unit labour costs wages adjusted for productivity saw annual growth lift 7.0%yr to a very strong 7.9%yr in the March quarter.
- A resurgent housing market nationally house prices have lifted by around 5% since February, and the Westpac MI House Price Expectations Index showing consumers expect gains to continue over the next year, which will anchor and support current momentum. Activity, inflation and wealth effects resulting from the improving housing market will tend to make it more difficult for the RBA to achieve its inflation target. The May Board meeting minutes picked up on some of these concerns: "Members also reviewed recent developments in asset markets in particular, they noted the depreciation of the exchange rate and the increase in house prices … the decision to hold rates steady in April was likely to have contributed".
- Emerging risks around commodities oil prices are lifting and electricity costs already look like being a persistent source of high inflation; global food prices are being impacted by Russia's blockade of Ukraine's agricultural exports and are at risk of more weather-related impacts as an El Nino forms.
The RBA's forecasts of reaching the top of the band by mid- 2025 already envisage a very significant fall in inflation through the remainder of 2023. Underlying inflation is forecast to fall from 6% in June to 4% in December. That entails a slowdown in semi-annual inflation from 2.2% in 2023 H1 to 1.8% in 2023 H2 we think that is achievable but expect progress in 2024 to be much slower as goods disinflation runs its course, and the emphasis moves to more persistent services inflation.
Conclusion
Markets are convinced that the slowdown in inflation apparent in the June quarter inflation report will see an extension of the Board's July pause.
The headline inflation picture has been the key driver of recent decisions in both June and July. But that was not the case in May when the detailed quarterly report allowed for deeper and more reliable insights that were more concerning.
This time around, the June quarter report highlights the stickiness of services inflation while other information around the labour market and productivity pose questions about whether the staff can credibly lower the inflation profile to allow for an earlier achievement of the inflation target. Most importantly it needs to reach the mid-point of the target range by the extended forecast end-point of December 2025.
If, as we consider likely, the RBA's revised forecasts show little progress in this regard then the Board should take out more 'insurance' with an additional 25bp rate hike at its August meeting.
A combination of one last hike in August complemented with the ongoing 'soft' tightening bias seems to be the best approach to a difficult challenge.
CADCHF Wave Analysis
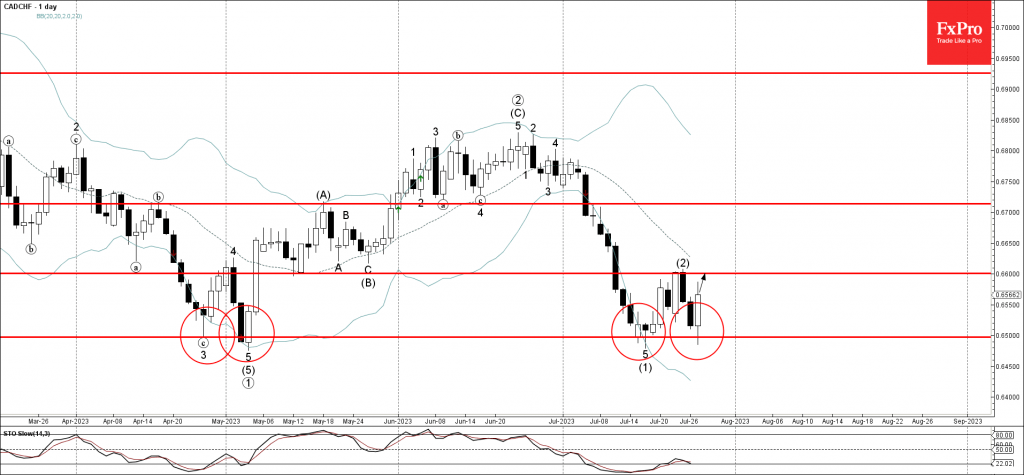
- CADCHF reversed from support level 0.6500
- Likely to rise to resistance level 0.6600
CADCHF recently reversed up from the powerful support level 0.6500 (which has reversed the previous impulse waves 3, (5) and (1)).
The upward reversal from the support level 0.6500 runs counter to the active intermediate impulse wave (3).
Given the strength of the support level 0.6500 , CADCHF can be expected to rise further toward the next resistance level 0.6600 (top of the previous wave (2)).
USDCHF Wave Analysis
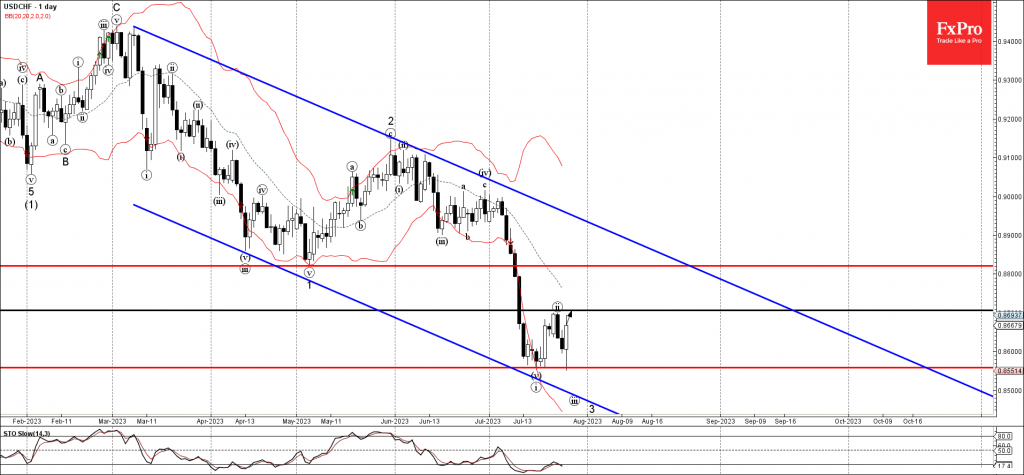
- USDCHF reversed from support level 0.8560
- Likely to rise to resistance level 0.8700
USDCHF recently reversed up from the key support level 0.8560 (which stopped the previous impulse wave i in the middle of July).
The upward reversal from this support level is currently forming the daily reversal pattern Bullish Engulfing.
USDCHF can be expected to rise further toward the next round resistance level 0.8700 (top of the previous correction ii).
Bank of England Preview – Topside Risk to EUR/GBP With a Return to 25bp Steps
- We expect the Bank of England (BoE) to hike the Bank Rate by 25bp on 3 August.
- We expect a peak in the Bank Rate of 5.50% with risks tilted to the upside. We see current market pricing of a peak in policy rates of 5.90% as too aggressive.
- EUR/GBP is set to move modestly higher on announcement. We do not expect the press conference to offer much further guidance than the written material.
BoE call. We expect the Bank of England (BoE) to hike the Bank Rate (key policy rate) by 25bp on 3 August, bringing it to 5.25%. Markets are currently pricing around 33bp for the meeting next week. While the latest UK economic data releases, in our view, support a return to a smaller increment hike pace of 25bp on Thursday, we acknowledge that the probability of a larger 50bp hike remains considerable given the evidence of (still) strong underlying inflationary pressures in the service sector and wage growth developments.
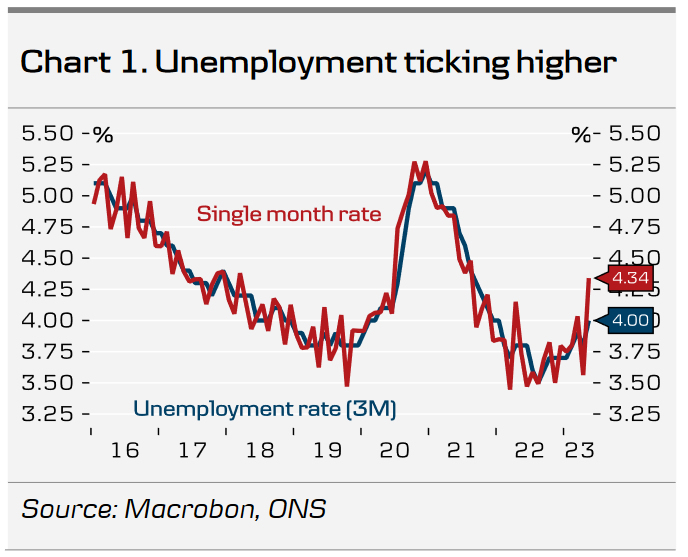
Since the last monetary policy decision in June, there have been limited new UK economic data releases. Likewise we have received little guidance from the MPC with speakers rigorously repeating official guidance from the latest meeting. The latest labour market report delivered a mixed bag of news. Single month unemployment increased to 4.3%, inactivity decreased and unfilled vacancies continued to decline indicating some rising slack in the labour market. However, wage growth remains elevated with wage growth excl. bonuses showing no clear signs of slowing. Large public sector wage agreements announced by the government at the beginning of July of pay rises between 5-7% also pose as further upward pressure on wage growth and hence possible second round effects.
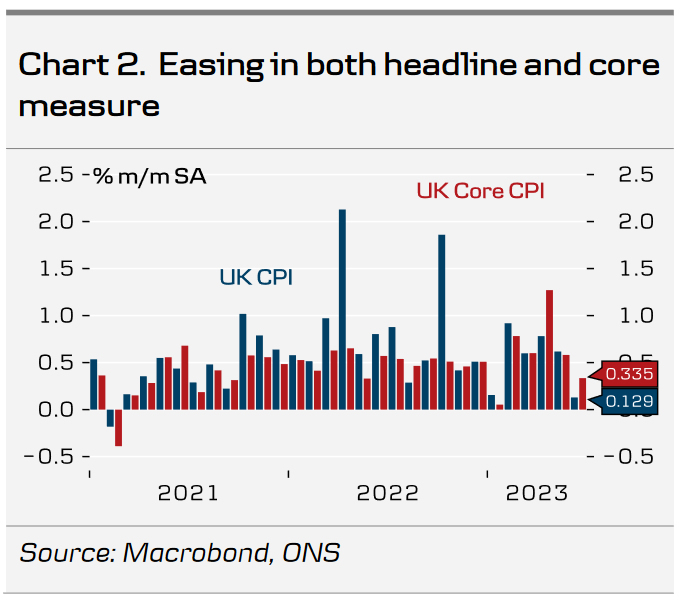
On the other hand, CPI for June came in lower than expected for the first time since January with a broad easing in both the core and headline measure. While the BoE in the minutes of the June meeting projected service inflation to remain "broadly unchanged in the near-term", service inflation declined to 7.2% y/y (down from 7.4% in June). Likewise, PMIs for July surprised to the downside and pointed to growth weakening further in the months ahead. The composite index remained in slightly expansionary territory at 50.7, whereas manufacturing continued to weaken further at 45.0. Momentum in the service sector continues to fade in line with the past two months releases with July at 51.5.
We maintain our call for a 25bp hike in September and see the Bank Rate peaking at 5.50%. This is less than market pricing, which remains above our call despite having decreased the past month to a peak rate of 5.90% in February 2024. Based on MPC member Ramsdens recent comments, an increase in the size of the gilt reduction program is likely from the current GBP 80bn the past 12 months. We expect no rate cuts until 2024.
FX. In our base case of a 25bp hike, we expect EUR/GBP to move slightly higher and volatility to be high. We anticipate Governor Bailey to reiterate the BoE's data dependent approach at the press conference, essentially kicking the can down the road. Overall, we expect the BoE to highlight the continued tight labour market and keep the door open for further tightening. On balance, we continue to see relative rates as a positive for EUR/GBP, which is one of several reasons behind our fundamental predisposition of buying EUR/GBP dips.
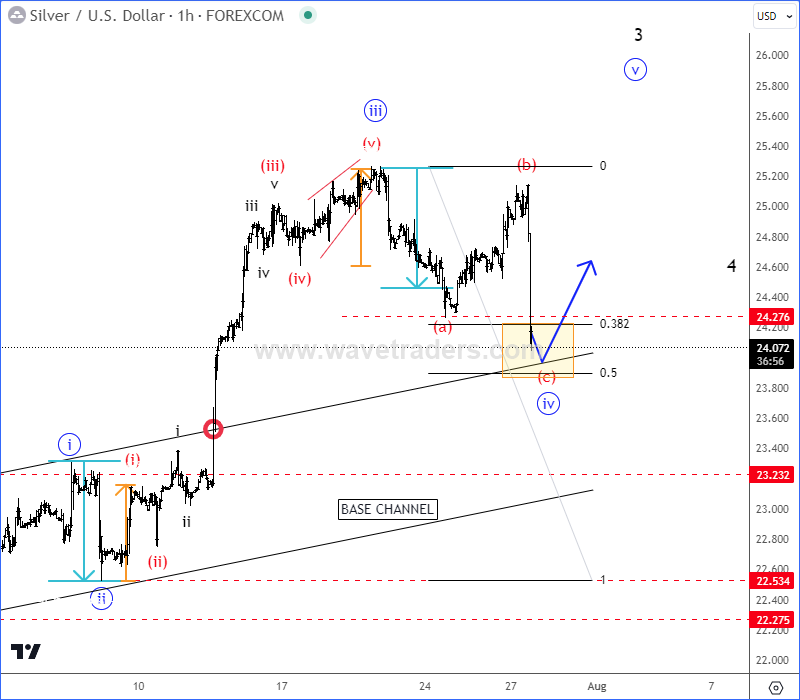
Silver Making Intraday Pullback Within Uptrend
Silver is in an impulsive recovery away from 22.05 lows and there’s room for more upside as it can be unfolding a five-wave bullish cycle from Elliott wave perspective. It’s actually moving nicely as expected for now and we still see it trading in an (a)-(b)-(c) correction within wave »iv« with ideal support here around base channel resistance line and 24.00 level before the uptrend for wave »v« of 3 resumes.
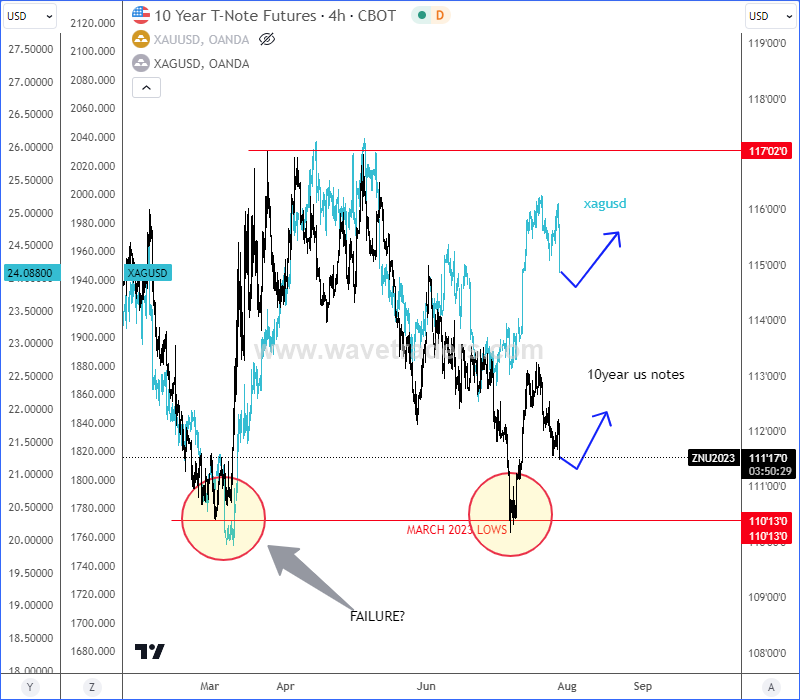
The main reason why we remain bullish on silver is 10Y US Notes chart, which is in tight positive correlation with metals. As you can see, after a failure break of March 2023 lows, we have seen strong recovery on both assets. They are probably just making a corrective pullback before a continuation higher.
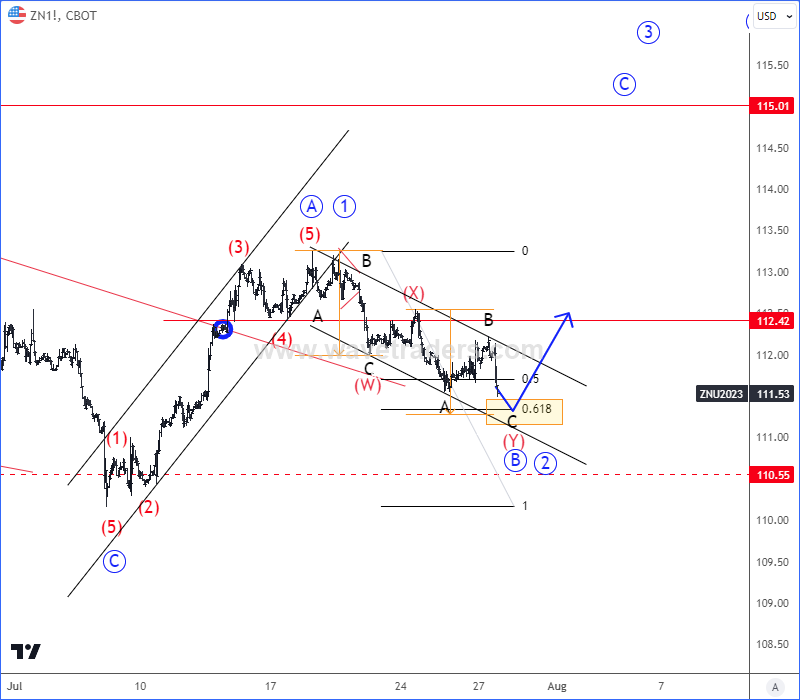
From Elliott wave perspective, 10Y US Notes is finishing a complex (W)-(X)-(Y) corrective setback in B/2 with ideal support here around 111 level. So, if we are on the right path and if 10Y US notes will continue higher into wave C or 3, then silver could easily stay in the bullish trend.
ECB Review: A Decisive Maybe
- Today, ECB decided to hike its three policy rates by 25bp. The deposit rate is now 3.75% which was widely anticipated. ECB left no clear guidance on a potential rate hike in September, as they will assess the strength of the incoming data.
- The balanced communication, weighting the lagged effect of monetary policy measures already taken and the strength of the incoming data, left no clear clues for a potential hike in September as Lagarde was very explicit about the not making any commitments, but truly staying data dependent on a meeting by meeting basis. Therefore a rate hike in September will depend on the incoming data and the staff projections in September. The weak PMI and gloomy bank lending survey released earlier this week is somewhat challenging our September rate hike call, in absence of an August rebound. However, the inflation releases (Monday next week) and end of August is essential for a firm conclusion of a September hike.
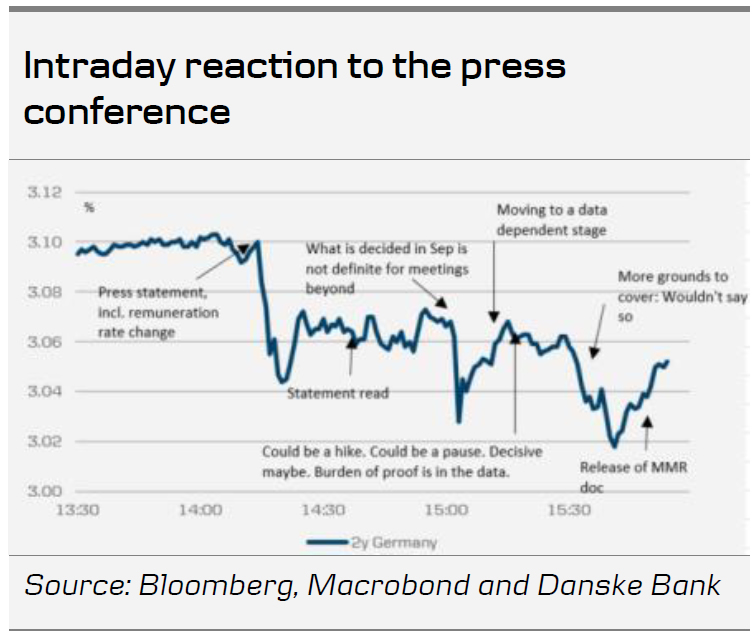
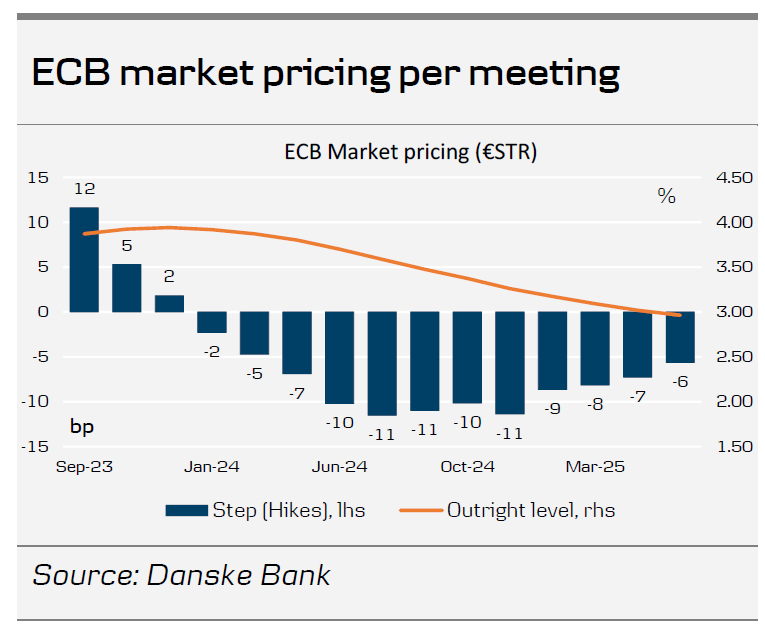
- Markets didn't react much to today's meeting and continues to have another 19bp to a 3.94% peak in the deposit rate. We find that pricing fair.
Inflation still too high
Overall, ECB acknowledge that inflation has continued to decline yet it is still 'expected to remain too high for too long'. In particular, President Lagarde highlighted that the drivers of inflation are changing as while the external price drivers are easing, it is now the domestic price drivers that are increasingly important with notably rising wages and profit margins becoming an increasingly important source of underlying inflation. In sum, the underlying inflation remains high overall. ECB highlighted that the near term economic activity have deteriorated mainly due to domestic demand as well as due to high inflation and tightening financing conditions. The economy is expected to remain weak in the near term.
Softer language on additional tightening. Door wide open for hike or pause
While the economic outlook and inflation assessment was overall in line with expectations, we take note a minor but important change to the guidance which allows that ECB have come with their final rate hike today. ECB changed the words 'brought to' to 'set' for their rate guidance to be 'sufficiently restrictive levels' to bring inflation in line with the target. That subtle change was clearly emphasised by Lagarde during the press conference where she made clear that no decision or guidance are given for the September meeting and even if they decide not to hike, this may not constitute the end of the hiking cycle, but may be a pause. She emphasised that a September decision will not say anything about the October decision. Lagarde said on a potential September hike that it is a 'definite maybe'.
Changes to reserve remuneration
ECB also announced a technical change to their operation framework. From 20 September the minimum reserve requirements (totalling around EUR160bn) will be remunerated at 0%. ECB has made this change to ensure the monetary policy transmission and the 'overall amount of interest that needs to be paid on reserves in order to implement the appropriate stance.' This change will save ECB around EUR6bn/year assuming current depo rate level.
Sharp decline in EUR/USD and broad EUR depreciation
EUR/USD moved sharply lower towards 1.10 on the dovish market interpretation of the ECB meeting and a batch of robust US data releases (strong US Advance Q2 GDP figures and lower-than-expected US jobless claims). The EUR broadly weakened in the G10 space, especially against the Dollar bloc. As we recently have highlighted, we think the general USD weakness this month has been more driven by positioning and sentiment rather than fundamentals. July has generally been characterised by disinflation signs and increasing soft landing optimism benefitting cyclical currencies and sending EUR/USD to new highs for the year. Increased risk appetite, moves in relative rates and particularly the soft June US CPI print have broadly led to a USD sell-off in July, although momentum has been reversing during the past week.
We still think the lagging effect of the restrictive monetary policy is yet to filter through to the euro area economy. In contrast to the relatively robust US economy, we think the euro area economy looks fragile and it has already been showing weakening signs, especially in the manufacturing sector. We expect that to be a headwind for the EUR in the coming months. It is also worth noting that trade weighted EUR is around all-time highs in nominal terms, which we find difficult to explain from a fundamental perspective.
Overall, we maintain our strategic case for a lower EUR/USD based on relative terms of trade, real rates and relative unit labour costs. We expect the relative strength of the US economy to weigh on the EUR/USD in the coming months, and we continue to forecast the cross at 1.06/1.03 in 6/12M. In the near-term, continued data dependence from both the Fed and the ECB will likely keep EUR/USD jumpy around US and euro area data releases in the next couple of months.