Sample Category Title
EURGBP Lacks Clear Direction as it Remains Below 0.8900
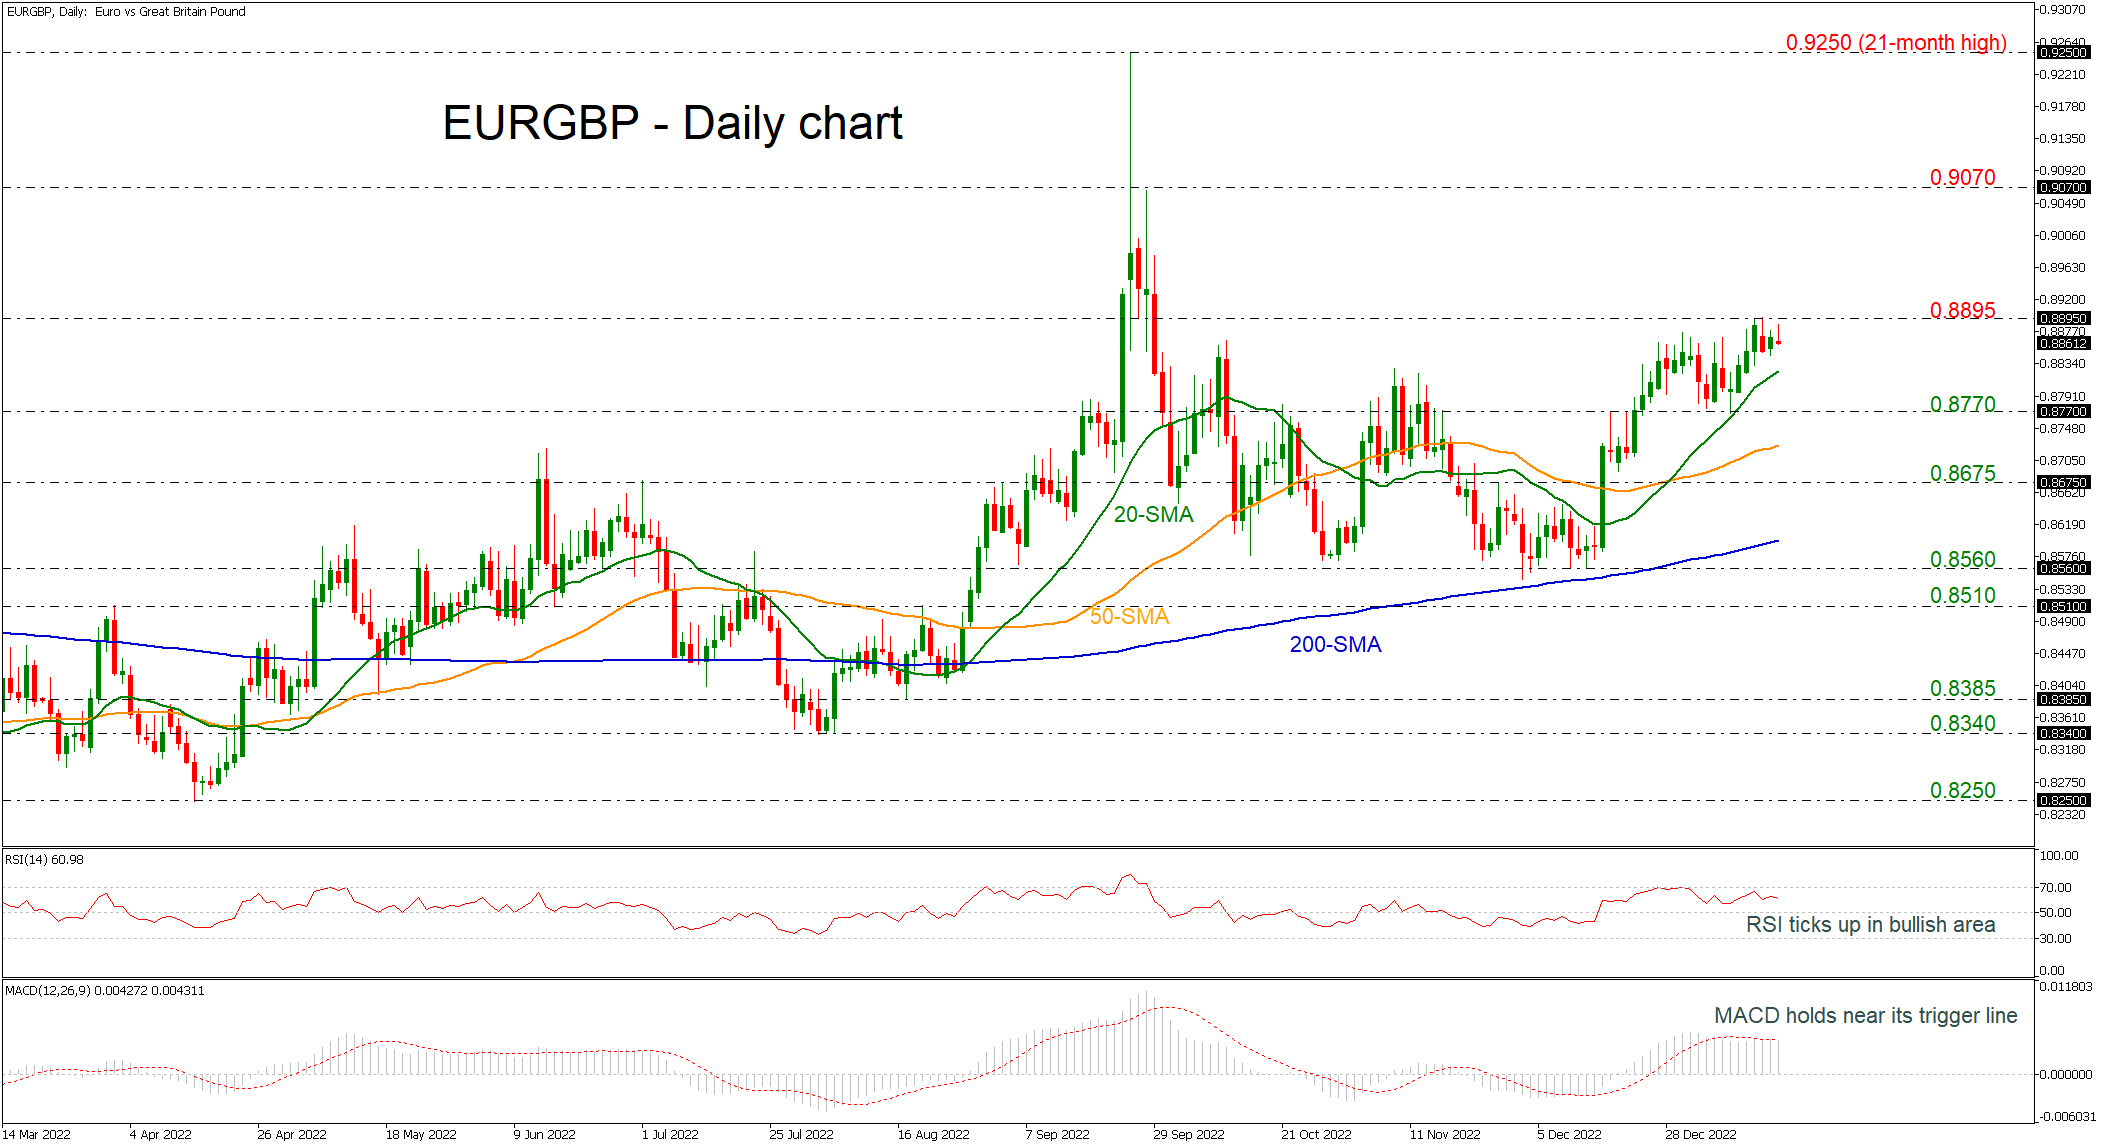
EURGBP is testing the 0.8895 resistance level, remaining well above the short-term simple moving averages (SMAs). Moreover, the price rebounded after it found support near the 0.8830 barrier, enhancing the argument that the picture may turn positive.
Looking at momentum oscillators on the daily chart, though, they suggest some declines may be on the cards in the short-term. The RSI is above its neutral 50 line but is pointing down, detecting negative momentum. The MACD is trying to overcome its trigger line in the positive territory, indicating some more positive action, but the momentum is too weak.
If the bulls retake control, price advances may stall initially near the latest highs at 0.8895, and subsequently near the 0.9070 bullish spike, registered on September 28. In such a case, the 21-month high of 0.9250 would raise the likelihood for more advances.
On the other hand, immediate support could come from the 20-day SMA at 0.8820 ahead of the 0.8770 support level. A significant leg below this area could send prices towards the 50-day SMA at 0.8730 before the market retests the 0.8675 barrier. Then, if the market fails to hold above this level, the next stop could be at the 200-day SMA near 0.8600.
In the bigger picture, the pair is neutral as long as it is holding beneath the 0.8900 round number and above the 0.8560 support. In case it violates 0.8895, the bulls could take the upper hand.
GBPUSD Edges Higher after Completing Golden Cross
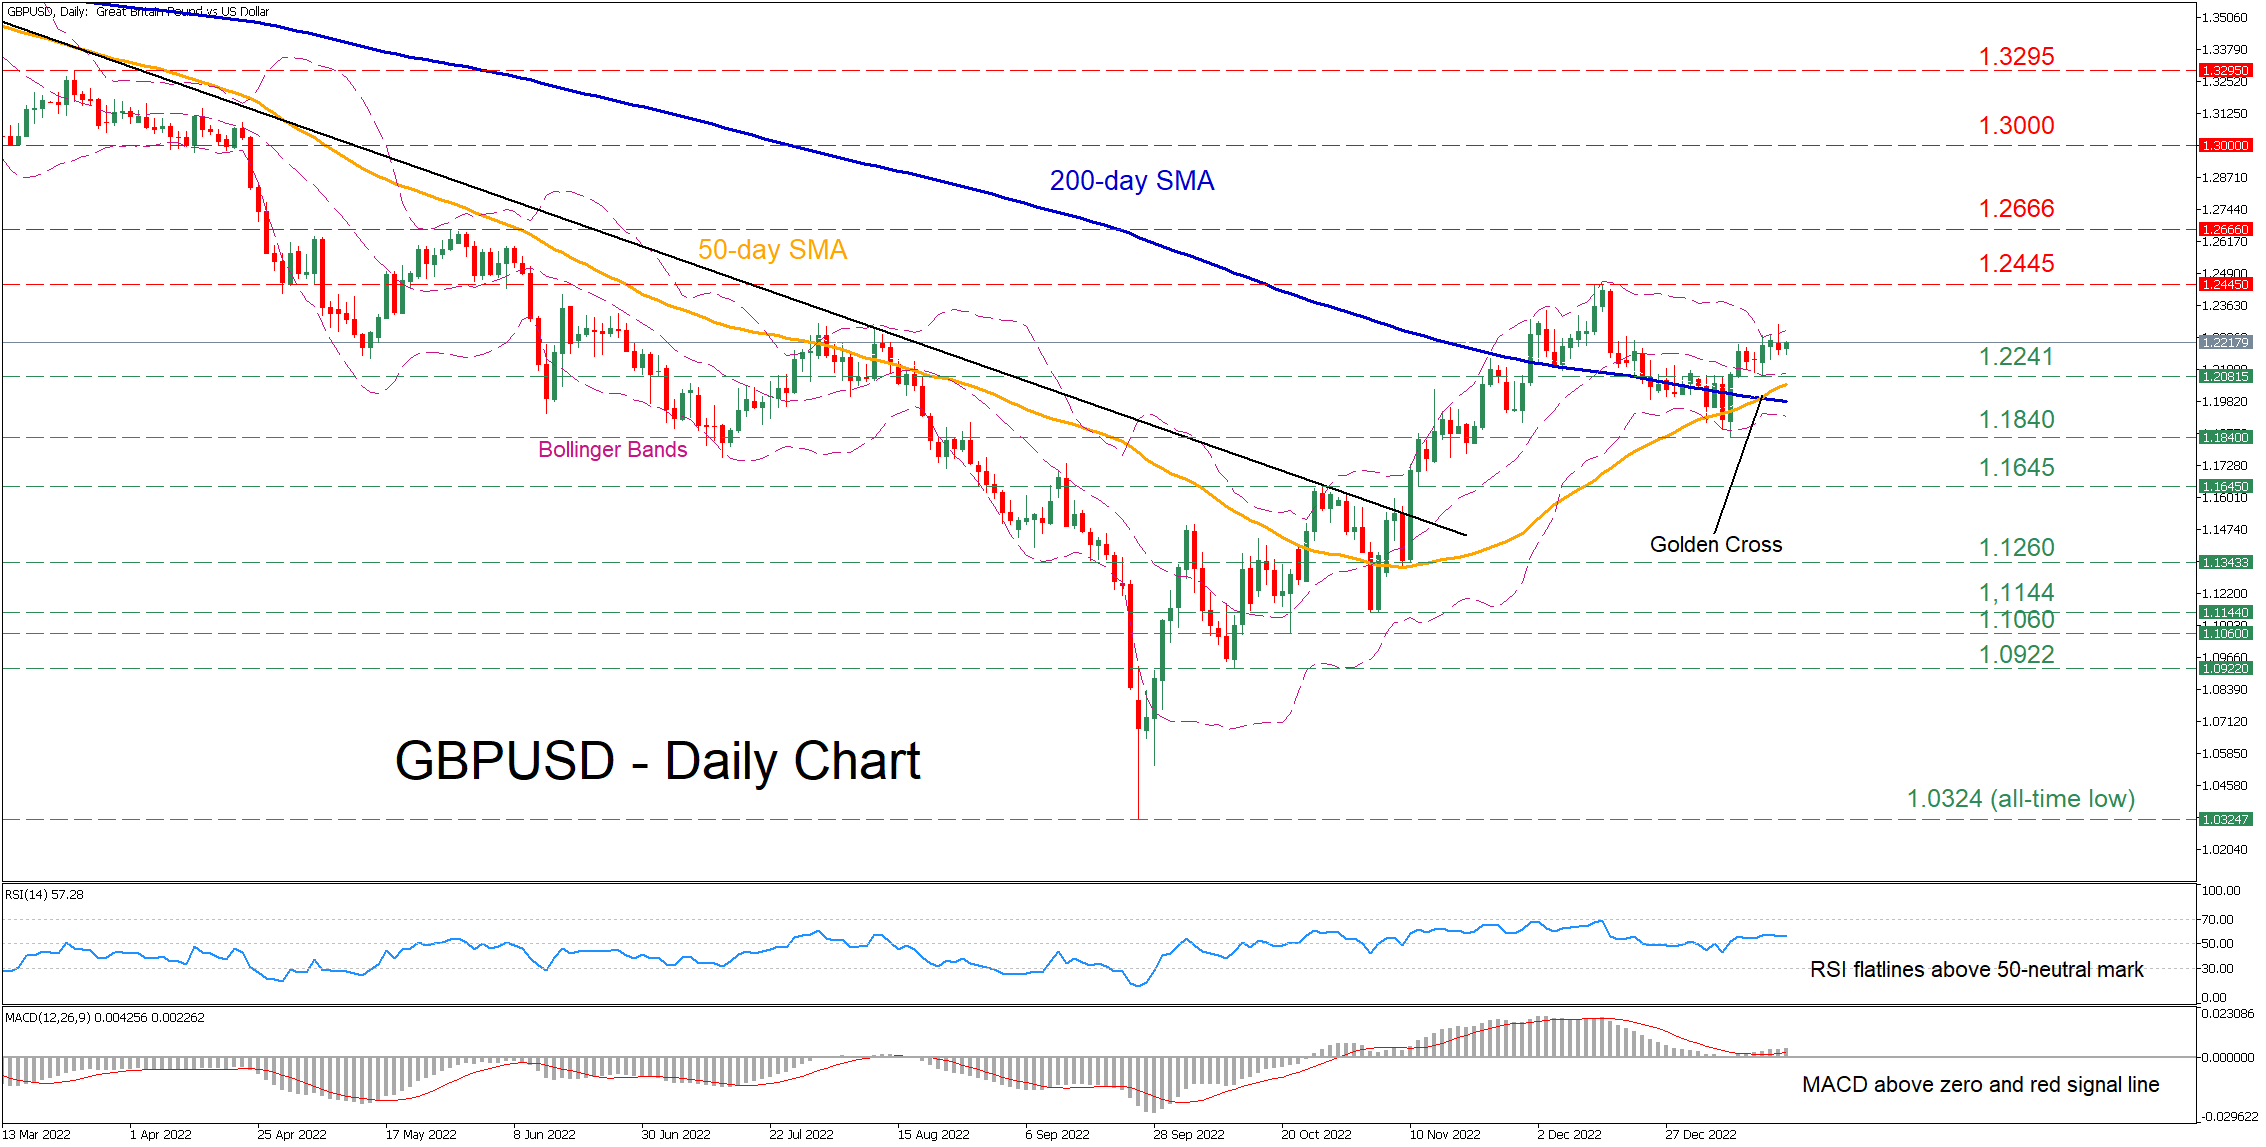
GBPUSD has been attempting a rebound since September when the pair recorded an all-time low of 1.0324. Even though the price experienced a minor pullback after its advance got rejected at 1.2445, the recent completion of a golden cross between the 50- and 200-day simple moving averages (SMAs) has induced upside pressure.
The short-term oscillators currently suggest that bullish forces are reigning supreme. Specifically, the RSI is hovering above its 50-neutral mark, while the MACD histogram is strengthening above both zero and its red signal line.
Should the positive momentum intensify further, the pair could initially test the recent rejection region of 1.2445. Breaking above that zone, the bulls could aim for the May peak of 1.2666. Further advances could then come to a halt at the 1.3000 psychological mark, which acted as strong support in March 2022.
On the flipside, bearish actions could send the price to challenge the recent support of 1.2241. Should that floor collapse, the January low of 1.1840 may curb potential declines. Diving lower, the pair might face the October resistance of 1.1645, which could act as support in the future.
Overall, GBPUSD seems to have the necessary momentum to resume its medium-term rebound. Therefore, a break above the recent rejection point of 1.2445 could confirm the bullish scenario.
US Oil: Bulls Target 90.26
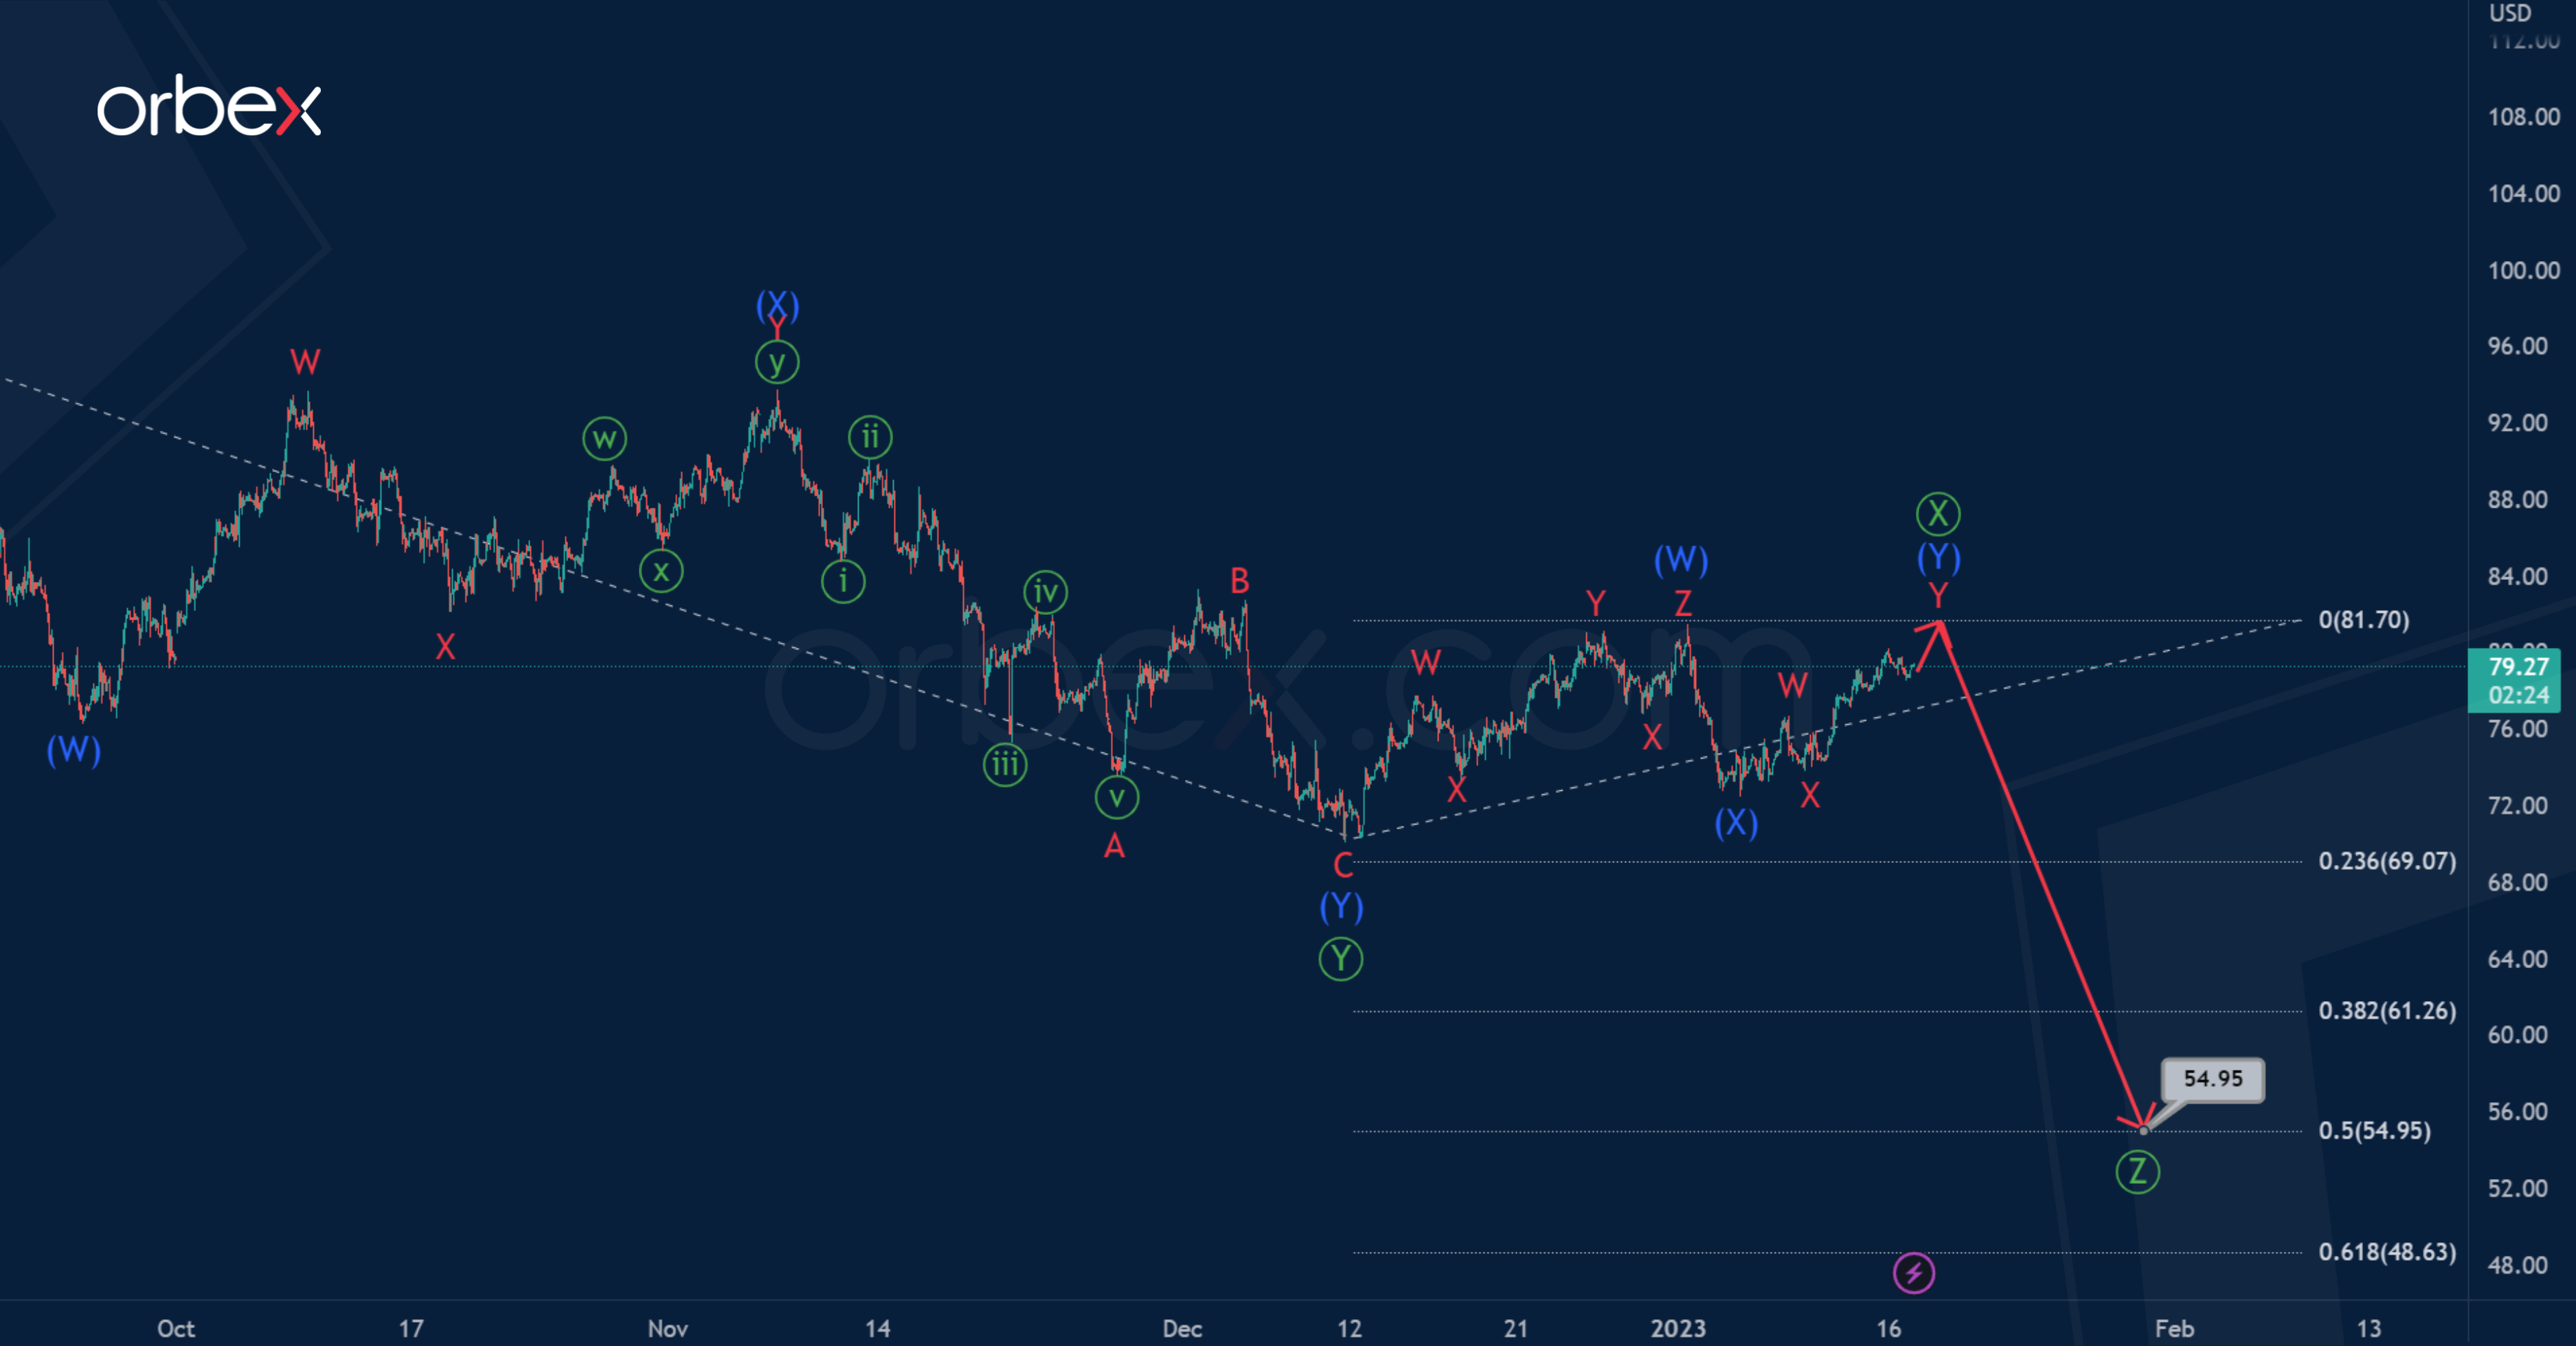
US Oil suggests the formation of a triple zigzag pattern Ⓦ-Ⓧ-Ⓨ-Ⓧ-Ⓩ. The primary waves Ⓦ-Ⓧ-Ⓨ seem to be fully completed.
In the last section of the chart, we see the formation of an ascending primary intervening wave Ⓧ. Perhaps it takes the form of an intermediate double zigzag (W)-(X)-(Y), and now the price is directed upwards in the last actionary wave (Y).
It is likely that the wave (Y) will end near 90.26. At that level, wave Ⓧ will be at 38.2% along the Fibonacci lines of primary wave Ⓨ.
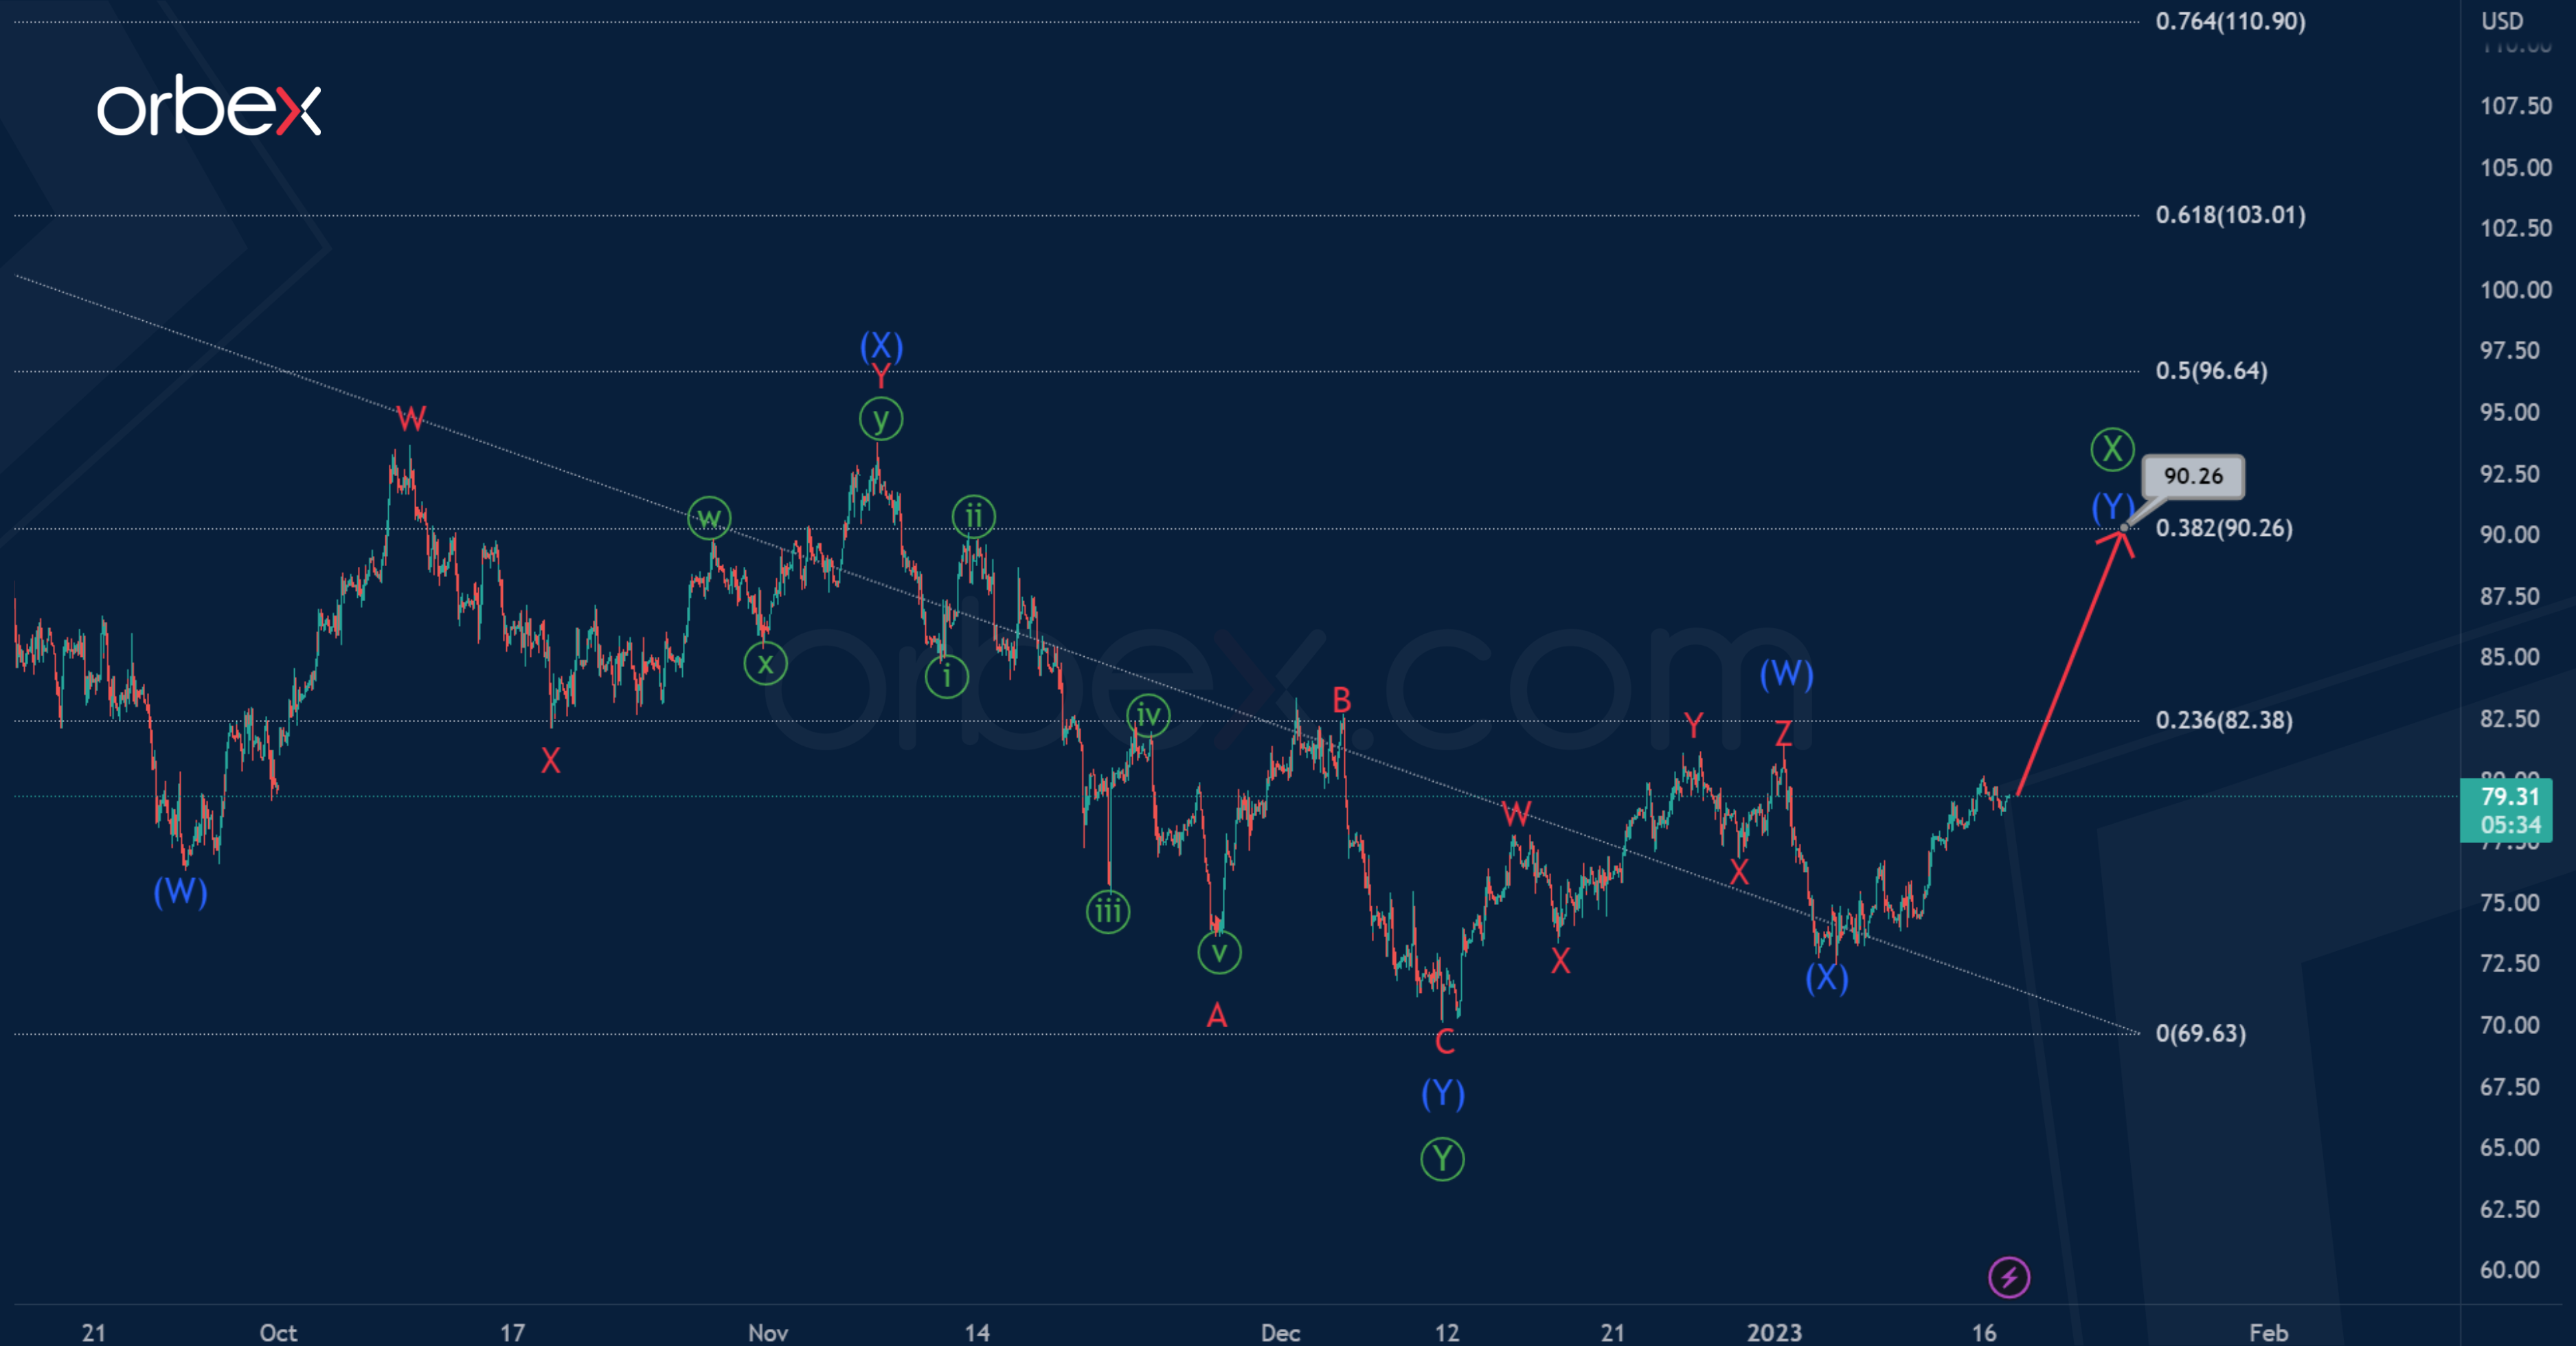
An alternative scenario assumes that the intervening wave Ⓧ will end at the previous high of 81.70, then the market will turn around.
Most likely, in the very near future we will observe the decline and development of the primary actionary wave Ⓩ.
There is a high probability that the bearish trend will continue to 54.95. At that level, primary wave Ⓩ will be equal to half of wave Ⓨ.
Nasdaq 100 Grinds Higher
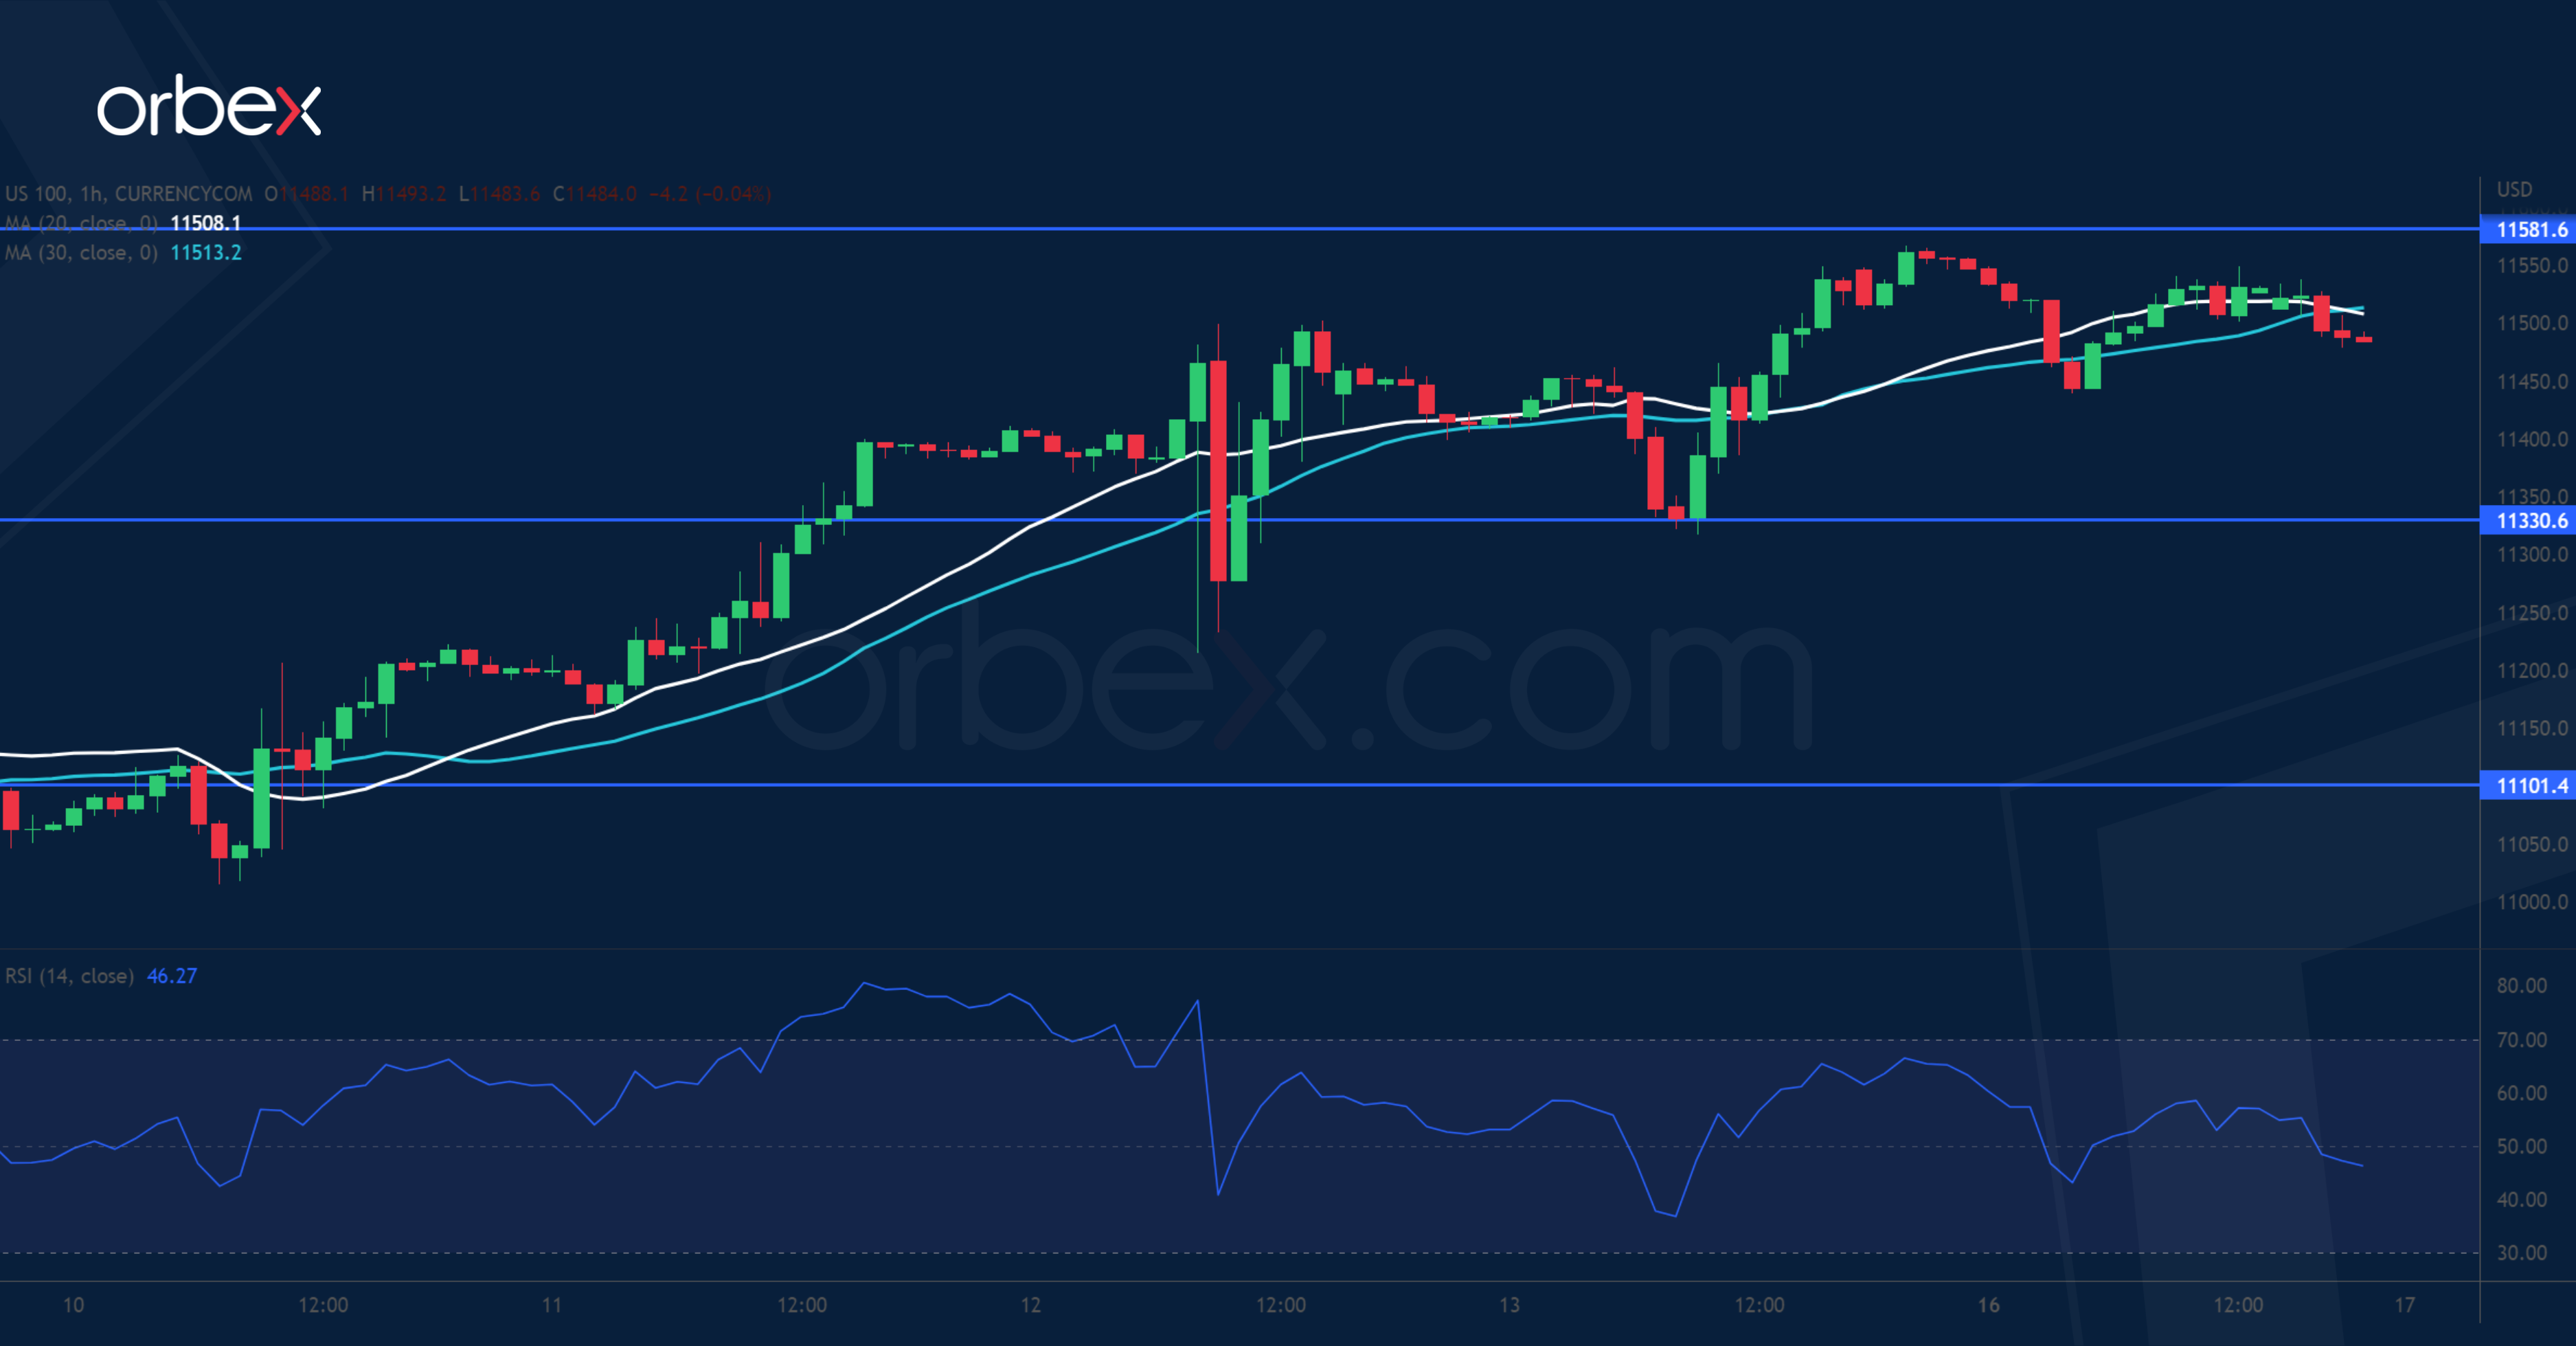
The Nasdaq 100 rallies as improved US consumer sentiment showed a falling inflation outlook. The direction remains up as pullbacks have been met with enthusiasm so far. The index is pushing into the supply zone from the mid-December sell-off with 11580 as the first resistance. Its breach may gather more interests and send the price to 11900 right under last month’s spike (12200). A break above that area could turn the mood around in the medium-term. 11330 is the immediate support and 11100 a second line of defence.
XAG/USD Tests Resistance
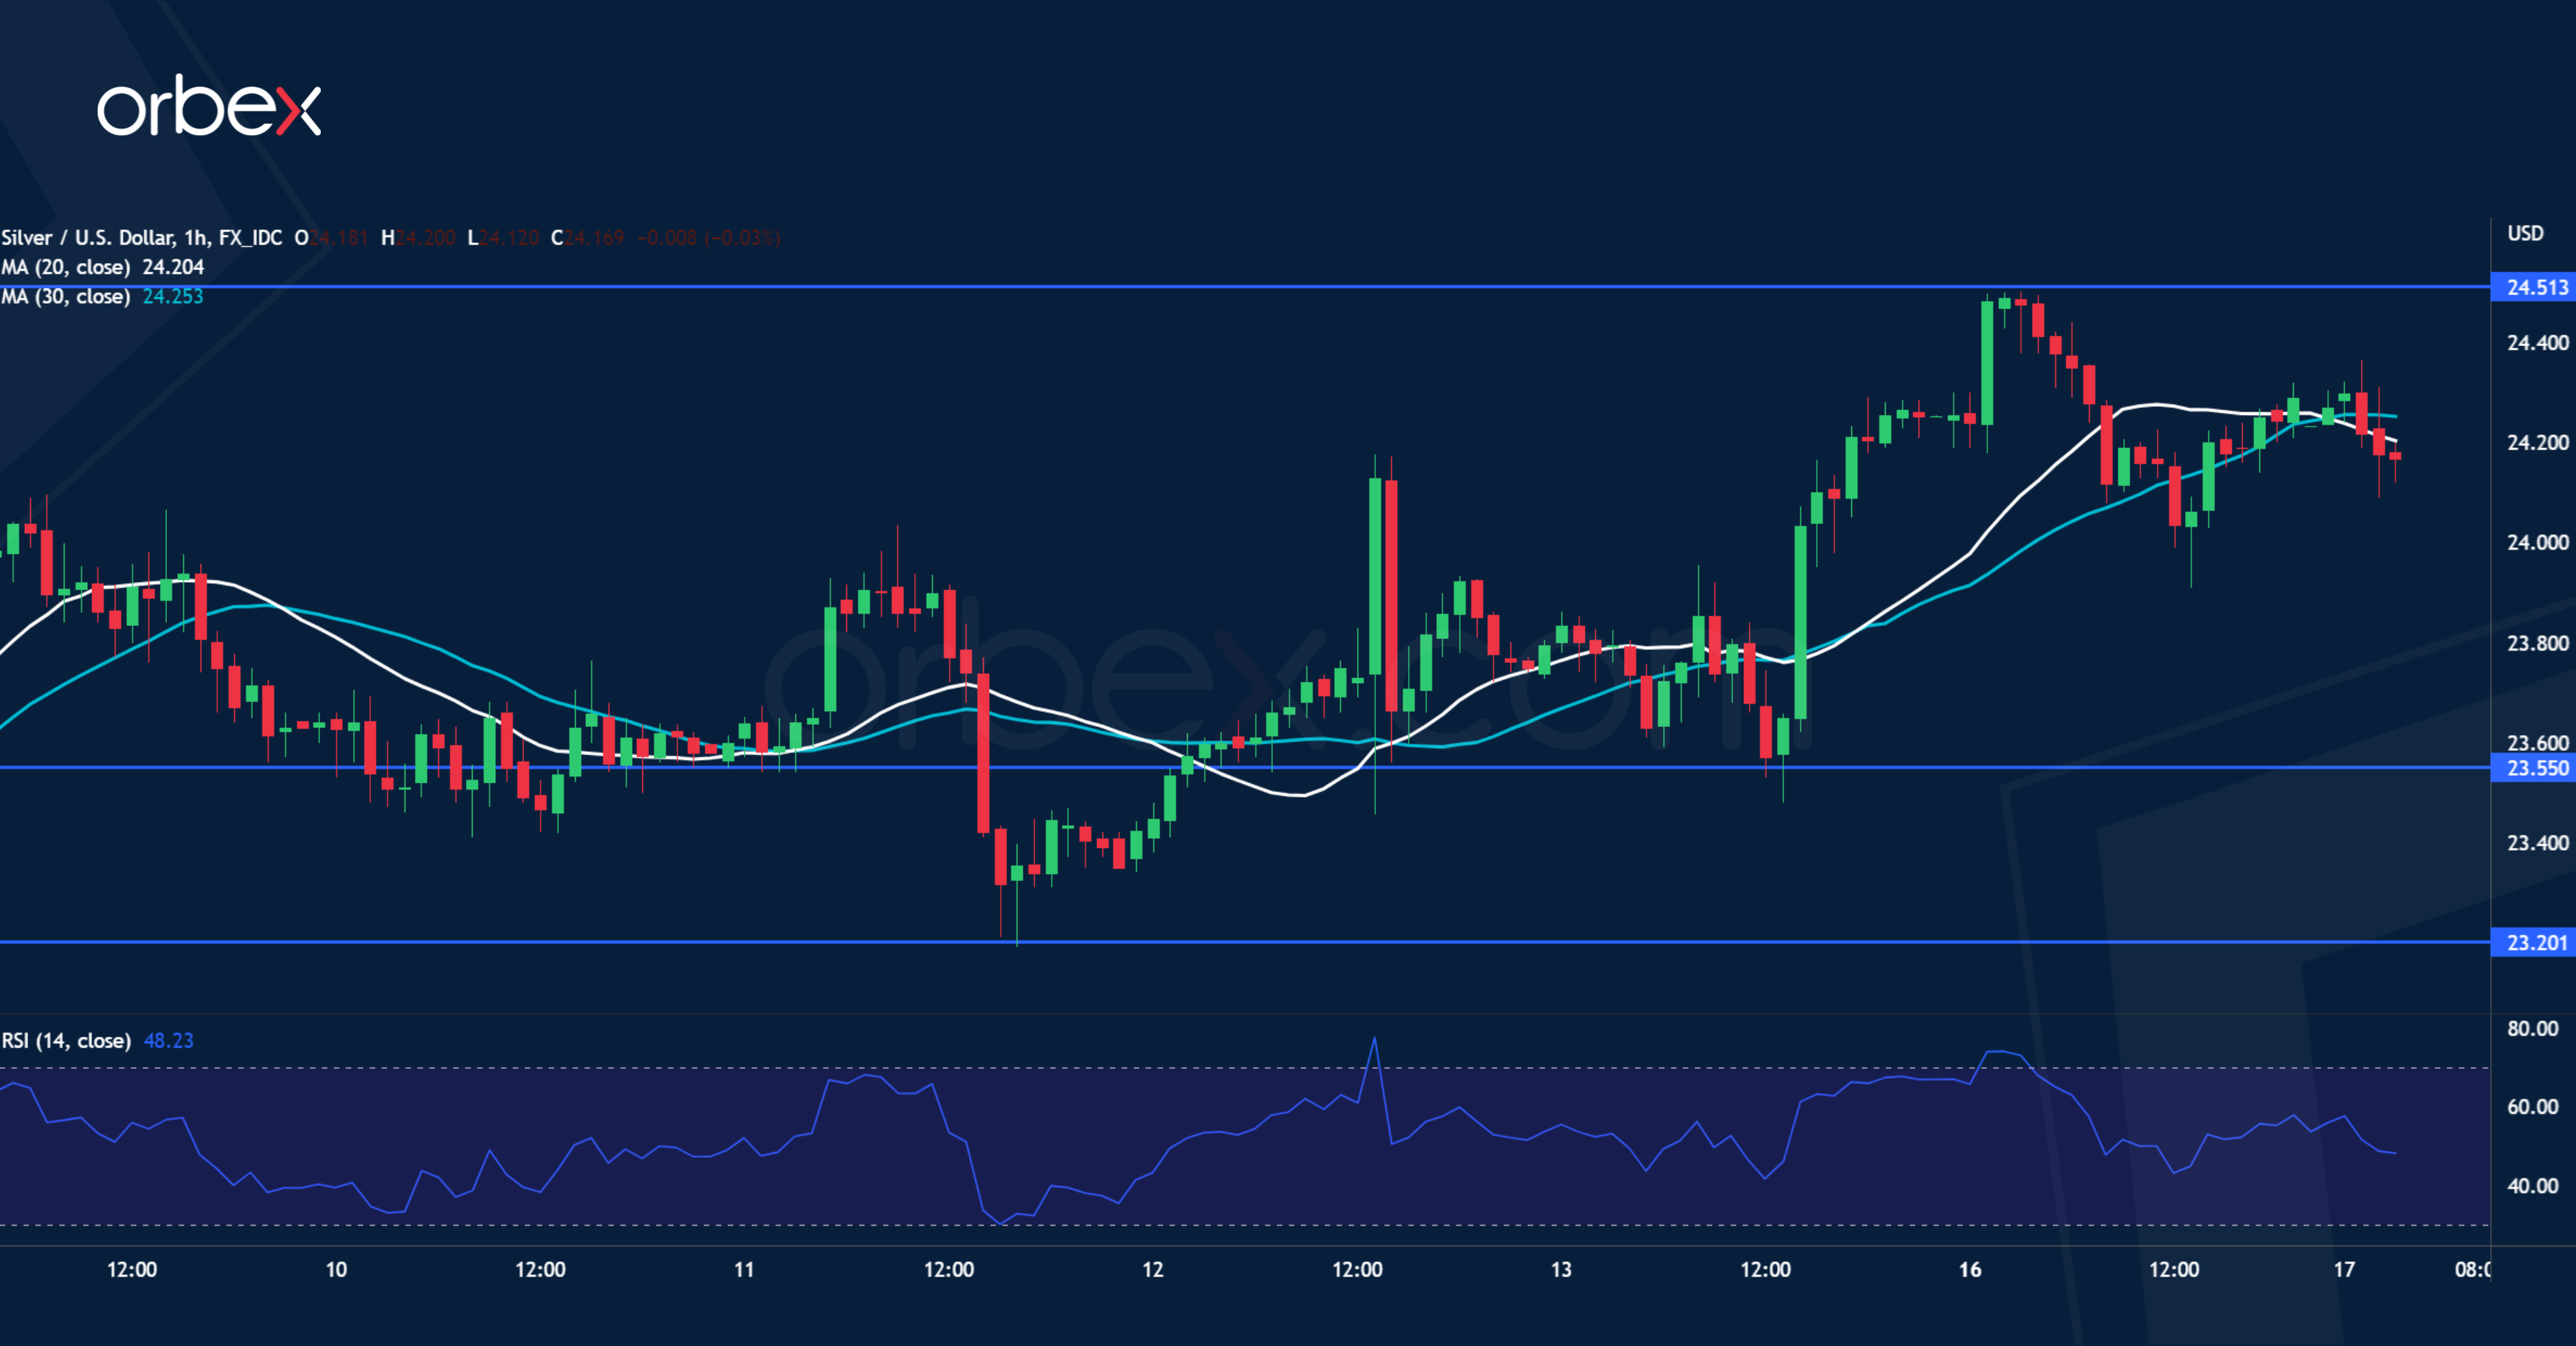
Silver steadies as traders continue to dump the US dollar. The price is testing the support-turned-resistance at 24.50 from last April’s sharp sell-off. The previous test caused a limited fallback, but a bounce off 23.20 indicated that the bulls are still in the game. A bullish breakout would trigger a runaway rally as sellers scramble to cover, opening the door to the psychological level of 26.00. In the meantime, after the RSI showed a double top in the overbought area, the metal may seek support above 23.55.
EUR/USD Keeps High Ground
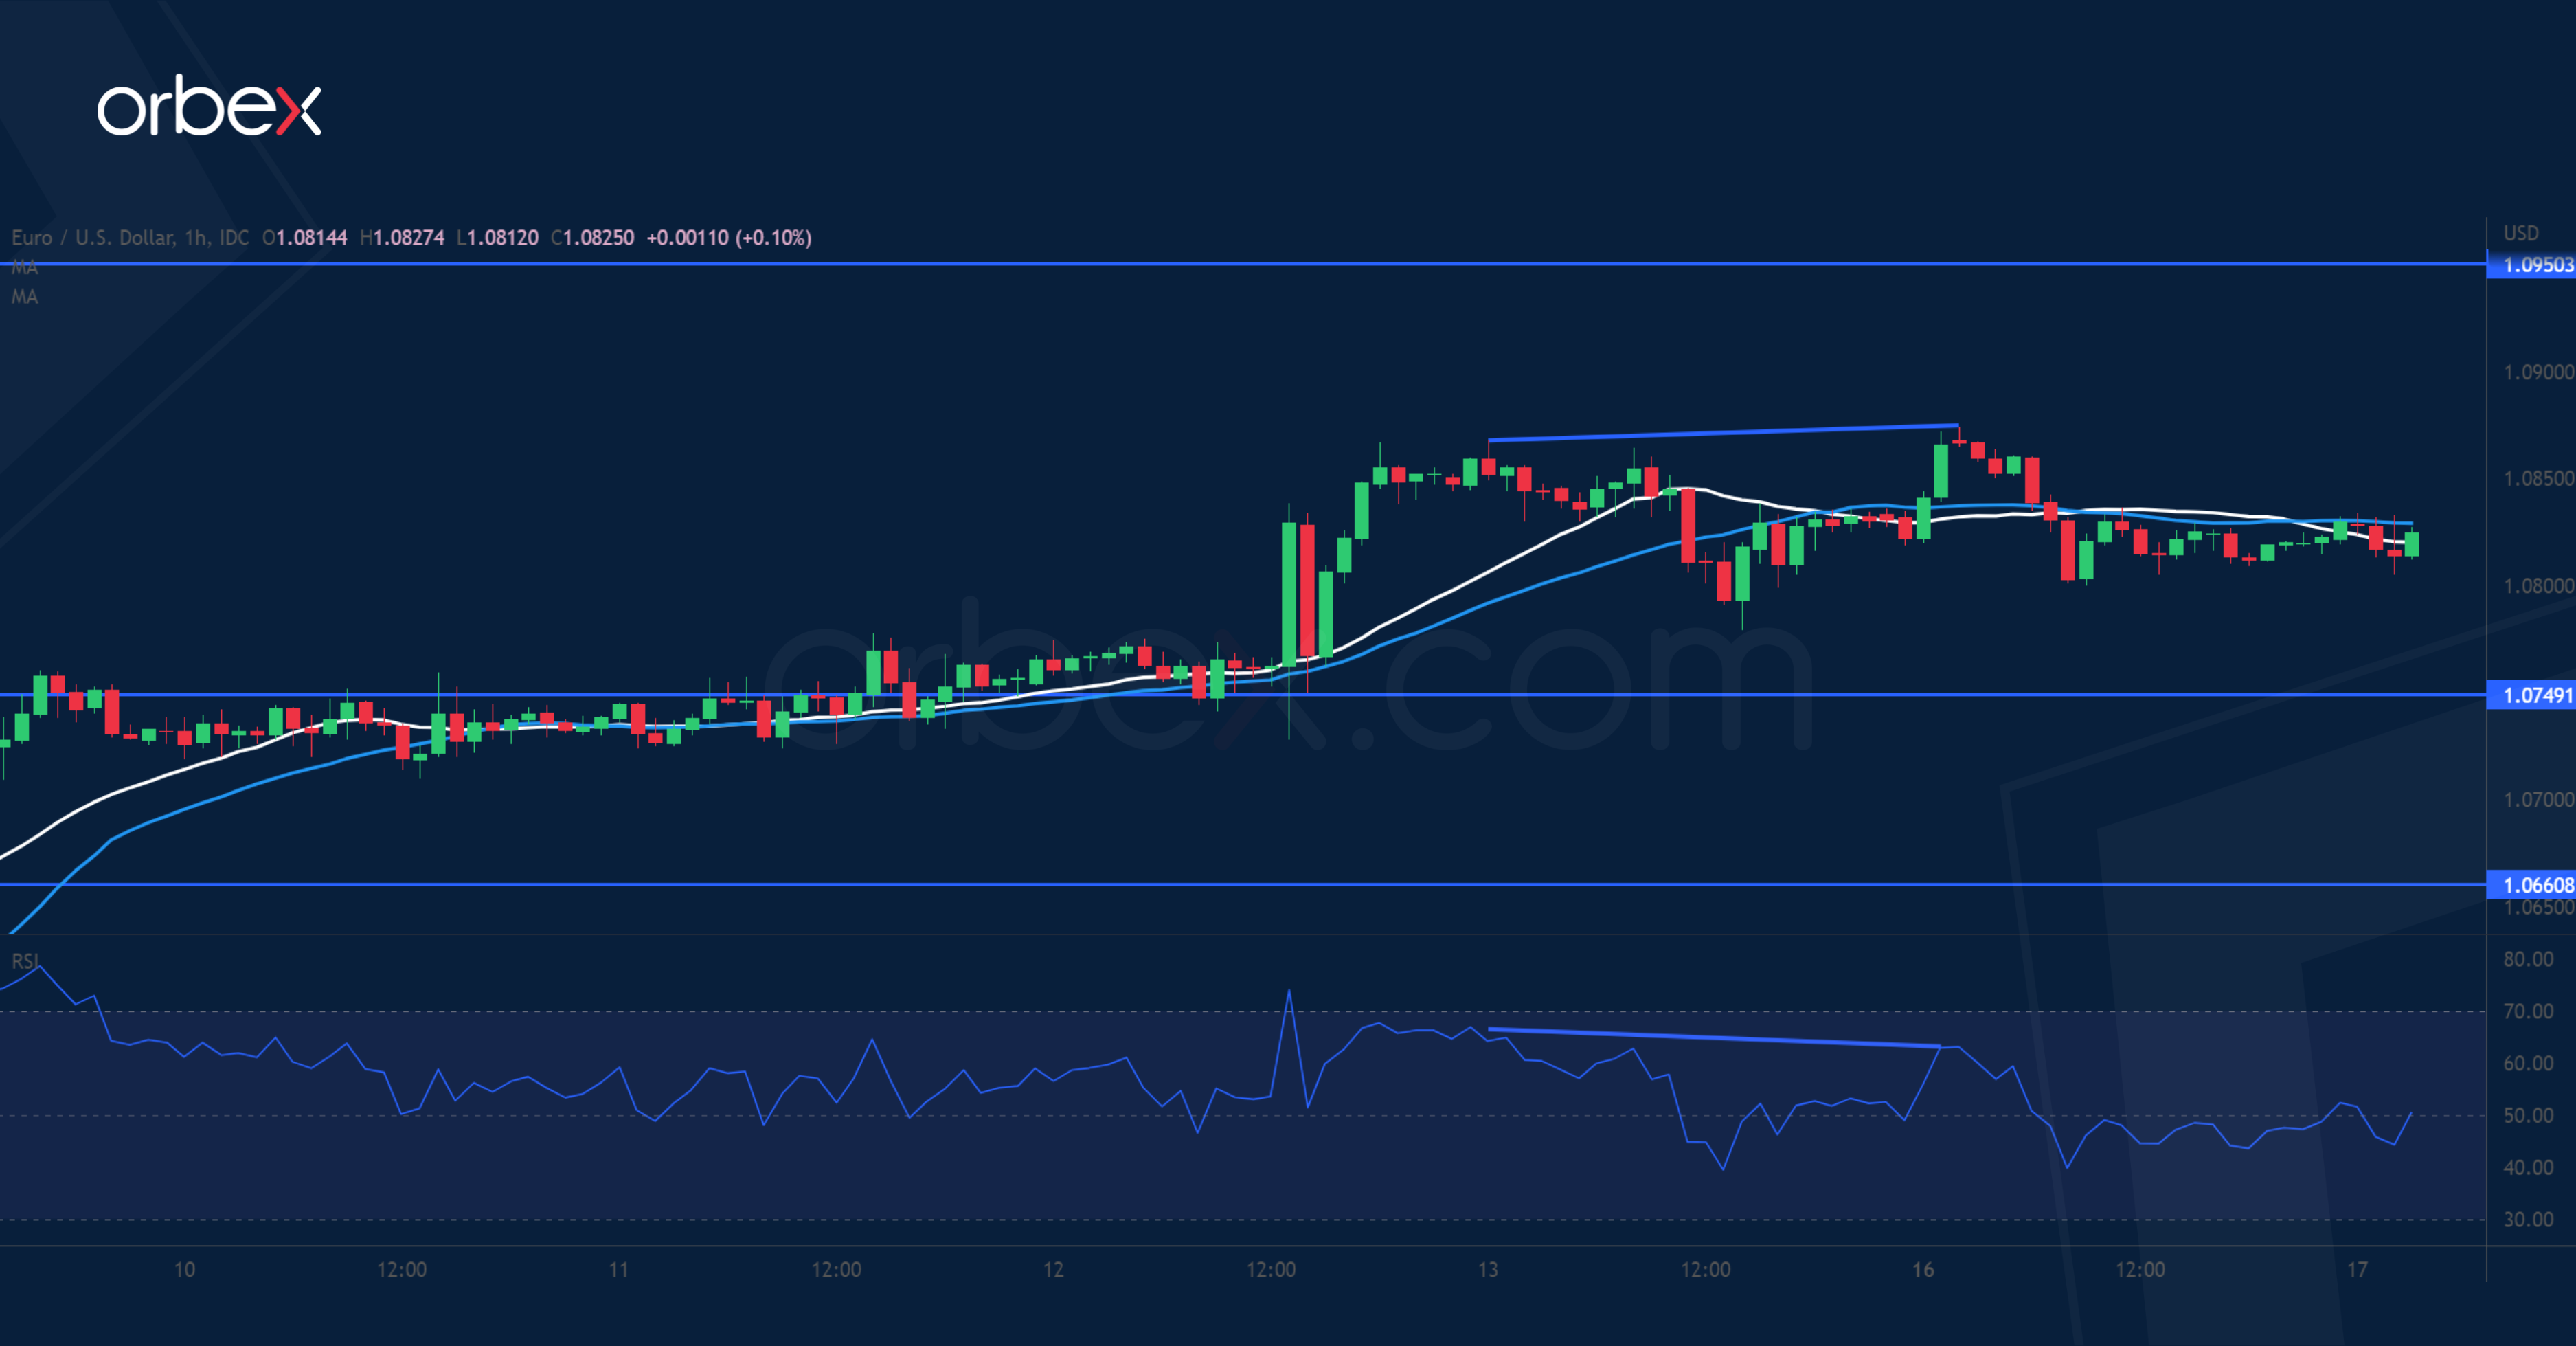
The US dollar struggles on speculation that the Fed is nearing the end of its tightening. The pair is holding on to its gains after breaking above May’s high of 1.0780. A bearish RSI divergence suggests a deceleration in the momentum and may foreshadow a potential pause in the rally. But as sentiment improves, the bulls may see a pullback as an opportunity to stake in with 1.0750 as the first support. 1.0660 at the origin of the latest breakout and on the 30-day moving average is a major level. 1.0950 is the target in case of a bounce.
EUR/USD’s Upside is Capped Around 1.0942
Markets
Yesterday’s most striking market move happened in the gas market. Europe’s main reference, the Dutch TTF future, dropped more than 14% to the lowest level since September 2021 (55.45 €/MWh). Well-filled storage sites and the up until now very mild winter explain the consistent downtrend over the past months. Breaking through key support at 61.50 put an accelerator on the move yesterday. Other markets, including equities (ended flattish) and core/German bonds (moves between -2.7 bps at the front and +1.3 bps at the long end) showed little signs of life in absence of economic data and guidance from the US. EUR/USD at first sought to extend recent gains but in the end closed, you guessed it, almost unchanged in the low 1.08(2) area. Sterling held stable as well around the EUR/GBP 0.8867 resistance level (Oct. 2022 high).
The Asian session this morning revolves around the Chinese Q4 GDP release. Numbers crushed consensus with the economy flatlining Q/Q, defying expectations for a 1.1% contraction. Y/Y and YtD, China’s economy is now about 3% larger. The accompanying monthly data series gives a flavour of where the upbeat surprise came from. Industrial production rose 1.3% YtD while retail sales were less worse than feared (-0.2% YtD vs -0.8% expected) despite the country’s messy exit from zero-Covid. Property investment contracted 10% YtD, highlighting the ongoing malaise in the sector. The Chinese stock indices and the yuan don’t profit though, on the contrary. USD/CNY extends a rebound after hitting support at 6.69 (61.8% retracement on the 2022 rally) on Monday to 6.768 today as the PBOC injected short-term cash by the most in four years. In an interview with the FT published this morning, ECB’s Lane said risks of raising the policy rate further are not yet two-sided, meaning that the cost of doing too little still outweighs that of doing too much. According to the chief economist, rates currently are in “ballpark” of neutral. The euro trades stoic around yesterday’s closing levels. The dollar doesn’t pick sides either. US Treasuries open lower after the long weekend with yields advancing 1.3-5.3 bps.
Today’s economic calendar already used up a lot of its ammo with the Chinese GDP release. Remaining data contains a solid UK labour market report. Employment rose by 27k in the three months through November vs a stagnation expected. Earnings also surpassed consensus estimates, coming in at 6.4%. A first glimpse for December employment was slightly less than forecasted (28k vs 60k). EUR/GBP quickly erased a small uptick shortly after the release to trade at 0.887 currently. For the dollar, we’re on the lookout whether last week’s tentative bottoming out signals continue. EUR/USD’s upside is capped around 1.0942 with first downside protection kicking in at 1.073. The same applies for core bond yields. The US 10y yield hit important support last week at 3.42%. The technical picture for the German 10y yield is a bit more neutral.
News Headlines
Euronext yesterday announced that the European expansion of Euronext Clearing to Euronext derivatives markets is planned for Q3 2024. It will be the final step in a process which started in the April 2021 purchase of Borsa Italiana which included the CC&G clearing house in Milan. That way, Euronext no longer had to completely rely on third-party providers such as LCH (subsidiary of London Stock Exchange). Euronext will pay a €36mn termination fee with LSE and is willing to sell its 11.1% stake in LCH France back to its British majority owner. Euronext will by the end of 2024 be able to manage the entire trading value chain of its markets: directly operating clearing activities for cash, listed derivatives and commodities markets, providing one single platform for clients to access information on collateral, risk and clearing, implementing a new Value-at-Risk methodology and other smaller efficiency gains.
Australian Westpac Consumer confidence rose from 80.3 to 84.3 in January, which is the biggest increase since April 2021. The main driver for the improvement was interest rates. Consumers have been responding to rate hikes from the RBA every month since May last year, but in January there was no meeting and thus no increase, offering some temporary relief to borrowers. Overall, sentiment remains in deeply pessimistic territory, but there signs that consumers can see some light at the end of the tunnel. Confidence among mortgage holders rose and there was an improvement in the outlook for the labour market. House prices are still expected to rise over the next 12 months, which is something to keep an eye on. AUD/USD holds around 0.6950.
GBP/JPY Daily Outlook
Daily Pivots: (S1) 156.17; (P) 156.62; (R1) 157.20; More...
Intraday bias in GBP/JPY is turned neutral first as it recovered ahead of 155.33 support. Outlook will remain bearish as long as 161.22 resistance holds. Decisive break of 155.33 will resume whole decline from 172.11 to 153.70 fibonacci level.
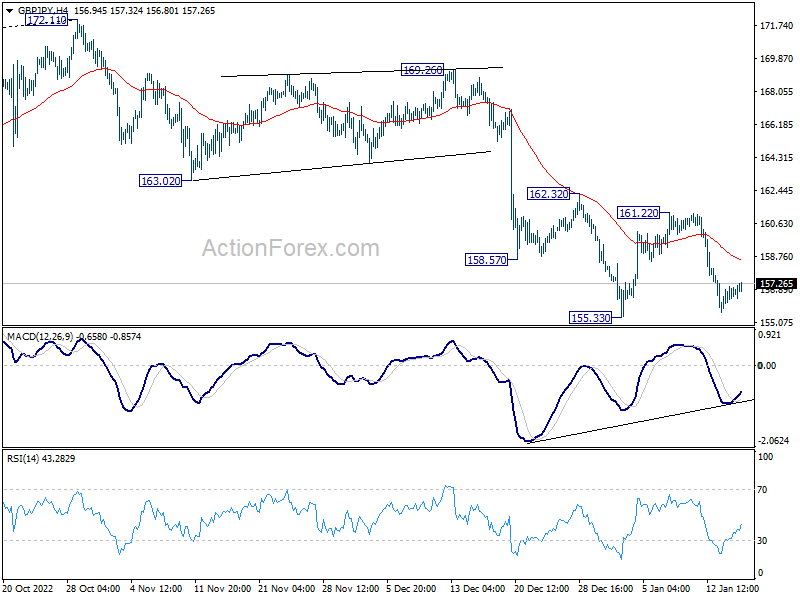
In the bigger picture, as long as 163.02 support turned resistance holds, decline from 172.11 medium term top is expected to continue to 38.2% retracement of 123.94 to 172.11 at 153.70. Sustained break there will raise the change of trend reversal and target 61.8% retracement at 142.34. Nevertheless, break of 163.02 support turned resistance will argue that the decline has completed, and retain medium term bullishness.
EUR/JPY Daily Outlook
Daily Pivots: (S1) 138.45; (P) 138.87; (R1) 139.51; More....
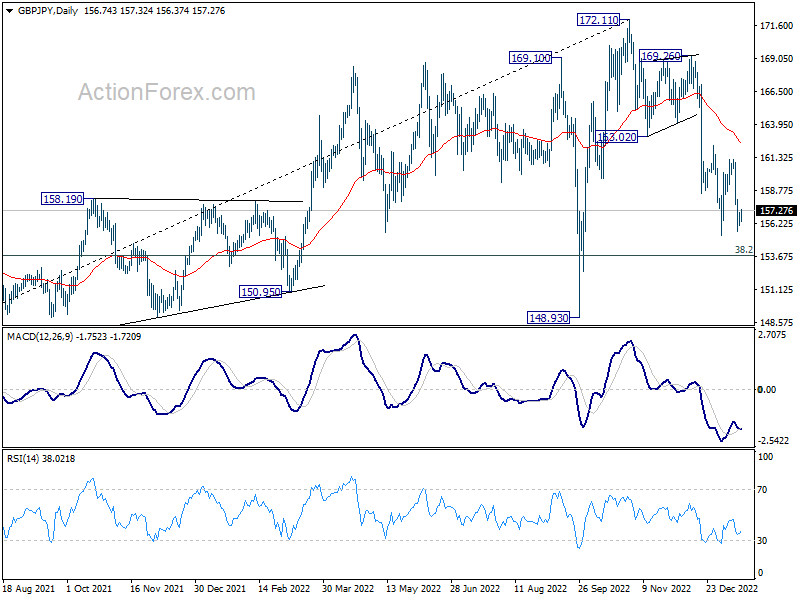
Intraday bias in EUR/JPY is turned neutral first as it recovered ahead of 137.37 support. Outlook will stay bearish as long as 142.84 resistance holds. Break of 137.37 will resume whole decline from 148.38 to 135.40 fibonacci level next.
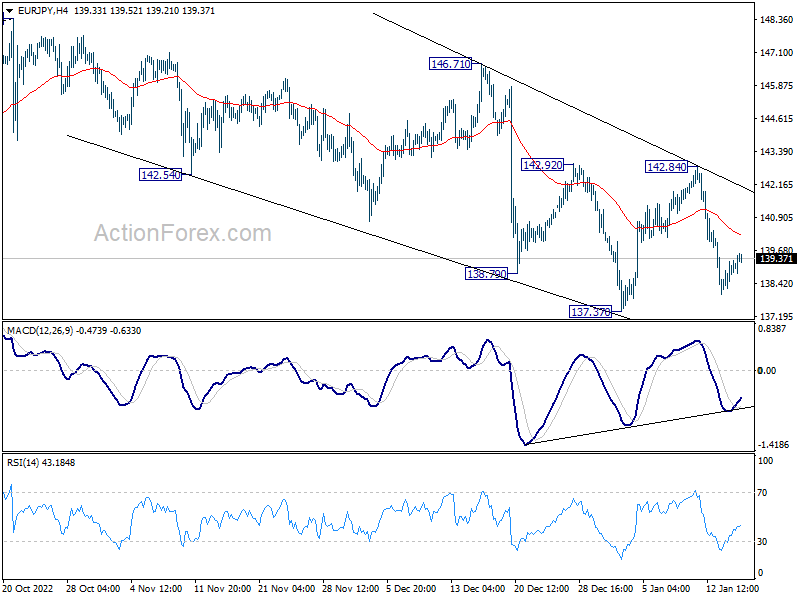
In the bigger picture, as long as 55 week EMA (now at 138.64) holds, larger up trend from 114.42 (2020 low) is still in progress for 149.76 long term resistance. However, firm break of 55 week EMA will bring deeper fall to 38.2% retracement of 114.42 to 148.38 at 135.40. Sustained break there will raise the chance of trend reversal, and target 61.8% retracement at 127.39.
EUR/GBP Daily Outlook
Daily Pivots: (S1) 0.8854; (P) 0.8866; (R1) 0.8886; More...
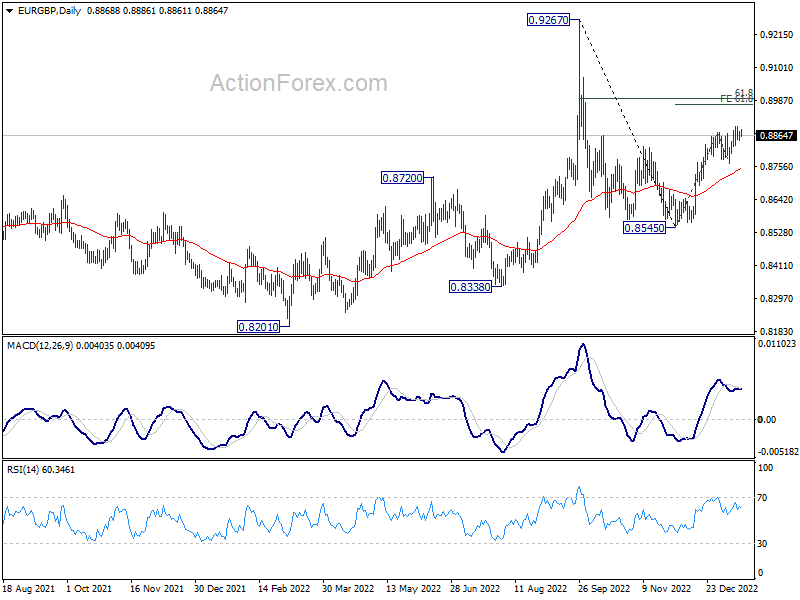
EUR/GBP is staying in consolidation from 0.8896 and intraday bias remains neutral first. Further rally is expected as long as 0.8768 support holds. On the upside, break of 0.8896 will resume the rally from 0.8545 to 61.8% projection of 0.8545 to 0.8876 from 0.8768 at 0.8973.
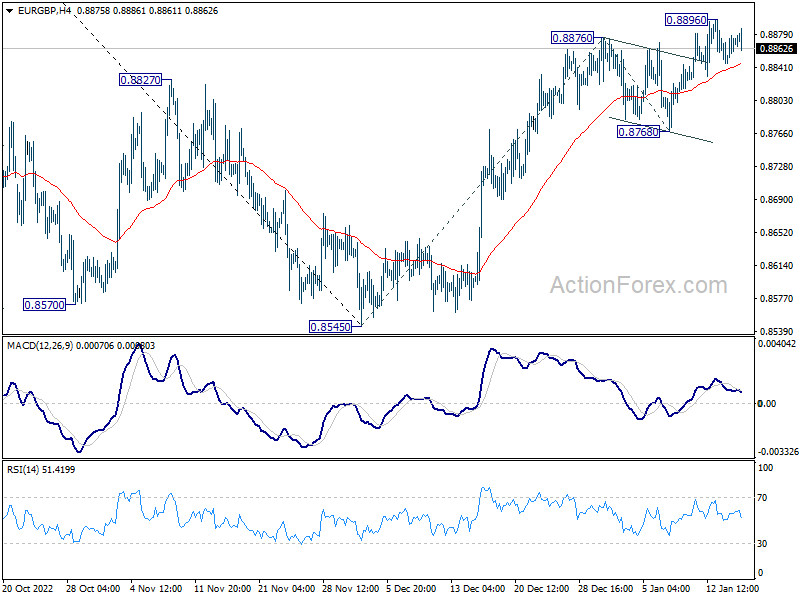
In the bigger picture, with 55 week EMA (now at 0.8616) intact, the favored case is that rise from 0.8545 is part of the whole up trend from 0.8201 (2022 low). Sustained trading above 61.8% retracement of 0.9276 to 0.8545 at 0.8997 will pave the way to retest 0.9267 high next. However, break of 0.8768 support will dampen this view and bring retest of 0.8545 low instead.