Sample Category Title
EUR/USD Started a Fresh Decline
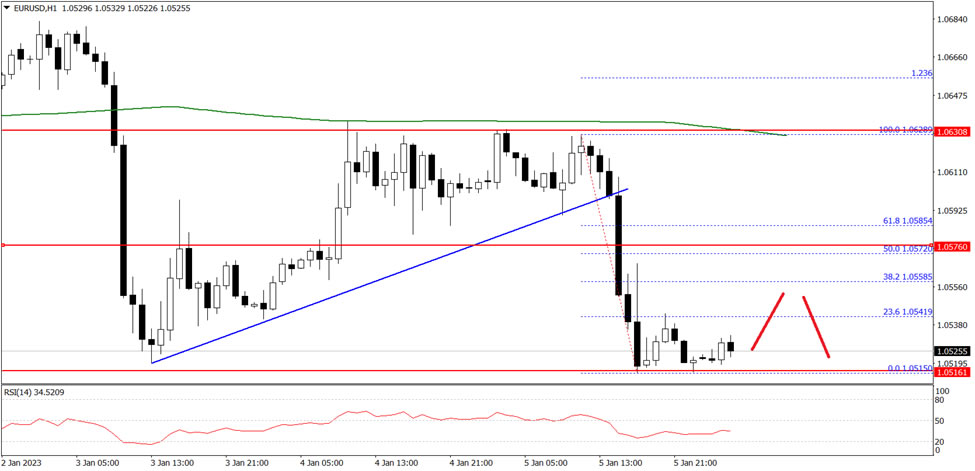
The Euro started a fresh decline from the 1.0630 resistance zone against the US Dollar. The EUR/USD pair declined below the 1.0600 level to move into a bearish zone.
The pair even dived below the 1.0570 level and the 50 hourly simple moving average. It traded as low as 1.0515 on FXOpen and is currently consolidating losses. An immediate resistance is near the 1.0540 level.
The first major resistance is near the 1.0570 level. A break above the 1.0570 resistance level could start another increase. In the stated case, it could rise towards the 1.0630 resistance.
Conversely, the pair might start another decline below 1.0515. The next key support is near 1.0500, below the pair could drop towards the 1.0460 level. Any more losses might send the pair towards the 1.0420 level in the near term.
Can Canadian Jobs Numbers Change the BOC’s Mind?
The Loonie has been suffering a bit for a combination of factors. The slide in the price of crude, is one of them, but crude prices are volatile in the current conditions. A more enduring factor is the perception that the BOC is likely to be the first major central bank to pause in the current hiking cycle.
So, if the Canadian dollar were to regain any lasting strength, it would imply a change in the perception of the BOC's outlook. And that would require some concrete data that breaks from the trend. Fortunately, there is a trove of important data scheduled for release later today: the oft overlooked Canadian employment data. That's because it comes out at the same time as the US NFP, and that can put more volatility into the greenback and markets in general.
Why the pause, BOC?
The possibility of keeping rates unchanged or a now meager 25bps hike is currently at 50-50 chances among forecasters. That's because the notion that the BOC has done enough in terms of monetary policy tightening is growing among policymakers, but it's not a clear consensus, yet. Compare this to their southern neighbor, where analysts are in agreement that the Fed will hike by at least 25bps.
That implies the interest rate spread between the two countries is going to widen. Meanwhile, Canada's inflation has sort of flattened out just under 7.0%, falling by a decimal every couple of months since the summer. That's not far off from the latest US CPI figures, suggesting that the real interest rate spread will widen against the loonie, unless the BOC hikes.
The employment situation has stagnated
Canada is forecast to have created 7.6K jobs, down from the 10.1K reported in the prior month. But job creation has been much more volatile in Canada lately, making it hard to define a trend. The unemployment rate, which had been trending slowly downwards since the jump higher in the summer, is expected to tick up to 5.2% from 5.1% prior.
The issue for the BOC, however, is that the tight labor market has been pushing wages higher at a rate above 5.0% all through the latter half of the year. This is still below the inflation rate, which means that for the average worker, they are making less real money each month. Not a situation that's conducive to supporting consumer demand. While the BOC might have had some initial trepidation about a wage-price spiral, that one hasn't developed yet despite a tight labor market for so long, can be understood as reducing some of the urgency to cool the economy to avoid inflation.
It's a double edged sword
While slowing the pace of rate hikes might provide some relief to the economy, Canada's relative size causes another problem. Because it has to import a lot of consumer goods, particularly from the US where interest rates are expected to keep rising, a weaker loonie implies consumer costs might keep rising. As it requires more Canadian dollars to buy imported goods.
This could contribute to slowing the descent in inflation, which is why the BOC might consider keeping pace with the Fed for a little while longer. Which is why it might be a bit premature to assume a pause in rate hikes in Canada just yet.
S&P 500 Builds Up Breakout Pressure
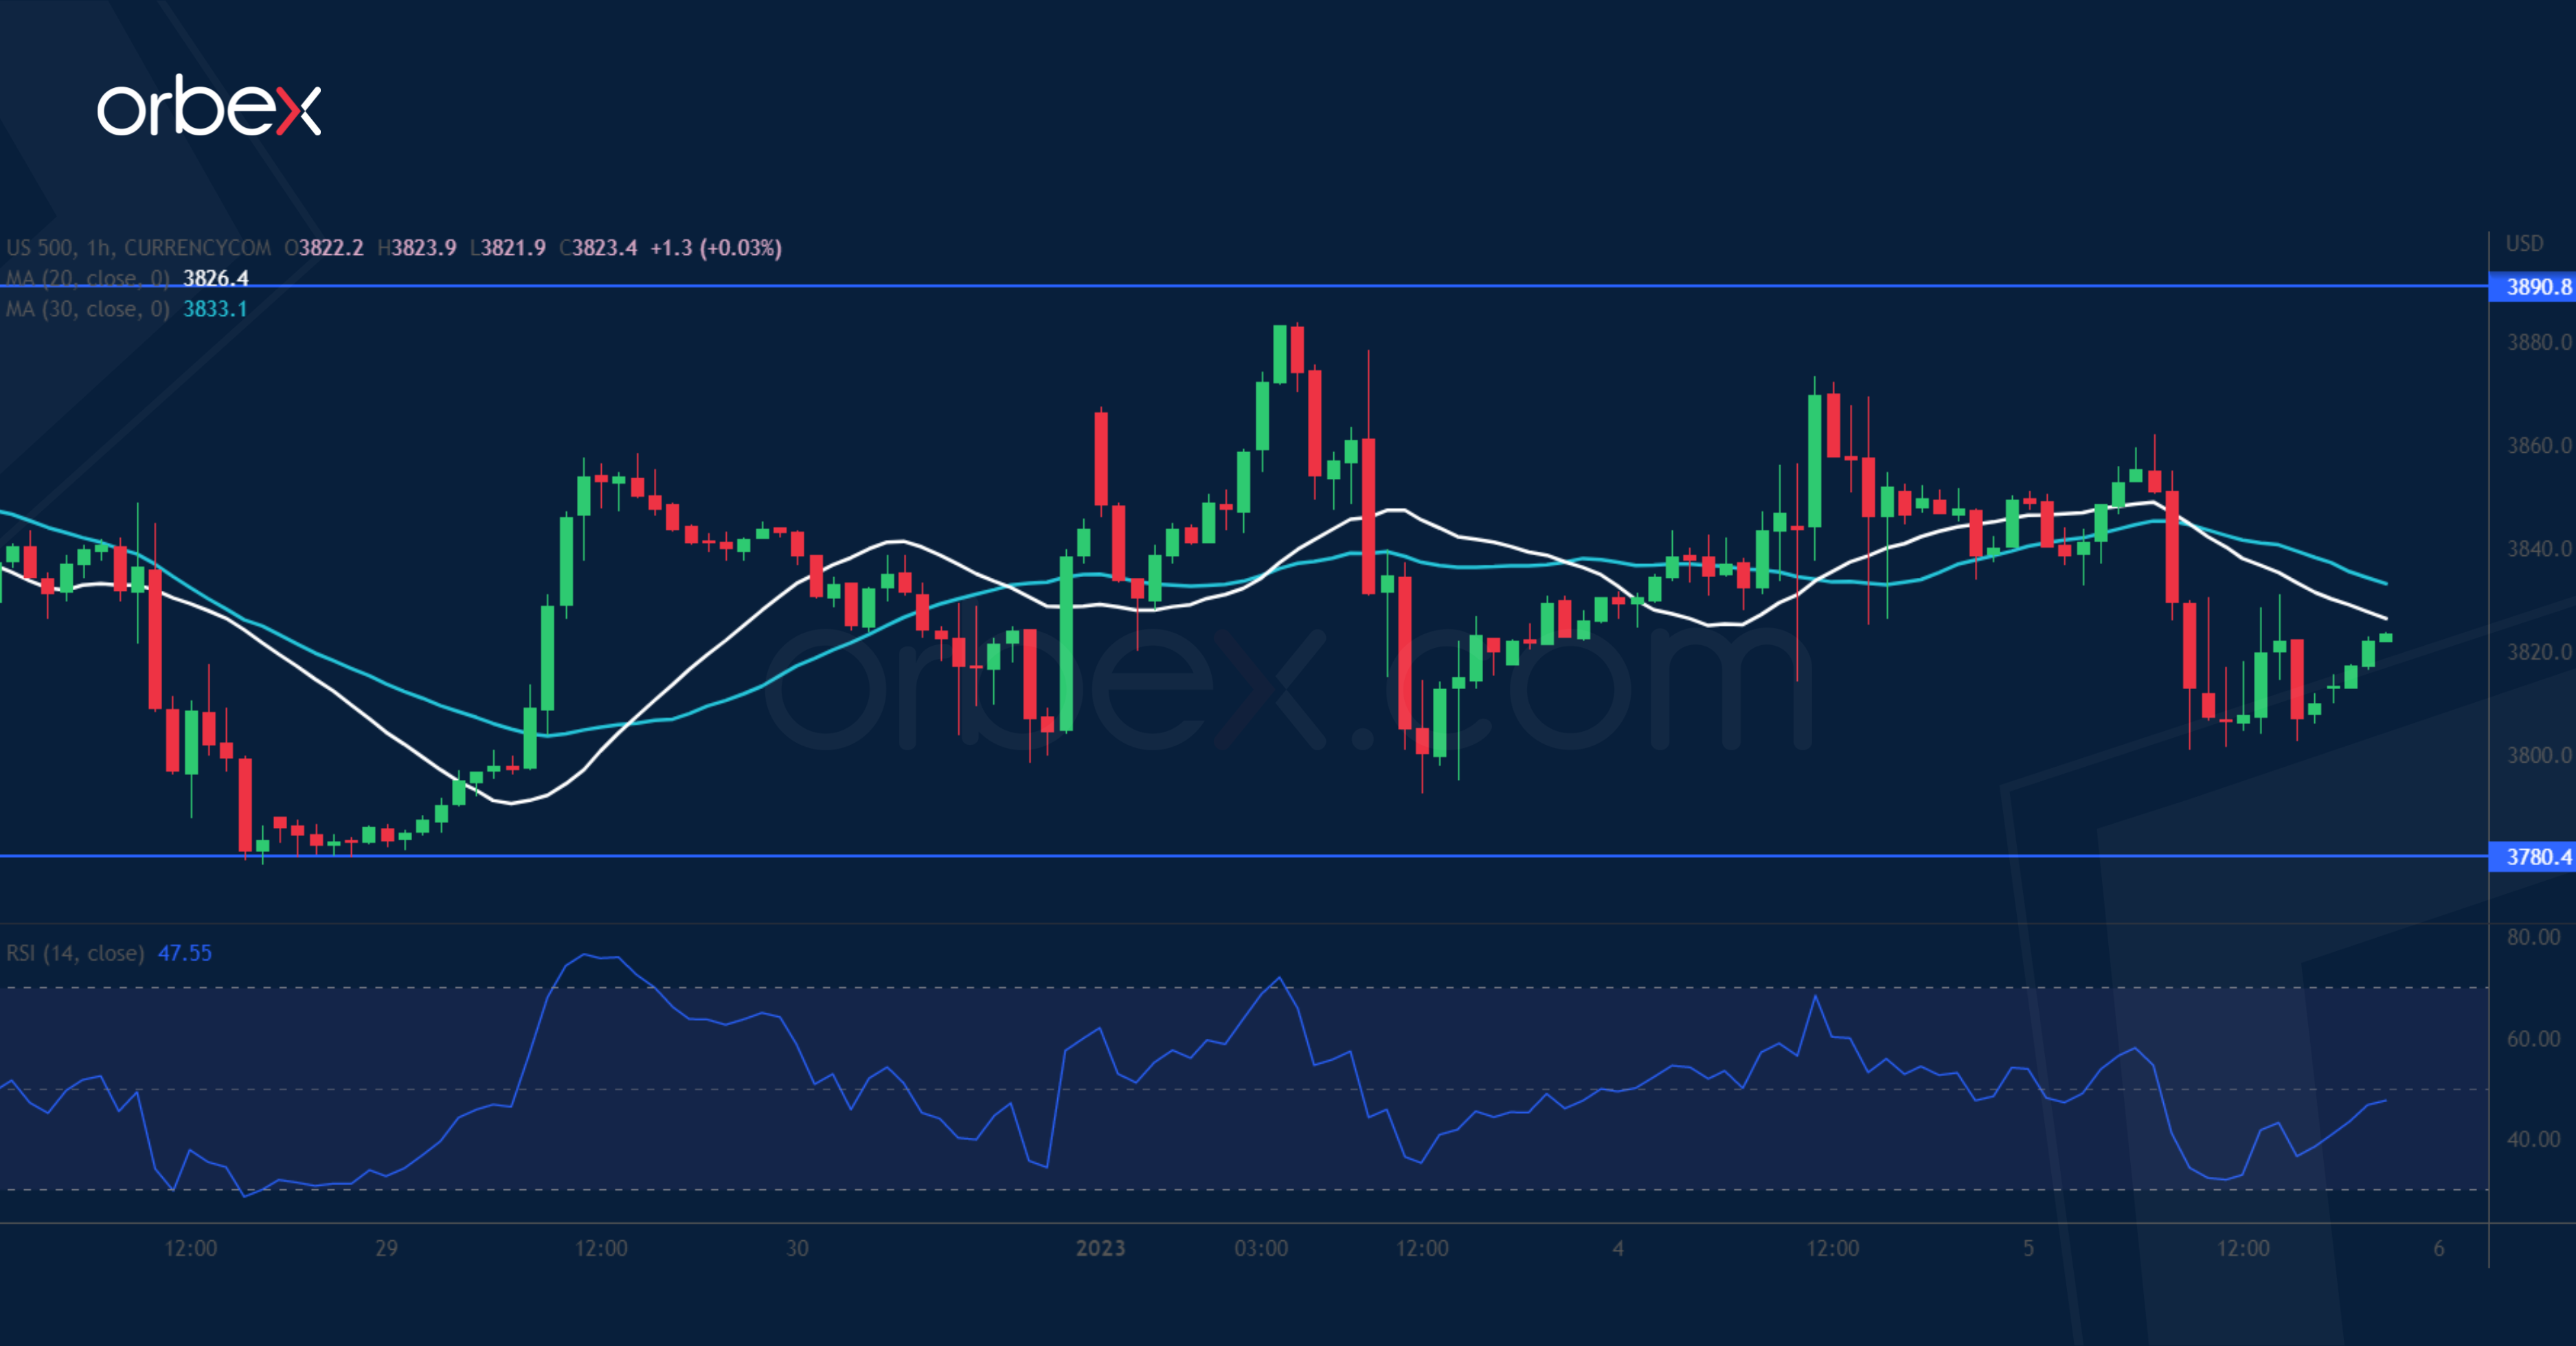
The S&P 500 goes sideways as investors await clues from the US nonfarm payrolls. On the daily chart, a bearish MA cross continues to weigh on sentiment. The horizontal consolidation indicates indecision and a breakout would release the tension like a spring, causing a potential spike in volatility. 3890 is confluent with the 3-day moving average and its breach could propel the index to 4020 at the origin of the previous liquidation. On the flip side, a drop below the lower band at 3780 would threaten the daily support at 3700.
EUR/JPY Sees Slower Momentum
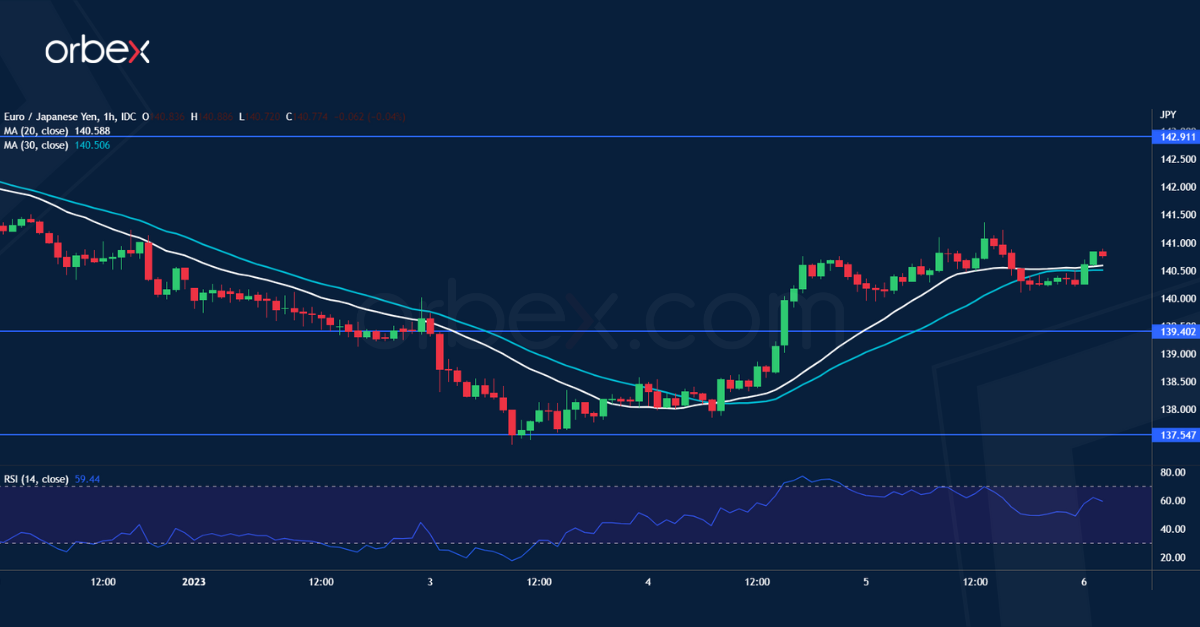
The Japanese yen bounced over concerns that the BOJ could shift away from its ultra loose policy. The pair bounced off last September’s low of 137.50 and a vertical rise above the psychological level of 140.00 prompted some sellers to cover their bets. The RSI’s overbought situation has caused a temporary pause in the rally as buyers became wary of chasing higher bids. More short-covering could ensue if the euro stays above 139.40, fuelling the recovery. Then the daily resistance at 142.90 would be the next stop.
NZD/USD Tests Key Support
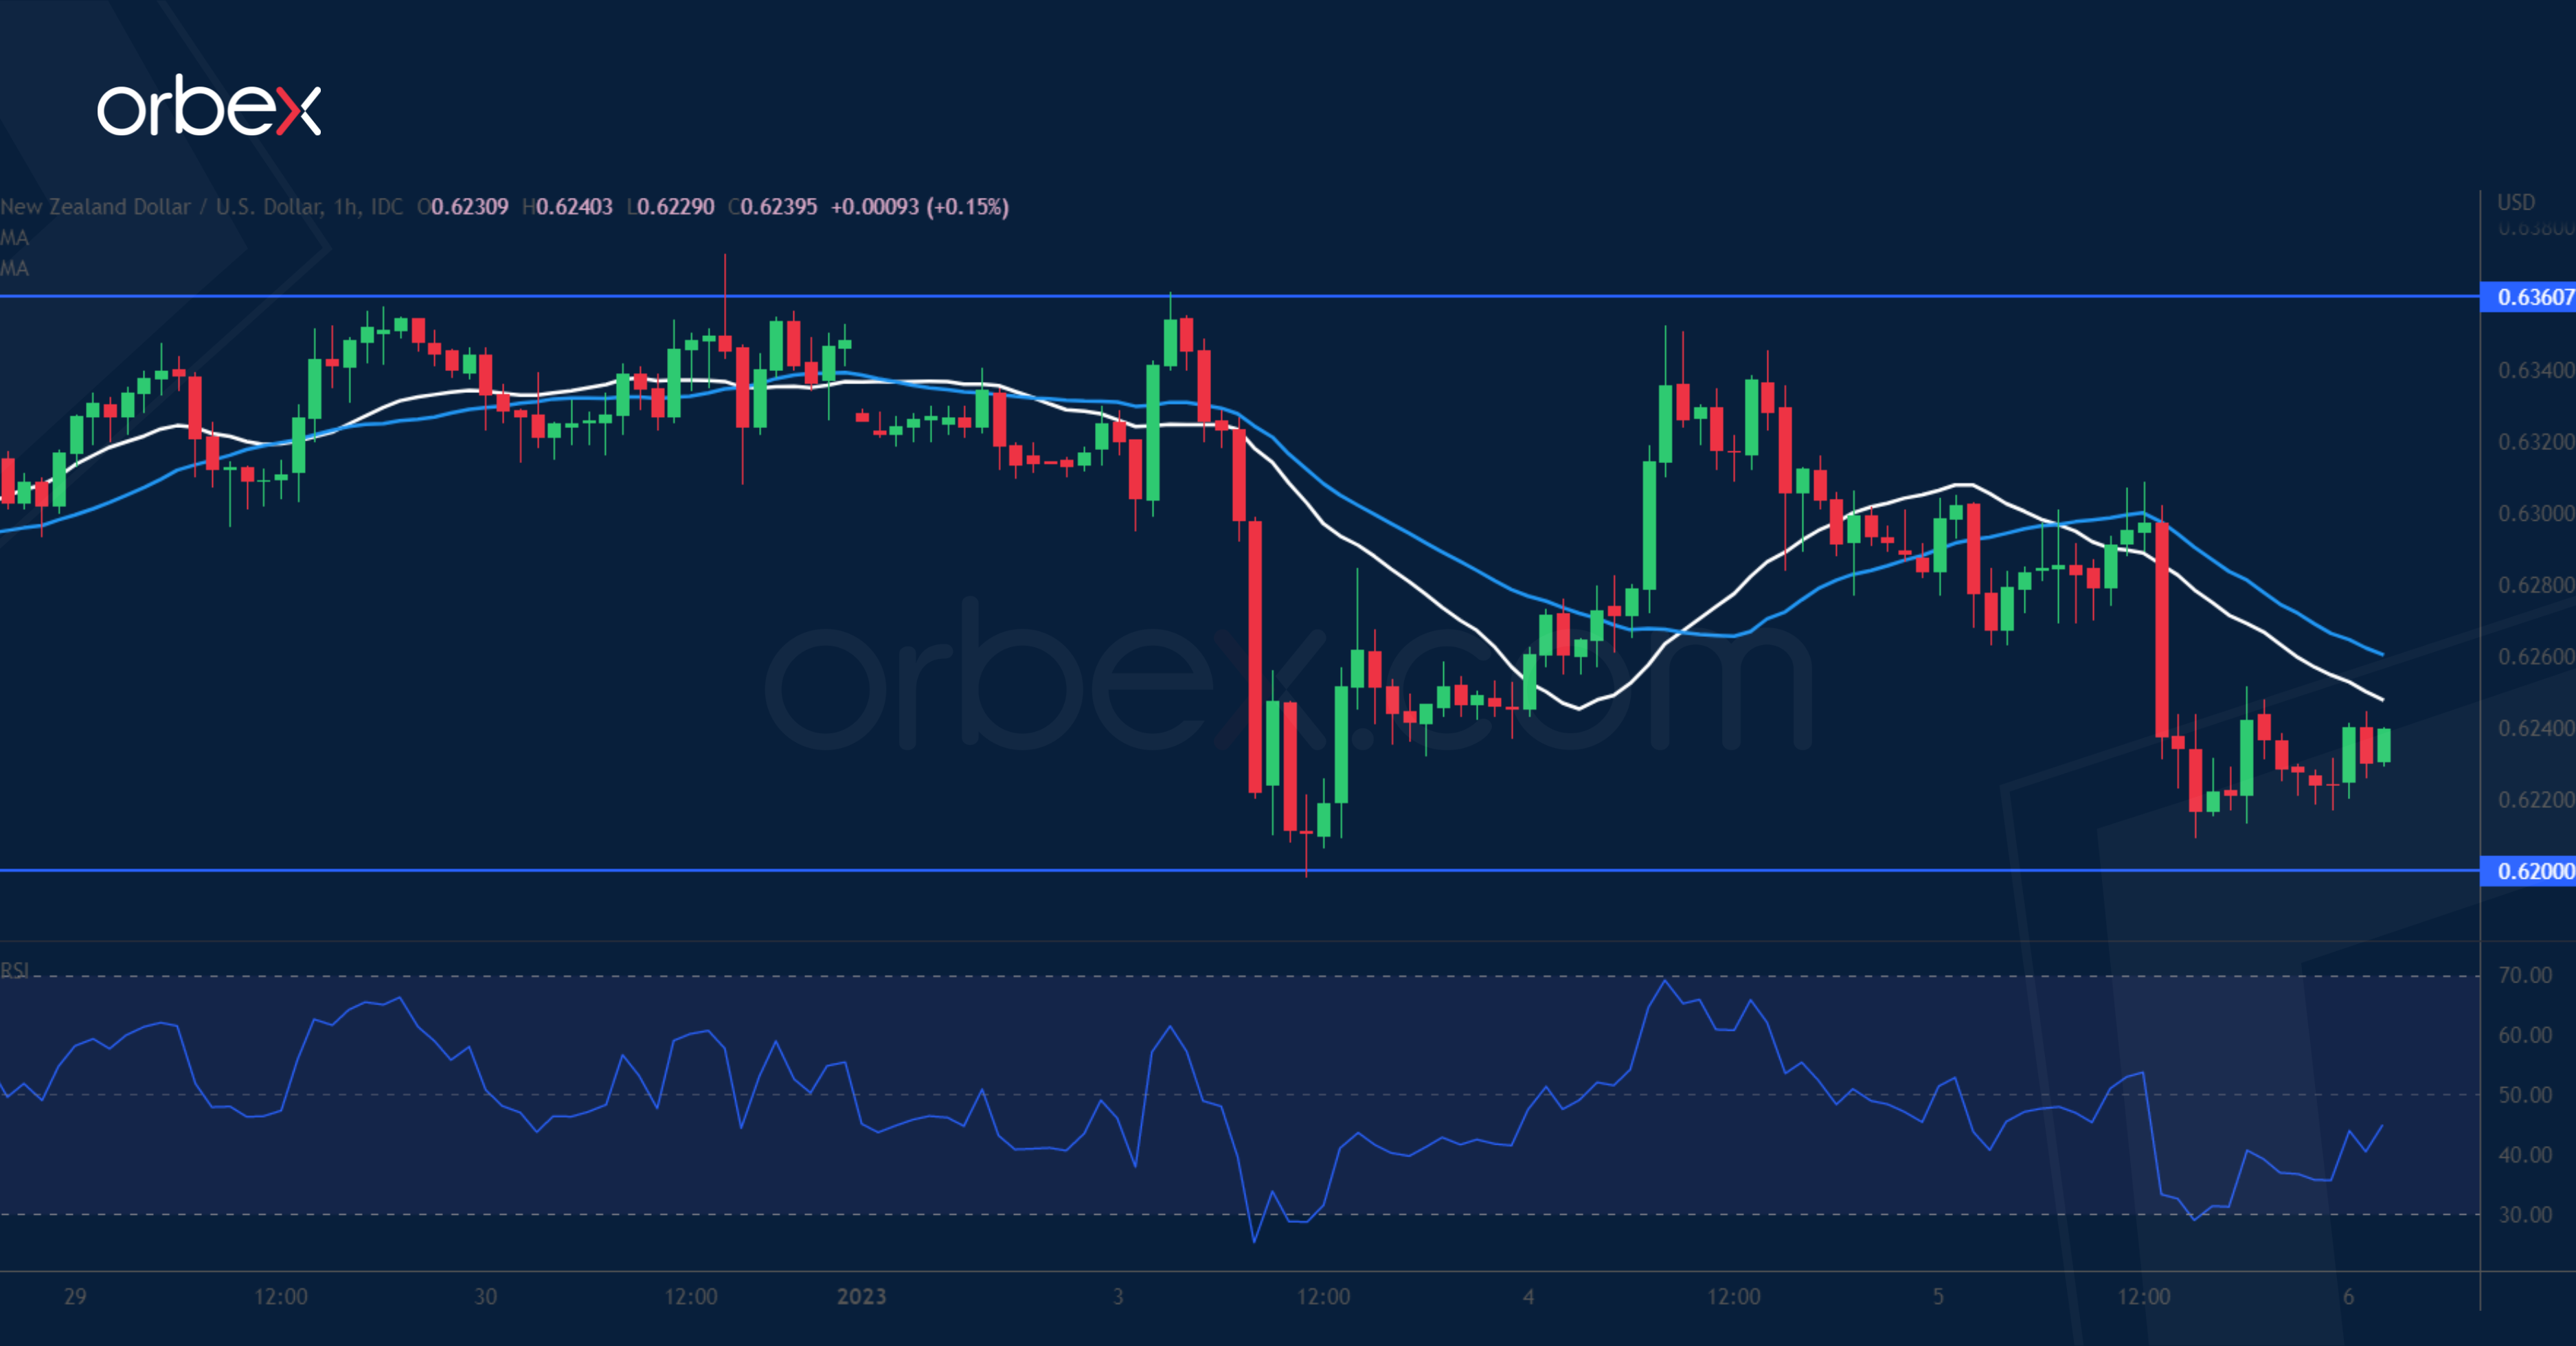
The US dollar soared after jobless claims showed resilience of the labour market. On the daily chart, the directional bias remains up with the pair seeking to secure a foothold. A previous sharp drop found support over 0.6200, but its failure to reclaim 0.6360 could be detrimental to the market mood. Stiff selling pressure has led to a retest of 0.6200 and an oversold RSI attracted some bargain hunters in that demand zone. Its breach would reveal a lack of interest in the kiwi, reversing its trajectory for the next few days.
Big Companies Cut Jobs
Yesterday’s US ADP print was too strong to please the Fed.
And in the middle of tens of thousands of additional job loss news, the NFP data could surprise to the upside, boost the Federal Reserve hawks, send the US yields and the US dollar higher, and stocks lower.
How come the US jobs data remains resilient to job loss news??!
News that Amazon will slash 18’000 jobs and Salesforce will let go of 10% of its workforce – which should be around 8000 job losses, broke earlier this week, giving hope that bad news on jobs front could also be somehow reflected in jobs data.
But no!
The ADP report released yesterday revealed way stronger than expected private job additions in December, posting 235’000 new private jobs last month, versus only around 150’000 expected by analysts.
Zooming in, yesterday’s ADP report revealed that large companies did cut around 150’000 jobs in December, but small and medium size businesses hired relatively strongly… so that we ended up with a strong 235’000 print.
It’s bizarre, no? Inflation, and economic slowdown should hit small and medium sized businesses first. So, why on earth do smaller businesses keep hiring while big companies keep firing? I don’t have an answer to that.
So, today’s NFP read is also expected to reveal around 200’000 new nonfarm jobs in the US - quite a strong figure when you think that recession could be around the corner in the US. Wages may have grown 5% year-on-year – strong enough to threaten inflation, while the unemployment rate is seen steady near 3.7%.
If look back to the historical data, we observe that the NFP figures tend to fall significantly and start giving signs of weakness at least a couple of months before recession hits.
In the US, the data hints at no problem at all – which is a big problem for the Fed, per se.
As a result, stronger-than-expected jobs data will certainly boost inflation expectations, bring the Fed hawks back to the market, send the US yields and the dollar higher, and stocks lower.
Pricing in Fed funds futures still points at a 25bp hike in Fed’s next monetary policy meeting, meaning that we could rapidly see the pricing turn in favour of a 50bp in case of a strong jobs data.
Markets
Market reaction to yesterday’s unwelcome ADP jobs data weighed on equity indices. The S&P500 slid 1.17%, and Nasdaq lost 1.60%. The US 2-year yield rebounded on hawkish Fed expectations and the US dollar index advanced 0.85%, despite the death cross formation on the daily chart, where the 50-DMA crossed below the 200-DMA confirming the bearish trend.
Gold retreated to $1825 per ounce on the back of rising yields and a stronger US dollar, as Cable slipped below 1.20 – and is even testing 1.19 at the time of writing. The EURUSD is drilling below the positive trend base that’s building since November, and is preparing to test the 1.05 to the downside.
For the pound, the strikes in the UK is certainly not good news for the economic growth, but the fact that the government remains ultra-resilient to give people a better pay is a proof that the government remains serious about its high budget discipline, and that’s probably what prevents the Gilt yields and the pound from falling on UK-related news – even though sterling is hit by a stronger US dollar these days.
For the euro, the hawkish European Central Bank (ECB) expectations should normally temper the selloff, but we also know how the hawkish Fed expectations have the power to eclipse everything else… Due today, the Eurozone flash inflation estimate is expected to have slipped below 10%. A softer European inflation could also soften the ECB hawks, but it will hardly change the ECB’s determination to further tighten its policy for now. Therefore, price rallies in euro could be interesting dip-buying opportunities for a further advance to 1.10 against the greenback in the medium run.
Decent US Data ahead of Payrolls
Market movers today
Today brings this week's most important data releases both from the euro area and the US.
In euro area, flash inflation print for December will be released. Individual country data released thus far suggest that while headline inflation probably continued to decline in December, underlying price pressures remain strong. Consensus is looking for core inflation to have picked up from 5.0% in November to 5.1% in December. Going forward, interpretation of euro area inflation data will become more and more cumbersome as country-specific fiscal measures that compensate households for the rising energy costs will also affect consumer price developments.
In the US, it is time for December payrolls. Consensus expects 200k new jobs while a figure around 100k would be consistent with demographic developments and any higher number implies labour shortages are likely to prevail in US jobs market, upholding wage and price pressures. We will also get IMS Services index where consensus looks for a decline to 55.0 in December from 56.5 in November. Factory orders are also expected to have declined in November.
In addition, we have a bunch of ECB and Fed speakers on the wires.
The 60 second overview
US tier-2 jobs data strong: Heading into the payrolls release today we got some tier-2 data out yesterday. Initial jobless claims showed a downward surprise with a decline to 204k (consensus 225k, previous 223k) still signalling a robust labour market. The ADP employment report also surprised to the strong side rising 235k in December from 182k in November (revised from 127k). While it is not a great predictor of non-farm payrolls it still indicates decent labour demand in line with the job openings data released earlier this week, which were also better than expected and pointed to still strong demand for labour.
Fed members signal rate above 5%: We had another three Fed speakers out yesterday. Atlanta Fed's James Bostic (voter, neutral) stated that "I appreciate recent reports that include signs of moderating price pressures, but there is still much work to do". Outgoing member Esther George (non-voter, neutral) said that she looked for a rate above 5% going into 2024. Finally, James Bullard (non-voter, hawk) offered a softer statement than usual saying that the policy rate is "not yet sufficiently restrictive but it is getting closer". He also hinted at a peak rate slightly above 5%, though. The Fed's latest dot plot showed 17 members seeing the peak rate at 5.125% or above and only two seeing it below. We look for a 50bp hike in February and another 25bp hike in March taking the rate to 5.125% and rates being unchanged after that throughout 2023.The market currently prices a peak around 5% and 35bp of cuts in the second half of the year.
ECB comments: ECB member Villeroy said yesterday that the ECB should reach the terminal rate by summer and then hold suggesting rates would stay there for some time. He also stated that the ECB should be pragmatic and not become obsessed with rate increases that are "too mechanical." Markets price close to 150bp of further hikes by summer. Central banks have gotten much relief on the inflation front from falling commodity and freight prices but the tight labour markets remain a challenge.
Equities: Stock markets faced headwind yesterday from the stronger labour data and rise in yields and S&P500 lost 1.2%. Stock futures as well as Asian stocks are slightly higher in Asian trading but in waiting mode for the US payrolls report today.
Credit: Issuance in euros slowed yesterday with only one dual-tranche corporate launched, while the FIG segment saw a Tier 2, a senior preferred as well as two covered bonds brought to the market. The Tier 2 note was the first such print in euros this year, but mirroring the reception of this week's AT1 prints reception was solid, suggesting good appetite for bank subordinated debt. During the day CDS indices widened slightly giving back some of Wednesday's tightening, with iTraxx Main widening 2bp to 86bp while iTraxx Xover widened 9bp to 449bp.
FI: It was a volatile day in the global financial markets where yields initially rose significantly after the solid rally seen since Monday. However, in the afternoon yields declined and global bond yields ended with a more modest rise. The dovish comments from one of the hawks at the Federal Reserve (Bullard) had limited impact on the market, as the focus is on the labour market report this afternoon.
FX: Yesterday's session was characterised by Scandi weakness as both EUR/SEK and EUR/NOK moved sharply higher to levels as high as 11.27 and 10.82, respectively. The USD gained with EUR/USD back close to the 1.05-level while EUR/GBP still trades north of 0.88.
Nordics
Norway releases industrial production figures but otherwise no data in Nordics today.
Technical Outlook and Review
USD/JPY:
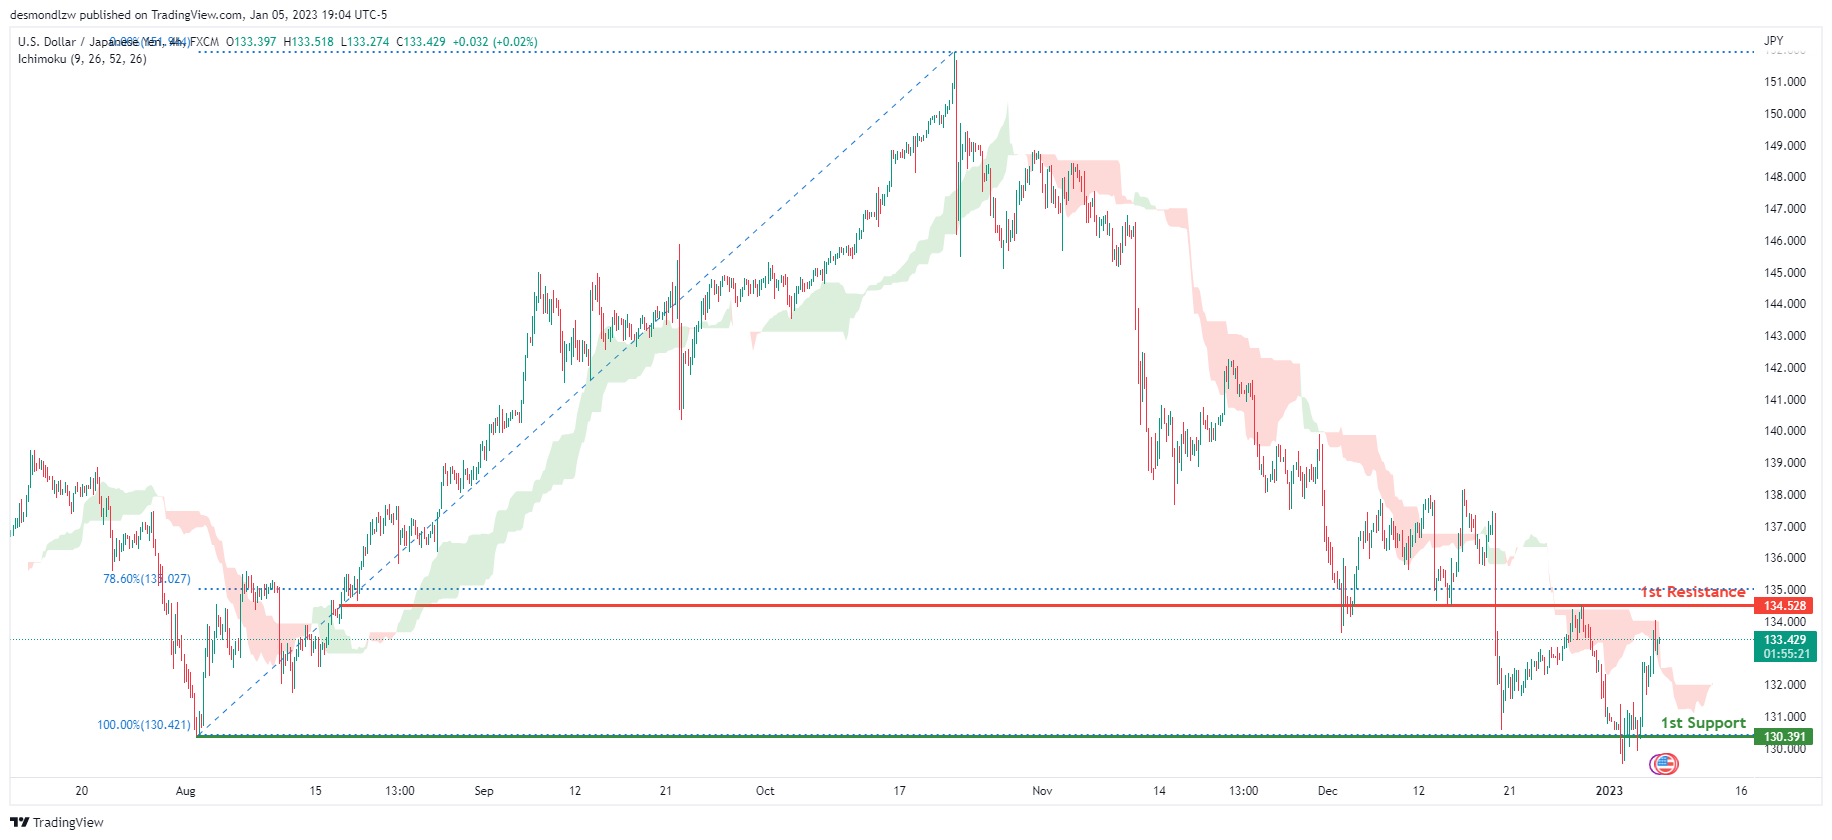
Looking at the H4 chart, my overall bias for USDJPY is bearish due to the current price being below the Ichimoku cloud, indicating a bearish market. If this bearish momentum continues, expect price to possibly continue heading towards the 1st support at 130.391, where the previous swing low is. In an alternate scenario, price could possibly head back up towards the 1st resistance level at 134.528, where the 78.6% Fibonacci line is.
Areas of consideration:
- H4 time frame, 1st resistance at 134.528
- H4 time frame, 1st support at 130.391
DXY:
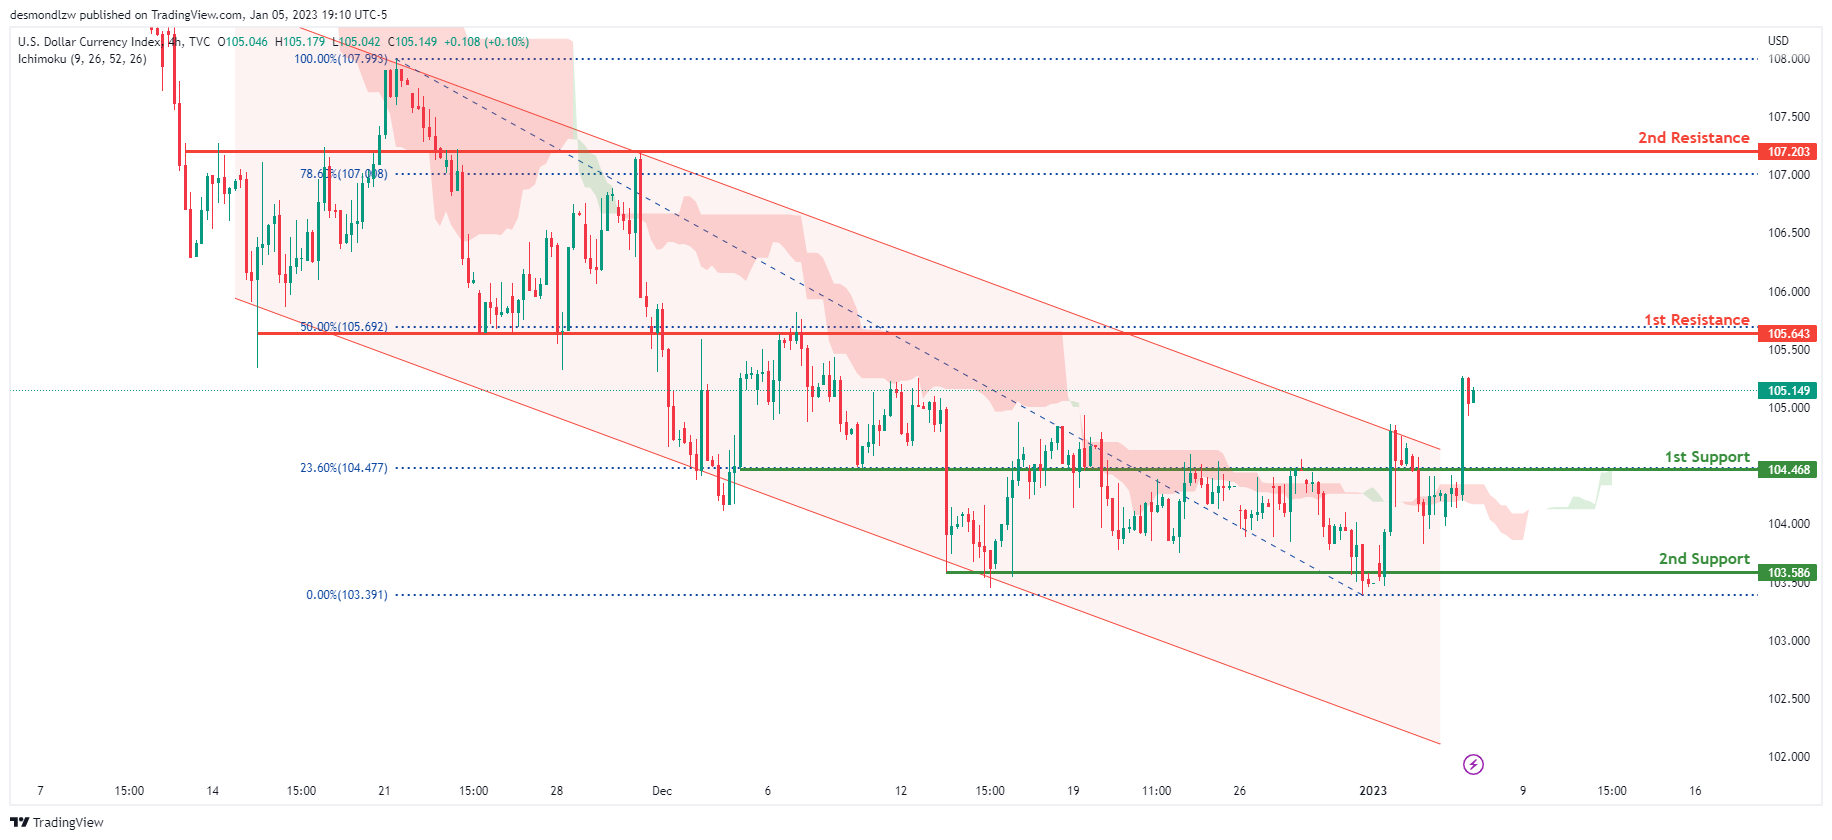
On the H4 chart, the overall bias for DXY is bullish. To add confluence to this, price is above the ichimoku cloud with the price breaking out of the descending channel which indicates a bullish market. If this bullish momentum continues, expect the price to possibly continue heading towards the 1st resistance at 105.643, where the 50% Fibonacci line is. In an alternative scenario, price could head back down to retest the 1st support at 104.468, where the 23.6% Fibonacci line is.
Areas of consideration:
- H4 time frame, 1st resistance at 105.643
- H4 time frame, 1st support at 104.468
EUR/USD:
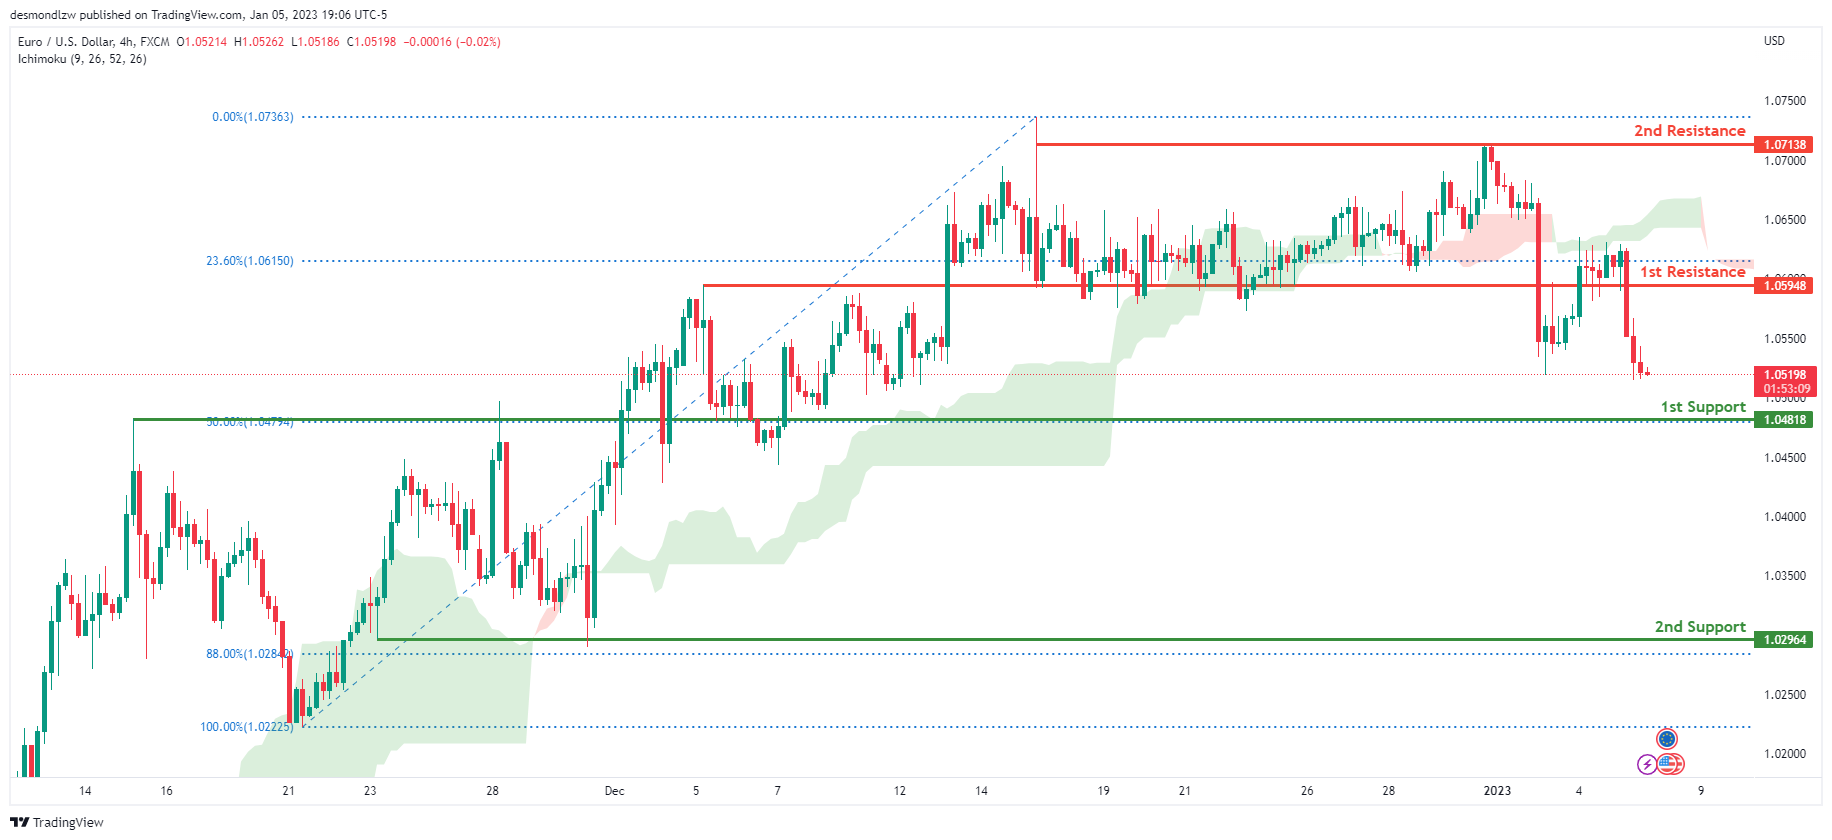
Looking at the H4 chart, my overall bias for EURUSD is bearish due to the current price being below the Ichimoku cloud, indicating a bearish market. If this bearish momentum continues, expect the price to possibly head towards the 1st support at 1.04818, where the 50% Fibonacci line is. In an alternate scenario, price could possibly head back up towards the 1st resistance level at 1.05948, where the 23.6% Fibonacci line is.
Areas of consideration :
- H4 1st resistance at 1.05948
- H4 1st support at 1.04818
GBP/USD:
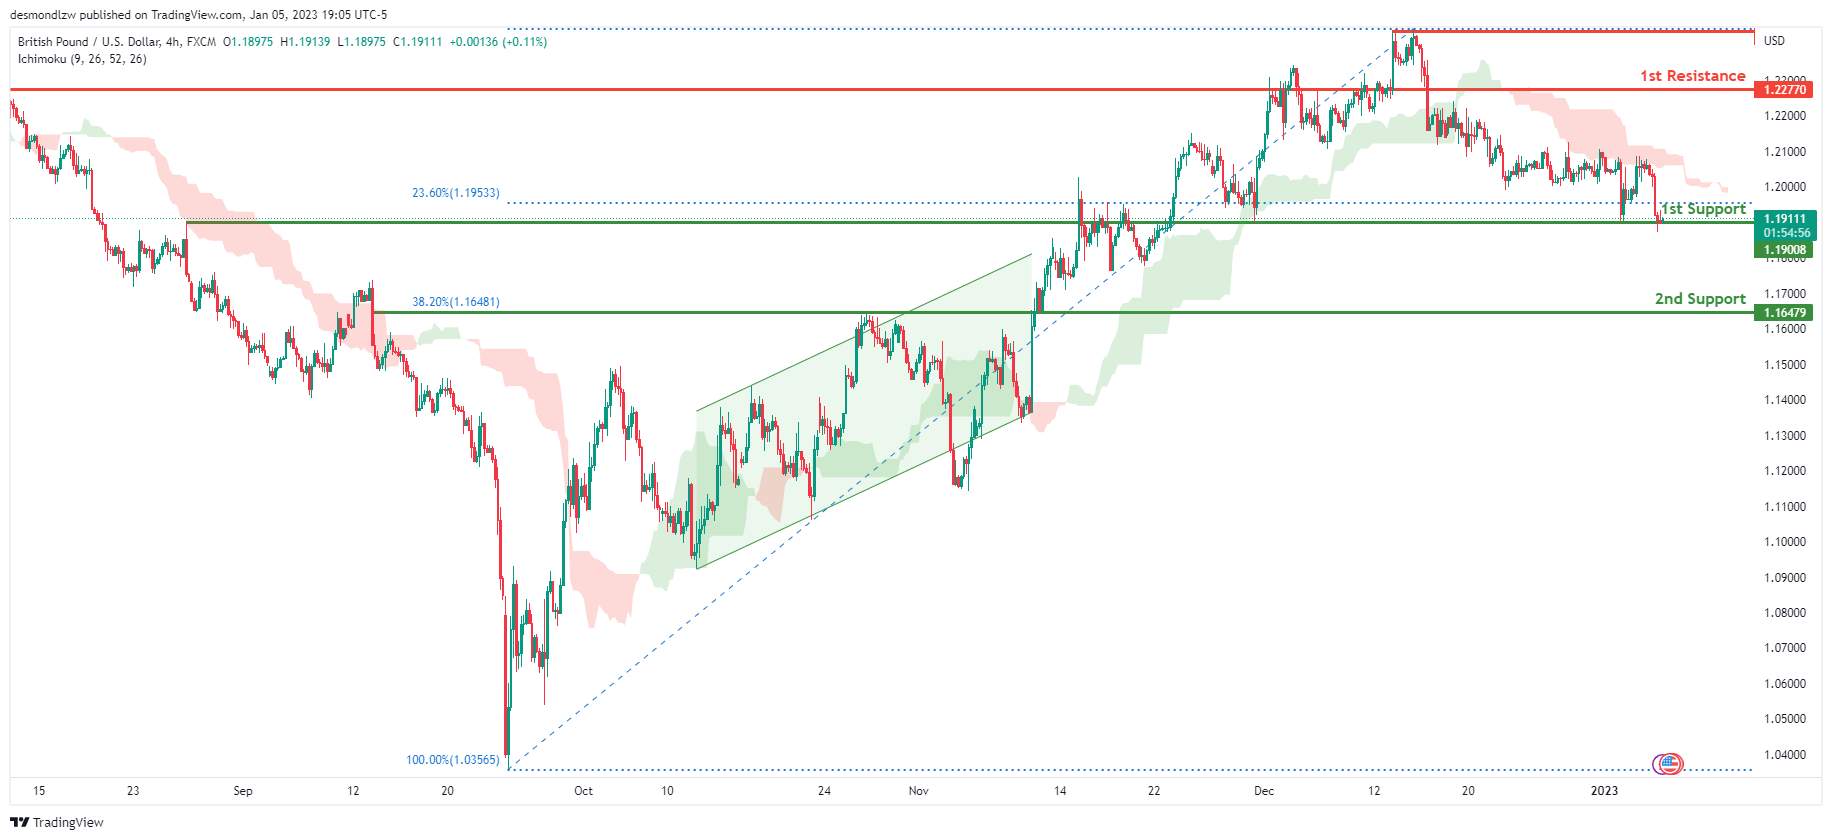
Looking at the H4 chart, my overall bias for GBPUSD is bearish due to the current price being below the Ichimoku cloud, indicating a bearish market. If this bearish momentum continues, expect price to possibly break the 1st support at 1.19008, where the 23.6% Fibonacci line is, before heading towards the 2nd support at 1.16479, where the 38.2% Fibonacci line is. In an alternate scenario, price could possibly head back up to break the 1st resistance level at 1.22770, where the previous swing high is before heading towards the 2nd support at 1.16479, where the 38.2% Fibonacci line is.
Areas of consideration:
- H4 1st resistance at 1.22770
- H4 1st support at 1.19008
- H4 2nd support at 1.16479
USD/CHF:
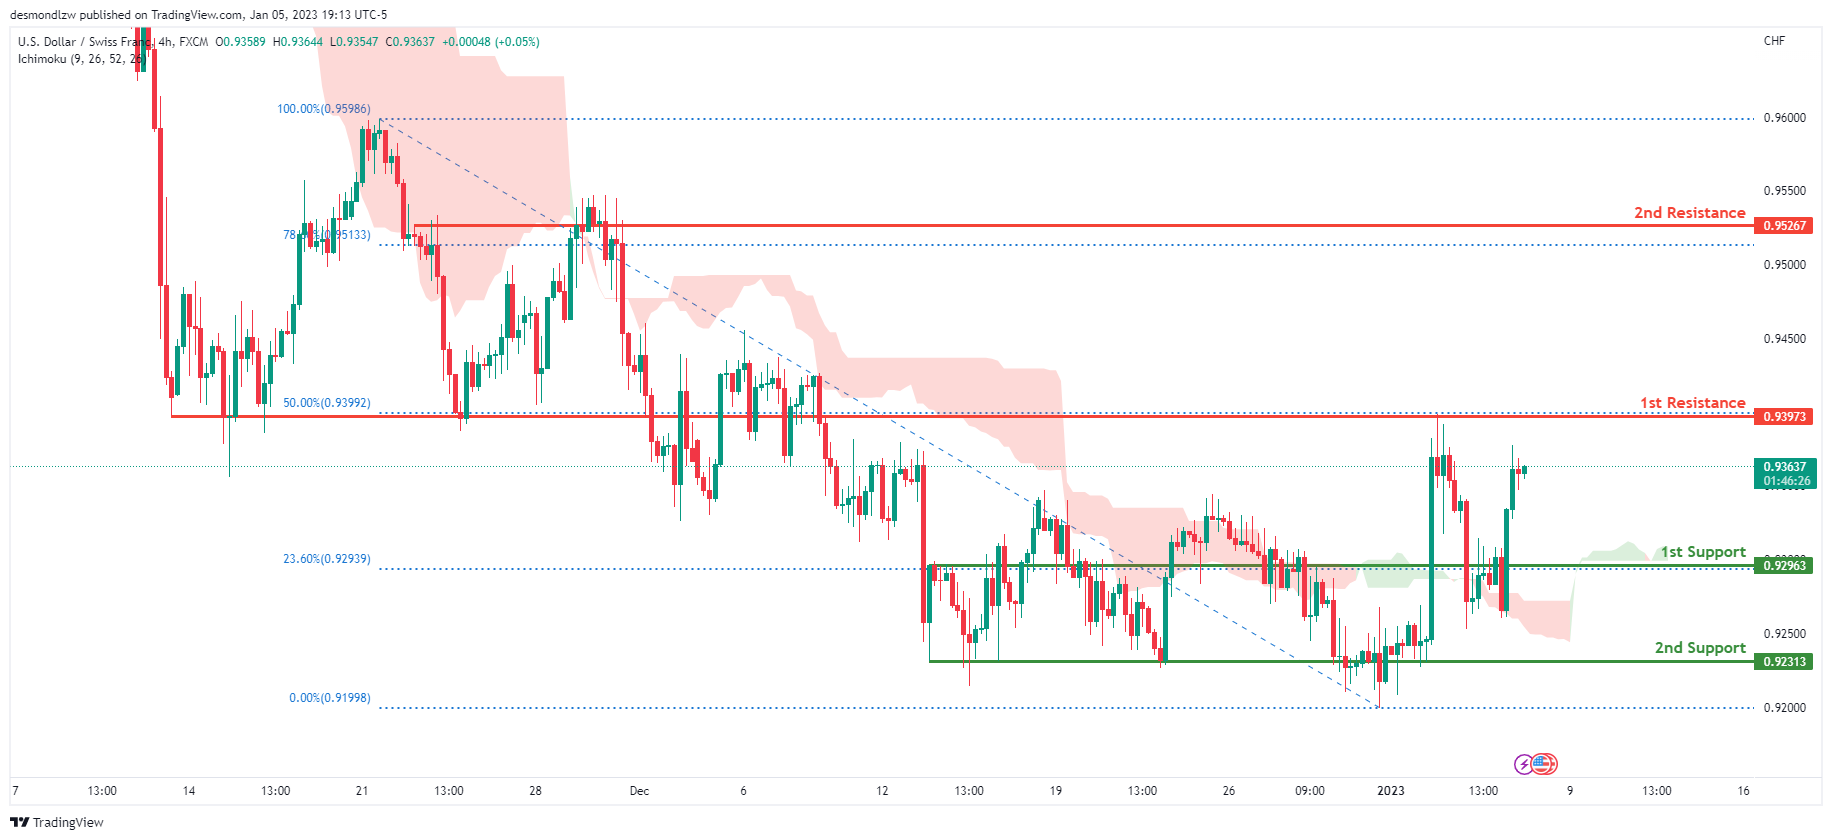
Looking at the H4 chart, my overall bias for USDCHF is bullish due to the current price being above the Ichimoku cloud, indicating a bullish market. If the current bullish trend continues, expect the price to head back up towards the 1st resistance line at 0.93973, where the 50% Fibonacci line is. In an alternative scenario, price could possibly head back down to retest the 1st support at 0.92963, where the 23.6% Fibonacci line is.
Areas of consideration
- H4 1st support at 0.92963
- H4 1st resistance at 0.93973
XAU/USD (GOLD):
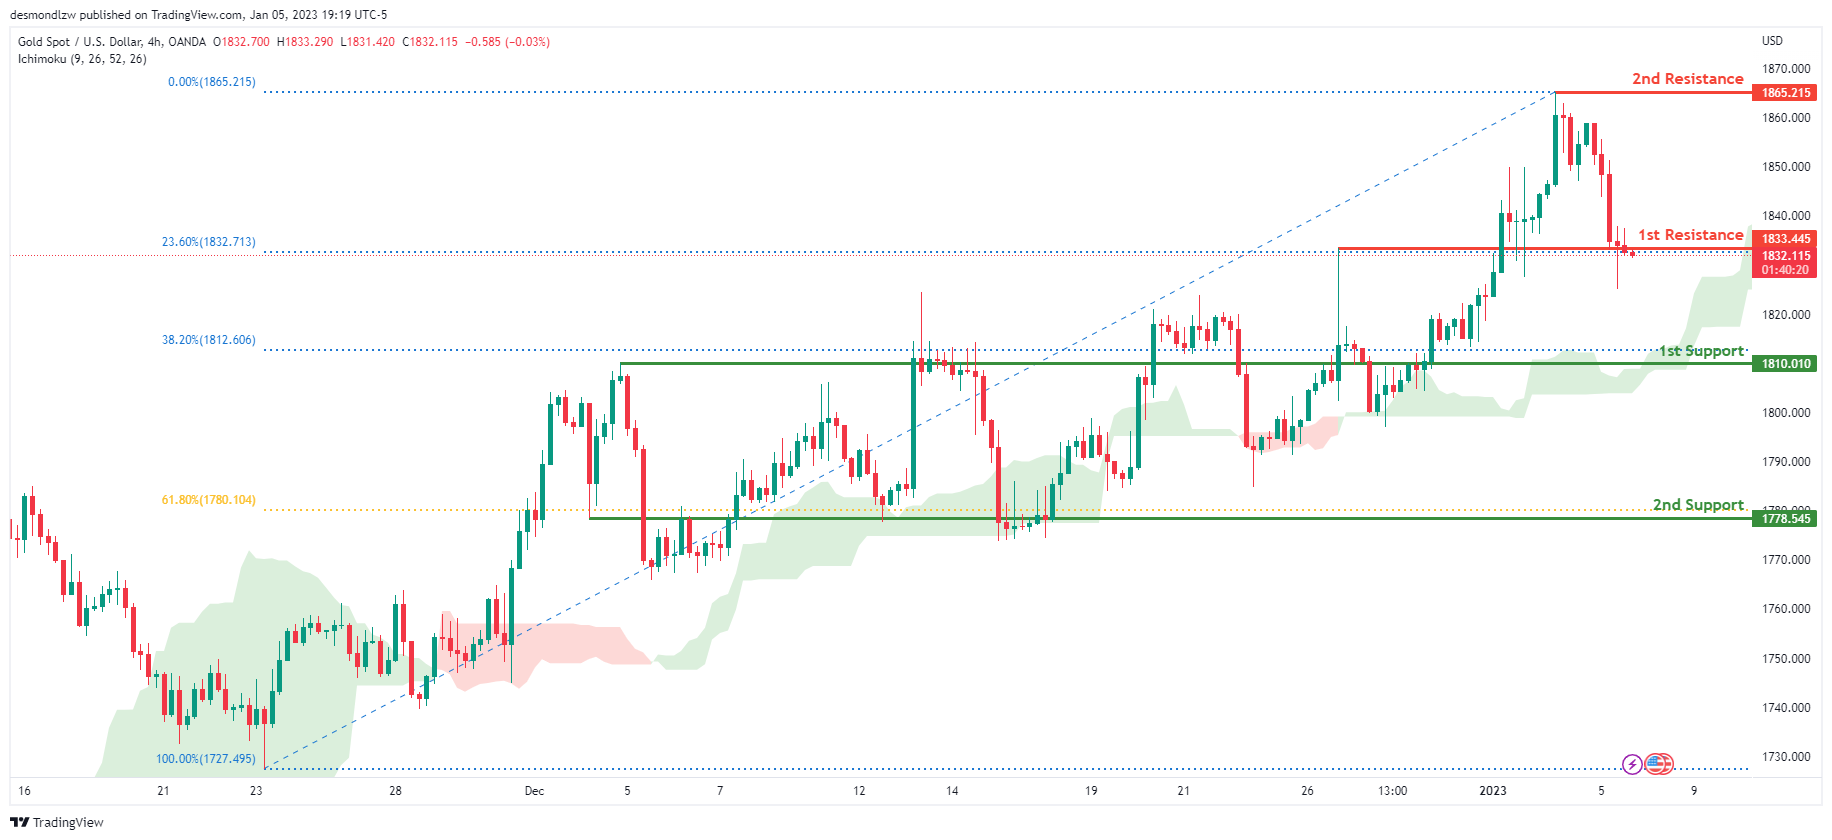
Looking at the H4 chart, my overall bias for XAUUSD is bullish due to the current price crossing above the Ichimoku cloud, indicating a bullish market. If this bullish momentum continues, expect the price to possibly break the 1st resistance at 1833.445, where the 23.6% Fibonacci line is, before heading towards the 2nd resistance at 1865.215 where the recent high is. In an alternative scenario, price could possibly head back down towards the 1st support at 1810.010, where the 38.2% Fibonacci line is.
Areas of consideration:
- H4 time frame, 1st resistance at 1833.445
- H4 time frame, 2nd resistance at 1865.215
- H4 time frame, 1st support at 1810.010
AUD/USD:
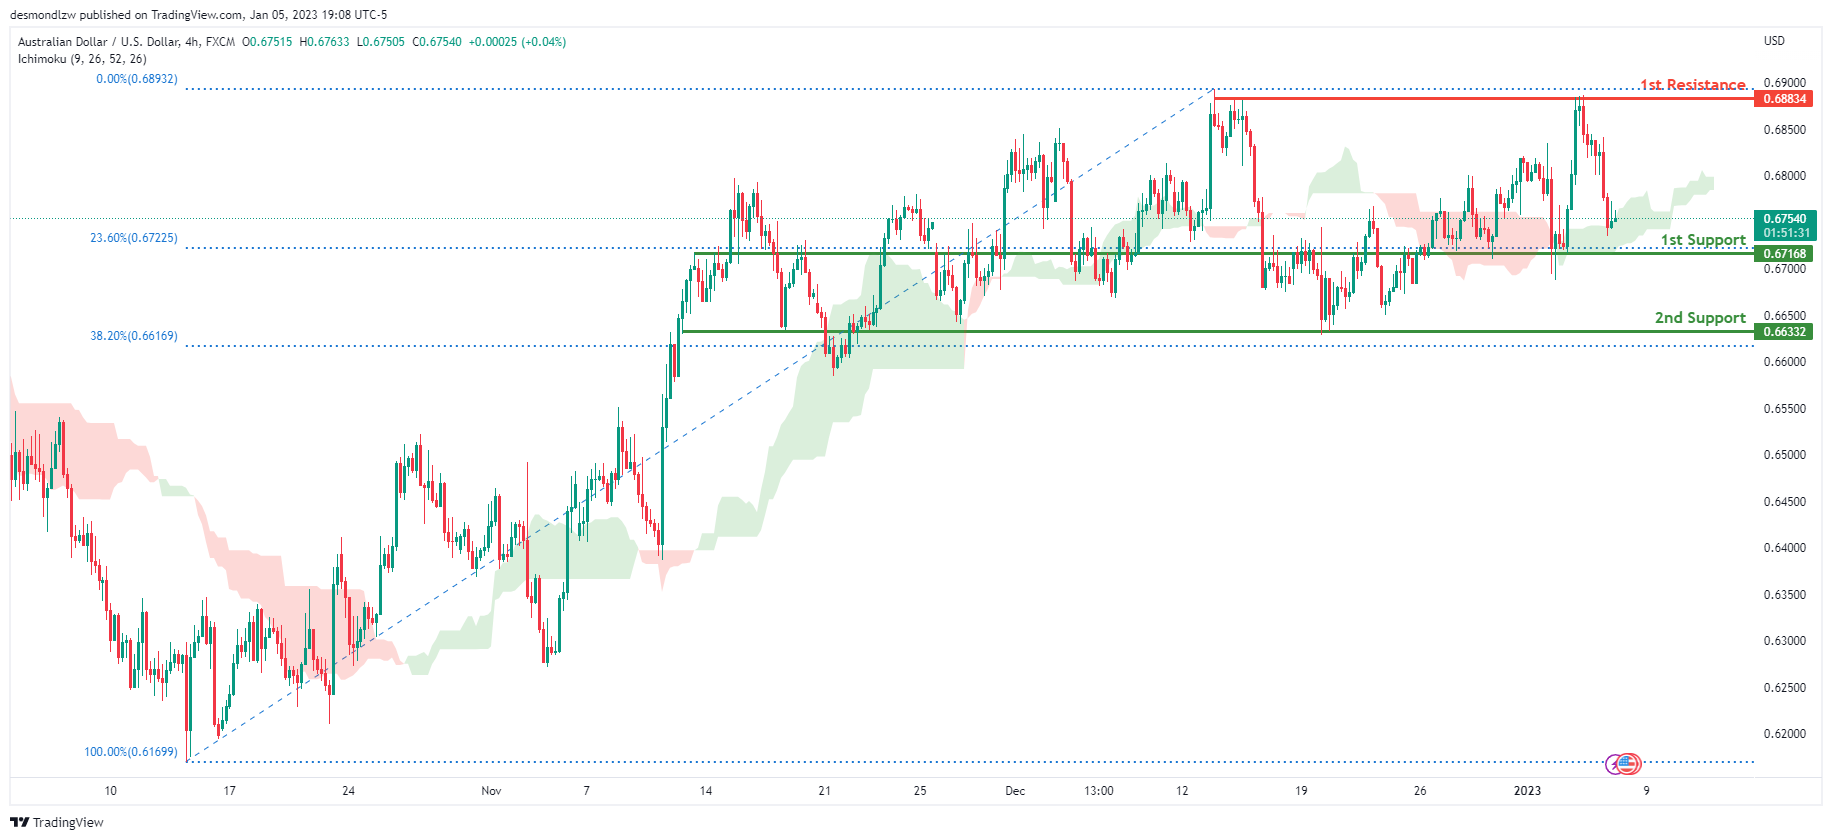
Looking at the H4 chart, my overall bias for AUDUSD is bullish due to the current price being above the Ichimoku cloud, indicating a bullish market. If this bullish momentum continues, expect the price to possibly head back up towards the 1st resistance at 0.68834, where the recent swing high is. In an alternative scenario, price could possibly head back down breaking the 1st support at 0.67168, where the 23.6% Fibonacci line is, before heading towards the 2nd support at 0.66332, where the 38.2% Fibonacci line is.
Areas of consideration
- H4, 1st resistance at 0.68932
- H4, 1st support at 0.67168
- H4, 2nd support at 0.66332
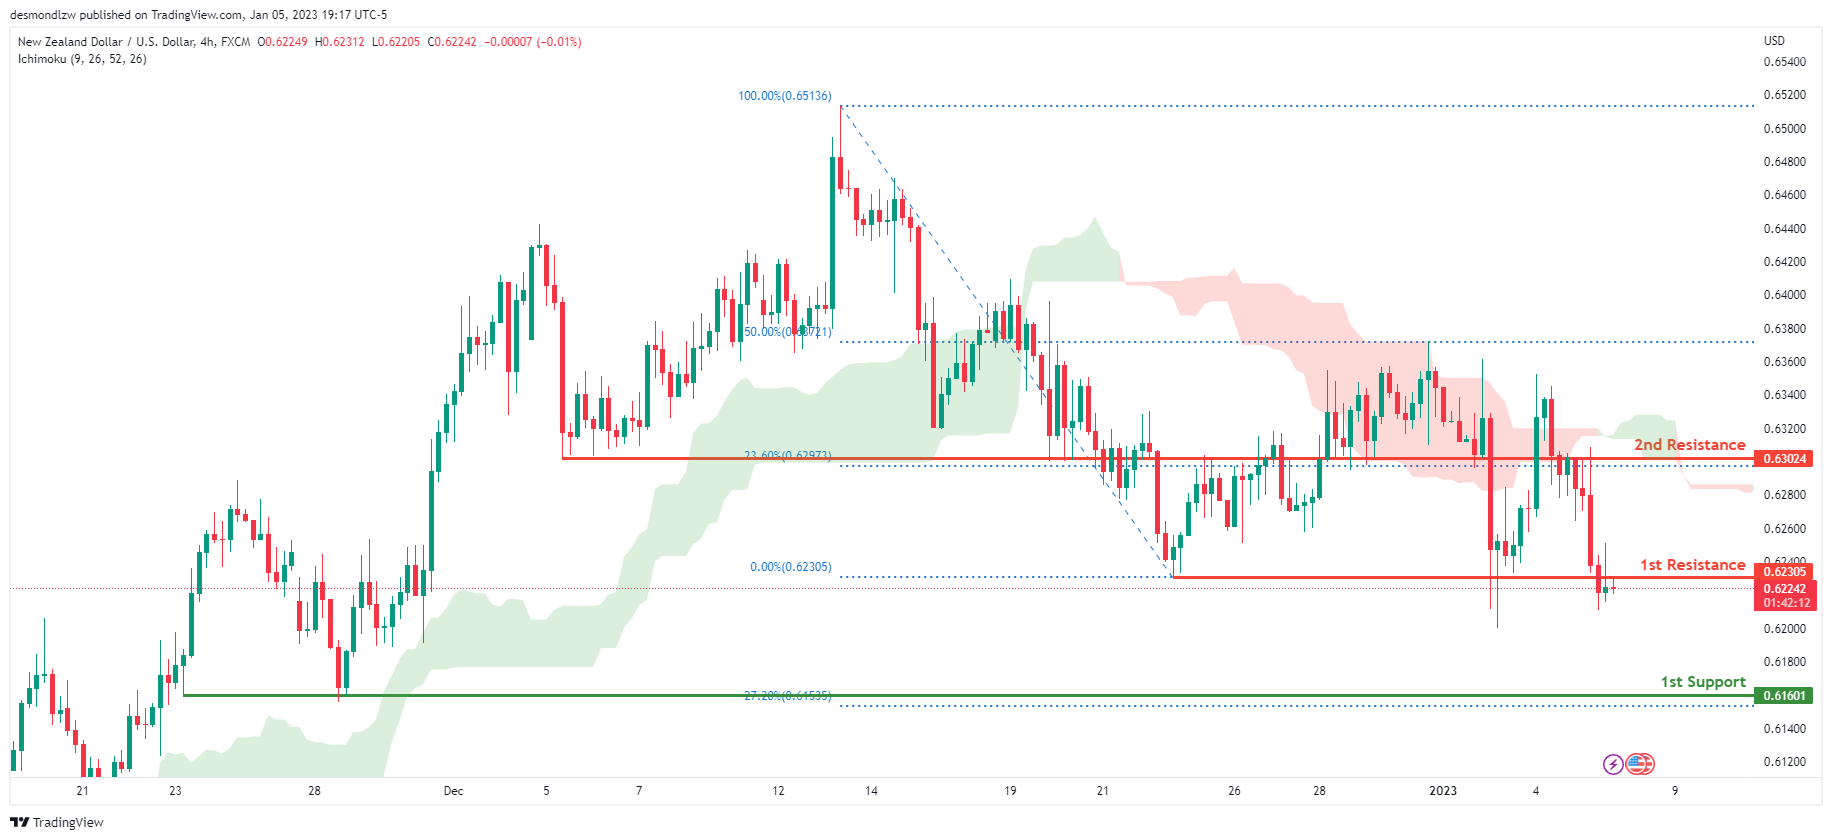
NZD/USD:
Looking at the H4 chart, my overall bias for NZDUSD is bearish due to the current price crossing below the Ichimoku cloud, indicating a bearish market. If this bearish momentum continues, expect price to possibly continue heading towards the 1st support at 0.61601, where the -27.2% Fibonacci line is. In an alternate scenario, price could possibly head back up breaking the 1st resistance level at 0.62305, where the previous swing low is, before heading towards the 2nd resistance at 0.63024, where the 23.6% Fibonacci line is
Areas of consideration:
- H4 time frame, 1st resistance at 0.62305
- H4 time frame, 2nd resistance at 0.63024
- H4 time frame, 1st support at 0.61601
USD/CAD:
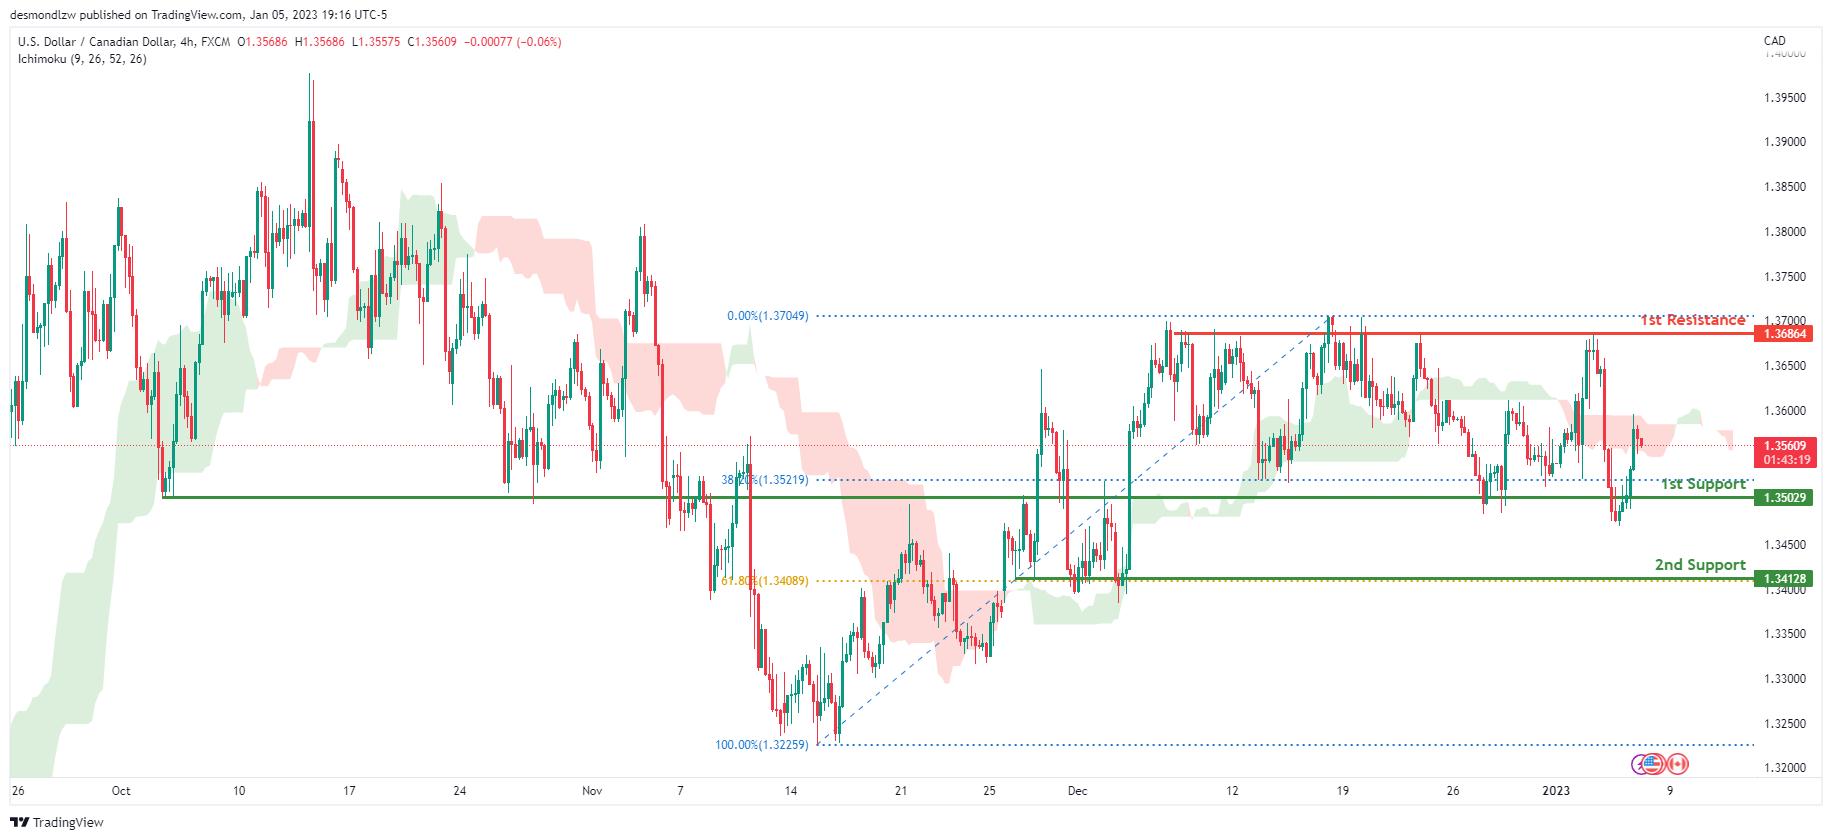
On the H4 chart, the overall bias for USDCAD is bearish . To add confluence to this, the price is crossing below the Ichimoku cloud which indicates a bearish market. If this bearish momentum continues, expect the price to possibly head towards the 1st support at 1.35029, where the 38.2% Fibonacci line is. In an alternative scenario, price could head back up towards the 1st resistance at 1.36864, where the previous highs are.
Areas of consideration:
- H4 time frame, 1st resistance at 1.36864
- H4 time frame, 1st support at 1.35029
OIL:
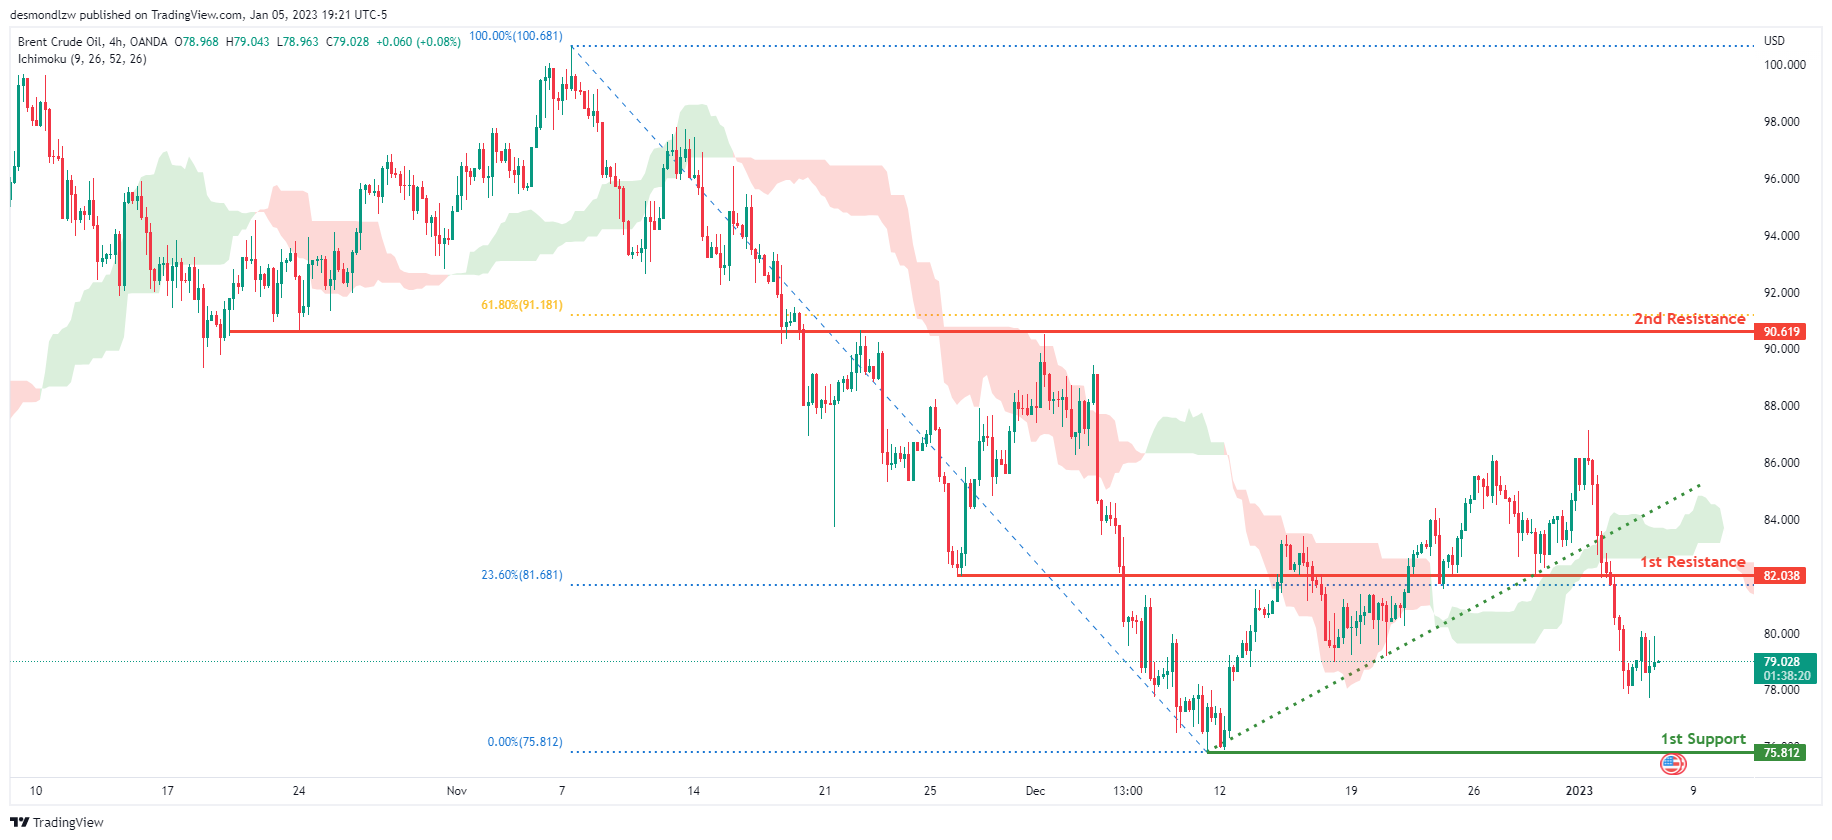
Looking at the H4 chart, my overall bias for BCOUSD is bearish due to the current price crossing below the Ichimoku cloud, indicating a bearish market. Adding more confluence to this bias, price has also broken the ascending trend line. If this bearish momentum continues, expect the price to possibly head towards the 1st support level at 75.812, where the previous swing low is. In an alternate scenario, price could possibly head back up towards the 1st resistance at 82.038, where the 23.6% Fibonacci line is
Areas of consideration:
- H4 time frame, 1st resistance at 82.038
- H4 time frame, 1st support at 75.812
Dow Jones Industrial Average:
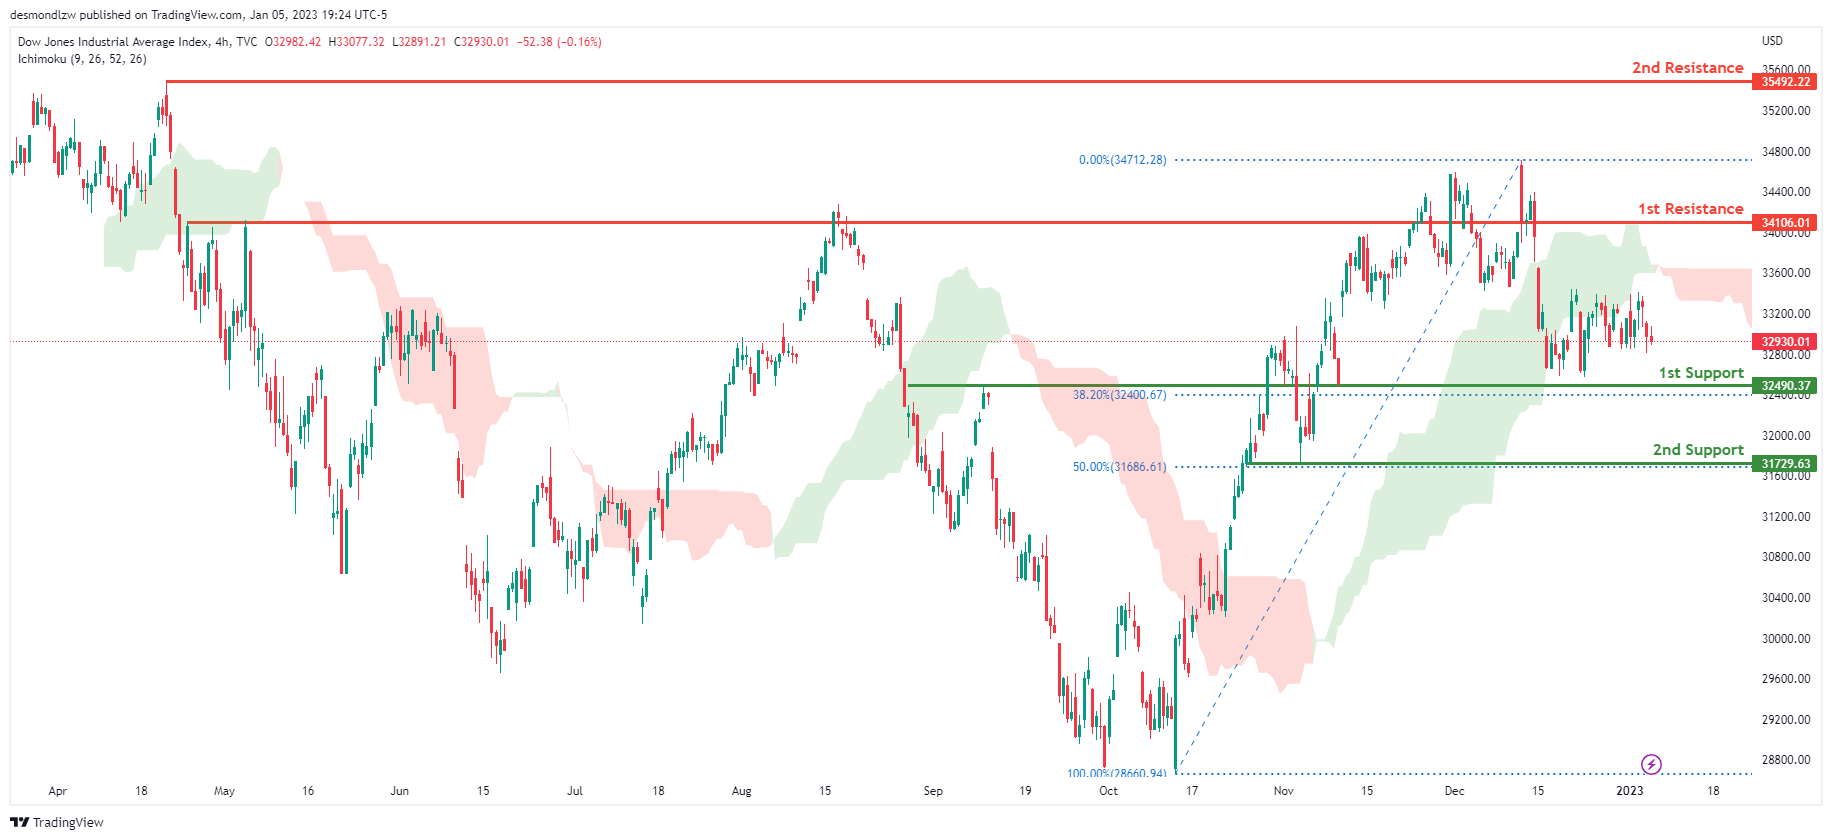
On the H4 chart, the overall bias for DJI is bearish. To add confluence to this, the price is below the Ichimoku cloud which indicates a bearish market. If this bearish momentum continues, expect the price to head back down towards the 1st support at 32490.37, where the 61.8% Fibonacci line is. In an alternative scenario, price could possibly break the 1st resistance line at 34106.01, where the previous swing high is before heading towards the 2nd resistance line at 35492.22, where the previous swing high is.
Areas of consideration:
- H4 time frame, 1st support at 32490.37
- H4 time frame, 1st Resistance at 34106.01
- H4 time frame, 2nd Resistance at 35492.22
DAX:
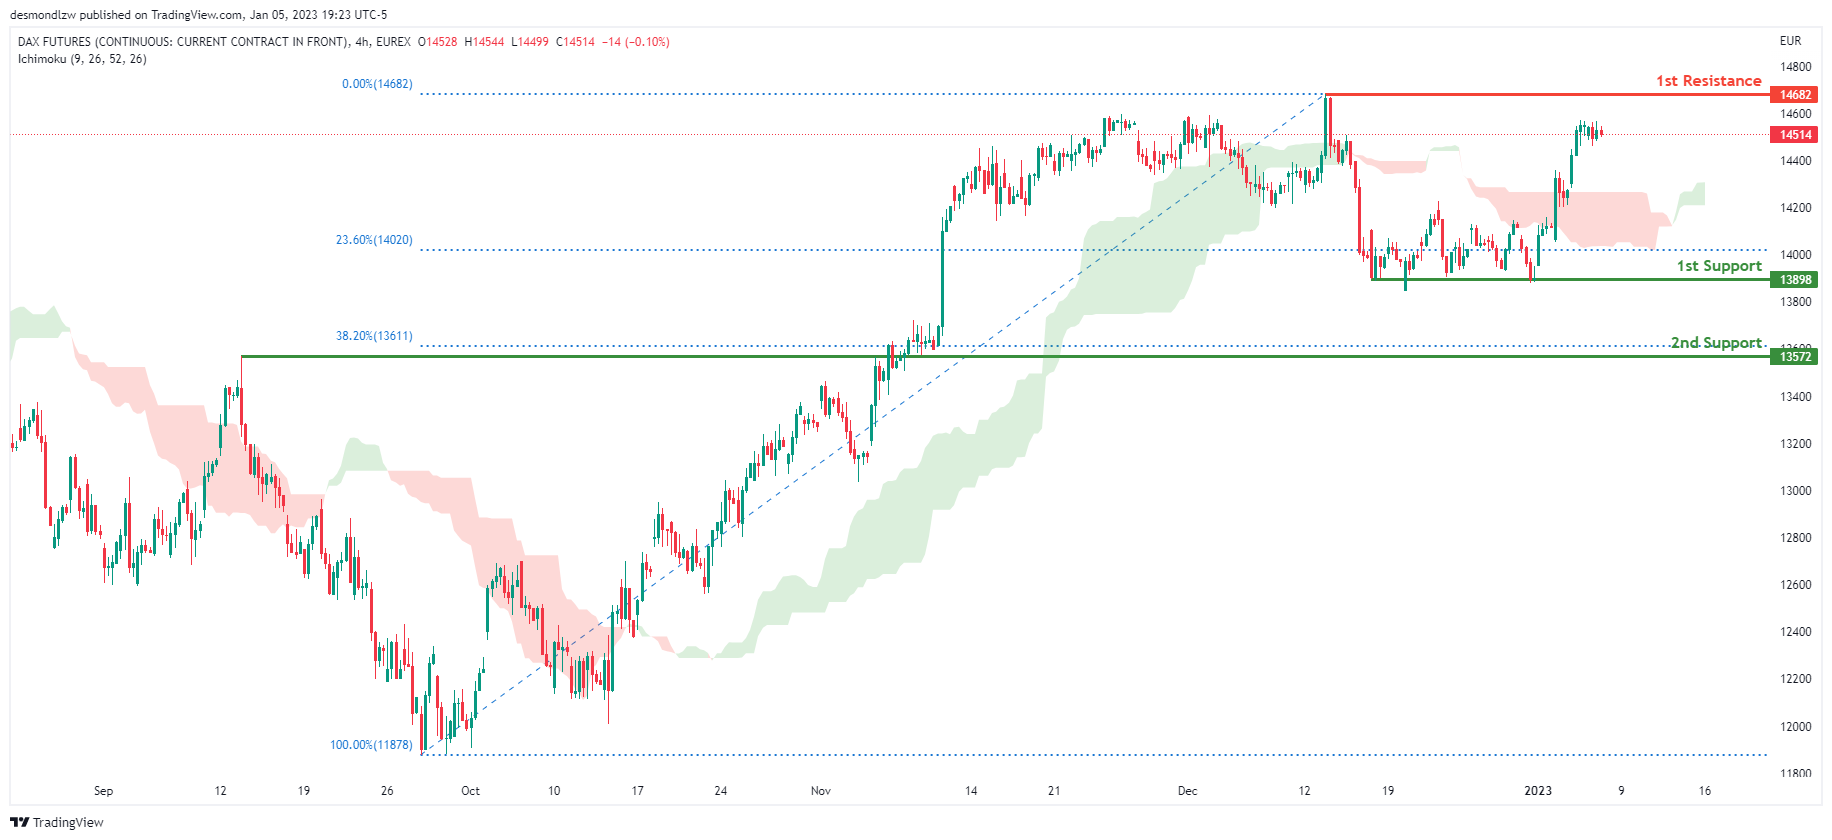
Looking at the H4 chart, my overall bias for DAX is bullish due to the current price crossing above the Ichimoku cloud, indicating a bullish market. If this bullish momentum continues, expect the price to possibly head towards the 1st resistance line at 14682, where the previous swing high is. In an alternative scenario, price could possibly head down to retest the 1st support at 13898, where the 23.6% Fibonacci line is.
Areas of consideration:
- H4 time frame, 1st resistance is at 14682
- H4 time frame, 1st support is at 13898
ETHUSD:
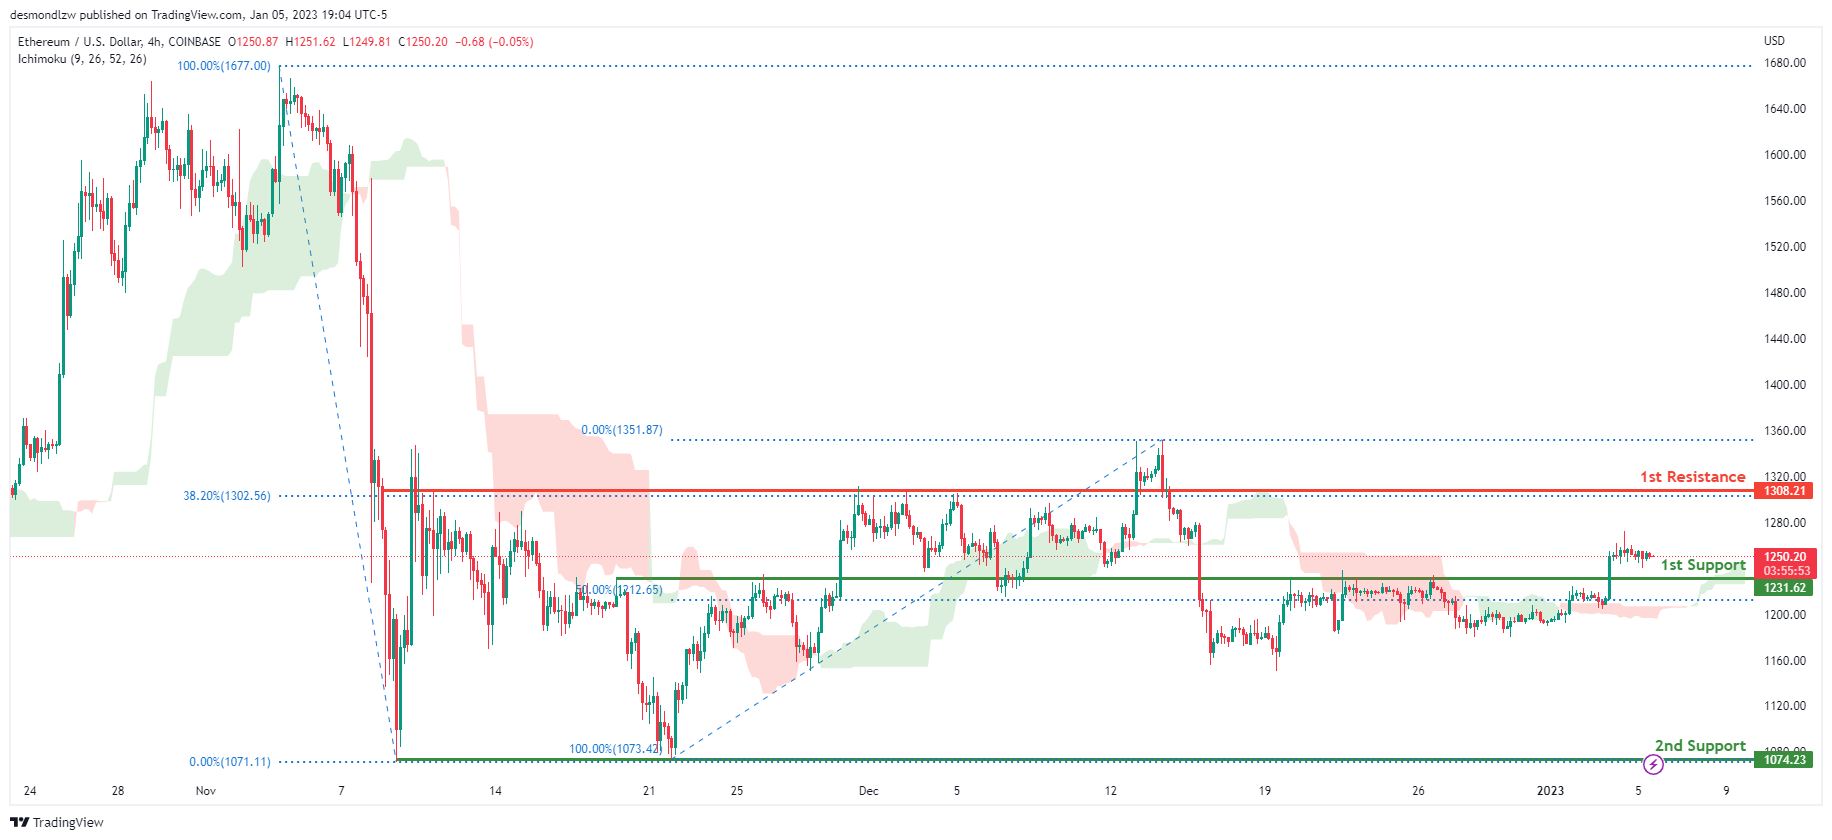
Looking at the H4 chart, my overall bias for ETHUSD is bullish due to the current price crossing above the Ichimoku cloud, indicating a bullish market. If this bullish momentum continues, expect the price to head towards the 1st resistance at 1308.21, where the 38.2% Fibonacci line is. In an alternative scenario, price could head back down towards the 1st support at 1231.62, where the 50% Fibonacci line is.
Areas of consideration:
- H4 time frame, 1st resistance of 1308.21
- H4 time frame, 1st support at 1231.62
BTCUSD:
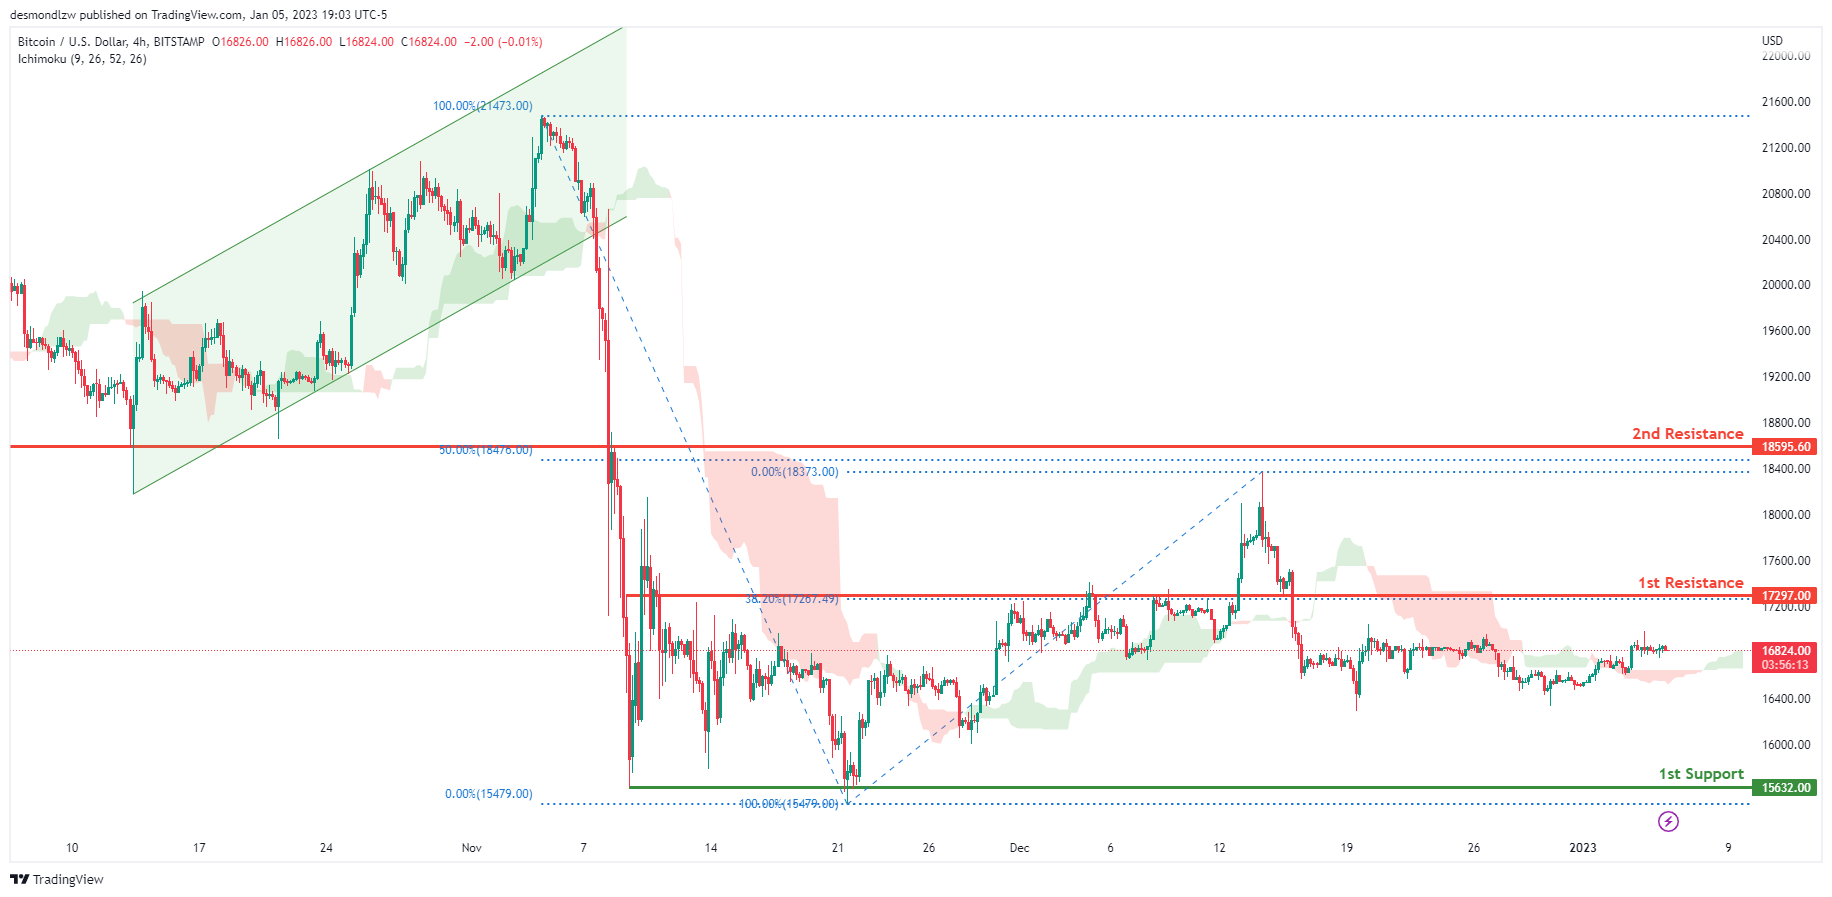
Looking at the H4 chart, my overall bias for BTCUSD is bearish due to the current price crossing below the Ichimoku cloud, indicating a bearish market. To add support to this bias, price has also broken down through the bullish ascending channel. If this bearish momentum continues, expect price to possibly continue heading towards the 1st support at 15632.00, where the previous swing low is. In an alternative scenario, price could possibly head up towards the 1st resistance at 17297.00, where the 38.2% Fibonacci line is.
Areas of consideration:
- H4 time frame, 1st resistance 17297.00
- H4 time frame, 1st support at 15632.00
S&P 500:
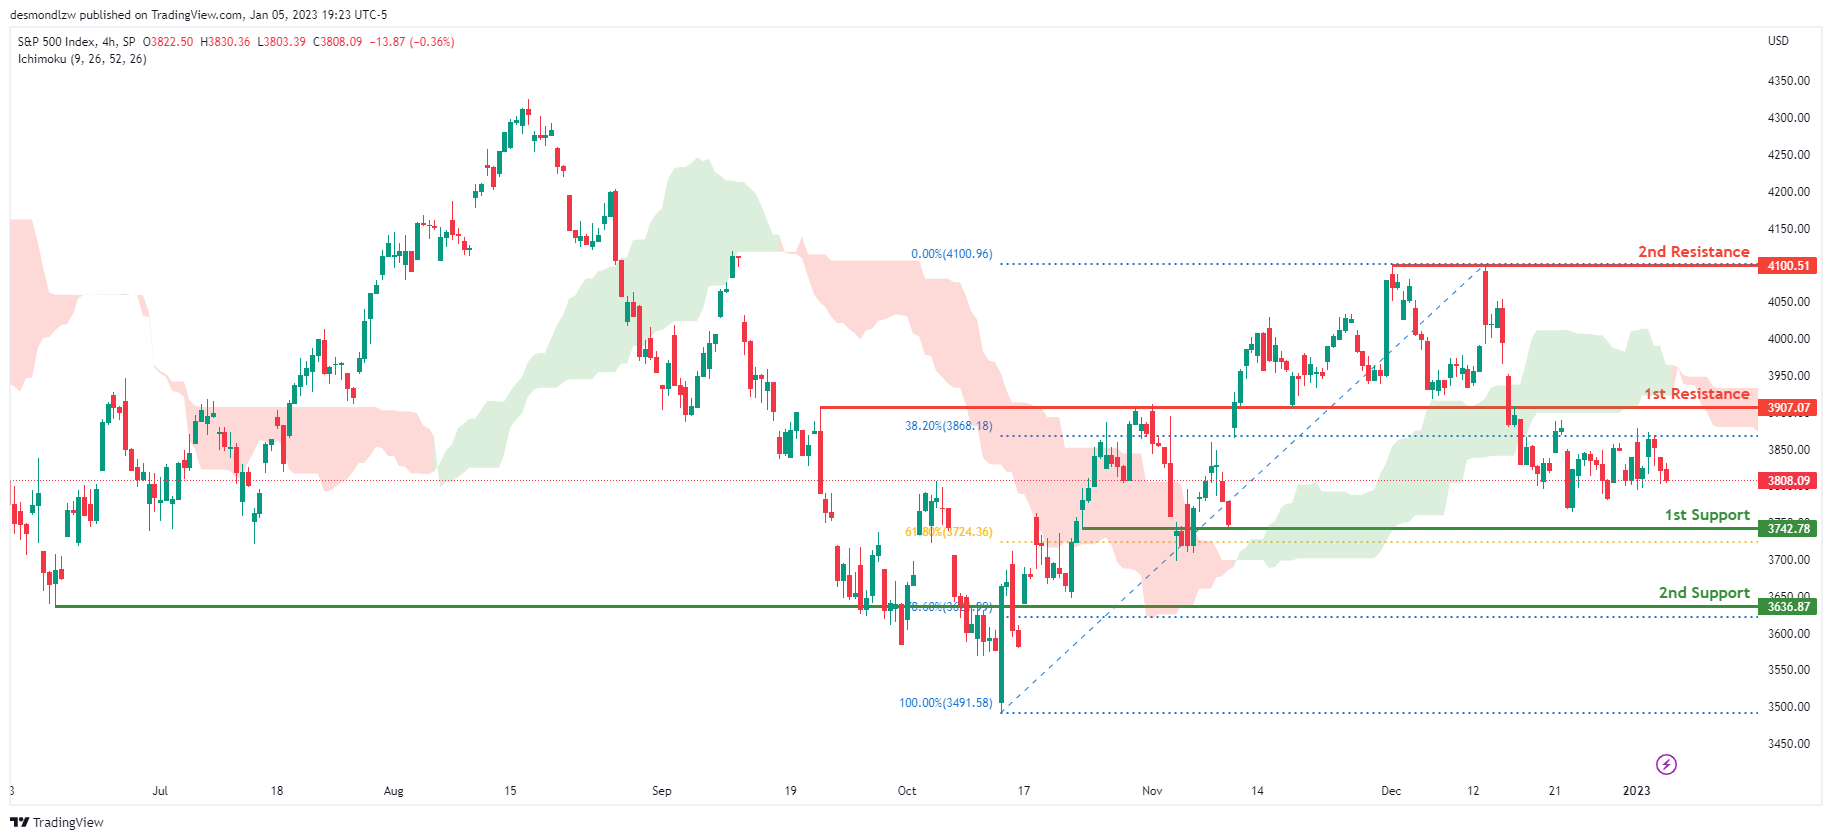
Looking at the H4 chart, my overall bias for S&P500 is bearish due to the current price being below the Ichimoku cloud, indicating a bearish market. If this bearish momentum continues, expect the price to continue heading towards the 1st support at 3742.78, where the 61.8% Fibonacci line is. In an alternative scenario, price could possibly head back up to retest the 1st resistance at 3907.07, where the 38.2% Fibonacci line is.
Areas of consideration:
- H4 time frame, 1st support at 3742.78
- H4 time frame, 1st resistance at 3907.07
GBP/JPY Daily Outlook
Daily Pivots: (S1) 158.26; (P) 159.16; (R1) 159.80; More...
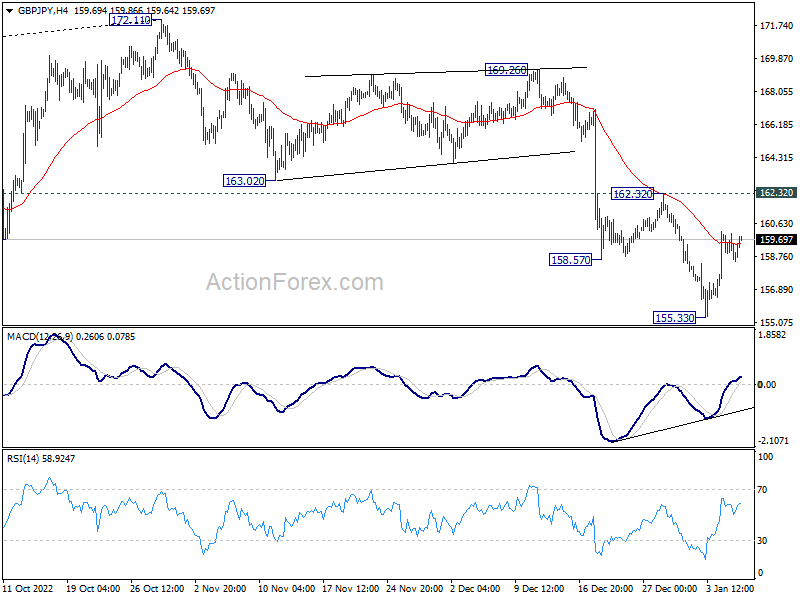
Intraday bias in GBP/JPY remains neutral for the moment. Further decline is still expected as long as 162.32 resistance holds. Break of 155.33 will resume the fall from 172.11 to 153.70 fibonacci level. Nevertheless, considering bullish convergence condition in 4 hour MACD, firm break of 162.32 will argue that such decline has completed, and turn bias back to the upside for 55 day EMA (now at 163.55) and above.
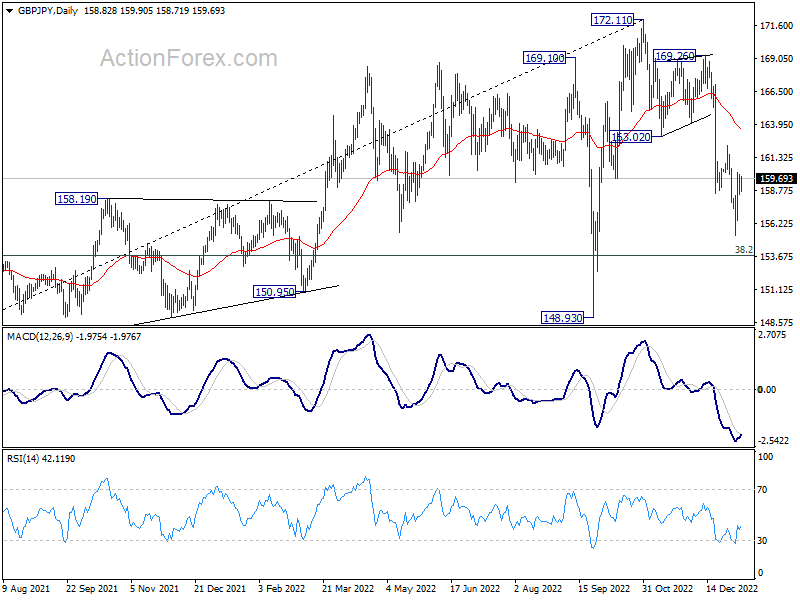
In the bigger picture, a medium term top was in place at 172.11 on on bearish divergence condition in weekly MACD. Decline from there should target 38.2% retracement of 123.94 to 172.11 at 153.70. Sustained break there will raise the change of trend reversal and target 61.8% retracement at 142.34. Nevertheless, break of 153.02 support turned resistance will argue that the decline has completed, and retain medium term bullishness.
EUR/JPY Daily Outlook
Daily Pivots: (S1) 139.79; (P) 140.57; (R1) 141.17; More....
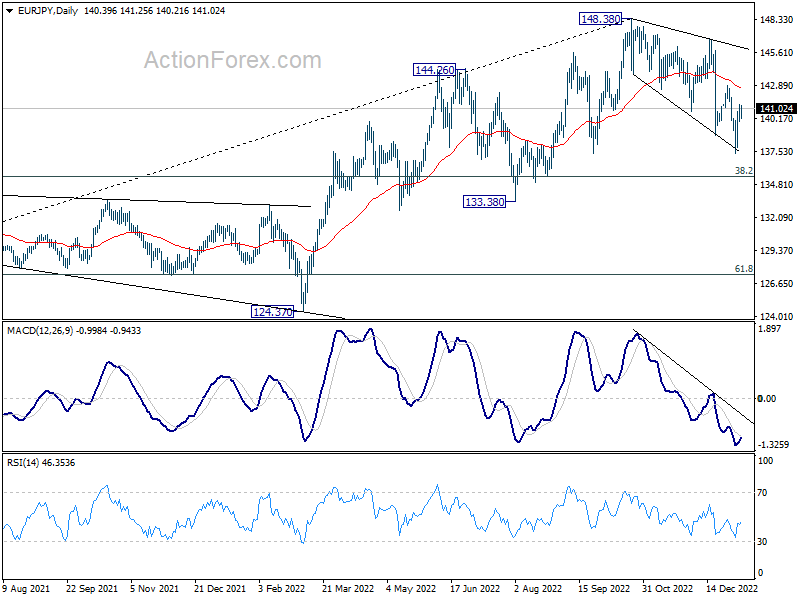
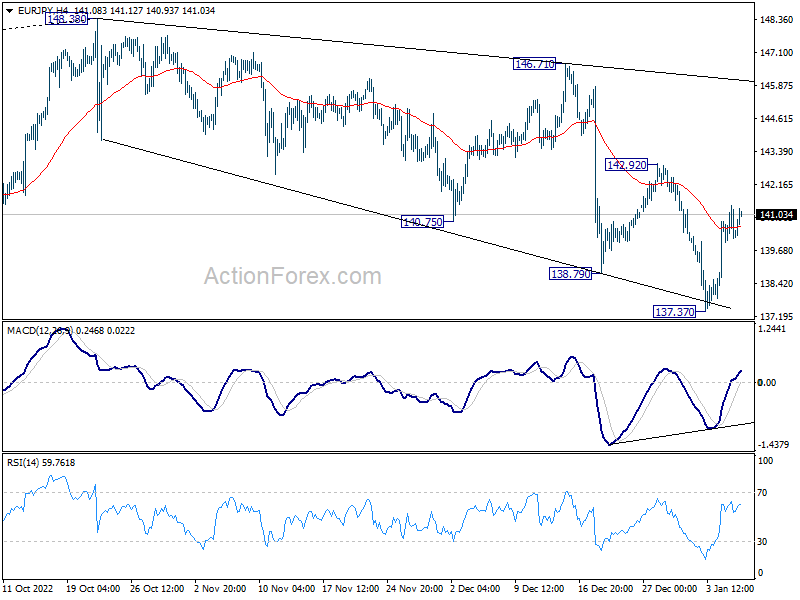
Intraday bias in EUR/JPY stays neutral for the moment. Outlook stays bearish as long as 142.92 resistance holds. Break of 137.37 will resume the decline from 148.38 to 135.40 fibonacci level. However, considering bullish convergence condition in 4 hour MACD, break of 142.92 will argue that the correction from 148.38 might have completed. Intraday bias will be turned back to the upside for 146.71 resistance.
In the bigger picture, as long as 55 week EMA (now at 138.54) holds, larger up trend from 114.42 (2020 low) is still in progress for 149.76 long term resistance. However, firm break of 55 week EMA will bring deeper fall to 38.2% retracement of 114.42 to 148.38 at 135.40. Sustained break there will raise the chance of trend reversal, and target 61.8% retracement at 127.39.