Sample Category Title
USD/JPY Dips on Possible Policy Tweak
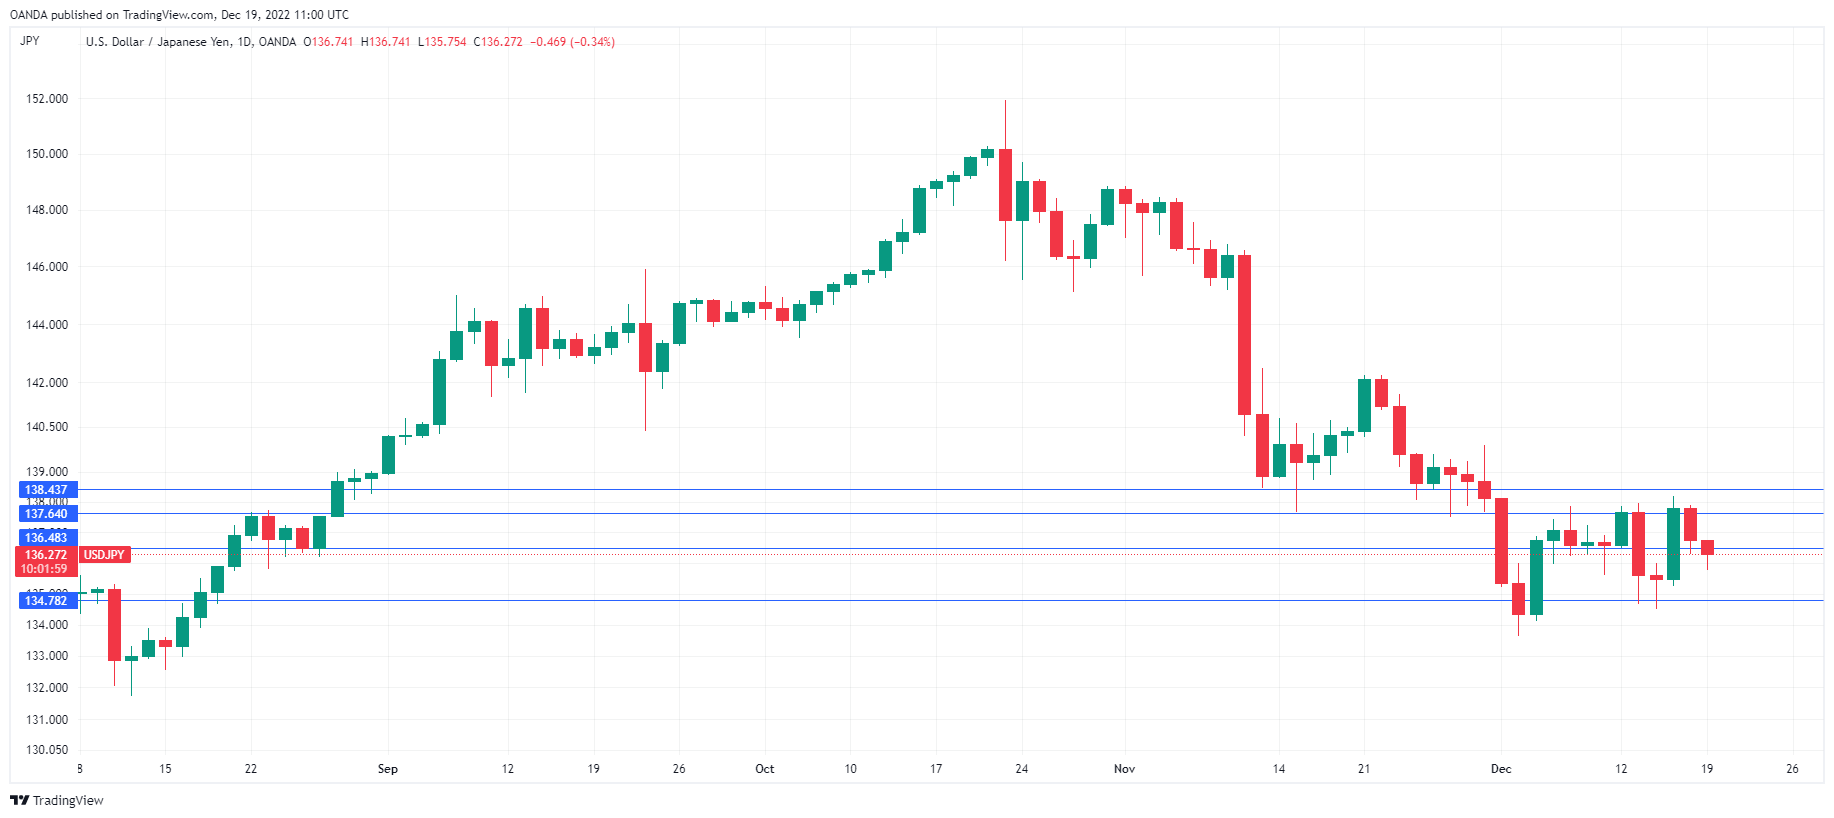
The Japanese yen has started the week in positive territory. In the European session, USD/JPY is trading at 136.22, down 0.38%. The yen is coming off a busy week, as USD/JPY traded in a 350-point range but closed the week almost unchanged.
Will Japan change its inflation stance?
The markets are keeping an eye on April 2023, when Bank of Japan Governor Kuroda retires and a new governor is appointed. This has raised speculation that the changing of the guard could lead to policy changes at the bank. There was a report today that the BoJ and the government could revise their decade-old statement, which pledges to achieve the 2% inflation target “at the earliest date possible”. This has resulted in the BoJ maintaining its radical stimulus programme and keeping interest rates ultra-low, at a time when other major central banks are busy raising rates in order to curb inflation.
This policy was initiated in 2013, when Japan’s economy was marked by deflation. With consumer prices rising and a weak yen contributing to inflation, the statement could be out of date and the new BoJ governor may feel the timing is right to revise the statement, perhaps making the inflation target more flexible. There is rising speculation that the new governor could tweak yield curve control, which has kept a cap on 10-year Japan’s government bonds and fueled the yen’s sharp descent this year. For now, however, it is likely to be business as usual – the BoJ winds up a two-day meeting on Tuesday and is not expected to make any changes to monetary policy.
USD/JPY Technical
- USD/JPY is testing support at 136.48. This is followed by support at 134.78
- There is resistance at 137.64 and 138.43
Euro Edges up as Business Climate Improves
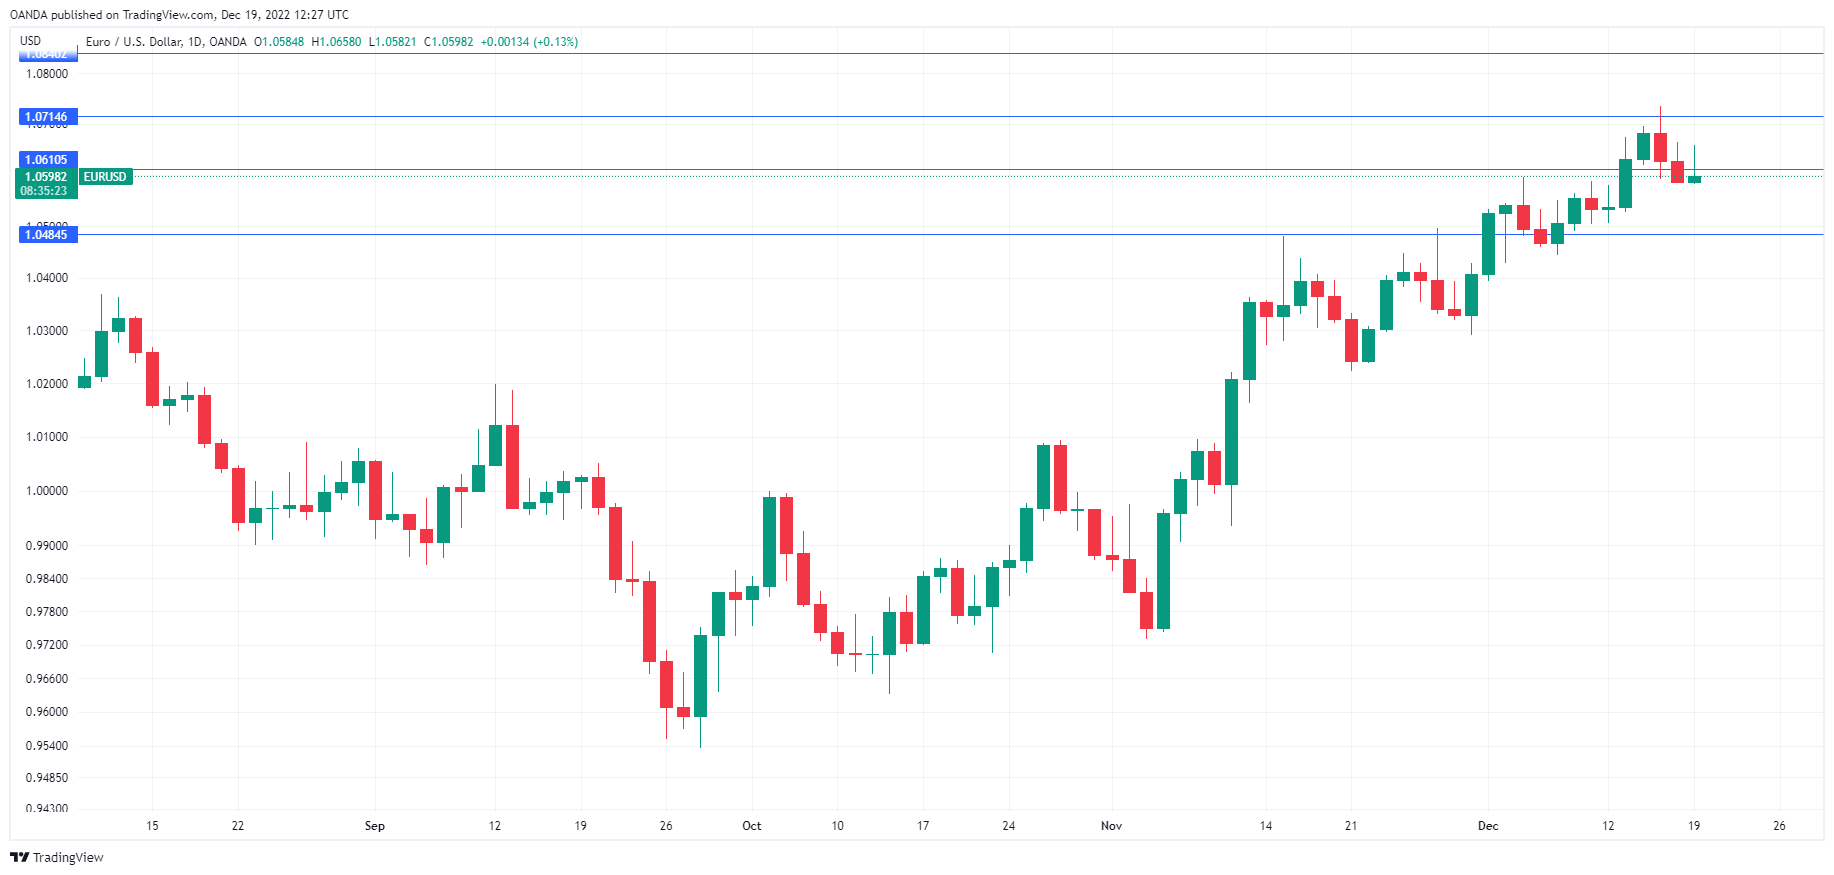
EUR/USD has edged higher on Monday. In the European session, EUR/USD is trading at 1.0610, up 0.24%.
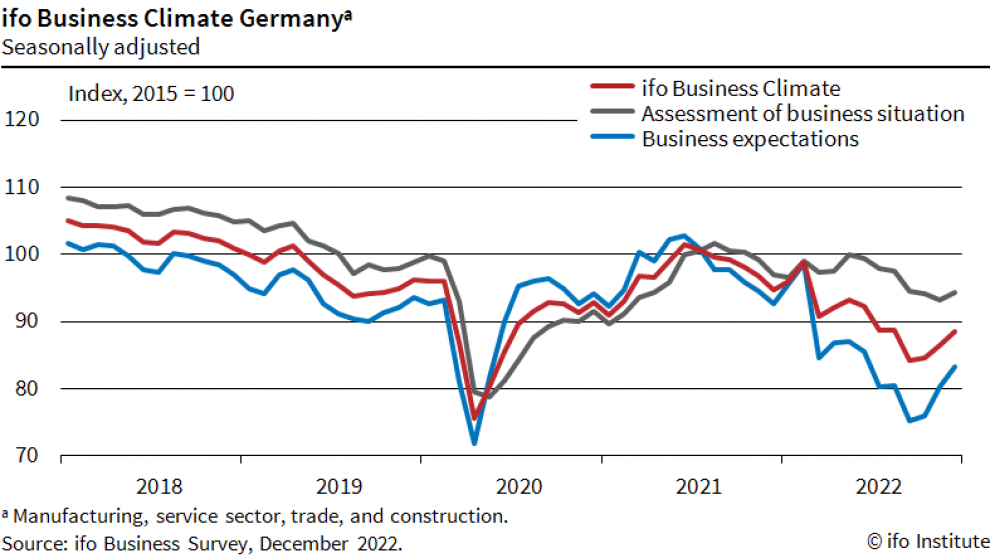
The week started on a positive note as German business confidence climbed in December. The Ifo Business Climate index rose to 88.6, up from 86.4 in November and its highest level in five months.
Bundesbank revision – growth down, inflation up
The Bundesbank does not appear to share in the optimism. Its biannual economic forecast found that Germany’s economy will contract through the middle of 2023, and businesses and consumers will continue to be hit with high energy costs. The war in Ukraine has been weighing heavily on the German economy, and the Bundesbank’s latest economic projection sees a 0.5% decline in GDP in 2023, compared to a 2.4% gain in the June forecast. Inflation has been revised to 7.2% in 2023, up from 4.5% in June. The risk to economic growth has been tilted to the downside, due to possible shortages in energy supplies. As for inflation, the risk is tilted to the upside. The updated forecast mirrors the latest ECB projections for the eurozone, which raised inflation while lowering growth.
With the Bundesbank and the ECB projecting that inflation will accelerate, we can expect further rate hikes from the ECB, which delivered a 50-bp increase last week. The ECB rate statement said rates would have to “rise significantly” in order to curb inflation, and ECB President Lagarde said that the central bank could deliver up to three more rate hikes. Lagarde was hawkish, saying that the 50-bp hike, which came after two 75-bp hikes was not a pivot and that the ECB would not be slowing down.
EUR/USD Technical
- EUR/USD tested resistance at 1.0610 earlier today. Above, there is resistance at 1.0714
- 1.0610 and 1.0484 are providing support
Gold Price Started a Fresh Increase from $1,772
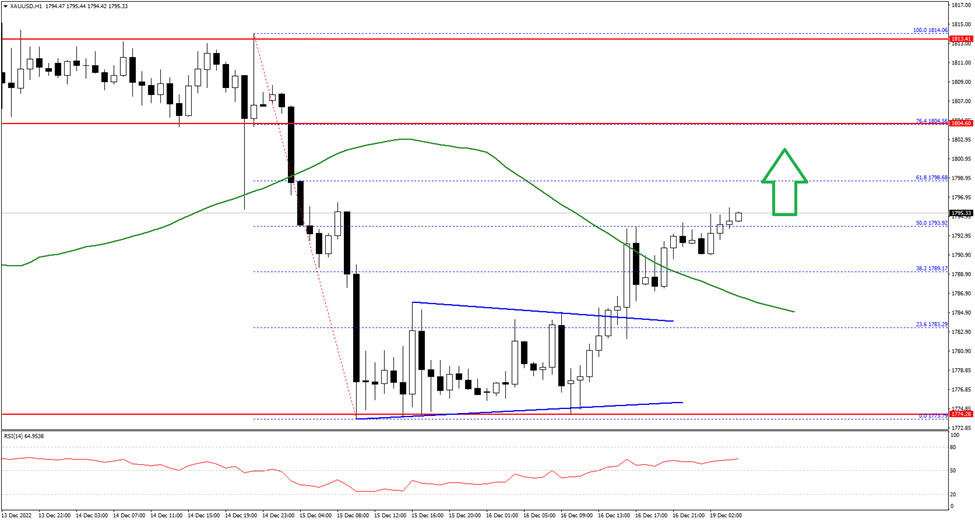
Gold price started a fresh increase from the $1,772 support zone against the US Dollar. The price gained pace above the $1,780 resistance to move into a positive zone.
The pair even climbed above the $1,790 resistance and settled well above the 50 hourly simple moving average. It is now showing positive signs above the 50% Fib retracement level of the downward move from the $1,814 high to $1,773 low.
On the upside, the first major resistance is near $1,800 on FXOpen. The next main resistance could be near the $1,805 level, above which the price could start a steady increase towards the $1,815 level.
On the downside, an immediate support is near the $1,788 level. The next major support is near the $1,785 level, below which the price might decline towards the $1,780 support level in the near term. Any more losses might call for a test of $1,772.
ECB de Guindos: I absolutely honest don’t know rate hikes will continue until when
ECB Vice-President Luis de Guindos said today, "there will be more interest rate hikes, until when, I don't know. I am absolutely honest, I don't know." He added that the central bank was committed to bring inflation down to its 2% target.
Separately, Governing Council member Gediminas Simkus said, "there will undoubtedly be a 50 bps increase in February."
Germany Ifo rose to 88.6, entering holiday with a sense of hope
Germany Ifo Business Climate rose from 86.4 to 88.6 in December, above expectation of 87.2. Current Situation Index rose from 93.2 to 94.4, above expectation of 93.5. Expectations Index rose from 80.2 to 83.2, above expectation of 82.0.
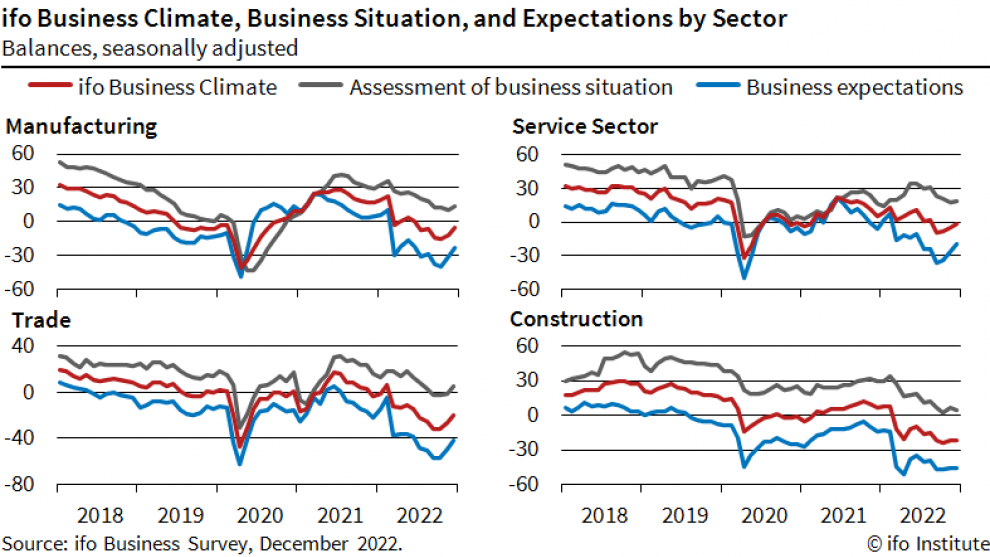
By sector, manufacturing rose from -11.5 to -5.6. Services rose from -5.3 to -1.2. Trade rose from -26.9 to -20.0. Construction, however, dropped from -21.5 to -22.2.
Ifo said: "Sentiment in the German economy has brightened considerably. The ifo Business Climate Index rose to 88.6 points in December, up from 86.4 points (seasonally adjusted) in November. Companies assessed their current situation as better again. This comes on the heels of six consecutive falls in the indicator for the current situation. Expectations also improved noticeably. German business is entering the holiday season with a sense of hope."
Gold Hovers Around 200-day SMA, Diverging Signals Arise
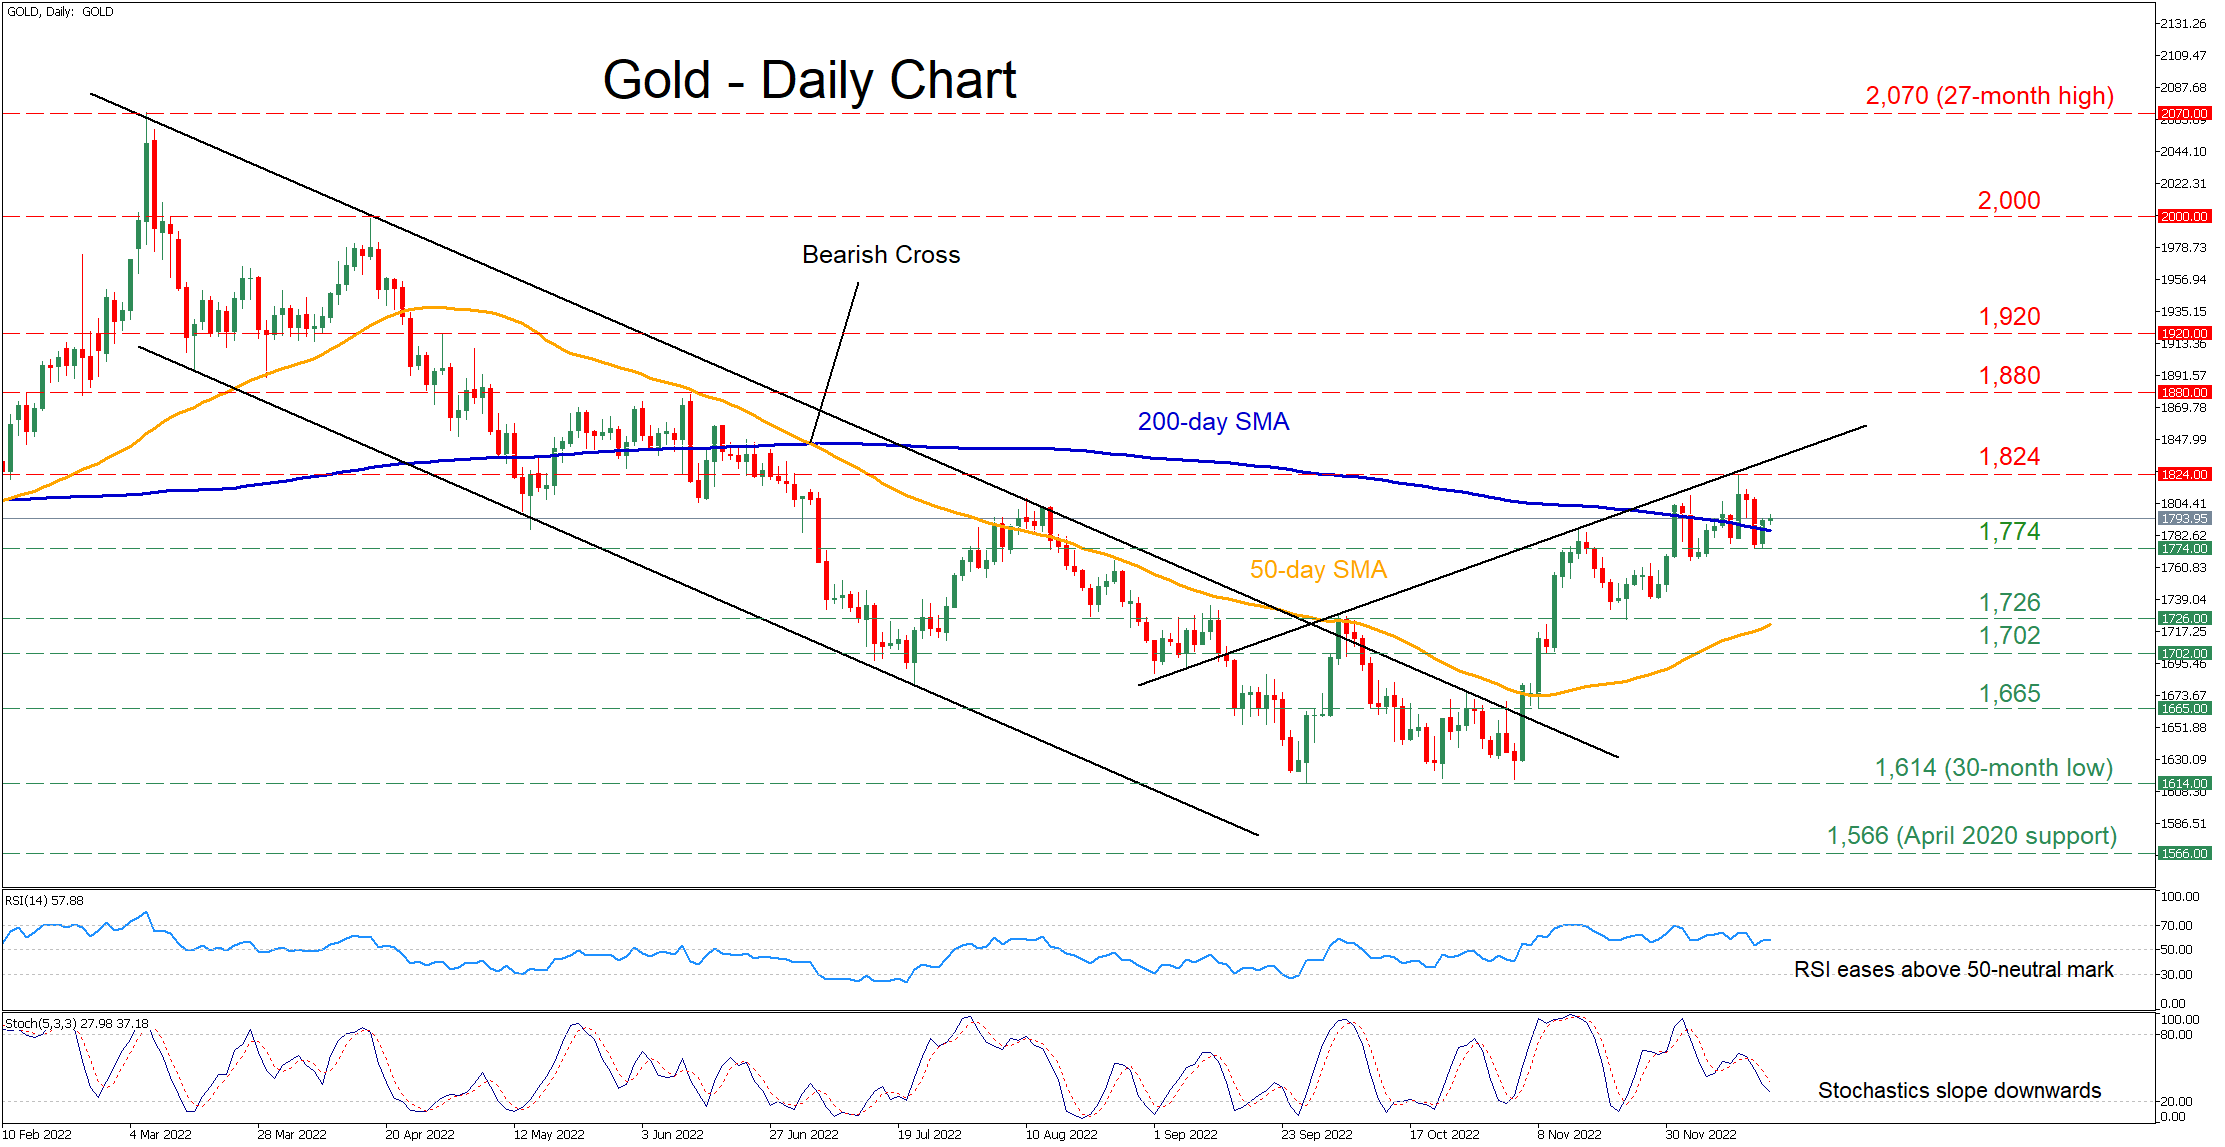
Gold had been trading within a descending channel for the most part of 2022 but managed to stage a moderate rebound since early November. Even though bullion has recovered significant ground, its recovery seems to be on hold as the price failed to profoundly surpass the 200-day simple moving average (SMA).
The fact that gold is stuck between opposing directional forces is also reinforced by the momentum indicators. Specifically, the RSI remains comfortably above its 50-neutral mark, while the stochastic oscillator is descending near the 20-oversold zone.
If sellers manage to seize control and push the price below its 200-day SMA, the recent low of 1,774 may act as the first line of defence. Breaking below that zone, the commodity could test the November support of 1,726, which lies very close to the 50-day SMA. Failing to halt there, the 1,702 barrier could prove to be a tough one for the price to violate.
Alternatively, bullish actions could propel the price towards the recent high of 1,824. If that level is breached, the bulls might aim for the June peak of 1,880. Even higher, the spotlight could turn to 1,920 before the crucial 2,000 psychological mark comes under examination.
Overall, gold’s recovery appears to be fading, while short-term oscillators fail to provide a clear directional signal. Hence, a clear break above or below the 200-day SMA could trigger a decisive move towards the same direction.
EURUSD Poised for Bullish Continuation
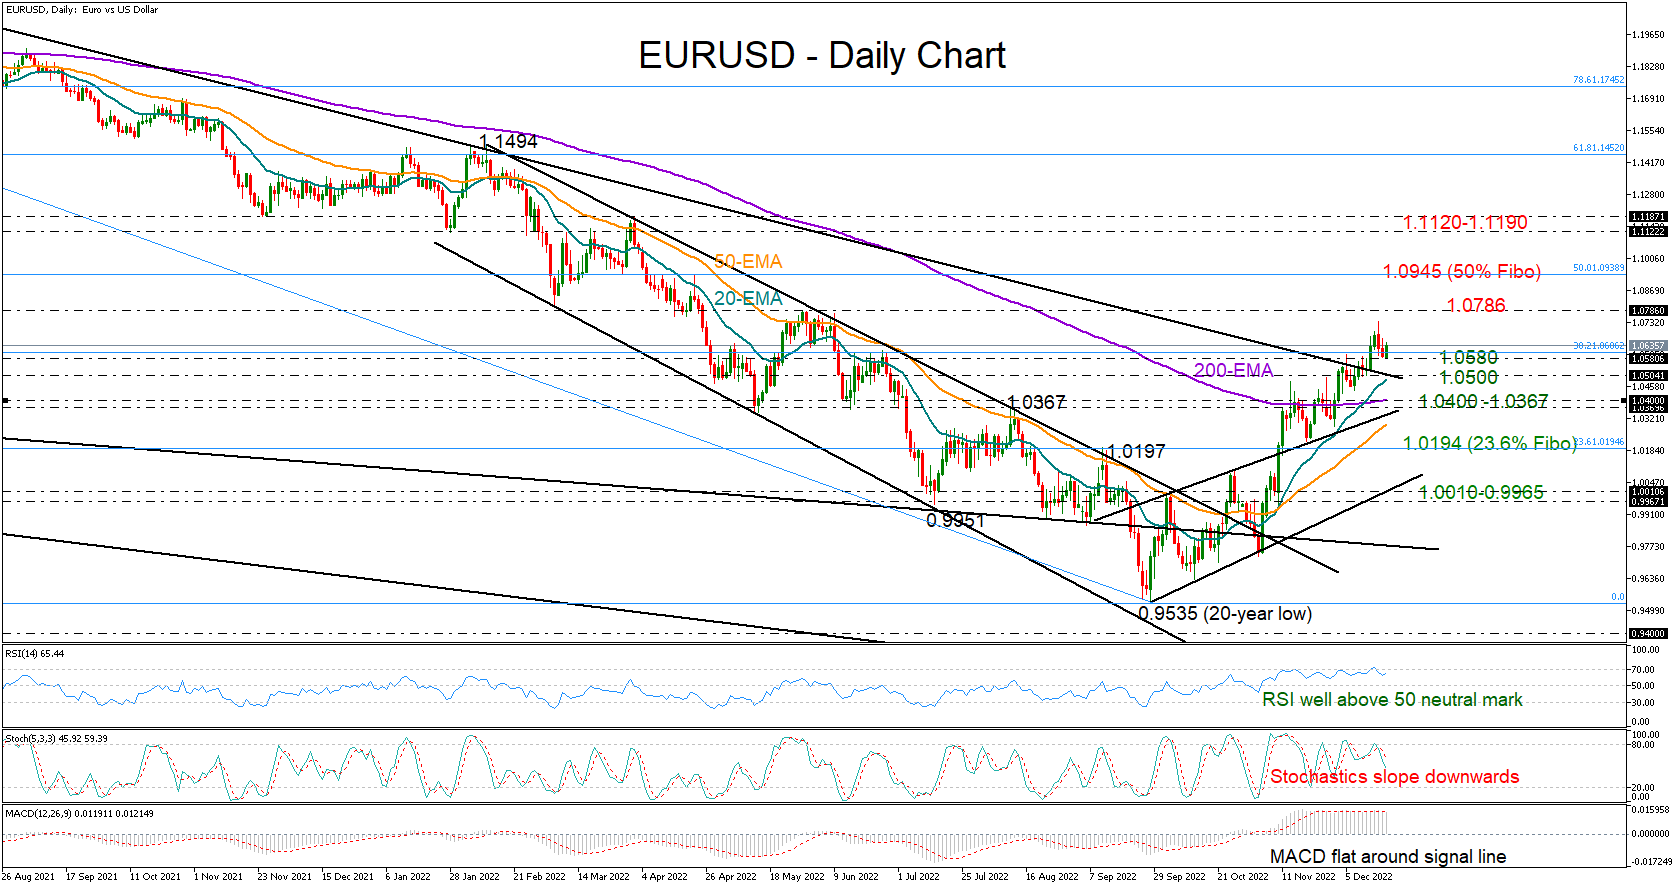
EURUSD opened the week with positive momentum marginally below the 1.0600 level, having slightly trimmed some of its recent gains as overbought signals appeared on the chart.
The RSI keeps fluctuating comfortably above its 50 neutral mark following the pullback below 70, reflecting persisting buying interest, whereas the stochastics and the MACD are looking for a downside reversal, suggesting that some caution is still required.
Yet, with the pair maintaining a clear bullish structure in the short-term picture, which recently expanded above the long-term crucial descending trendline drawn from May 2021, traders may continue the push to higher ground.
The pair is currently building a base around the 1.0580 level, where the 50-period exponential moving average (EMA) is supporting the market in the four-hour chart. A jump into the 1.0700 territory would bring May’s resistance of 1.0786 back on the radar. Running higher, the way would clear for the 50% Fibonacci retracement of the 2021-2022 downtrend at 1.0945. Another victory at this point could see a continuation towards the 1.1120–1.1190 constraining zone.
On the downside, if the 1.0580 floor cracks, the broken descending trendline may defend the bulls with the help of the 20-day EMA around 1.0500. Should the bears win the battle here, the 200-day EMA and the surface of the broken bullish channel could next come to the rescue within the 1.0400–1.0367 area. Note that the 50-day EMA is converging in that territory too. Hence, a decisive close lower could confirm another leg down to the 23.6% Fibonacci of 1.0194. If the latter proves fragile, the bearish phase could last till the channel’s lower boundary seen at 1.0010.
In brief, EURUSD has the foundation to move further north despite some weakness in sentiment. For that to happen, the 1.0580 base will need to stand firm.
NASDAQ ($NQ_F) Elliott Wave: Forecasting The Path & Selling The Blue Box
Hello fellow traders. In this technical blog we’re going to take a quick look at the Elliott Wave charts of NASDAQ . As our members know, the Index shows bearish sequences in the cycle from the November 22. 2021 peak. Incomplete structure calls for a further decline. Recently Nasdaq has made 3 waves bounce , when it has reached our selling zone. We recommended members to avoid buying and keep selling rallies in 3,7,11 swings due to bearish sequences. In the further text we are going to explain the Elliott Wave Forecast and the trading strategy.
Nasdaq H4 Elliott Wave Analysis 11.10.2022
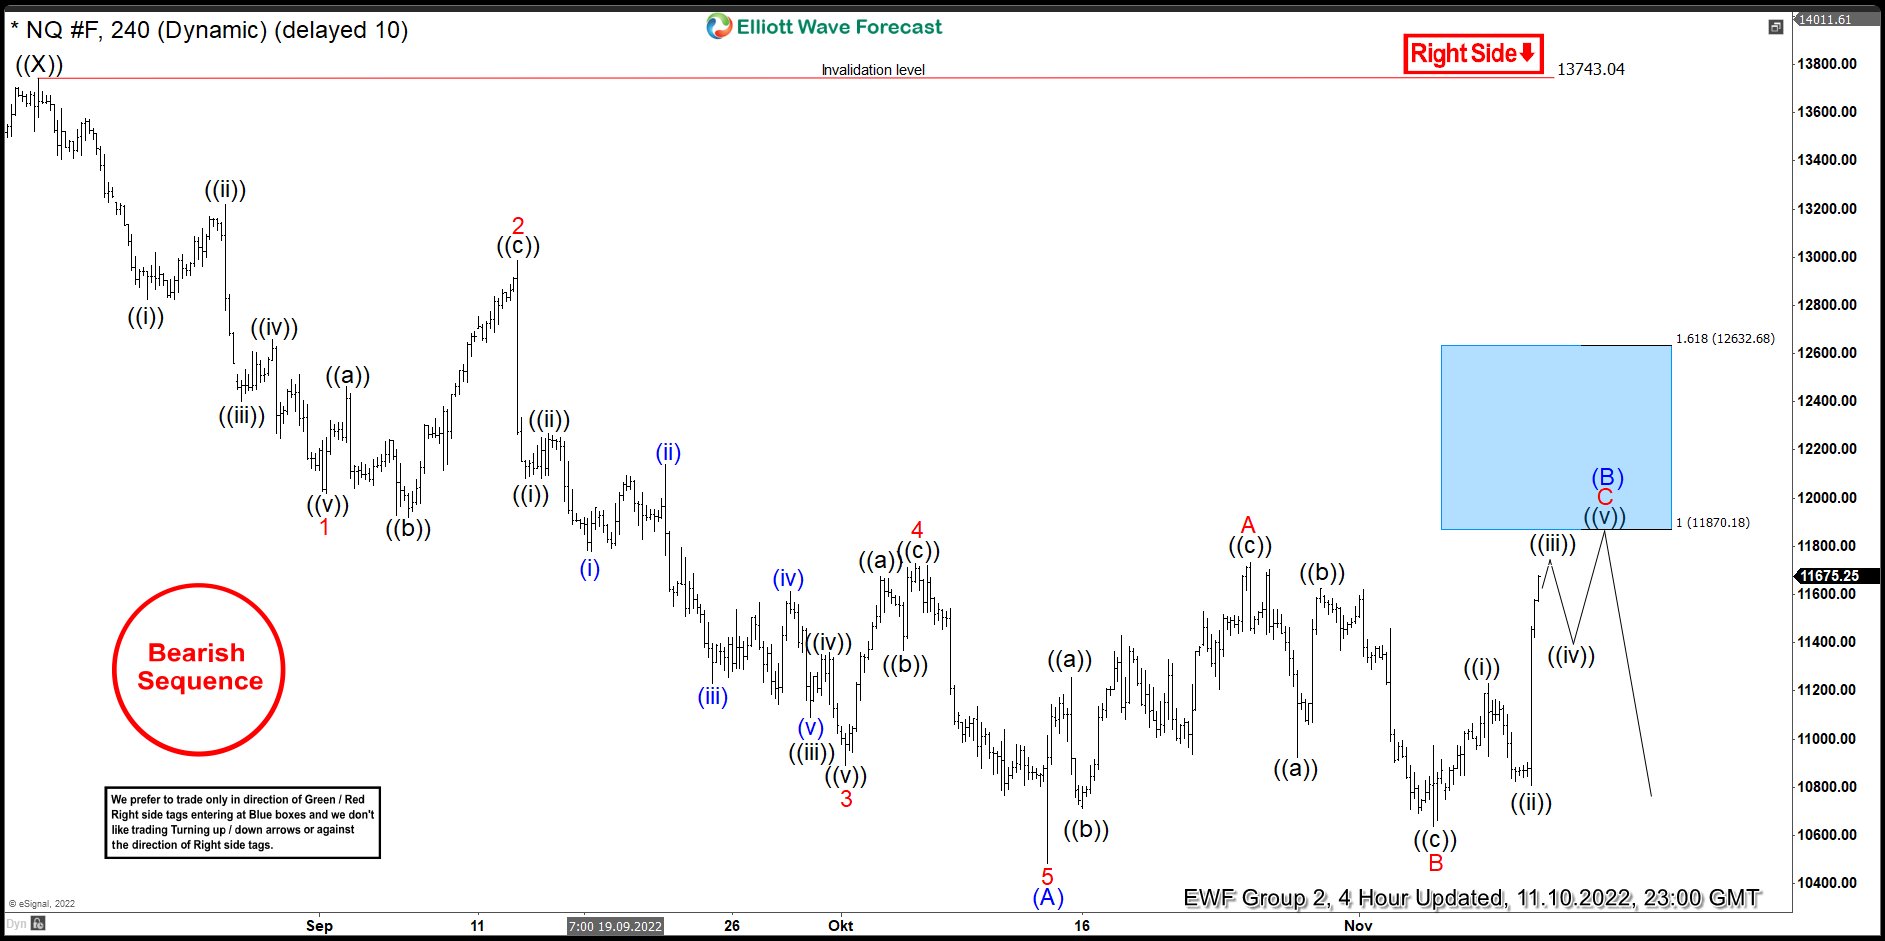
Nasdaq is giving us bounce that is correcting the cycle from the 13743.04 peak. At this moment we believe recovery is still in progress as the price shows incomplete sequences. Consequently we are calling for more short term strength toward 11870.18-12632.68 area to complete (B) blue . We recommended members to avoid buying the Index in proposed push up. Strategy is waiting for Blue Box to be reached before selling it. As the main trend is bearish we expect sellers to appear at the blue box for 3 waves pull back at least. Once pull back reaches 50 Fibs against the B red low, we will make short position risk free ( put SL at BE) and take partial profits. Invalidation for the trade would be break above 1.618 fibs extension: 12632.68
As our members know Blue Boxes are no enemy areas , giving us 85% chance to get a reaction.
Reminder:
Our charts are easy to trade and understand. When you see combination of right side stamp and blue box on the chart, the instrument can be traded. Quick explanation :
-Red bearish stamp+ blue box = Potential Selling Setup
-Green bullish stamp+ blue box = Potential Buying Setup
-Charts with Black stamps are not tradable. 🚫
Nasdaq H4 Elliott Wave Analysis 11.24.2022
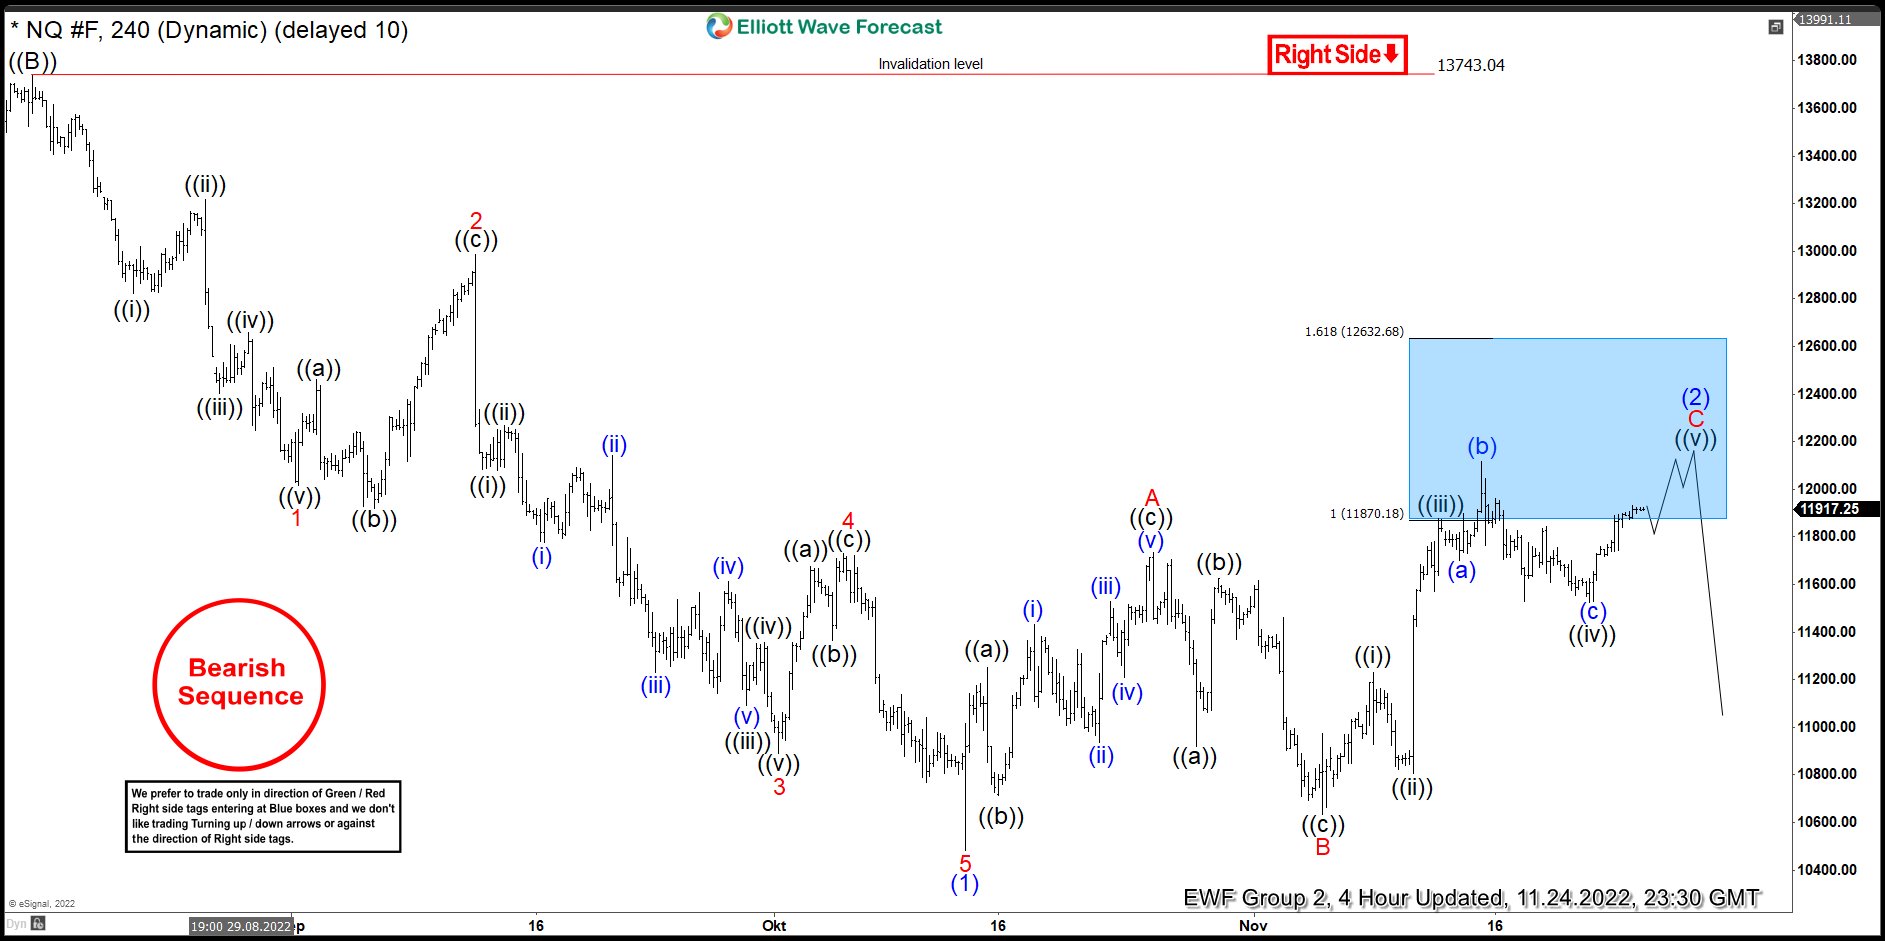
Nasdaq reached equal legs ( blue box ) area at 11870.18-12632.68 and made turn lower from there. We already got a reaction from the blue box. However we still believe another marginal push up within the blue box would be ideal to complete recovery.
Nasdaq H4 Elliott Wave Analysis 11.24.2022
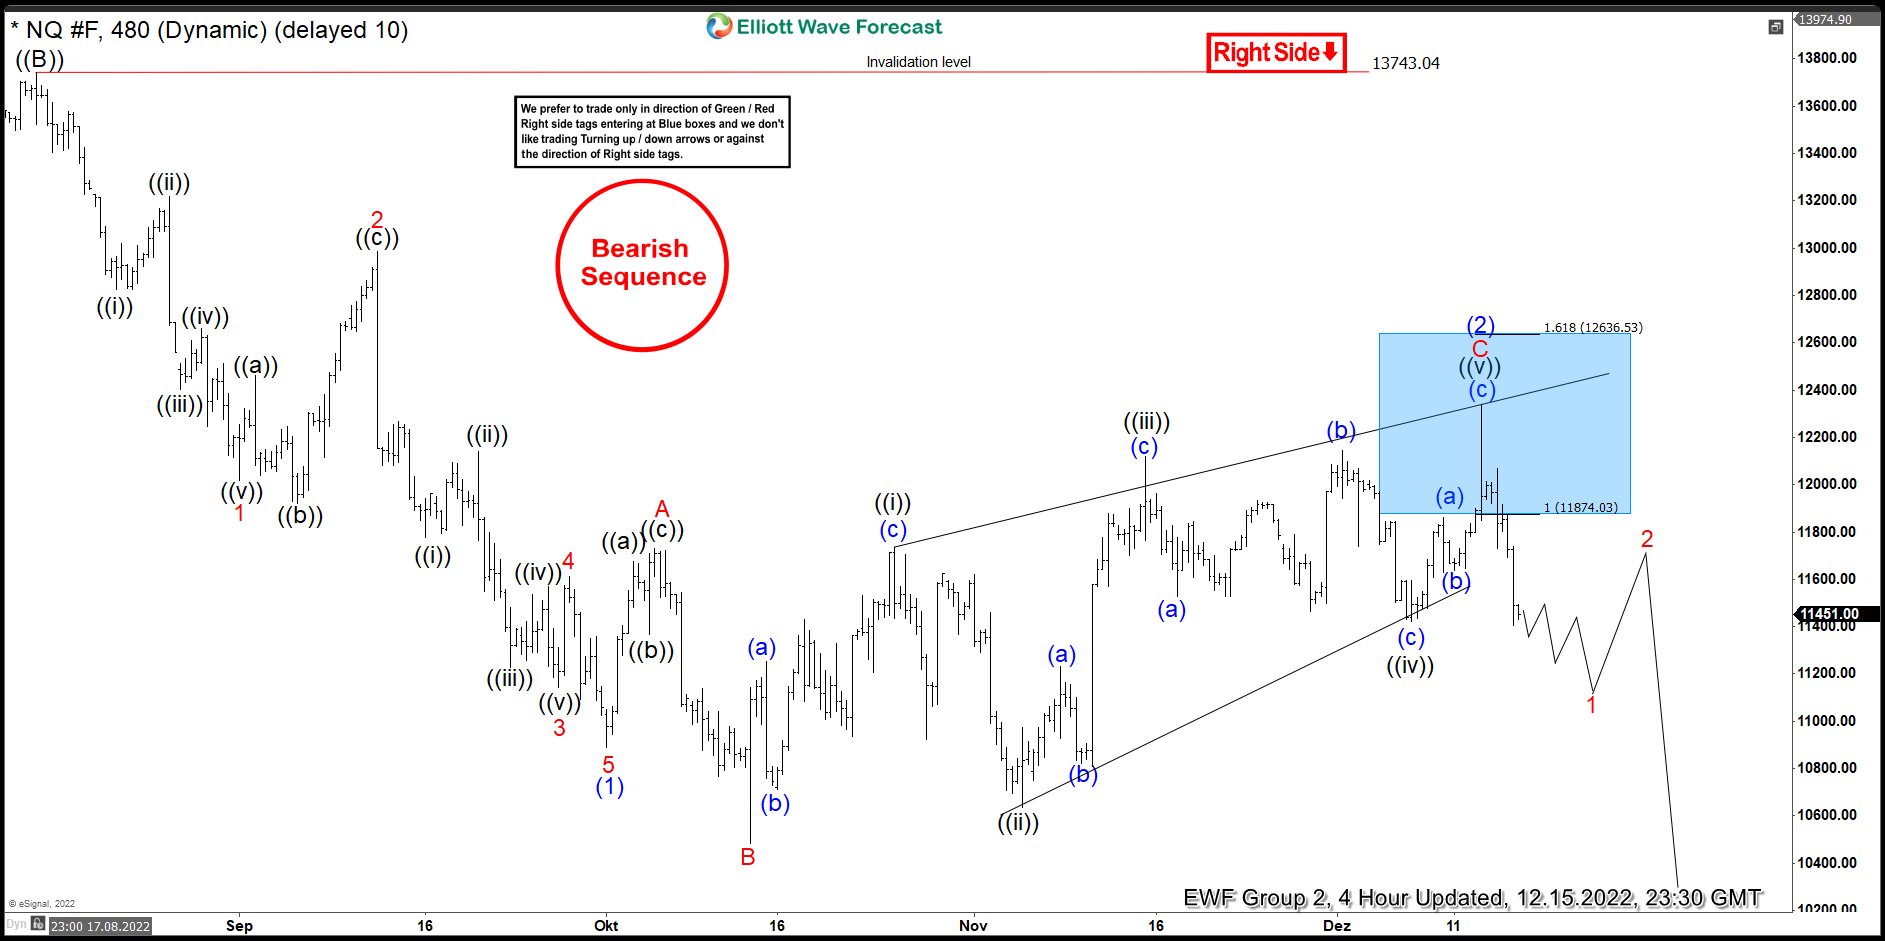
Eventually the index has made last push up and found sellers as expected. We have got decent reaction from the blue box that has reached and exceeded 50 fibs against the connector. As a result , members who took short trades made positions risk free ( Put SL at BE) and took partial profits. At this stage we call wave (2) blue connector completed at 12332 .6high. We would like to see break of 10/13 low to confirm next leg down is in progress.
BOJ Rate Decision: Setting Up for Policy Change
Japan's inflation rate is finally starting to tick up. It's expected that the country will report a further increase in inflation in November to 3.9% from 3.7% prior. But, before that information is made available, the BOJ is expected to meet to decide its monetary policy stance.
Normally this would be an issue for a central bank, having to make a rate decision without the latest inflation figures. But the long-standing consensus is that the BOJ won't change policy, at all, and keep its now decades-long extreme easing policy. So, if the interest rate isn't going to be a surprise, what could move the markets? Well, that's preparing for what's coming next year.
A change in leadership
Kuroda, known as an ultradove, will step down at the end of his term in April. The consensus is that since rates have been negative for the entirety of his mandate, it's unlikely he will change the situation just as he's about to go out the door. But, that doesn't mean he won't help set things up for whomever replaces him. And that could start coming out as soon as the next meeting.
For a long time, it's been rumored that the most likely replacement for Kuroda would be Hiroshi Nakaso. He's a former Finance Ministry official, and is seen as a lot more hawkish than the current governor. In the past, he's already issued proposals on how the BOJ could exit its extraordinary easing policy.
A change in outlook
Nakaso has proposed a slow shift in policy, with small steps to bring inflation down. That could be something of a challenge, since many other central banks have raised dramatically to head off skyrocketing inflation. Japan has managed to avoid that situation, so far, but inflation is near double the target rate and keeps rising. Which has been increasing pressure on the BOJ to do something.
One of the ways that the BOJ could relieve that pressure is to let it be known that it is considering some of the "soft" measures to lift rates, but not actually do any changes. Given how long the BOJ has been stuck in one policy, it could be enough to "re-anchor" inflation expectations.
What about the weaker yen?
One of the things that was driving inflation was the weakening yen earlier in the year. It got so bad that the Japanese government had to step in a couple of times. But since expectations that the Fed was about to level off in its rates started to cement in the mind of the markets, the yen has recovered a little. This has given the BOJ - and particularly Kuroda - more room to keep rates low at least for a while.
But, if the trend with the currency could reverse, that could cause complications for the BOJ. One of the ways to deal with that would be to suggest the BOJ was looking at easing off on yield curve control. That's a policy that would be expected to be enacted if Nakaso were to become governor. But, whether the BOJ judges it an opportune moment to let that slip now or safe that card to play in the new year, is still an open question. That could be the determinant of whether the yen continues to drift in it's current direction, or starts to recover against the dollar on expectation of the new policy.
DAX 40 in Liquidation Mode
The Dax 40 slumps over risk-off sentiment into the holiday season. The rally came to a halt near last June’s high of 14700. Then a break under the lower end (14150) of the previous consolidation forced leveraged positions to close out, sparking volatility in the process. The psychological level of 14000 has failed to contain the sell-off and turned into a fresh resistance. 13600 is the next support. As the RSI sunk into oversold territory, those looking to buy the dip may want to wait for the liquidation to settle down.