Sample Category Title
XAG/USD Struggles for Support
Silver falls back as the dollar extends sharp gains across the board. A bearish RSI divergence showed a slowdown in the rally. After a double top at the psychological level of 24.00, the first wave of profit-taking took the price below 23.20, putting the bulls on the defensive. The next round number 22.00 coincides with the base of a previous breakout and the 30-day moving average, making it an area of particular interest. Its breach could trigger a deeper correction to 21.00. 23.50 has become a fresh hurdle.
EUR/GBP Tests Resistance
The pound tumbled after the BoE expressed concerns of a prolonged recession. On the daily chart, the near 3-month long consolidation might have come to an end after a bullish candle above 0.8650. The surge is likely to be caused by short-covering from traders on the wrong side. The price has hit resistance at 0.8770 which lies in the supply zone extending to last month’s peak at 0.8830. A bullish breakout would resume the rally in the medium-term. In the meantime, 0.8620 is a key support to keep the bounce intact.
Technical Outlook and Review
USD/JPY:
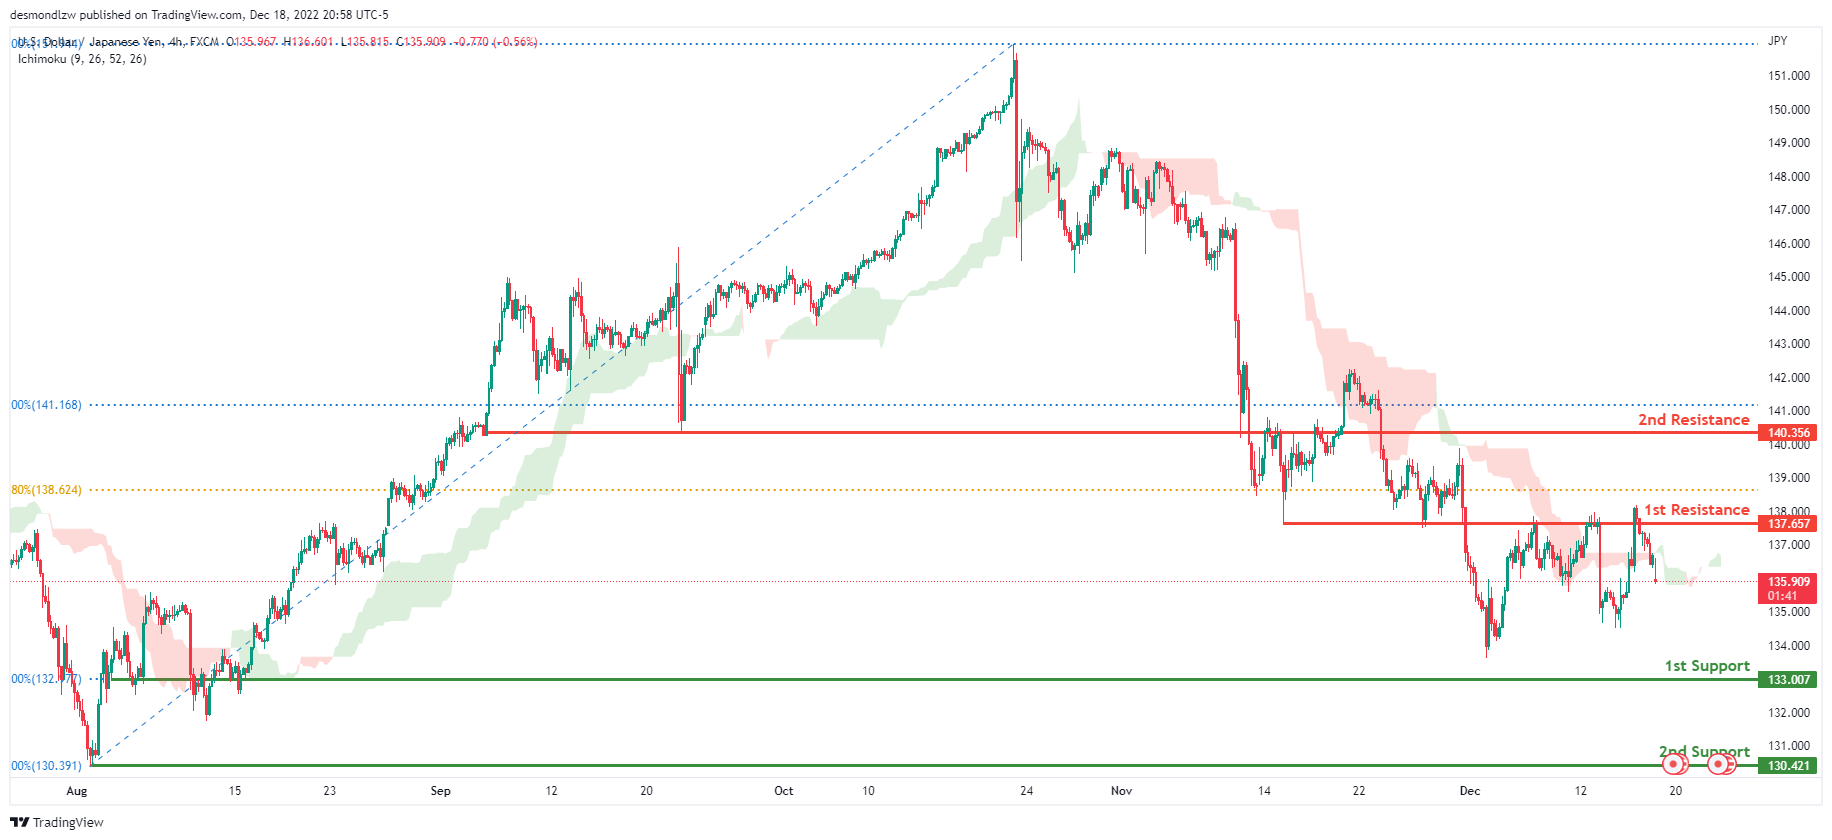
The current general bias for USDJPY on the H4 chart is bullish. To add confluence to this, the price is above the Ichimoku cloud which indicates a bullish market. If the bullish momentum continues, expect USDJPY to break the 1st resistance line at 137.657, where the 61.8% Fibonacci line and previous low are located before heading towards the 2nd resistance at 140.356, where the 50% Fibonacci line and previous swing low are. In an alternative scenario, price could head back down towards the 1st support at 133.007 where the 88% Fibonacci line is.
Areas of consideration:
- H4 time frame, 1st resistance at 137.657
- H4 time frame, 2nd resistance at 140.356
- H4 time frame, 1st support at 133.007
DXY:
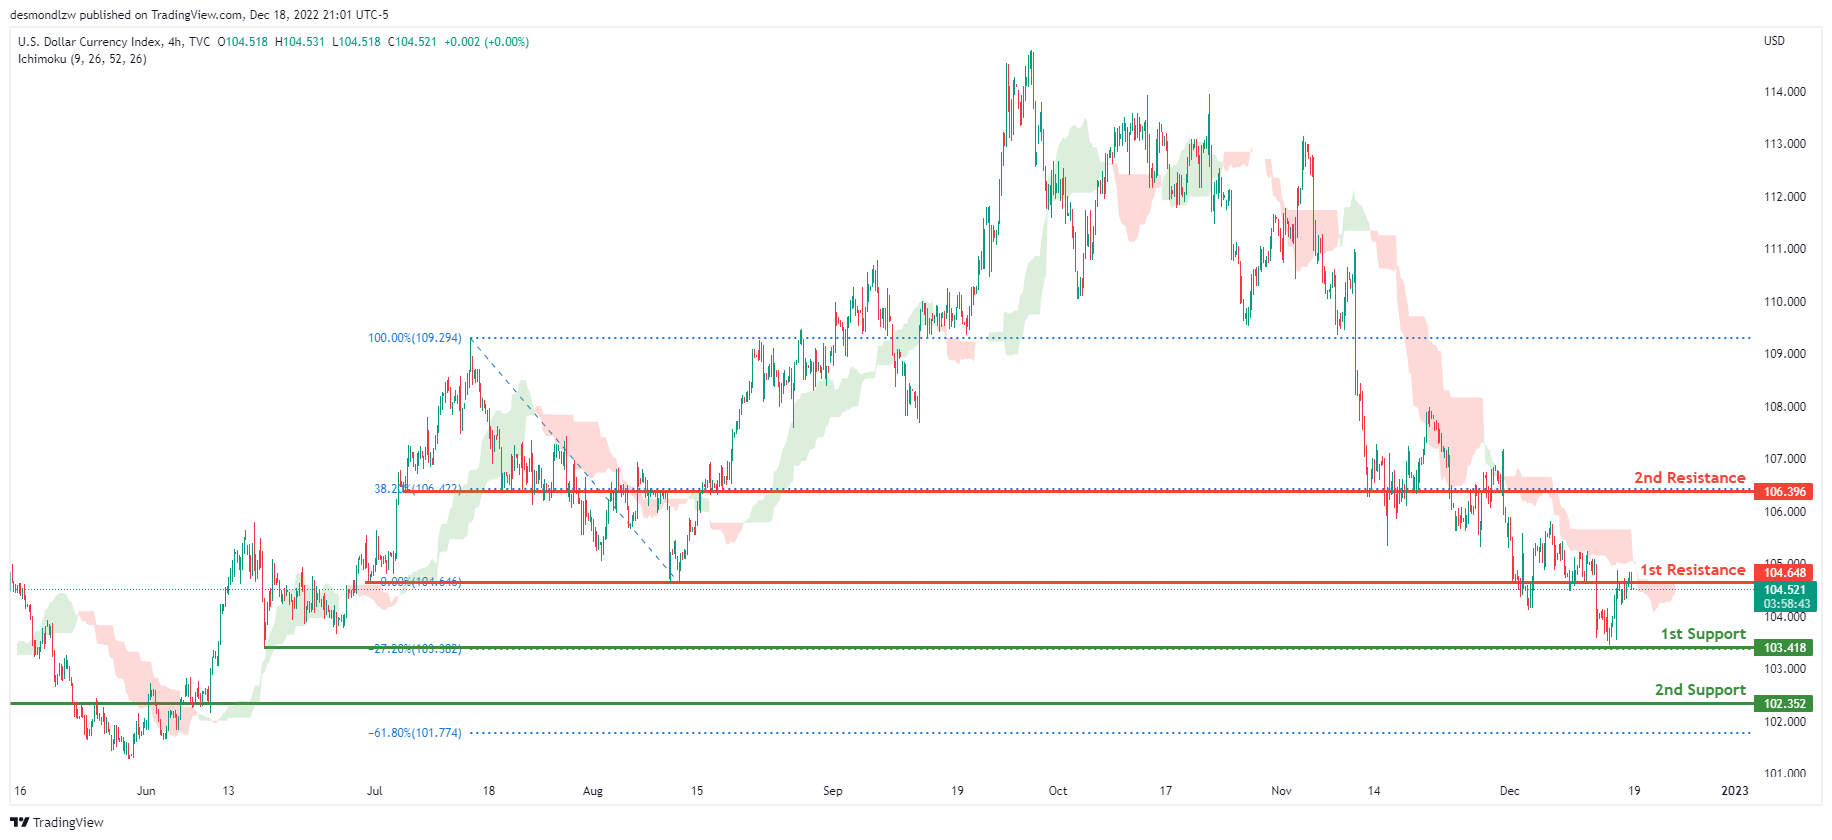
On the H4 chart, the overall bias for DXY is bearish. To add confluence to this, the price is below the Ichimoku cloud which indicates a bearish market. If this bearish momentum continues, expect the price to possibly break the 1st support line at 103.418, where the -27.2% Fibonacci expansion line is before heading towards the 2nd support at 102.352, where the -61.8% Fibonacci expansion line is. In an alternative scenario, price could head back up and retest the 1st resistance line resistance at 104.648, where the previous swing low is.
Areas of consideration:
- H4 time frame, 1st resistance at 104.648
- H4 time frame, 1st support at 103.418
- H4 time frame, 2nd support at 102.352
EUR/USD:
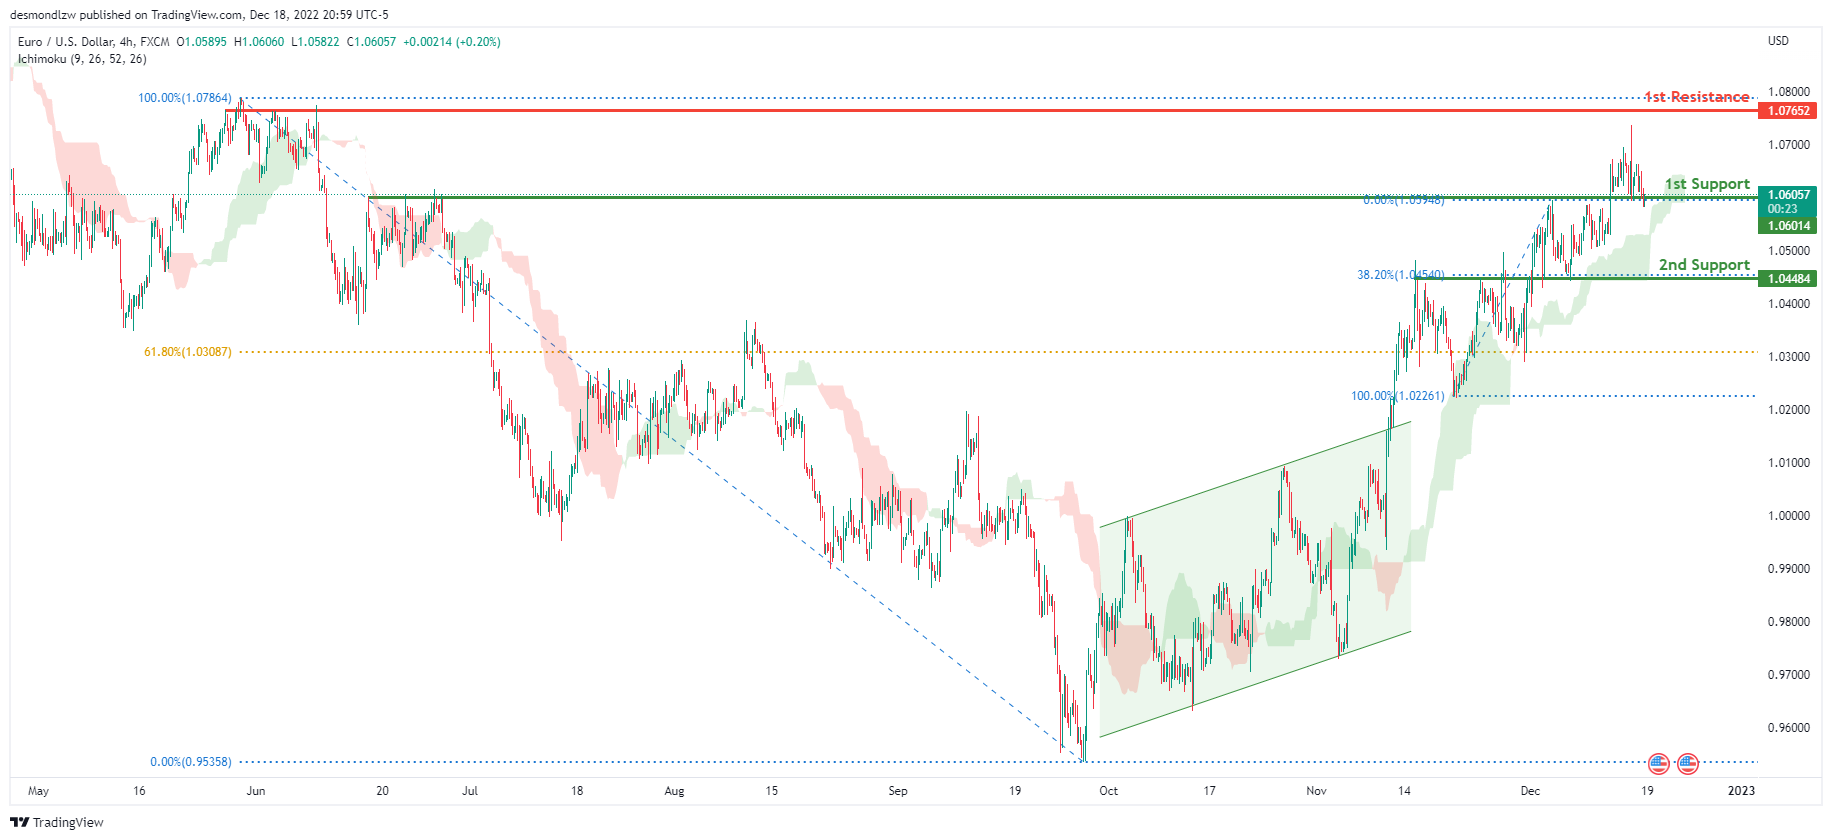
Looking at the H4 chart, my overall bias for EURUSD is bullish due to the current price being above the Ichimoku cloud, indicating a bullish market. To add confluence to this bias, price has also broken above the ascending bullish channel. If this bullish momentum continues, expect the price to possibly head towards the 1st resistance at 1.07652, where the previous swing high is. In an alternate scenario, price could possibly head back down to break the 1st support level at 1.06014, where the previous swing high and 78.6% Fibonacci line are located before heading towards the 2nd support at 1.04484, where the 38.2% Fibonacci line is.
Areas of consideration :
- H4 1st resistance at 1.07652
- H4 1st support at 1.06014
- H4 2nd support at 1.04484
GBP/USD:
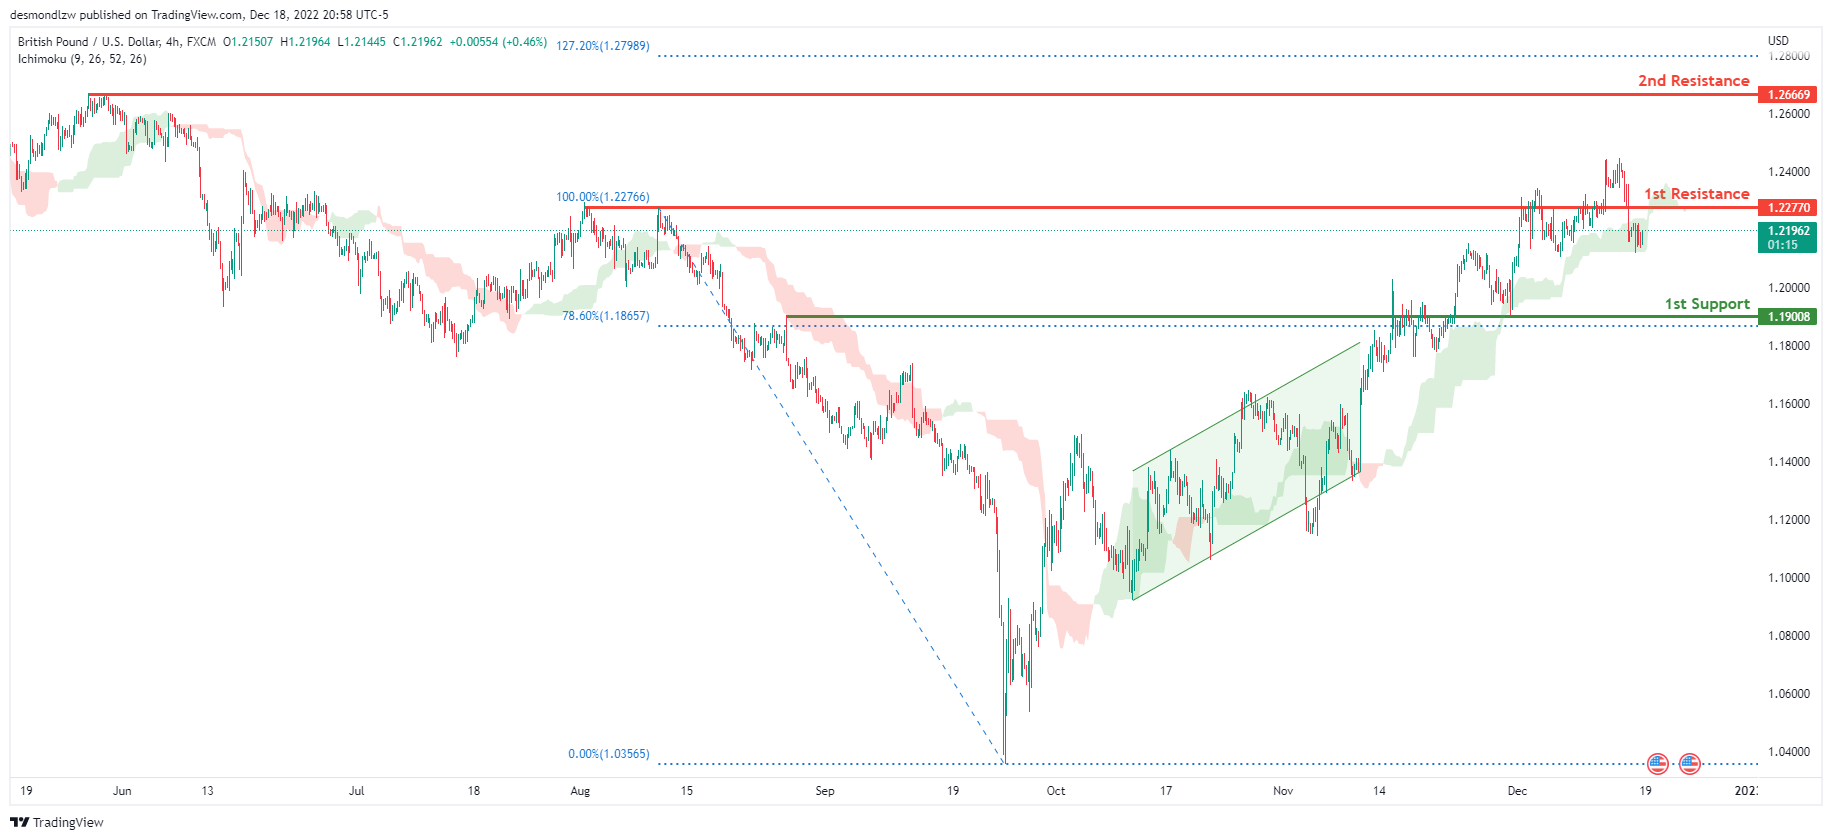
Looking at the H4 chart, my overall bias for GBPUSD is bullish due to the current price crossing above the Ichimoku cloud, indicating a bullish market. Expecting price to head back up to possibly continue heading towards the 1st resistance at 1.22770, where the previous swing high is. In an alternative scenario, price could possibly head back down to retest the 1st support at 1.19008, where the 78.6% Fibonacci line is.
Areas of consideration:
- H4 1st resistance at 1.22770
- H4 1st support at 1.19008
USD/CHF:
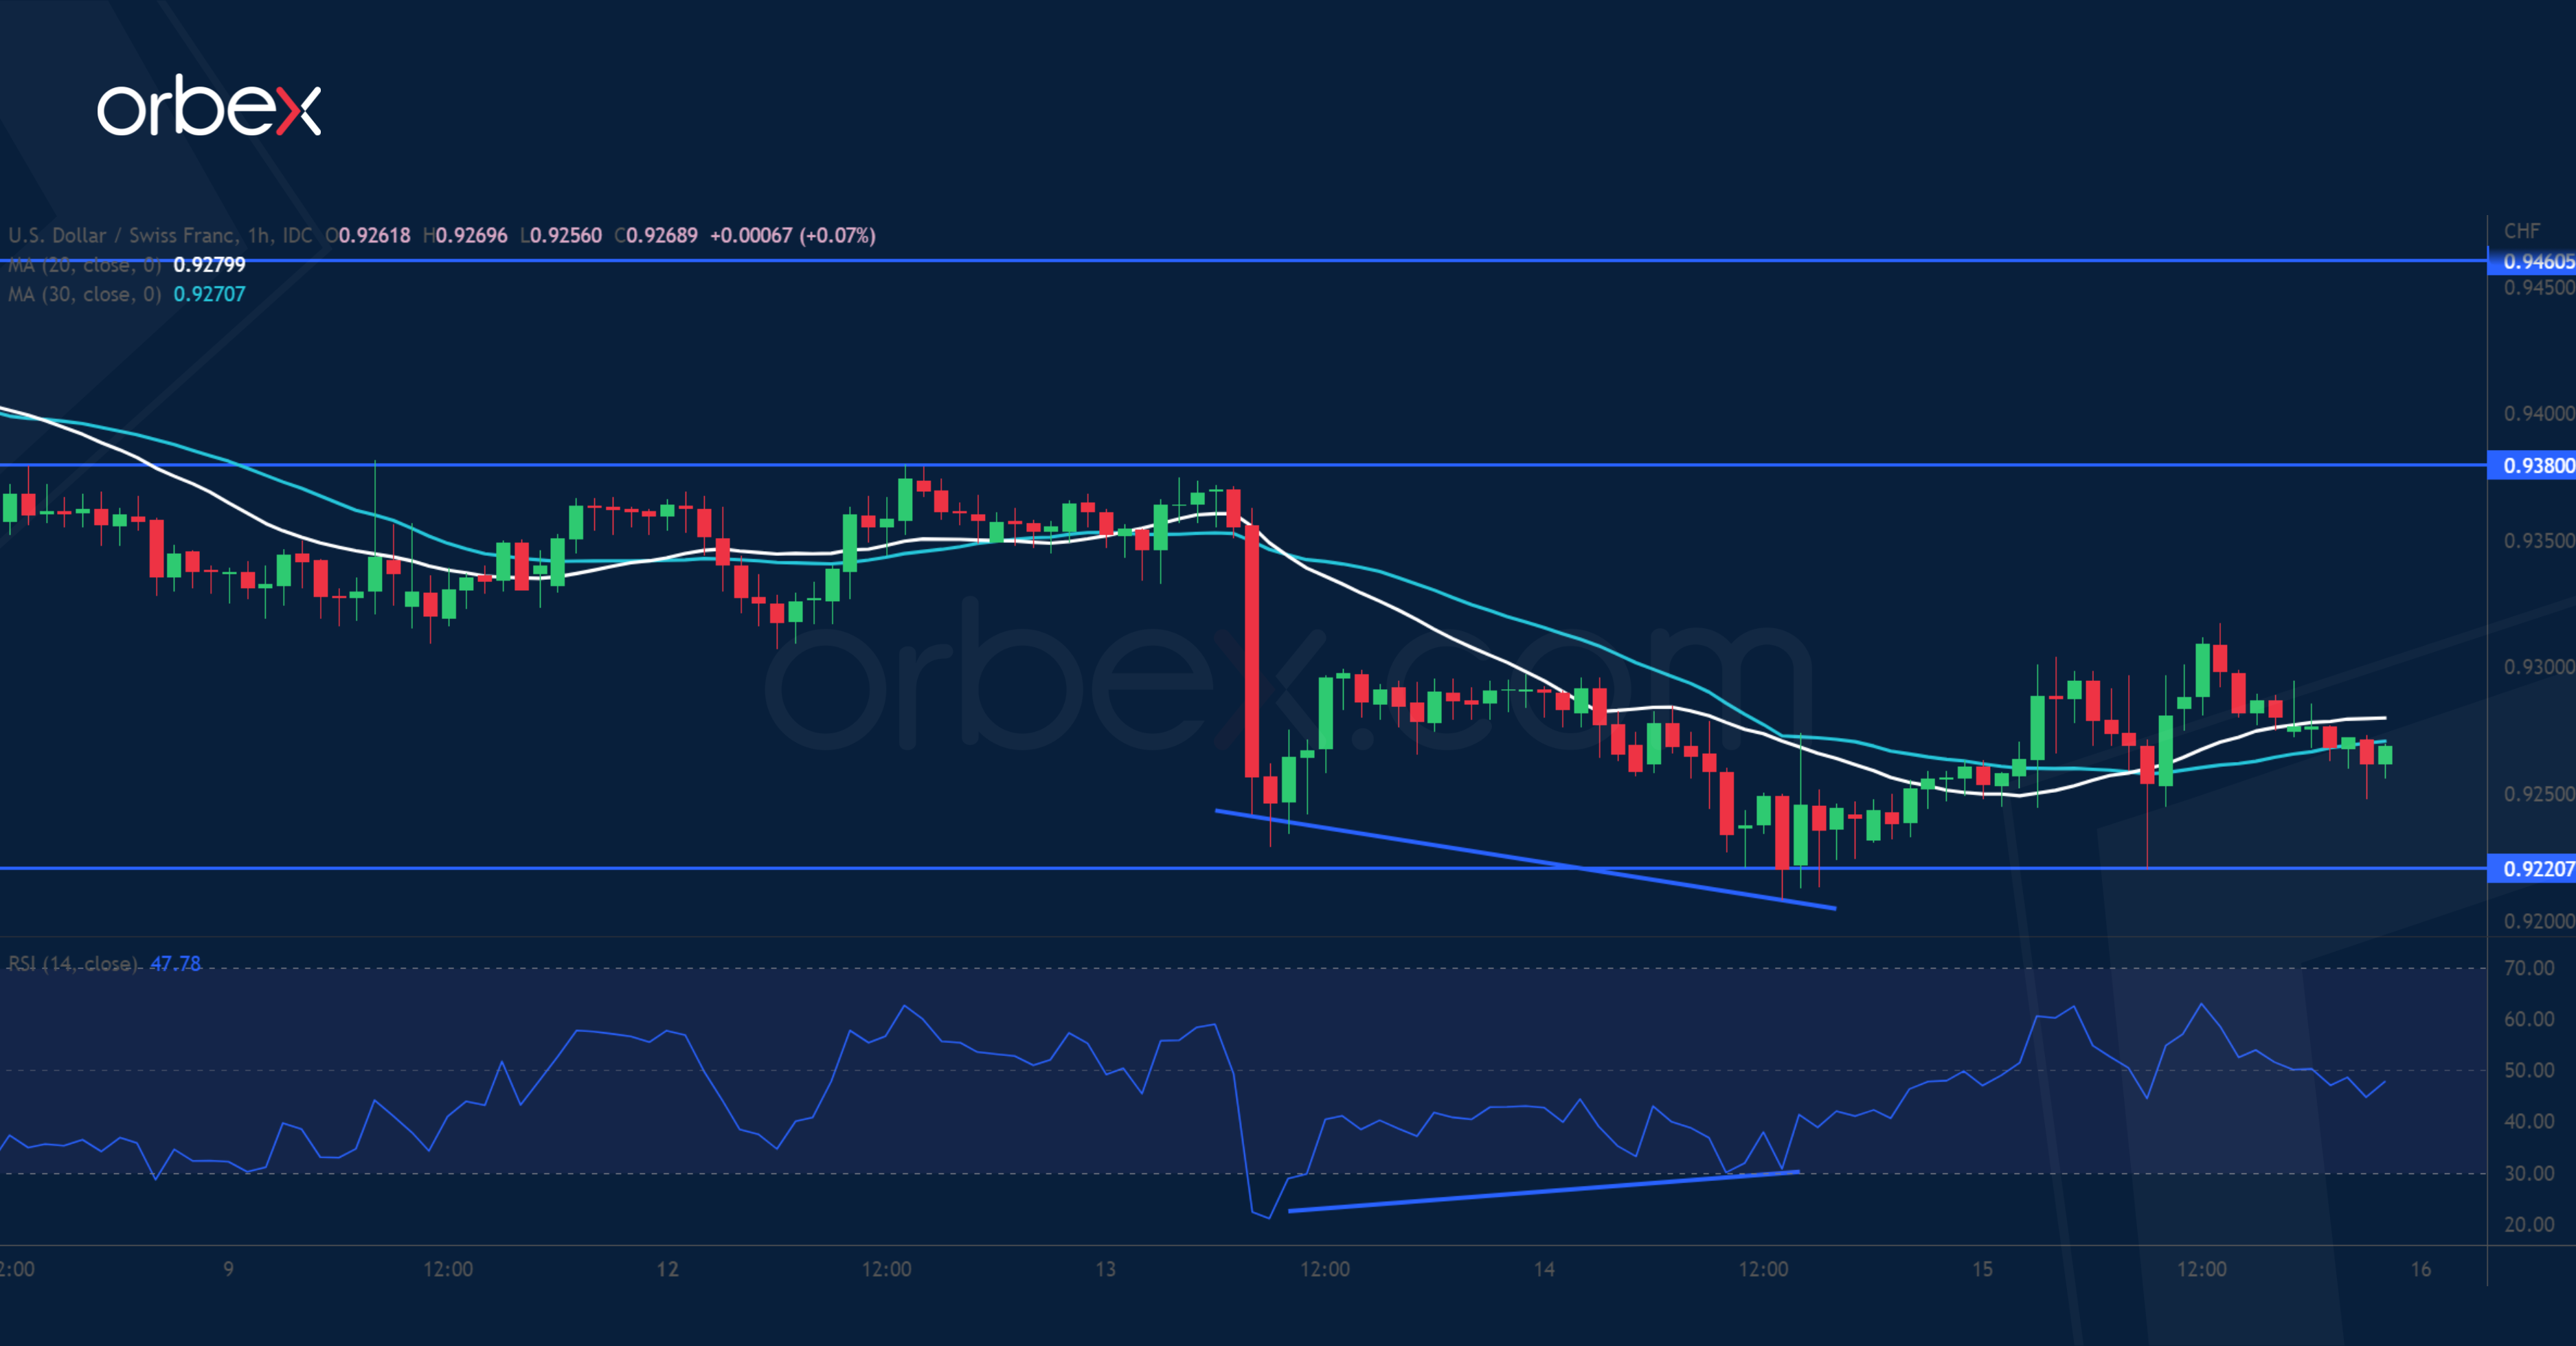
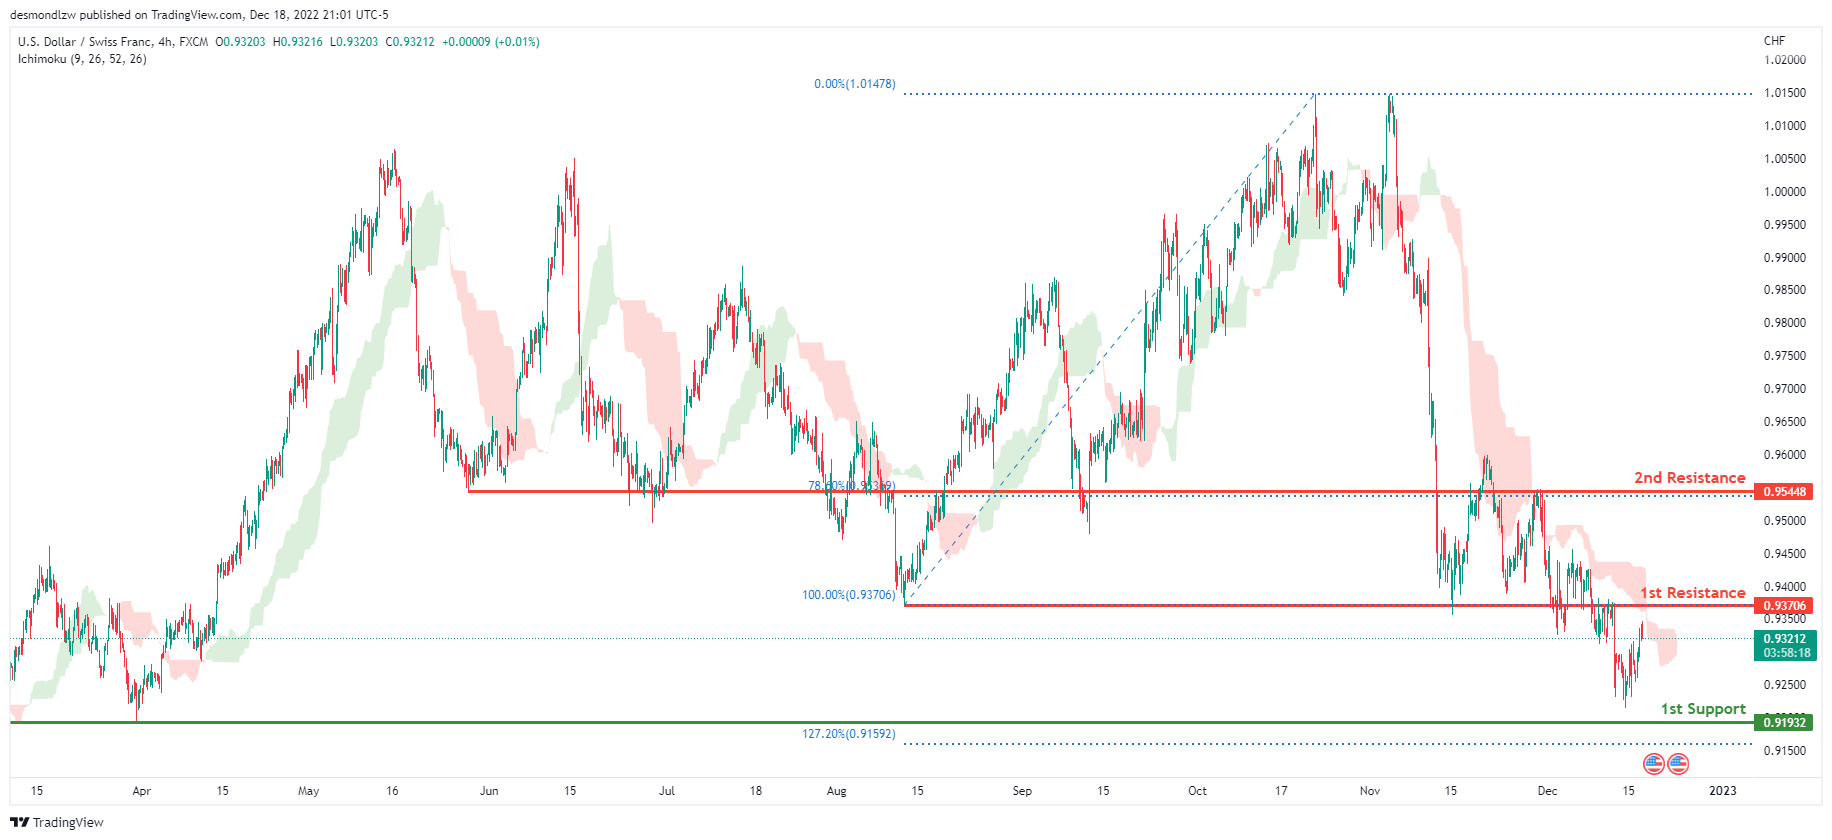
The overall bias for USDCHF on the H4 chart is bearish. In addition, the price is below the Ichimoku cloud, indicating a bearish market. If the current bearish trend continues, expect the price to head back down towards the 1st support line at 0.91932, where the previous swing low and 12.72% Fibonacci extension line is . In an alternative scenario, price could possibly head up towards the 1st resistance at 0.93706, where the previous swing low is .
Areas of consideration
- H4 1st support at 0.91932
- H4 1st resistance at 0.93706
XAU/USD (GOLD):
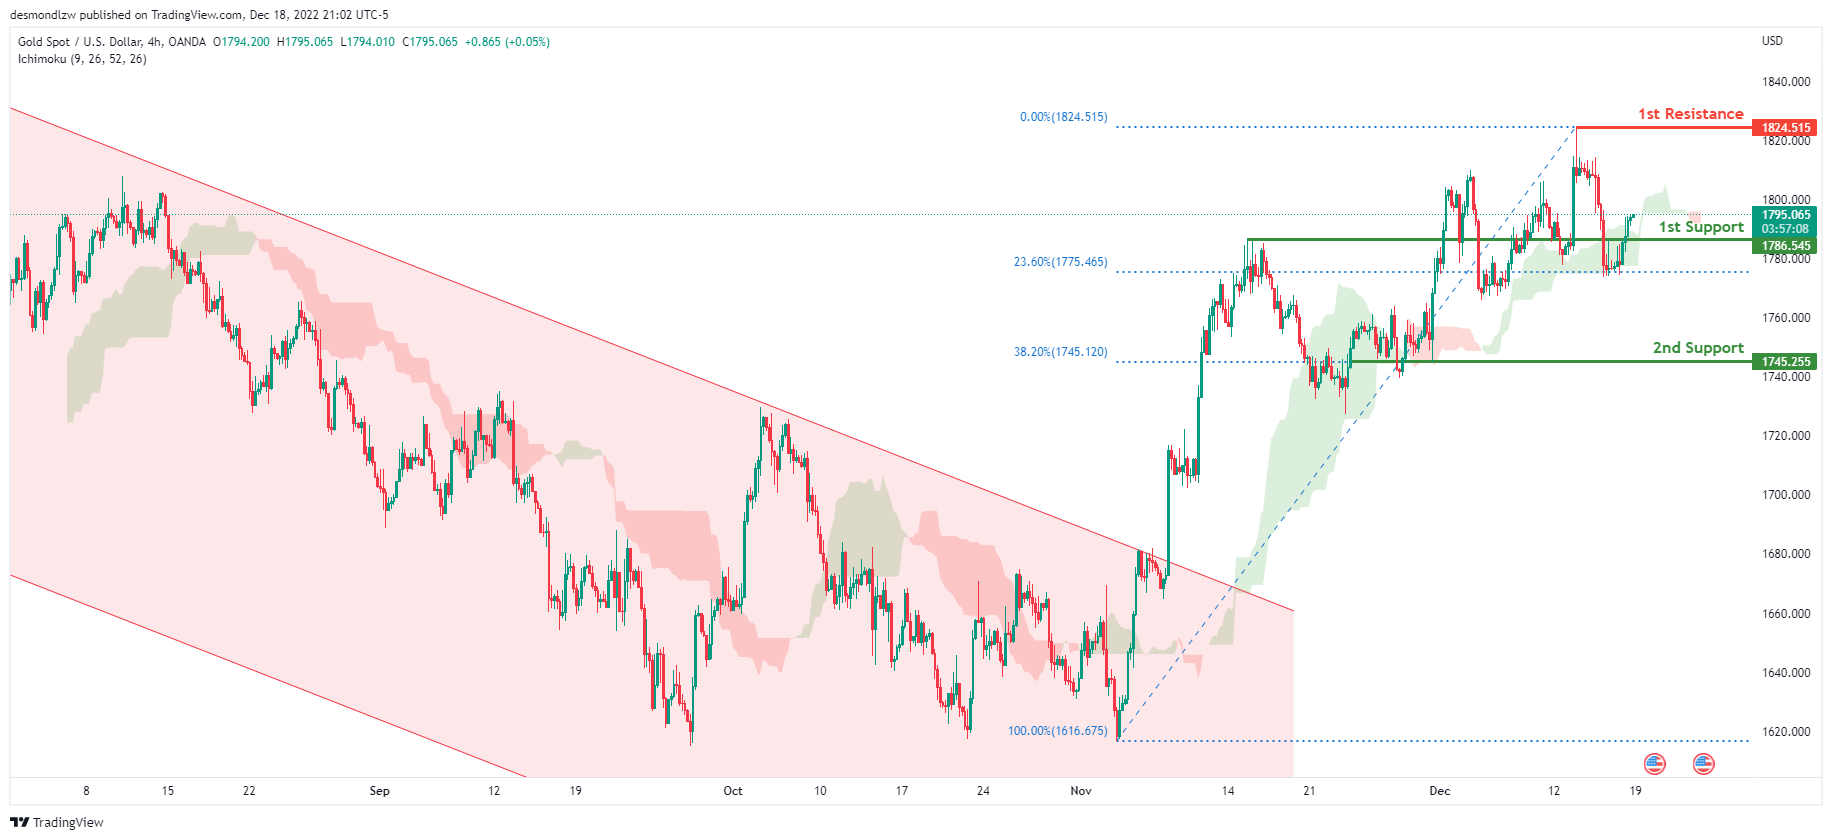
Looking at the H4 chart, my overall bias for XAUUSD is bullish due to the current price being above the Ichimoku cloud, indicating a bullish market. If this bullish momentum continues, expect the price to continue heading towards the 1st resistance at 1824.515 where the recent high is. In an alternative scenario, price could possibly head back down to retest the 1st support at 1786.545, where the previous high is.
Areas of consideration:
- H4 time frame, 1st resistance at 1824.515
- H4 time frame, 1st support at 1786.545
AUD/USD:
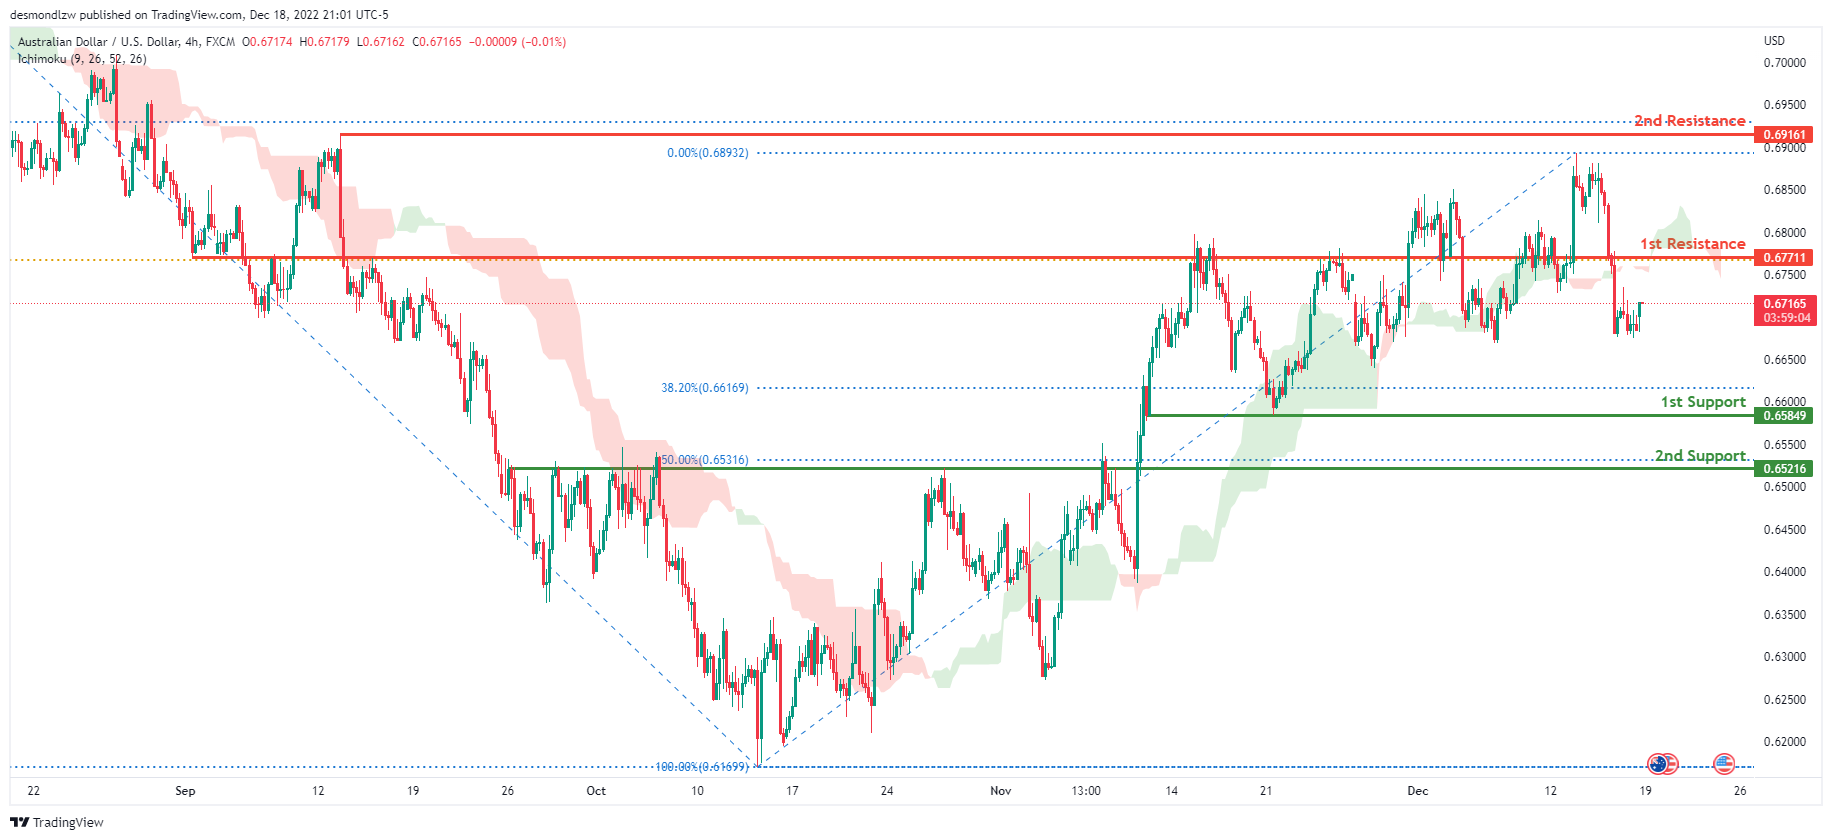
Looking at the H4 chart, my overall bias for AUDUSD is bearish due to the current price being below the Ichimoku cloud, indicating a bearish market. If this bearish momentum continues, expect the price to continue heading towards the 1st support at 0.65849, where the 78.6% Fibonacci line is. In an alternative scenario, price could possibly head back up towards the 1st resistance at 0.67711, where the 61.8% Fibonacci line is
Areas of consideration
- H4, 1st resistance at 0.67711
- H4, 1st support at 0.65849
NZD/USD:
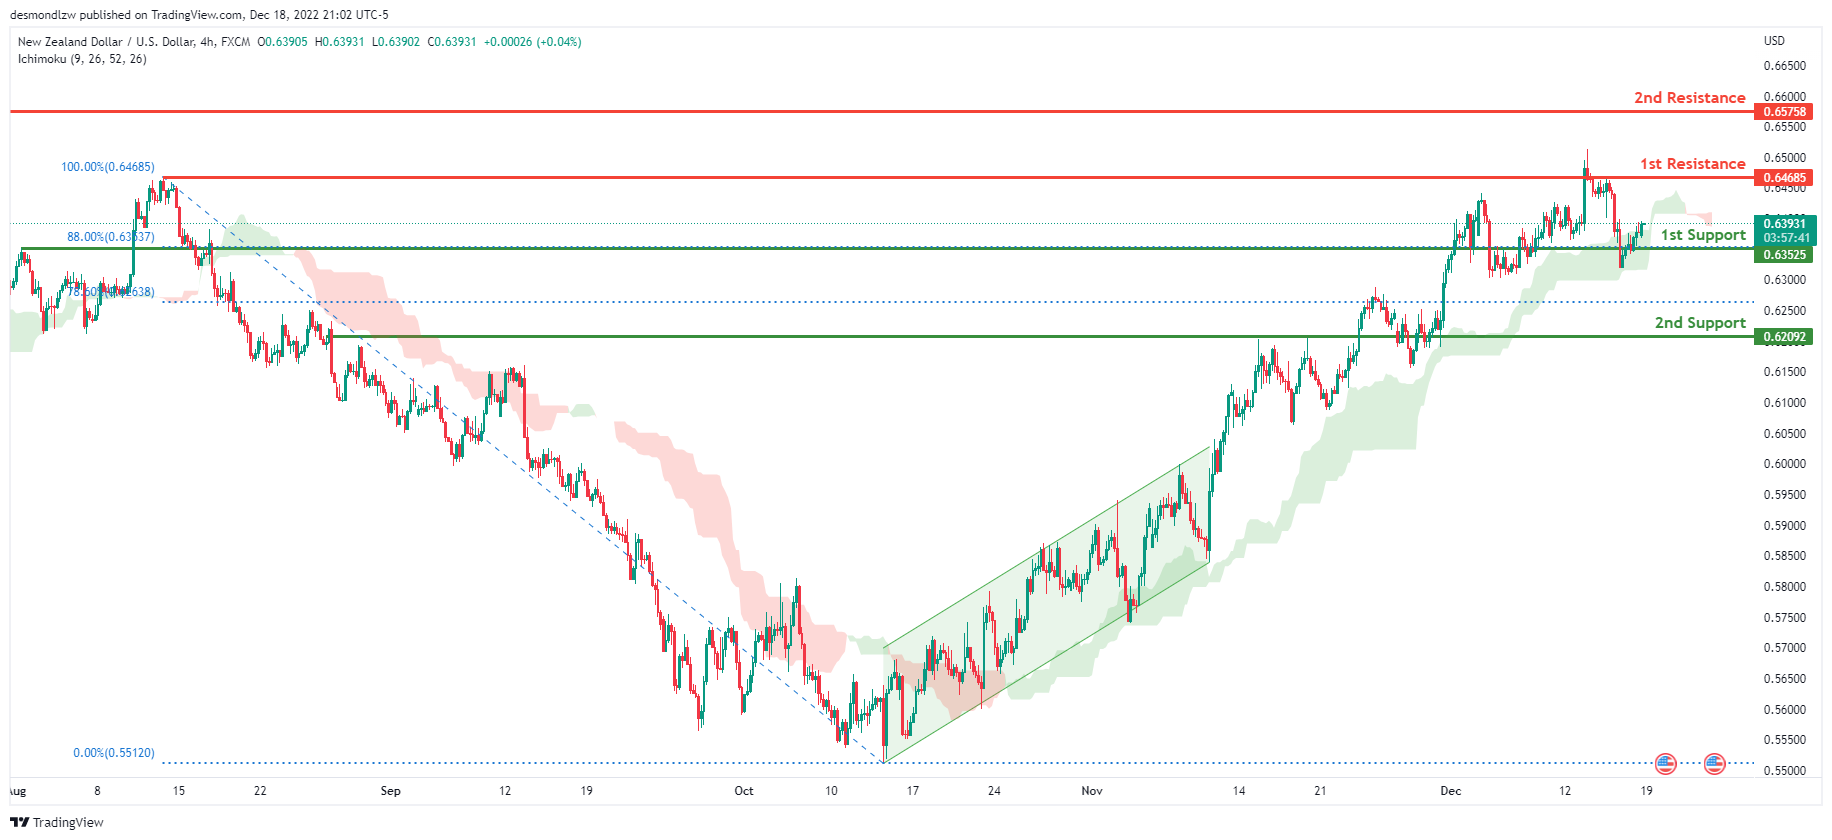
Looking at the H4 chart, my overall bias for NZDUSD is bullish due to the current price being above the Ichimoku cloud, indicating a bullish market.
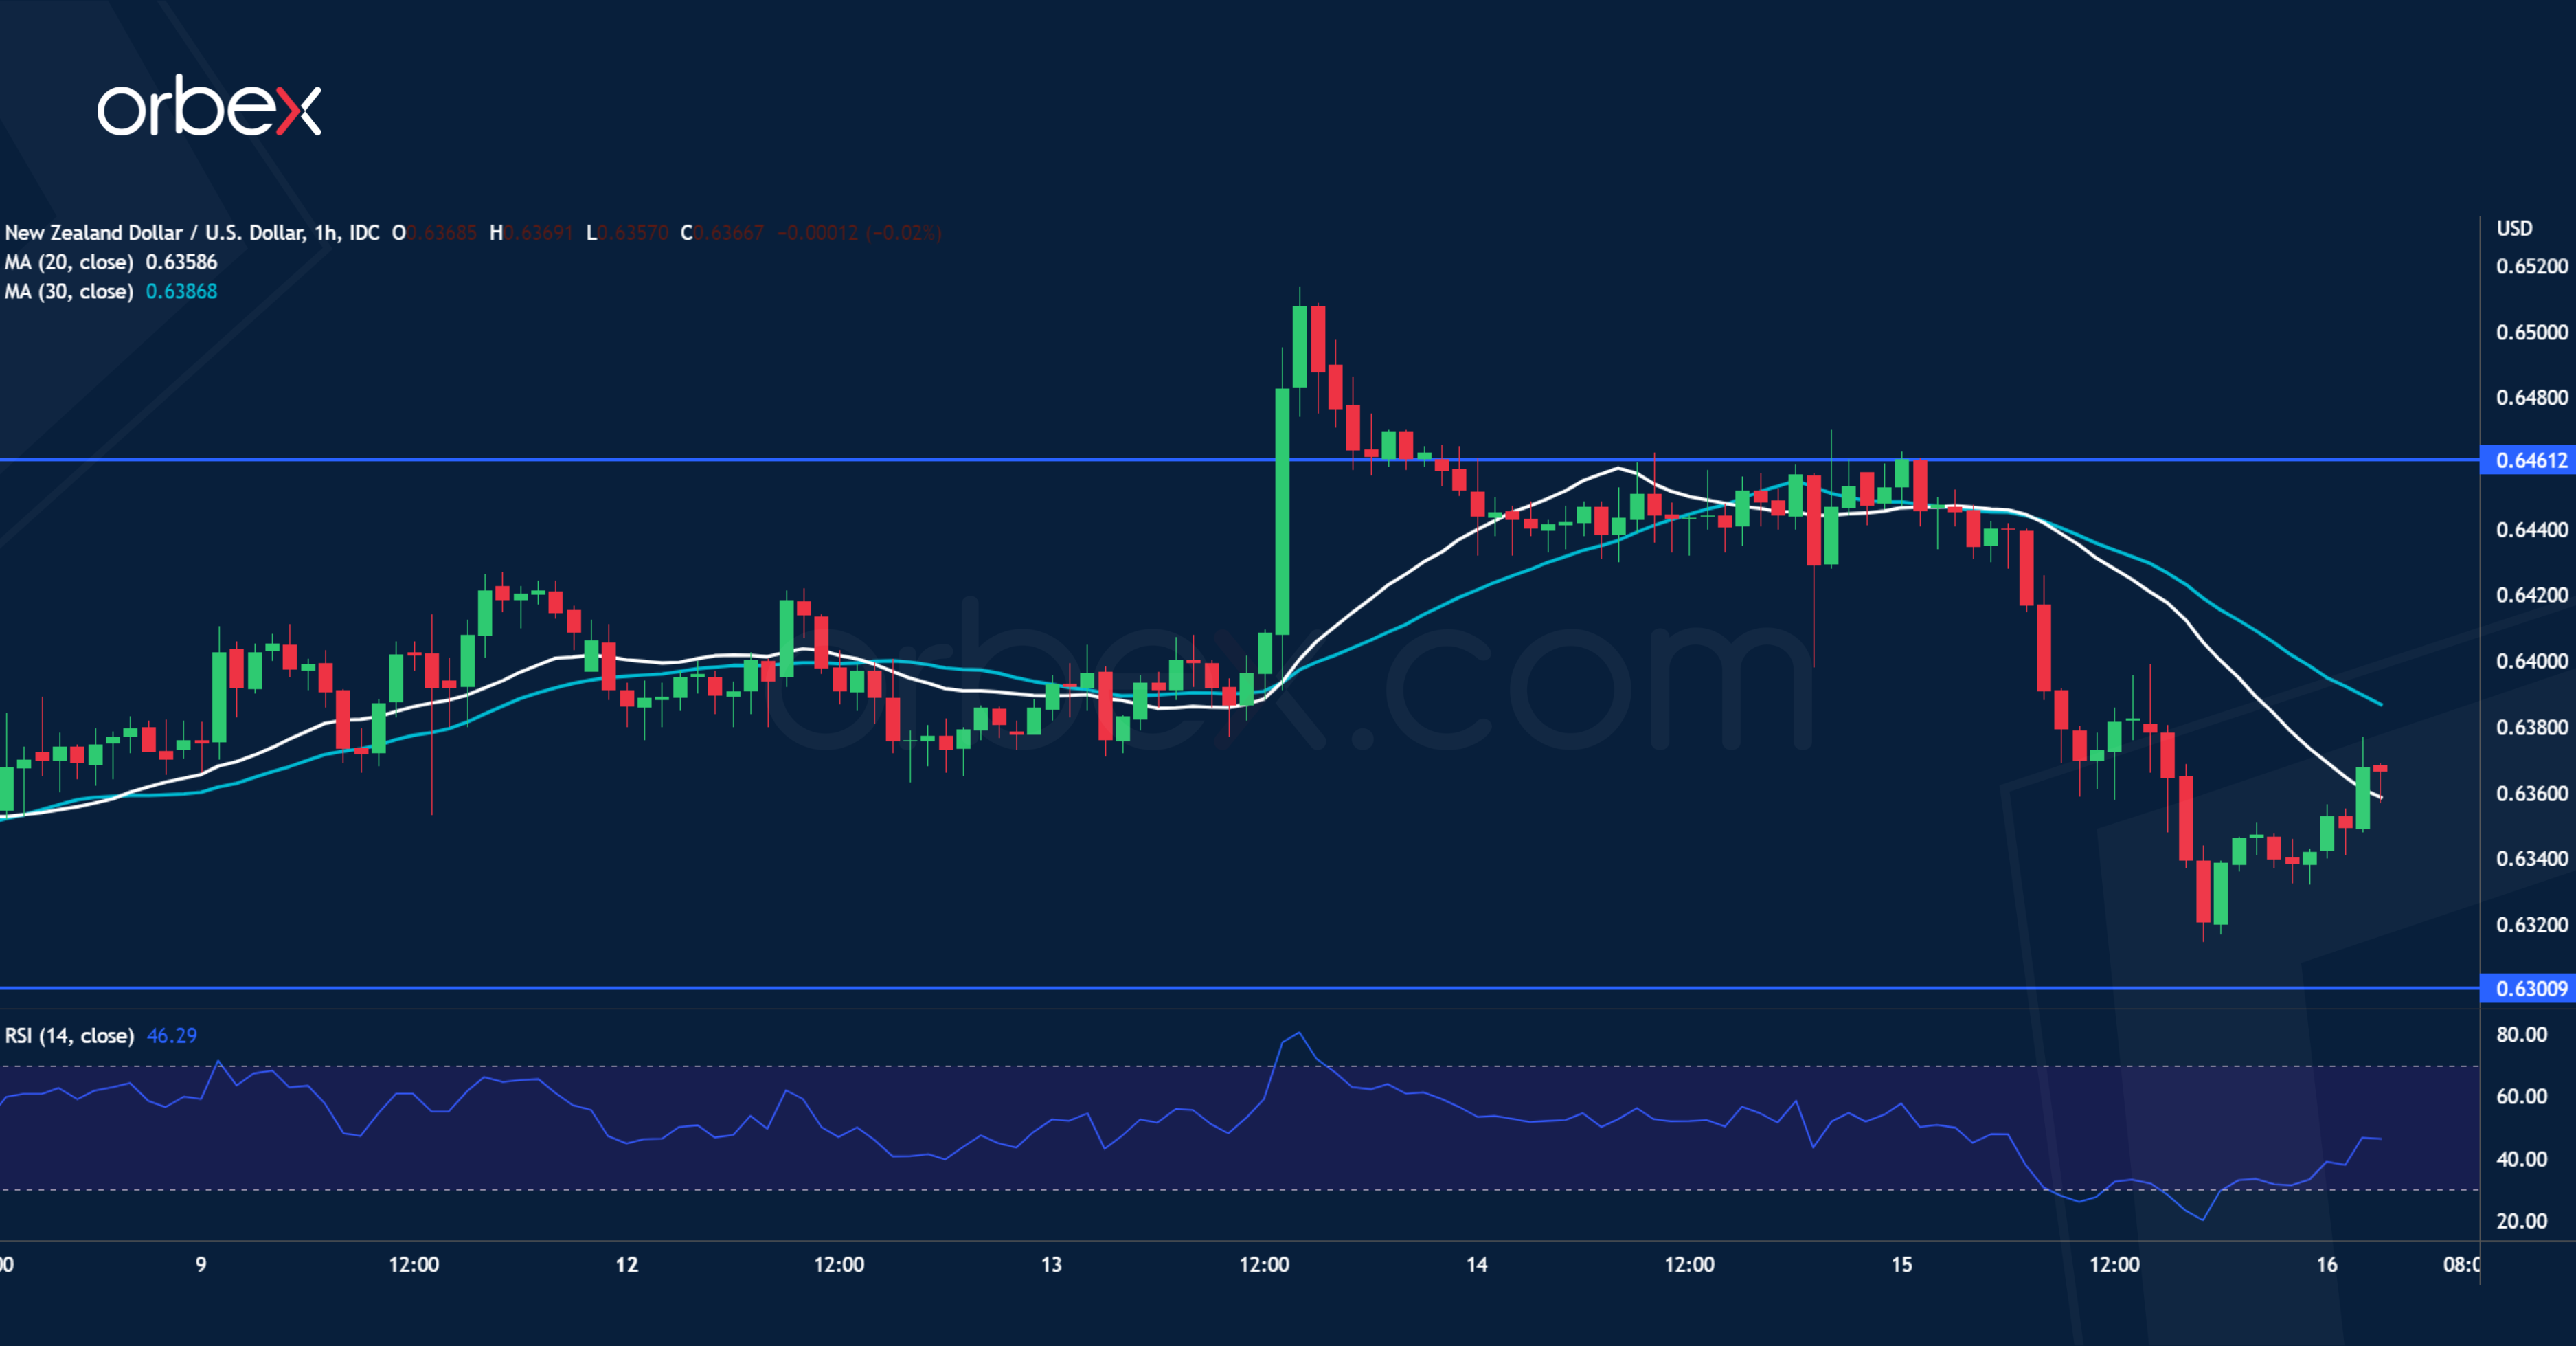
To add confluence to this bias, price has broken out of the ascending channel. If this bullish momentum continues, expect the price to possibly break the 1st resistance line at 0.64685, where the previous swing high is before heading towards the 2nd resistance at 0.65758, where the previous swing high is. Alternatively, the price may head back down breaking the 1st support at 0.63525, where the 88% Fibonacci line is before heading towards the 2nd support line at 0.62092, where the 78.6% Fibonacci line is.
Areas of consideration:
- H4 time frame, 1st resistance at 0.64685
- H4 time frame, 2nd resistance at 0.65758
- H4 time frame, 1st support at 0.63525
- H4 time frame, 2nd support at 0.62092
USD/CAD:
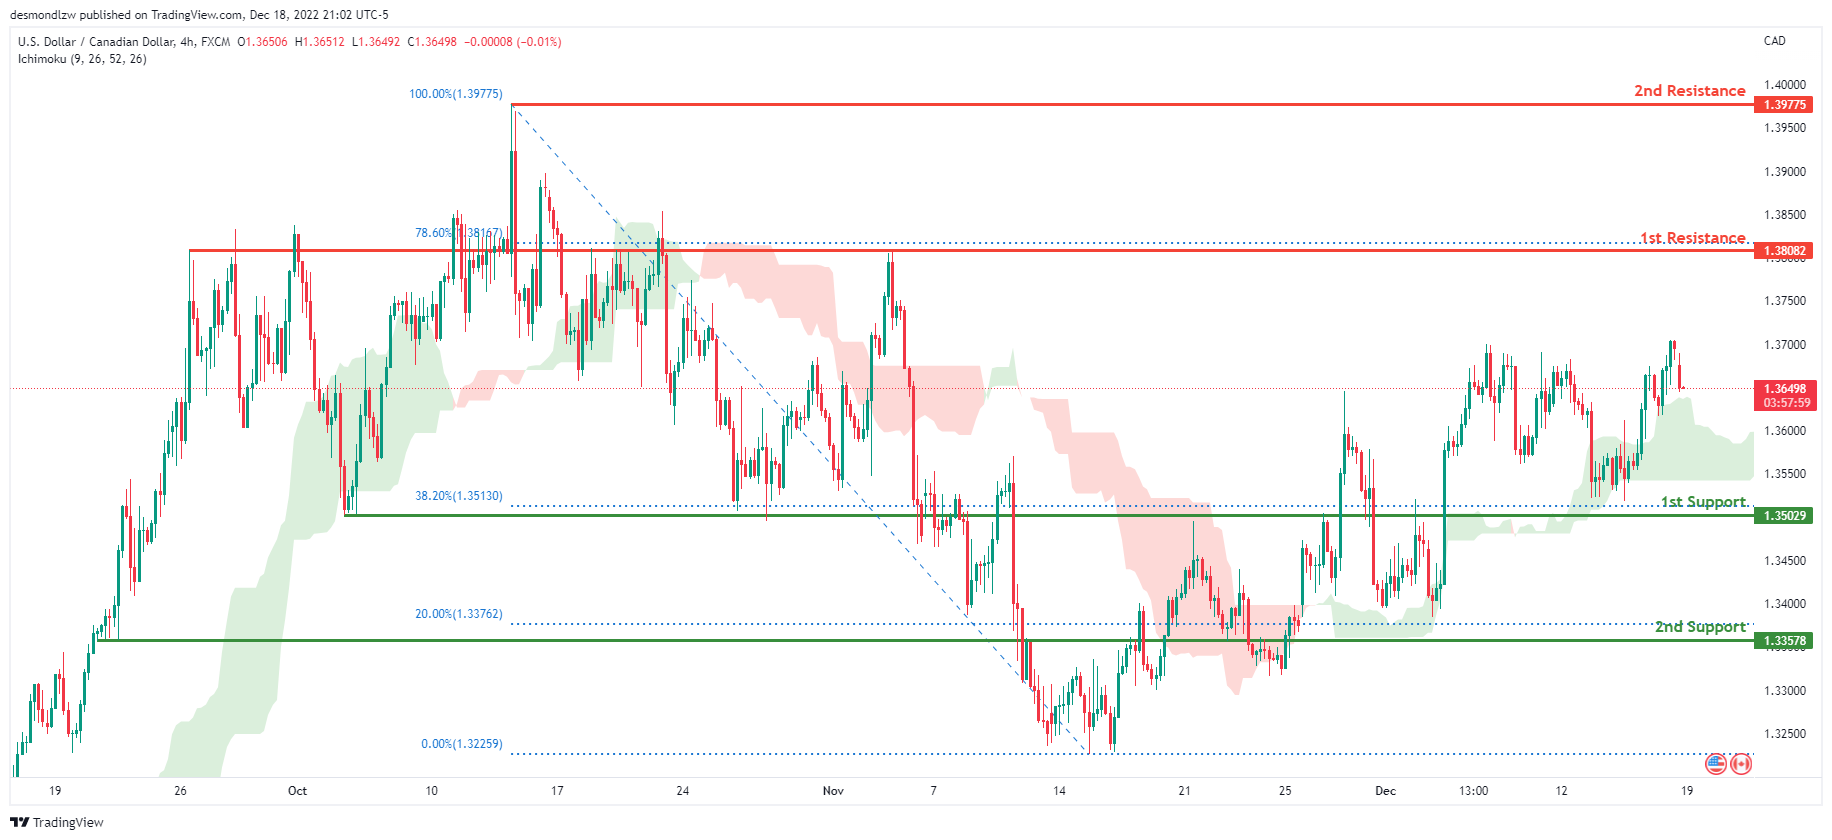
On the H4 chart, the overall bias for USDCAD is bullish. To add confluence to this, the price is crossing above the Ichimoku cloud which indicates a bullish market. If this bullish momentum continues, expect the price to head towards 1st resistance line at 1.38082, where the 78.6% Fibonacci line is. In an alternative scenario, price could head back down to retest the 1st support at 1.35029, where the 38.2% Fibonacci line is.
Areas of consideration:
- H4 time frame, 1st resistance at 1.38082
- H4 time frame, 2nd resistance at 1.39775
- H4 time frame, 1st support at 1.35029
OIL:
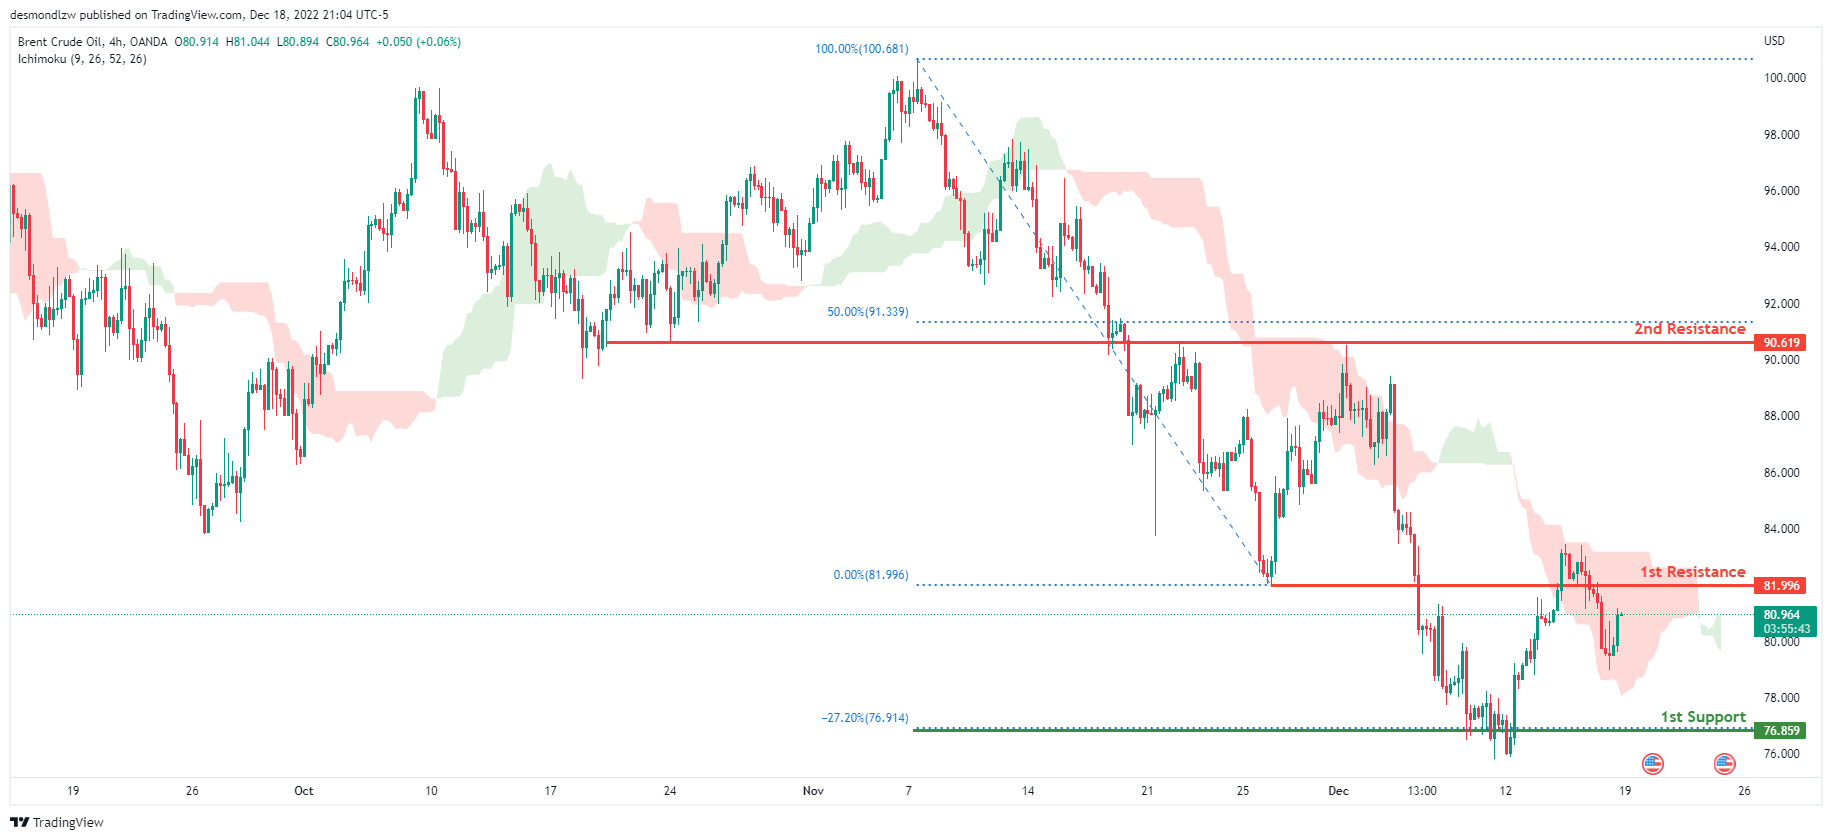
Looking at the H4 chart, my overall bias for BCOUSD is bearish due to the current price crossing below the Ichimoku cloud, indicating a bearish market. If this bearish momentum continues, expect the price to possibly head towards the 1st support line at 76.859, where the -27.2% Fibonacci expansion line is located. In an alternate scenario, price could possibly break the 1st resistance at 81.996, where the previous low is located., before heading towards the 2nd resistance at 90.619, where the 50% Fibonacci line is.
Areas of consideration:
- H4 time frame, 1st resistance at 81.996
- H4 time frame, 2nd resistance at 90.619
- H4 time frame, 1st support at 76.859
Dow Jones Industrial Average:
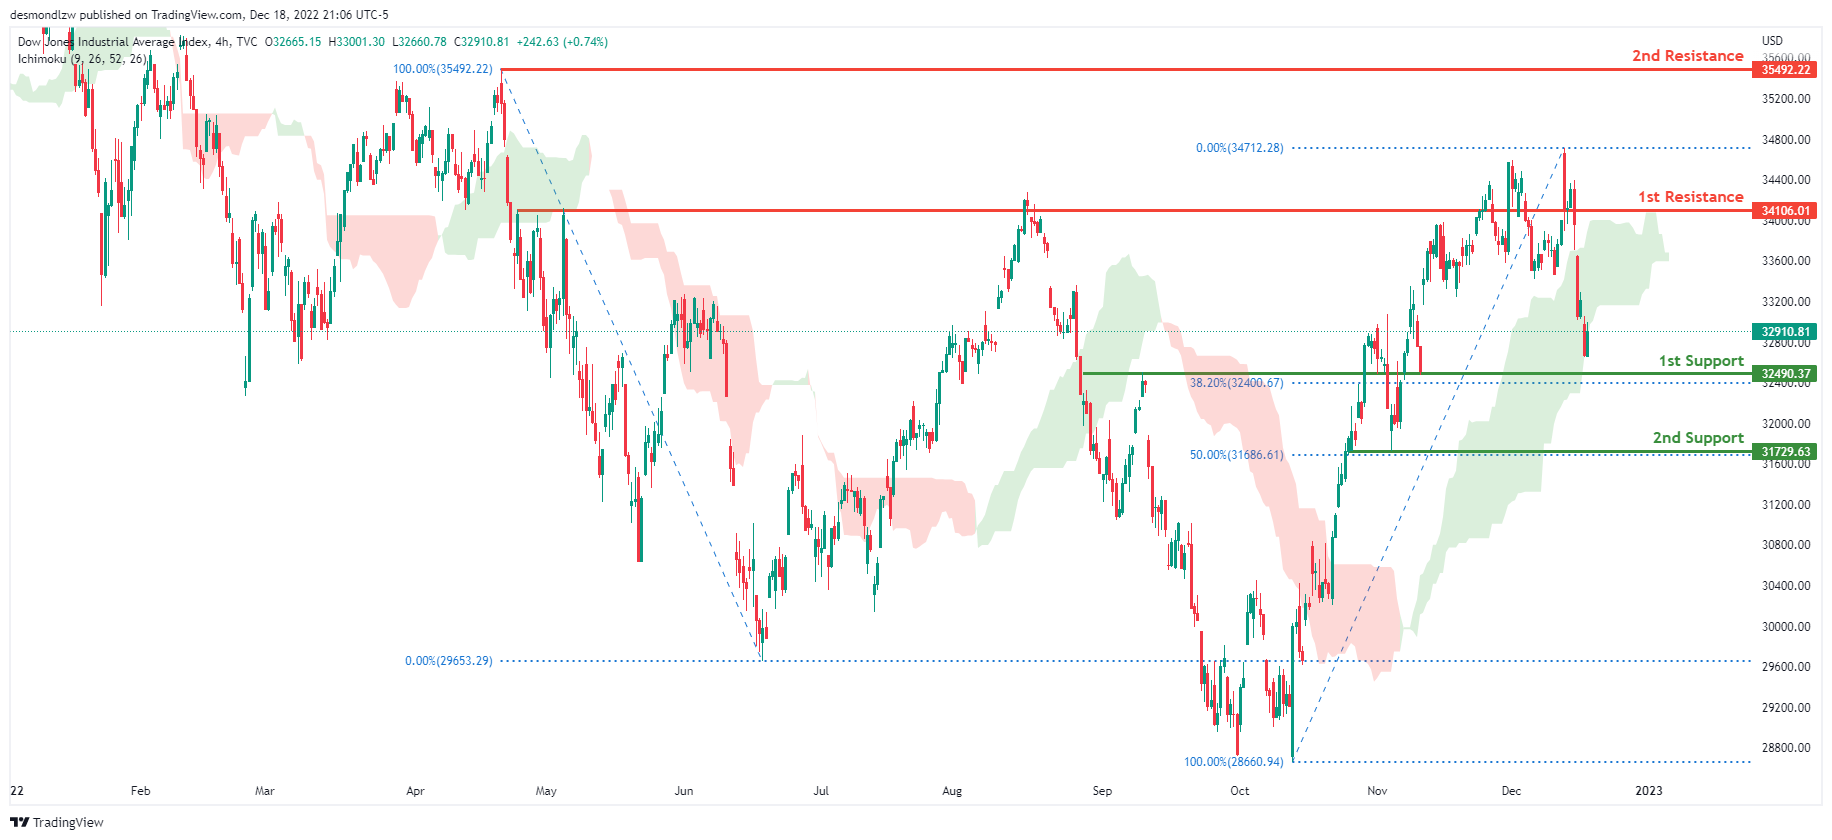
On the H4 chart, the overall bias for DJI is bearish . To add confluence to this, the price is crossing below the Ichimoku cloud which indicates a bearish market. If this bearish momentum continues, expect the price to head back down towards the 1st support at 32490.37, where the 61.8% Fibonacci line is. In an alternative scenario, price could possibly break the 1st resistance line at 34106.01, where the previous swing high is before heading towards the 2nd resistance line at 35492.22, where the previous swing high is.
Areas of consideration:
- H4 time frame, 1st support at 32490.37
- H4 time frame, 1st Resistance at 34106.01
- H4 time frame, 2nd Resistance at 35492.22
DAX:
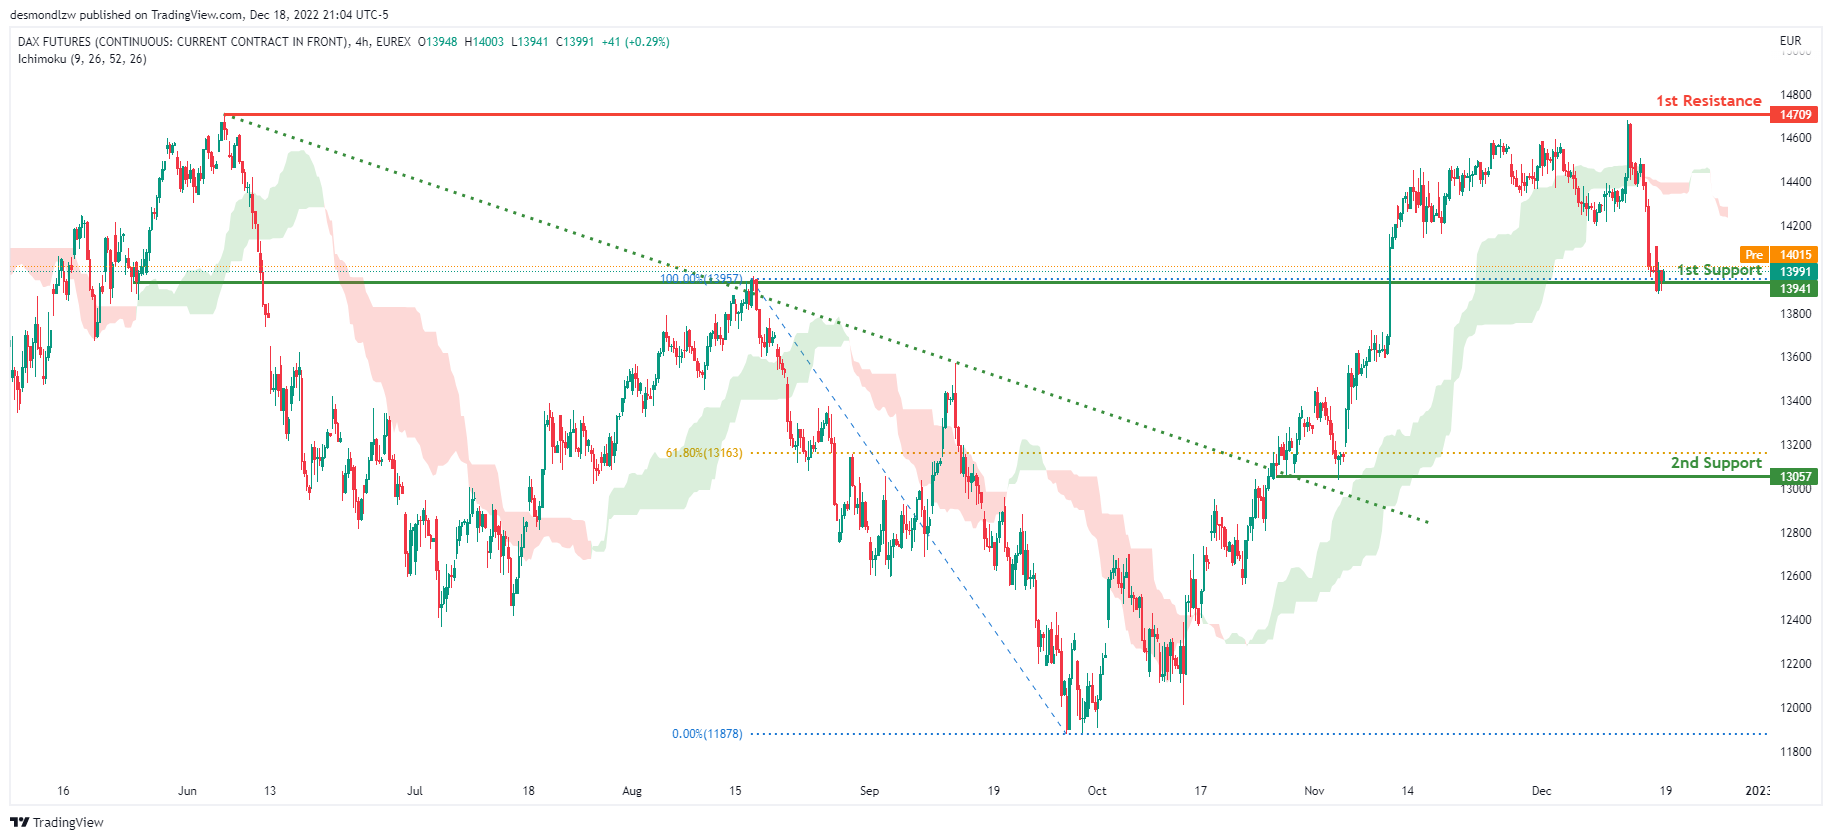
Looking at the H4 chart, my overall bias for DAX is bearish due to the current price being below the Ichimoku cloud, indicating a bearish market. If this bearish momentum continues, expect price to break the 1st support at 13941 where the previous swing high is before heading towards the 2nd support at 13057, where the 61.8% Fibonacci line is. In an alternative scenario, price could possibly head back up to retest the 1st resistance at 14709, where the previous swing high is.
Areas of consideration:
- H4 time frame, 1st resistance is at 14709
- H4 time frame, 1st support is at 13941
- H4 time frame, 2nd support is at 13057
ETHUSD:
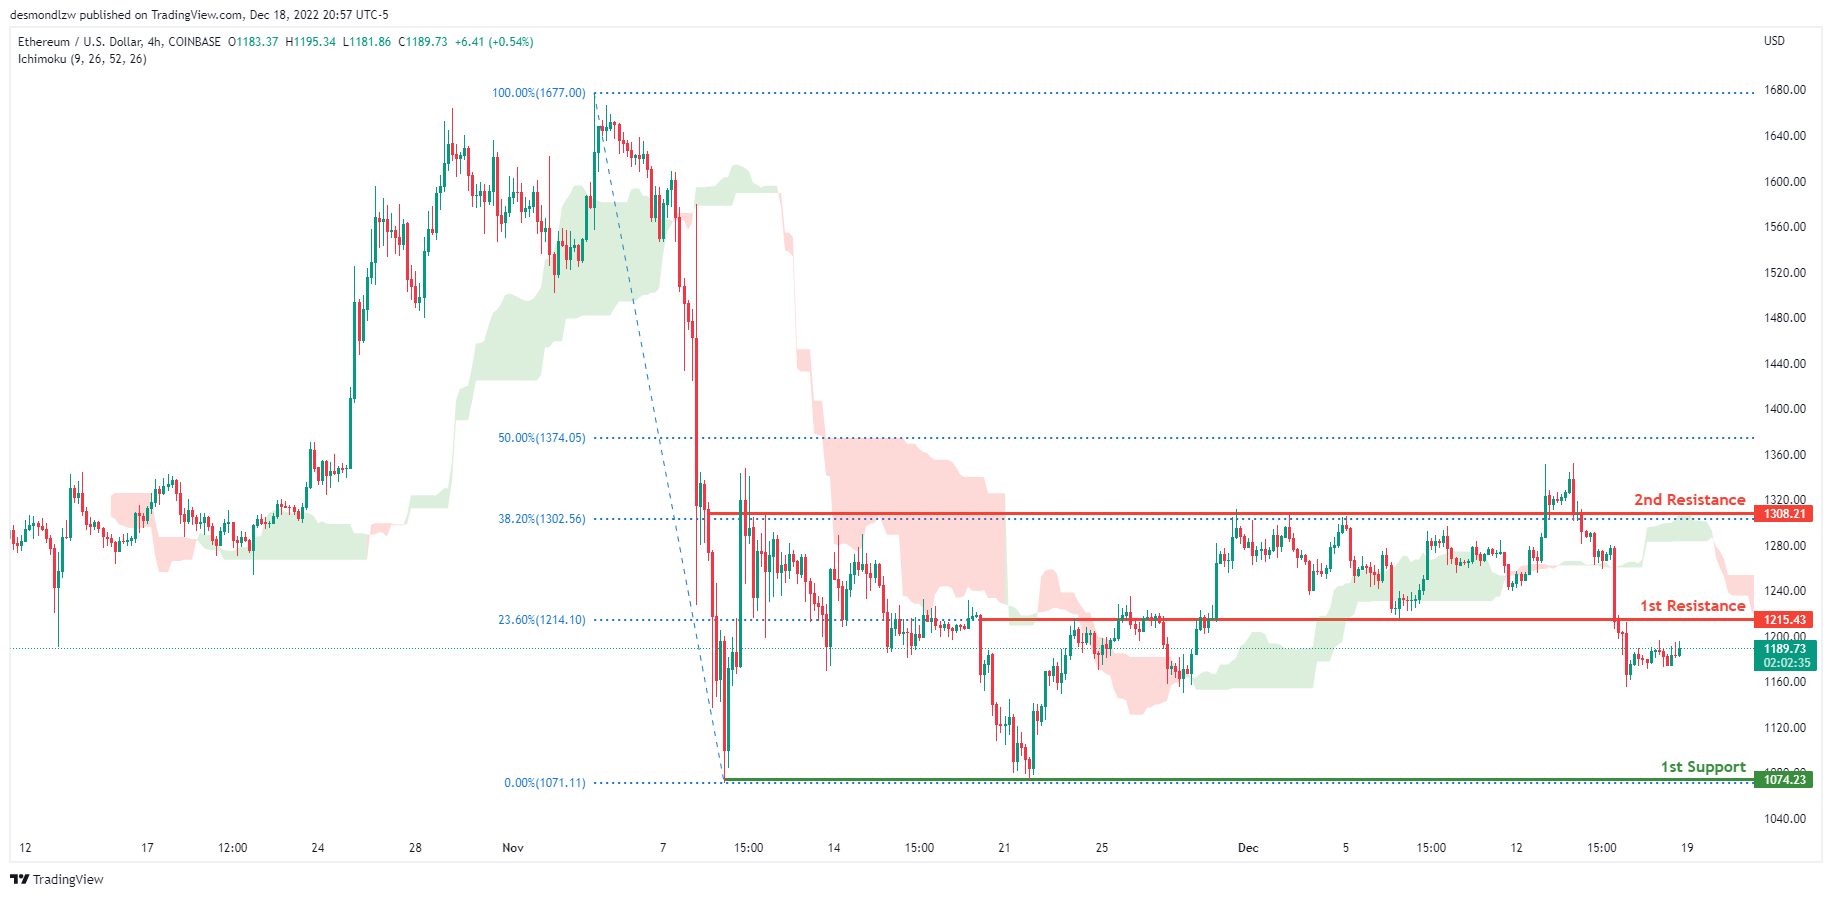
Looking at the H4 chart, my overall bias for ETHUSD is bearish due to the current price crossing below the Ichimoku cloud, indicating a bearish market. If this bearish momentum continues, expect price to head towards the 1st support at 1074.23, where the previous swing low is. In an alternative scenario, price could head back up to retest the 1st resistance at 1215.43, where the 23.6% Fibonacci line is.
Areas of consideration:
- H4 time frame, 1st resistance of 1215.43
- H4 time frame, 1st support at 1074.23
BTCUSD:
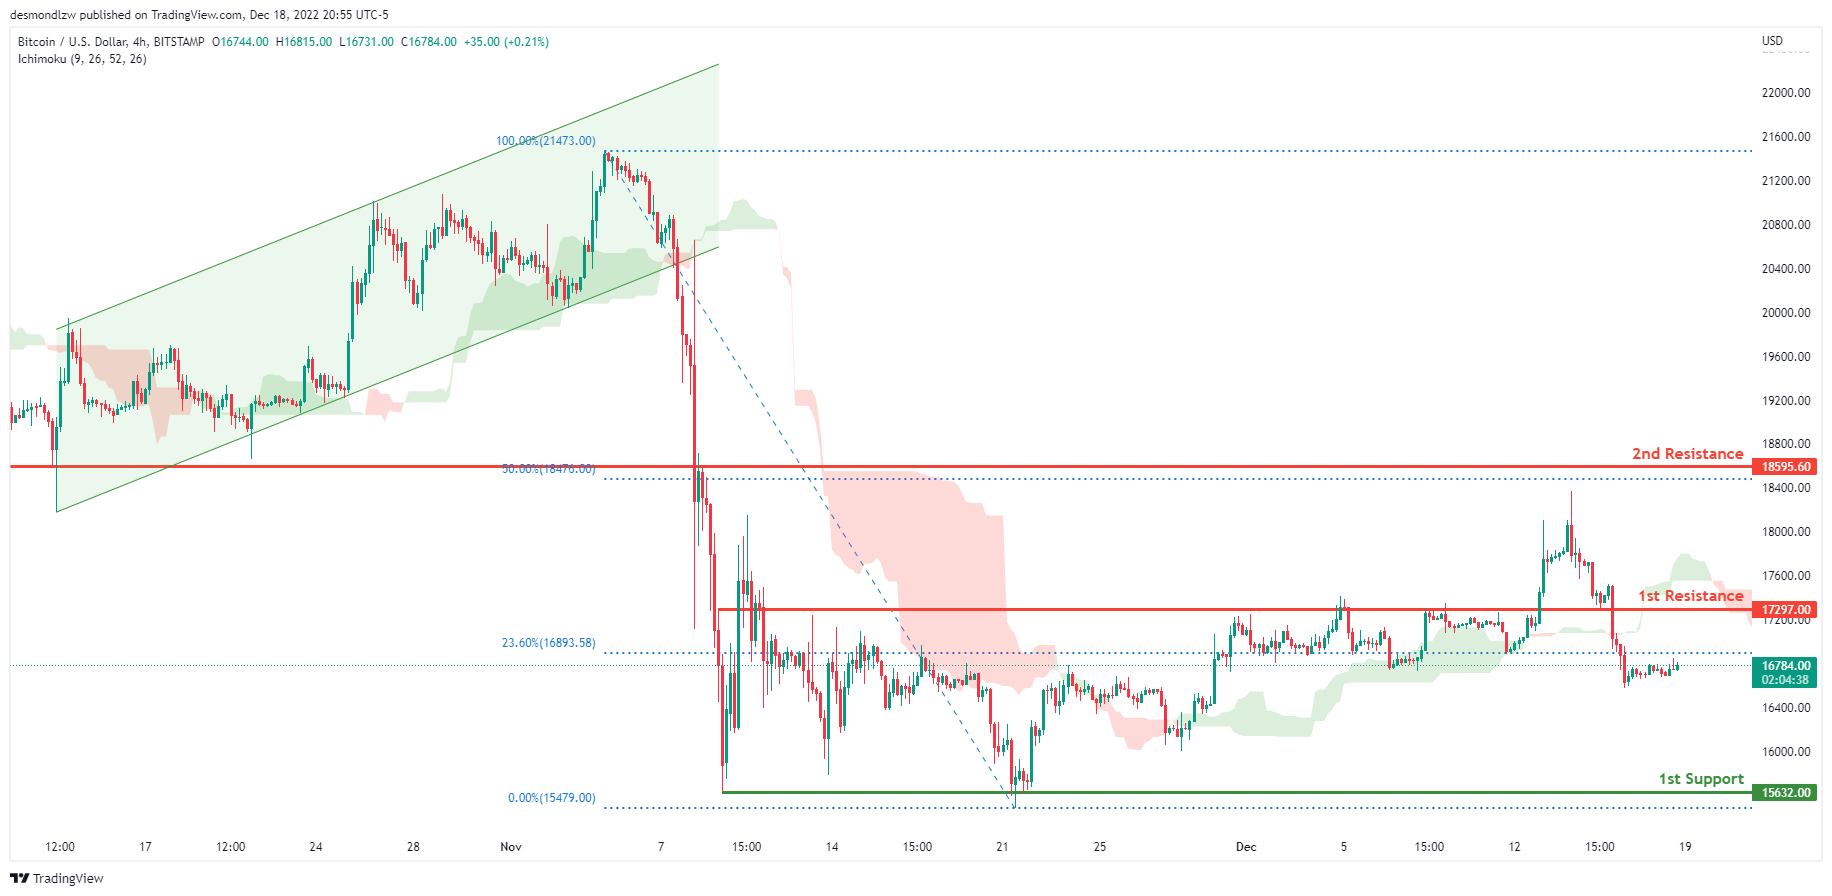
Looking at the H4 chart, my overall bias for BTCUSD is bearish due to the current price being below the Ichimoku cloud, indicating a bearish market. Expecting price to possibly continue heading towards the 1st support at 15632.00, where the previous swing low is. In an alternative scenario, price could possibly head up towards the 1st resistance at 17297.00, where the 23.6% Fibonacci line is.
Areas of consideration:
- H4 time frame, 1st resistance 17297.00
- H4 time frame, 1st support at 15632.00
S&P 500:
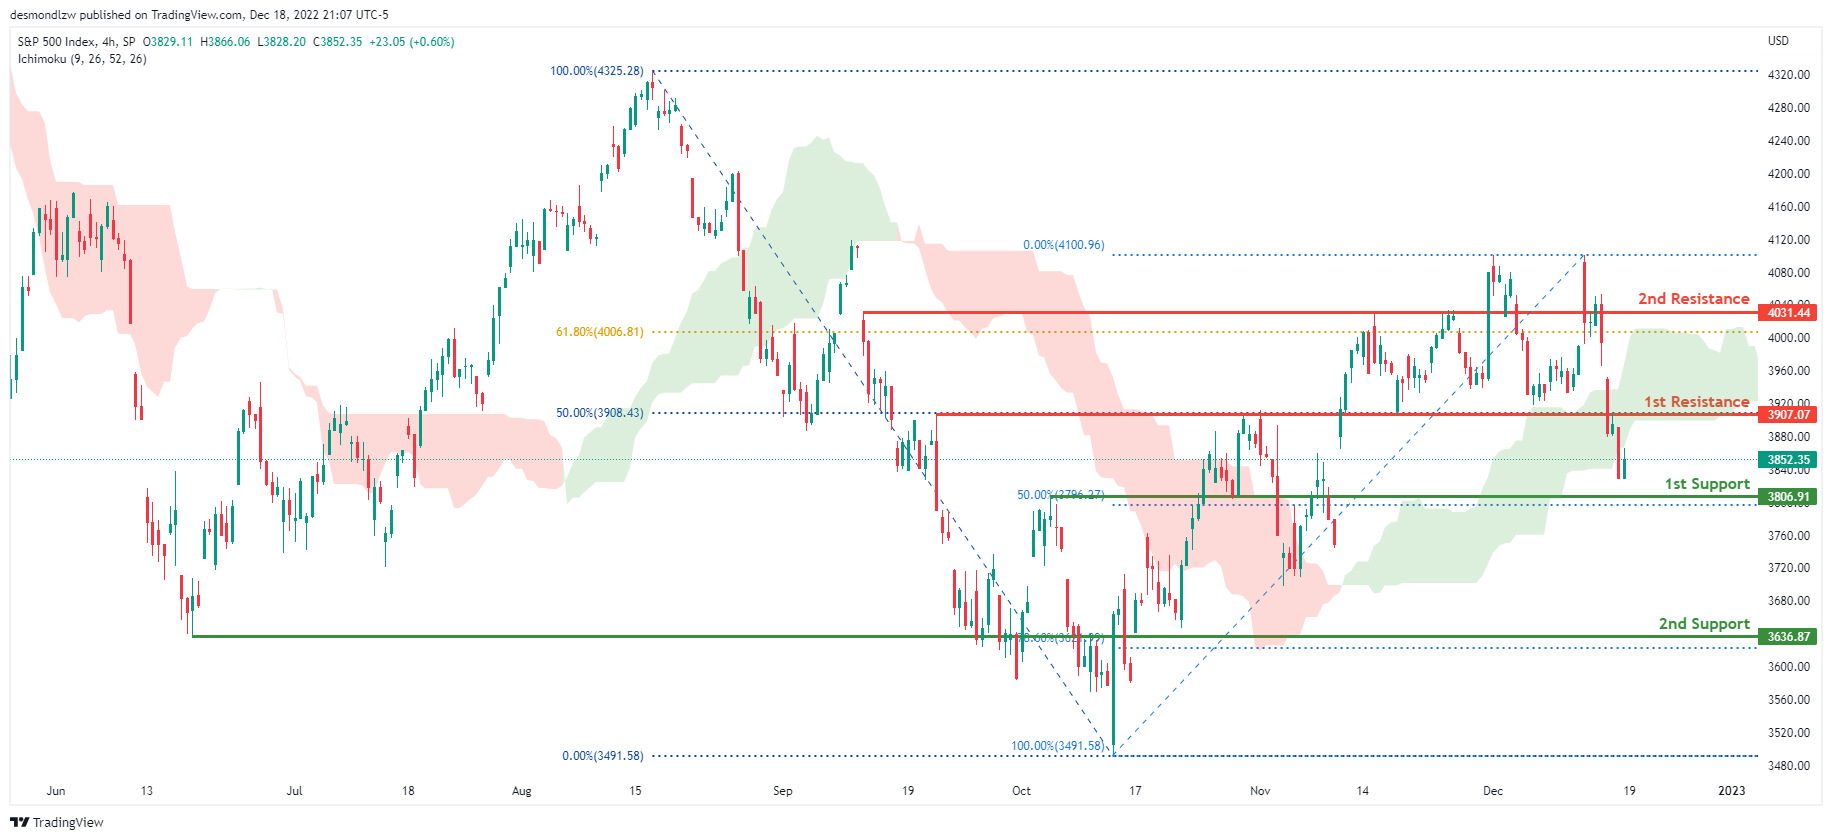
Looking at the H4 chart, my overall bias for S&P500 is bearish due to the current price crossing below the Ichimoku cloud, indicating a bearish market. If this bearish momentum continues, expect price to continue heading towards the 1st support at 3806.91, where the 50% Fibonacci line is. In an alternative scenario, price could possibly head back up breaking the 1st resistance at 3907.07, where the 50% Fibonacci line is before heading towards the 2nd resistance at 4031.44, where the 61.8% Fibonacci line is.
Areas of consideration:
- H4 time frame, 1st support at 3806.91
- H4 time frame, 1st resistance at 3907.07
- H4 time frame, 2nd resistance at 4031.44
US to Start Rebuilding Oil Reserves Next Year
Market movers today
There are only few key data releases left for 2022, and this week will be a quiet one ahead of Christmas as the main focus remains on digesting last week's central banks meetings.
German Ifo index will be released for December today, and consensus is looking for a modest uptick following the slightly less negative PMIs and ZEW released earlier, albeit from low levels. Early signs of a trough followed by potentially lower PPI tomorrow would be a welcome development for the German economy, which we expect to have fallen into a shallow recession in Q4. This afternoon, the US NAHB housing market indicator is also expected to remain at recessionary levels.
Overnight, the Bank of Japan will have a monetary policy meeting. We expect the Band of Japan to stick to its outlier position among global central banks and keep its yield curve control unchanged.
Later in the week, markets will listen closely to any signals from central banks, ECB's de Guindos will be on the wires tomorrow, followed by Kazimir on Wednesday. We will also get the US November private consumption data on Friday afternoon - last week's retail sales figures pointed towards cooling private demand.
The 60 second overview
EU: EU member states meet today to talk about whether to lower cap on natural gas prices. The price cap is currently set at EUR275/Mwh, but some member states are pushing for a price cap below EUR200/Mwh. The European natural gas spot price dropped to EUR119/Mwh last week. Last time it was above EUR200/Mwh was in September.
Fed: Cleveland Fed's Mester and San Francisco Fed's Daly on Friday hinted that Fed would need to keep the Fed funds rate at a high level for a period of time to ensure inflation falls back.
Oil: US plans to start refilling its strategic reserves next year. First step is to buy 3mb in February - a small purchase compared to the 180mb of selling. Oil prices dropped on Friday and if anything the market could be relieved that US looks to take its time to rebuild stocks.
FI: The sell-off in the fixed income markets continued on Friday and was primarily a result of the hawkish statements from ECB's Lagarde. The 10Y BTPS-Bund spread has widened some 30bp and credit spreads such as the ITRAX Main and X-over has also widened significantly. However, the 30Y high coupon Danish callables have performed well against Danish government bonds and Bunds and OAS-spreads have tightened for the Danish callable mortgage bonds.
FX: Despite the wide range of central bank decisions, last week ultimately failed to deliver any bigger lasting spot moves. Majors-moves vs USD were all kept within +/- 1% albeit AUD did post a slightly larger setback. Despite the hawkish ECB message the EUR notably traded poorly towards the end of the week highlighting how higher short-end interest rates is not always supportive of the currency when it also weakens the investment case of the asset market. SEK traded poorly towards the end of the week with EUR/SEK now trading back above 11.00. EUR/NOK remains close to the 10.50 mark.
Credit: The credit markets ended last week on a rather negative note. During Friday, iTraxx Main widened 7.3bp to 97.2bp while iTraxx Crossover widened 36.7bp to 506.25bp. The weakness in the CDS market was also visible in the cash bond market, where secondary bond trading and primary markets remained very inactive.
EUR/USD Daily Outlook
Daily Pivots: (S1) 1.0561; (P) 1.0612; (R1) 1.0639; More...
Intraday bias in EUR/USD remains neutral at this point. Further rally is expected as long as 1.0481 resistance turned support holds. Firm break of 61.8% projection of 0.9729 to 1.0481 from 1.0289 at 1.0754 will pave the way to 100% projection at 1.1041. However, firm break of 1.0481 will confirm short term topping and bring deeper fall to 1.0289 support.
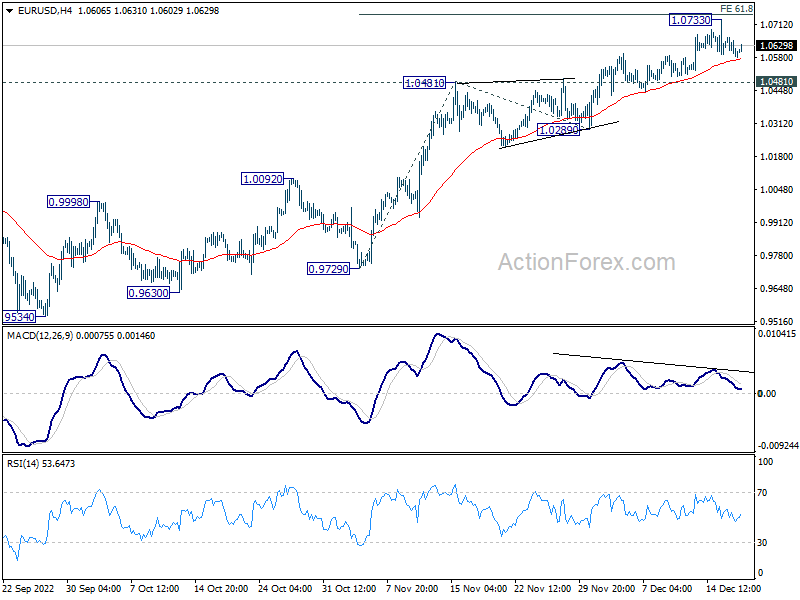
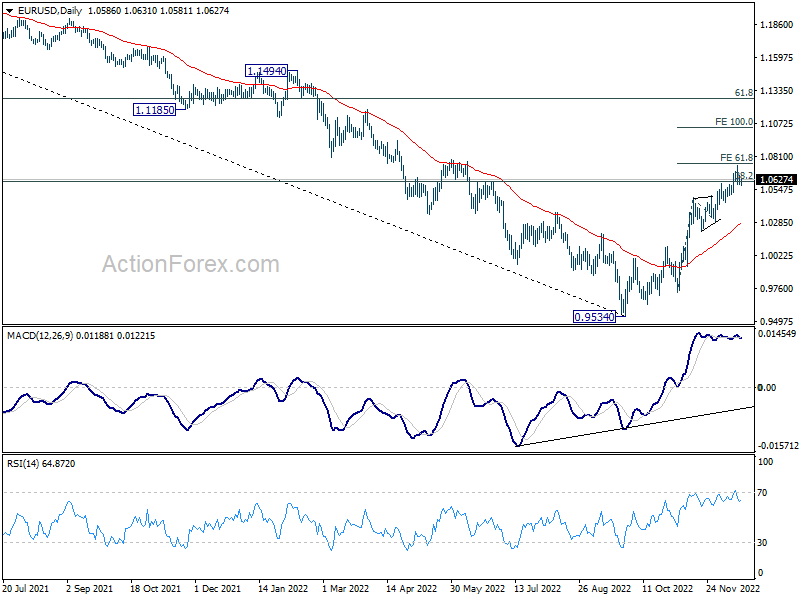
In the bigger picture, focus stays on 38.2% retracement of 1.2348 (2021 high) to 0.9534 at 1.0609. Rejection by 1.0609 will suggest that price actions from 0.9534 medium term bottom are developing into a corrective pattern. Thus, medium bearishness is retained for another fall through 0.9534 at a later stage. However, sustained break of 1.0609 will raise the chance of trend reversal and target 61.8% retracement at 1.1273.
GBP/USD Daily Outlook
Daily Pivots: (S1) 1.2097; (P) 1.2160; (R1) 1.2200; More...
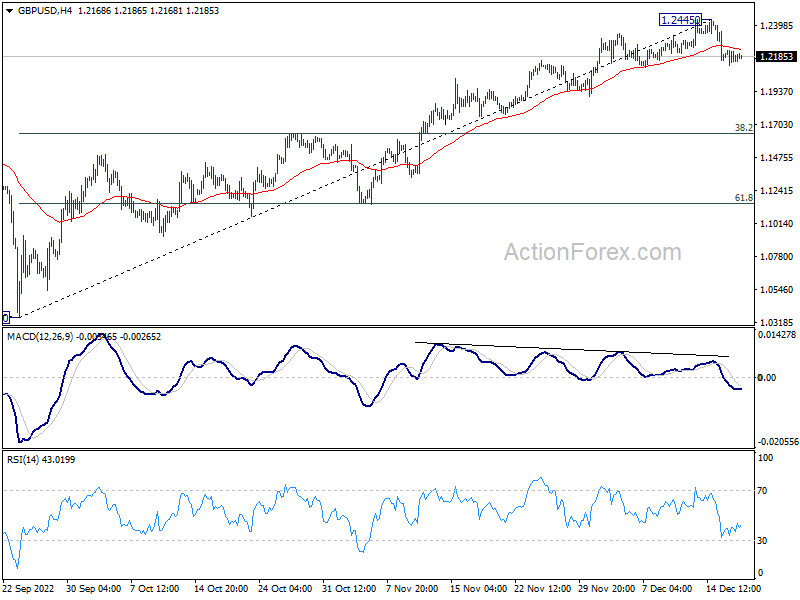
Intraday bias in GBP/USD stays mildly on the downside as fall from 1.2445 short term top is in progress for 55 day EMA (now at 1.1863). Firm break there will target 38.2% retracement of 1.0351 to 1.2445 at 1.1645. For now, risk will stay on the downside as long as 1.2445 resistance holds, in case of recovery.
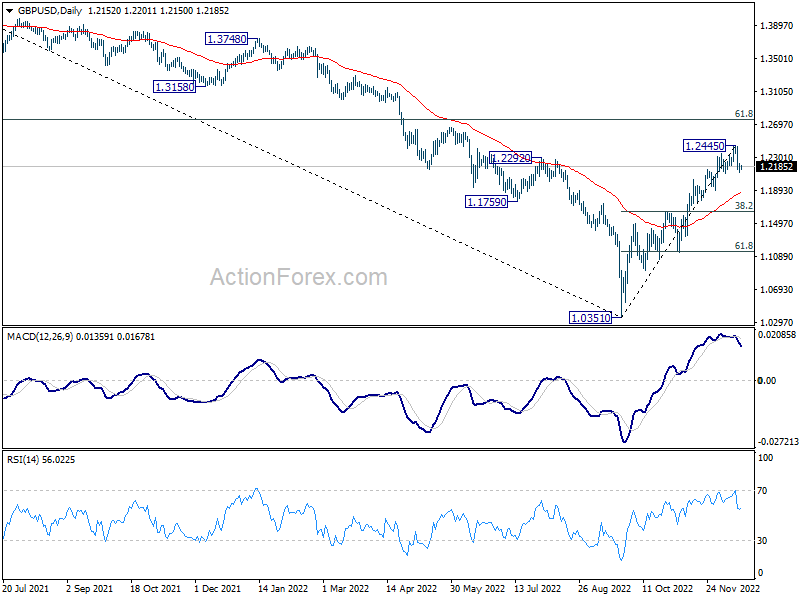
In the bigger picture, rise from 1.0351 medium term bottom is at least correcting whole down trend from 1.4248 (2021 high). Further rise is expected as long as 1.1644 resistance turned support holds. Next target is 61.8% retracement of 1.4248 to 1.0351 at 1.2759. Sustained break there will pave the way back to 1.4248. This will remain the favored case as long as 55 day EMA (now at 1.1863) holds.
USD/CHF Daily Outlook
Daily Pivots: (S1) 0.9282; (P) 0.9314; (R1) 0.9373; More...
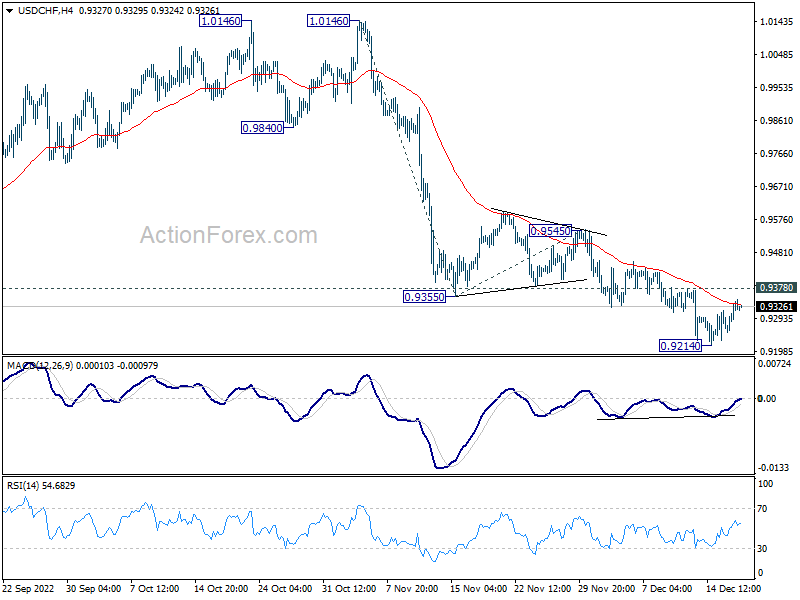
Intraday bias in USD/CHF remains neutral for the moment. On the downside. break of 0.9214 will resume the fall and target 61.8% projection of 1.0146 to 0.9355 from 0.9545 at 0.9056. However, break of 0.9378 resistance will indicate short term bottoming and turn bias back to the upside for 0.9545 resistance instead.
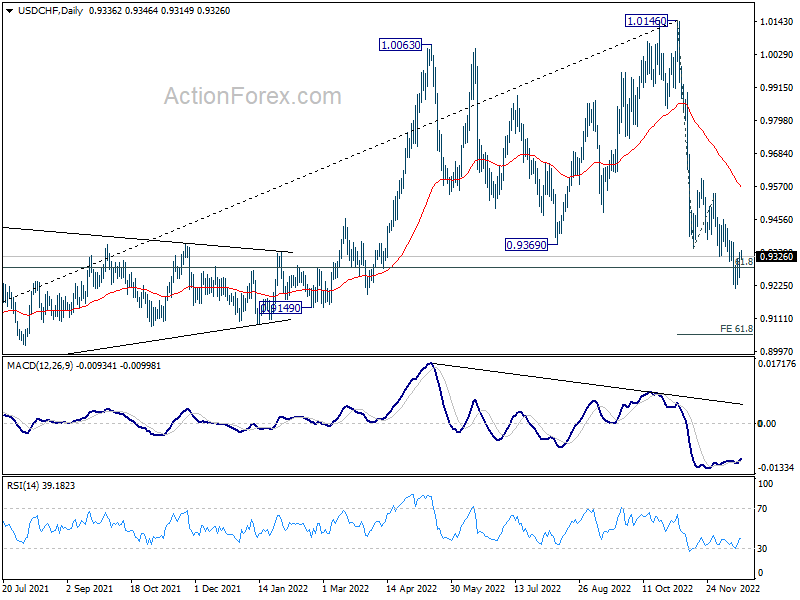
In the bigger picture, rise from 0.8756 (2021 low) has completed at 1.0146, well ahead of 1.0342 long term resistance (2016 high). Based on current downside momentum, fall from 1.0146 might be a medium term down trend itself. Sustained break of 61.8% retracement of 0.8756 to 1.0146 at 0.9287 will pave the way to 0.8756. In any case, risk will stay on the downside as long as 0.9545 resistance holds.
USD/JPY Daily Outlook
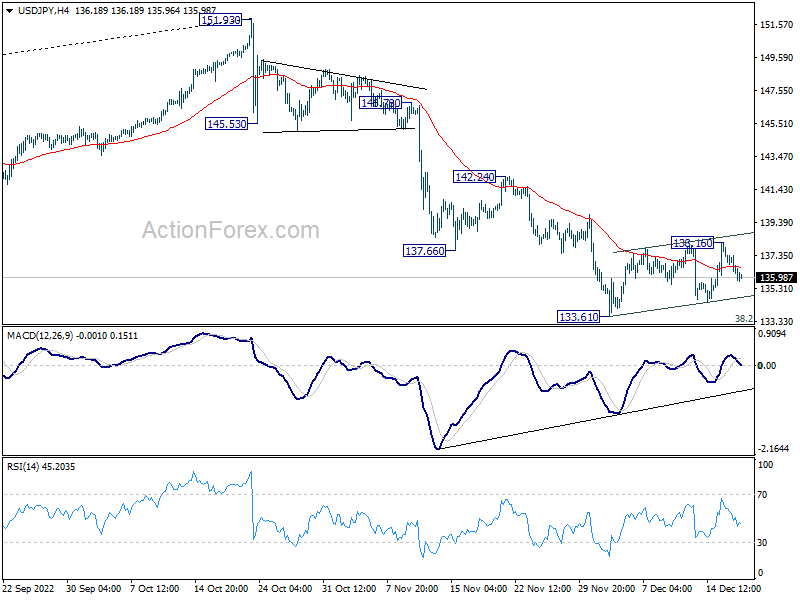
Daily Pivots: (S1) 135.97; (P) 137.07; (R1) 138.90; More...
Intraday bias in USD/JPY remains neutral for the moment. On the upside, break of 138.16 will resume the rebound to 55 day EMA (now at 140.15). On the downside, however, firm break of 133.61 support and 133.07 medium term fibonacci level will confirm resumption of whole fall from 151.93.
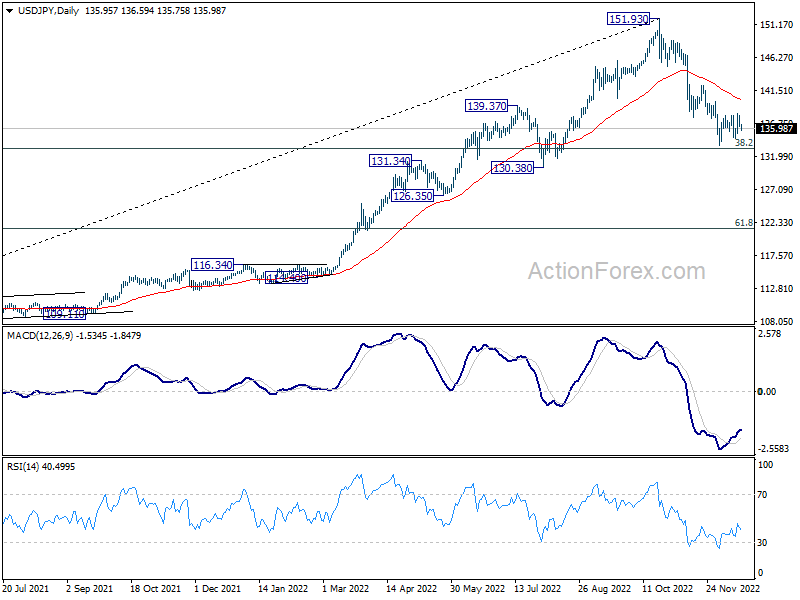
In the bigger picture, price actions from 151.93 medium term could be just a corrective pattern to up trend from 102.58 (2021 low). Strong support from 38.2% retracement of 102.58 to 151.93 at 133.07 and 55 week EMA (now at 131.85) will set the range for such corrective pattern. However, sustained break of 55 week EMA will pave the way to 61.8% retracement at 121.43.
AUD/USD Daily Report
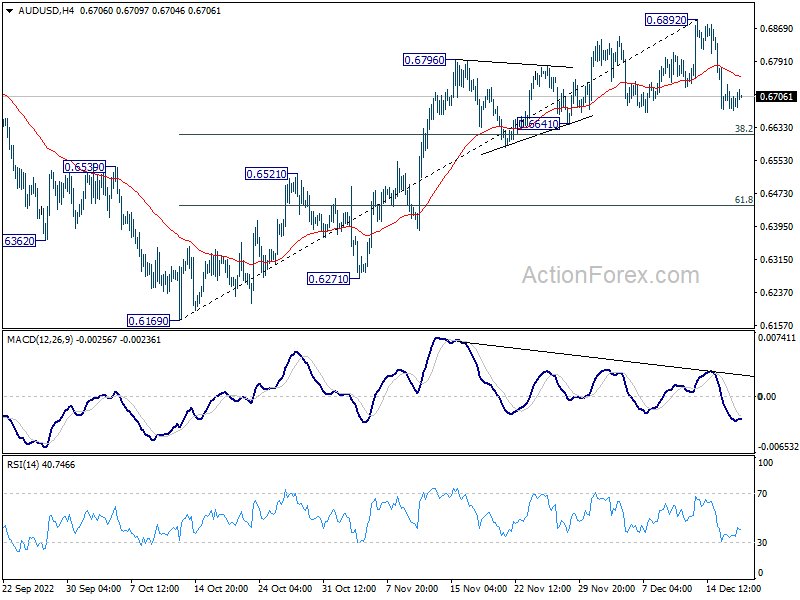
Daily Pivots: (S1) 0.6663; (P) 0.6700; (R1) 0.6723; More...
Intraday bias in AUD/USD stays mildly on the downside. Fall from 0.6892 short term top is in progress to 38.2% retracement of 0.6169 to 0.6892 at 0.6616. Sustained break there will suggest rejection by 0.66871 fibonacci level. Deeper fall should then be seen to 61.8% retracement at 0.6445. For now, risk will stay mildly on the downside as long as 0.6892 resistance holds, in case of recovery.
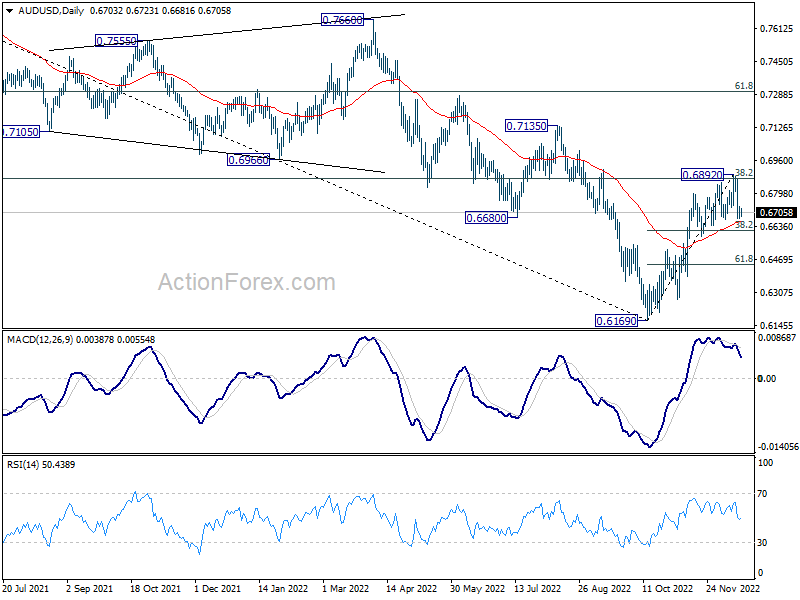
In the bigger picture, it's still unsure if price actions from 0.6169 medium term bottom are developing into a corrective pattern or trend rejection. Rejection by 38.2% retracement of 0.8006 to 0.6169 at 0.6871 will maintain medium term bearishness for another fall through 0.6169 at a later stage. However, firm break of 0.6871, and sustained trading above 55 week EMA (now at 0.6909) will raise the chance of the start of a bullish up trend.
USD/CAD Daily Outlook
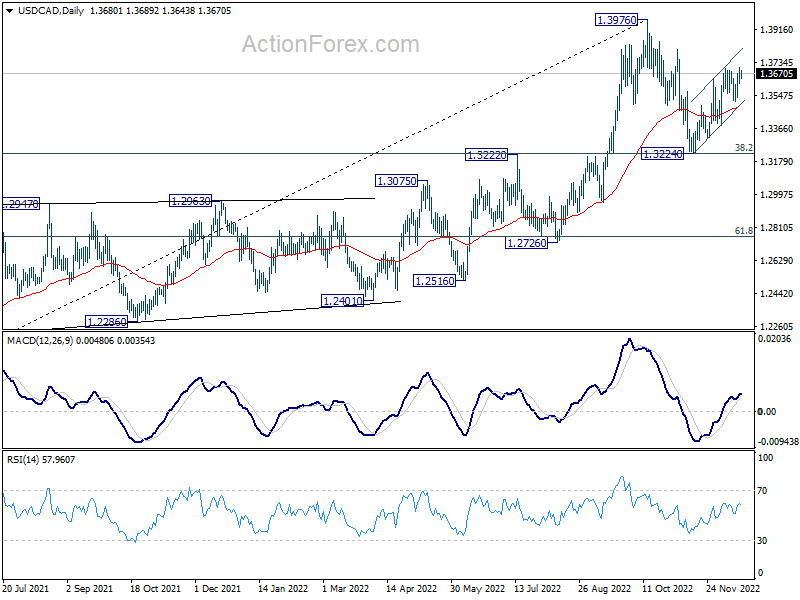
Daily Pivots: (S1) 1.3642; (P) 1.3673; (R1) 1.3729; More....
Intraday bias in USD/CAD remains mildly on the upside for the moment. Rise form 1.3224 would target 1.3807 resistance. Break there will bring retest of 1.3976 high. On the downside, however, break of 1.3516 support will suggest that the rebound has completed, and turn bias back to the downside.
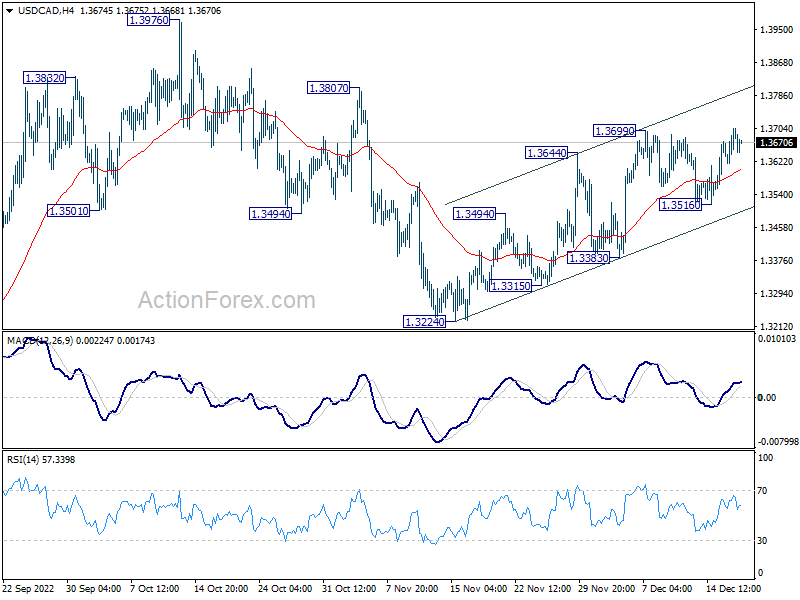
In the bigger picture, as long as 1.3222 cluster support (38.2% retracement of 1.2005 to 1.3976 at 1.3223) holds, larger up trend from 1.2005 (2021 low) is still expected to resume through 1.3976 high at a later stage. However, firm break of 1.3222/3 will indicate that the trend might have reversed. Deeper fall would be seen to next cluster support at 1.2726 (61.8% retracement at 1.2758).