Sample Category Title
Forex and Cryptocurrencies Forecast
EUR/USD: The Fed Doesn't Want to be Dovish. The ECB Either.
The past week can be divided into two parts: before and after the FOMC (Federal Open Market Committee) meeting of the US Federal Reserve. The US inflation data produced a bombshell effect on the eve of this event, on Tuesday, December 13. The Consumer Price Index (CPI), with the forecast at 7.3%, fell in November from 7.7% to 7.1% (y/y), reaching its lowest level in almost a year, while core inflation fell from 6.3% to 6.0%. As a result, the market decided that since things were going so well, it was time for the Fed to turn from hawk to dove. Or at least ease their monetary policy significantly. Based on these expectations, the 10-year Treasury bond yield fell from 3.60% to 3.43%, and the DXY Dollar Index peaked and fell to its lowest levels over the past six months, from 105.07 to 103.60 points. Accordingly, stock indices (S&P500, Dow Jones, Nasdaq) flew up, and EUR/USD jumped to 1.0672.
The feast of risk appetites and the glee of opponents of the dollar did not last long. The FOMC raised its key interest rate by 50 basis points (bp) to 4.5% at its meeting. That is, exactly as market participants expected. Surprises were expected at the subsequent press conference, which showed that the US Central Bank is still hawkish. Fed chief Jerome Powell noted that the regulator will keep rates at their peak until they are sure that the decline in inflation has become a sustainable trend. The base rate could be raised to 5.1% in 2023 and remain so high until 2024. (Recall that 4.6% was mentioned as the peak rate in the September statement). According to Jerome Powell, the Fed understands that this will trigger a recession, but is willing to pay that price to control inflation. The situation turned around 180 degrees after such statements: DXY went up, stock indices flew down, and EUR/USD fell by more than 140 points.
The last meeting of the European Central Bank this year was also held last week, on Thursday, December 15. The ECB, as well as the Fed, raised the interest rate by 50 bp: up to 2.5%, which fully met the forecasts. ECB President Christine Lagarde, as well as her overseas counterpart, showed a hawkish attitude at the press conference and made it clear that quantitative tightening (QT) in the Eurozone will not end there: the euro interest rate will face several more increases in 2023. The ECB also plans to start reducing its balance sheet from March. At the moment, the gap between the dollar and euro rates is 200 bp (4.5% and 2.5%, respectively). The swap market expects that the European regulator may raise its rate by another 100 bp in the coming year, which will provide some support for EUR/USD. Read our upcoming reviews to find out what forecasts leading financial institutions give regarding its quotes.
The data on business activity in the manufacturing sectors of Germany and the Eurozone (PMI), as well as the November value of the European Consumer Price Index (CPI) were published at the very end of the last week, on Friday, December 16. Data on consumer inflation did not have a significant impact on market sentiment: on the one hand, CPI in annual terms fell from 10.6% to 10.1%, and on the other hand, it turned out to be higher than the forecast of 10.0%. After the release of these macro statistics, the pair placed the last chord at 1.0590.
40% of analysts expect the euro to strengthen in the coming days and EUR/USD to grow, 50% expect Santa Claus to help the US currency. The remaining 10% of experts do not expect either the first or the second from the pair. The picture is different among the oscillators on D1. As for the oscillators, 75% are colored green, 10% are set to neutral gray and 15% stand out against this background with a bright red color. Trend indicators also have an advantage on the green side, these are 80%, and 20% are on the red side. The nearest support for EUR/USD is at the 1.0560 horizon, followed by levels and zones at 1.0500, 1.0440, 1.0375-1.0400, 1.0280-1.0315, 1.0220-1.0255, 1.0130, 1.0070, followed by the parity zone 0.9950-1.0010. Bulls will meet resistance at levels 1.0620, 1.0675-1.0700, 1.0740-1.0775, 1.0865, 1.0935.
Next week's calendar includes Thursday December 22 for the release of 3Q US GDP data, and Friday December 23 for the release of orders for capital goods and durables, as well as the core US Personal Consumption Expenditure Index. .
Attention! Christmas and New Year holidays fall on weekends this year; however, we strongly advise you read the trading schedule for this period, it is published on the NordFX website in the Company News section.
GBP/USD: The Market No Longer Trusts the Bank of England
Even more disappointment than EUR/USD awaited the bulls on the British pound. Having reached a six-month high of 1.2450 on December 14, GBP/USD then fell to 1.2119 and ended the weekly session at 1.2160.
There were quite a lot of statistics on the economy of the United Kingdom Last week, and they looked diverse: sometimes green, sometimes red. The country's GDP grew by 0.5% and was higher than the forecast of 0.4%. The manufacturing sector also rose to 0.7% after the zero dynamics in September. Such an important indicator of inflation as CPI was 10.7% in November (it was at the highest level since November 1981 - 11.1% a month ago). But retail sales fell to 0.4% in November against 0.9% in October. The unemployment rate rose from 3.6% to 3.7%. The business activity index (PMI) in the manufacturing sector of the UK fell to 44.7 in December against 46.5 in November. And in the services sector, on the contrary, it rose to 50.0 compared to the November value of 48.8 and the forecast of 48.5.
It seems that such multi-vector statistics have greatly confused market participants, and they focused not on the pound, but on the US dollar. Although the Bank of England (BoE) also issued its verdict on the interest rate last week. Like the Fed and the ECB, the regulator raised it by 50 bp up to 3.5% per annum (14-year maximum). However, BoE's statements turned out to be more dovish than those of their colleagues. According to the regulator, inflation may have already reached its peak. And two out of nine members of the Monetary Policy Committee considered that interest rates are already high enough and it is time to ease price pressures.
Prior to this meeting, quotes expected a maximum rate increase of up to 4.6%. After the meeting, the swap market lowered its forecast to 4.5% by August (that is, a total increase of another 100 bp). As for the survey of market participants conducted recently by the Bank of England, the median expectations are even lower here: only 4.25% with a peak in March 2023.
These forecasts put strong pressure on the British currency. Therefore, according to Commerzbank economists, the pound does not have much potential for recovery. "After the Bank of England hesitated for several months, the market now believes that it is the least trustworthy thing to suddenly become a mega hawk," they write. "So, the pound has no chance against either the euro or the dollar."
As for the short term, the median forecast for GBP/USD looks quite neutral here: 45% of experts side with the bulls, the same number side with the bears, and the remaining 10% prefer to decline to comment.
The readings of the indicators on D1 look mixed as well. Among the oscillators, 30% are colored green, 25% are red and 45% are neutral gray. Trend indicators have a ratio of 65% to 35% in favor of the green ones. Support levels and zones for the pair are 1.2085-1.2115, 1.2030, 1.1940, 1.1900, 1.1800-1.1840, 1.1700-1.1720. When the pair moves north, the pair will face resistance at the levels of 1.2200-1.2225, 1.2270, 1.2330-1.2345, 1.2425-1.2450 and 1.2575-1.2610, 1.2700 and 1.2750.
Among the events related to the United Kingdom economy this week, we can highlight Thursday, December 22, when we will find out what happened to the country's GDP in Q3 2022. We also pay attention to the early closing of trading in the UK on Friday, December 23, which, of course, is associated with the upcoming Christmas.
USD/JPY: What to Expect from the Bank of Japan
Like previous pairs, USD/JPY reacted to both US inflation data and statements by the Fed Chairman. But, unlike EUR/USD and GBP/USD, this pair has not gone beyond the side corridor for the last two weeks. Its boundaries can be designated as 134.25-137.85, and timid attempts to break through in one direction or another can be ignored. This balance is most likely due to the fact that both the dollar and the yen are safe-haven currencies. Of course, the global advantage, thanks to the difference in interest rates, is on the side of the dollar. But, having carried out a number of foreign exchange interventions, the Bank of Japan (BoJ) has managed in recent months not only to stop the advance of the American currency, but also to significantly push it back.
As we have already mentioned, the future of the pair will continue to depend on the difference in interest rates between the US and Japan. If the Fed remains at least moderately hawkish and the BOJ remains ultra-dovish, the dollar will continue to dominate the yen. The threat of new foreign exchange intervention by the Ministry of Finance of Japan, the same as it was on November 10, seems unlikely at current levels. Raising the key rate could help, but it is very likely that the Bank of Japan (BoJ) will leave it unchanged at its meeting on December 20: at the negative level of -0.1%. A radical change in monetary policy can be expected only after April 8 next year. It is on this day that Haruhiko Kuroda, the head of the Bank of Japan, will end his term, and he may be replaced by a new candidate with a tougher position. Although this is not a fact.
Another hope is for renewed concerns about China's economic prospects. By the way, the People's Bank of China will also make its decision on the interest rate on the yuan on Tuesday, December 20.
USD/JPY finished at 136.70 on Friday, December 16. Analysts' forecast for the near future is exactly the same as the forecast for GBP/USD: 45%/45%/10%. For oscillators on D1, the picture looks like this: 25% look south, 40% look north, and 35% look east. Among the trend indicators, the ratio is 60% versus 40% in favor of the red ones. The nearest support level is located at 136.00 zone, followed by levels and zones 134.40, 133.60, 131.25-131.70, 129.60-130.00, 128.10-128.25, 126.35 and 125.00. Levels and resistance zones are 137.50-137.70, 138.00-138.30, 139.00, 139.50-139.75, 140.60, 142.25, 143.75. The goal of the bulls to renew the October 21, 2022 high, and to gain a foothold above the height of 152.00 seems realistic only in a very distant future.
In addition to the mentioned interest rate decision by the Bank of Japan, the calendar also includes Friday, December 23, when the Report from the BoJ Monetary Policy Committee meeting will be published. Market participants will try to catch at least small hints of changes in this policy. However, the chances of this happening are close to zero.
CRYPTOCURRENCIES: Santa Claus Is the Only Hope
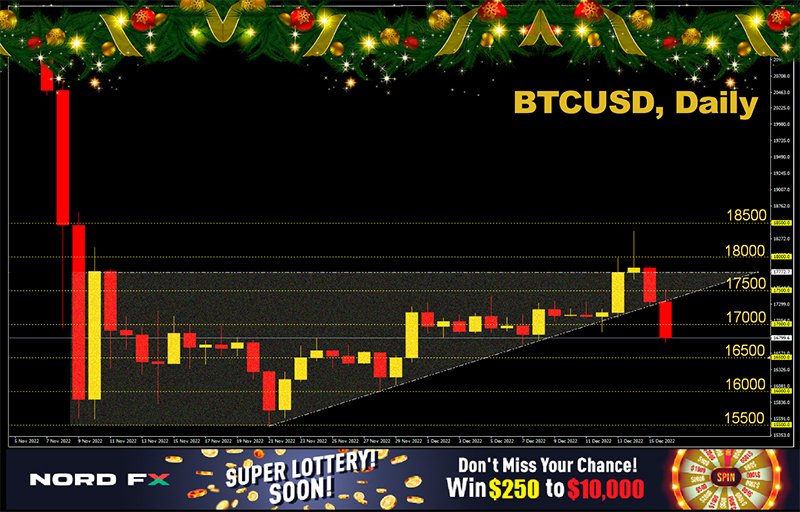
The results of the Fed meeting seem to have greatly tempered investors' risk appetites. If stock indices (S&P500, Dow Jones, Nasdaq) were growing throughout the first half of the week, and after the publication of inflation data in the US, they just soared up, dragging crypto asset prices, they all went into the red after the Fed meeting, on Wednesday evening, November 14. Amid fears of a global recession, the decline continued on Thursday and Friday. The local maximum for BTC/USD was fixed at $18.381, but it met the end of the working week much lower, in the $16.830 zone.
The general situation in the crypto industry does not help the growth of prices either. Recall that, in addition to the bankruptcy of FTX in November, it has experienced a number of major shocks this year. First of all, this is the collapse of the Terra ecosystem in May. Compute North, Voyager Digital, Celsius Network, Three Arrows Capital, and Blockfi also filed for bankruptcy. According to some estimates, approximately several million customers lost billions of dollars as a result of all these events.
The events of recent days are not encouraging either. Sam Bankman-Fried, founder of crypto exchange FTX, has been arrested in the Bahamas after U.S. Attorney's Office filed eight felony charges against him. According to the representative of the prosecutor's office, Bankman-Fried faces up to 115 years in prison in the aggregate of all criminal cases. Market participants were also alarmed by the strange, to put it mildly, financial report by FTX's main competitor, the Binance exchange. It contained only three indicators, which caused bewilderment and criticism from representatives of the accounting community.
There is very little time left until the end of this year, and it is only Santa Claus Rally, a phenomenon when stock indices suddenly begin to go up at the very end of December, that can help the growth of bitcoin and the crypto market as a whole. This Rally usually starts on the last Monday of the month and lasts for seven trading days. However, sometimes Santa Claus decides to help not risky assets at all, but the dollar. And then, instead of the North Pole, they head south. (You can read more about Santa Claus Rally on NordFX's Useful Articles section).
Some experts hope that bitcoin will still be able to gain a foothold above the $18,000 area in the coming days. Then, in their opinion, it will most likely reach an extreme of $20,000 by the end of the year.
In such a situation, the price of the flagship cryptocurrency will again be on a growth parabola, according to a well-known analyst under the nickname Plan B. According to their latest forecast, BTC could reach $100,000 in 2023. Jim Wyckoff, Senior Analyst at Kitco News, also believes BTC is close to developing a sustained bullish rally in the current environment as strong buyers have stepped in.
Arthur Hayes, the former CEO of BitMEX, expressed a similar point of view, although his arguments differ from those of Jim Wyckoff. Hayes believes that the first cryptocurrency has reached the low of the current cycle, as almost all "irresponsible organizations" have run out of coins to sell. He explained that when facing financial difficulties, centralized credit companies often borrow first and then sell off their BTC holdings, followed by a collapse. "When you look at the balance of any of these 'heroes', you won't see bitcoin there. They sold it before they went bankrupt." That is why, according to Hayes, the fall in the quotes of the first cryptocurrency precedes such bankruptcies. At the same time, the expert believes that the period of large-scale liquidations is over.
ARK Invest CEO Catherine Wood also spoke negatively about centralized companies and positively about DeFi. In her opinion, DeFi will be further developed, as investors have learned how important fully transparent decentralized networks are thanks to the crisis. "When centralized crypto companies went bankrupt, investors who invested in transparent distributed networks saw what was happening. They were able to withdraw their assets on time. Even those who used a large margin leverage were able to survive," said Catherine Wood. And she added that Sam Bankman-Fried has always disliked bitcoin because it is transparent and decentralized, and he could not control it, including during the crisis provoked by opaque centralized players.
According to former BitMEX CEO Arthur Hayes, the digital asset market expects a partial recovery in 2023 amid another launch of the US Federal Reserve's printing press. Mike McGlone, senior strategist at Bloomberg Intelligence, also expects new flows of cash liquidity from the Central Bank, he called next year the bitcoin market and a time of shine after a year and a half of direct downward trends. However, at the same time, the analyst added that if the easing of monetary policy does not happen, the world may plunge even deeper into a recession with negative consequences for all risky assets.
Max Keiser, a former trader and now TV host and filmmaker, also believes that BTC will certainly catch up in 2023 and may stage an epic rally before the 2024 halving. In his opinion, the growth of the flagship cryptocurrency will continue over the next decade. And, as Cathie Wood stated, it will reach a price of $1 million per coin by 2030.
In the meantime, at the time of writing this review (Friday evening, December 16), ETH/USD is trading around $1,200, while BTC/USD is trading at $16,830. The total capitalization of the crypto market for the week decreased by almost 4.0% and amounted to $0.818 trillion ($0.852 trillion a week ago). The Crypto Fear & Greed Index has grown by only 3 points in seven days, from 26 to 29, and still remains in the Fear zone.
U-turn in Risk Sentiment Following Hawkish Fed and ECB
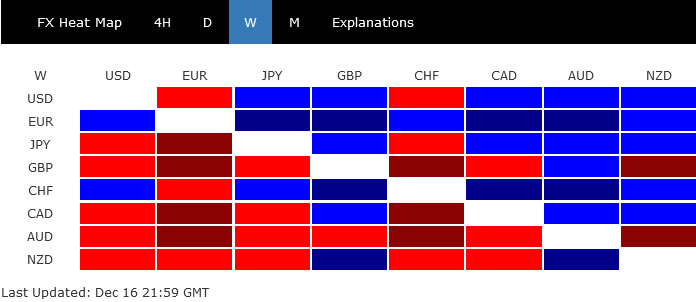
Risk sentiment took a U-turn last week after more hawkish than expected FOMC projections and, more important, ECB forward guidance. Euro ended as the biggest winner for the week, trained by Swiss Franc, and the Dollar. Australian Dollar was the worst performer, followed by Sterling, and then Kiwi. Canadian Dollar and Yen ended mixed.
The development could set up risk-off movements in the markets for the rest of the year, which could favor more upside in Dollar. The is also some downside risks in Aussie, depending on how situation in China unfolds. Euro's strength was not totally convincing given the late pull back against Dollar and Yen. But the common currency looks more likely to outperform commodity currencies than not.
Sentiment U-turn on hawkish ECB and Fed
Last week's central bank meetings were full of surprises. The biggest one came from ECB with President Christine Lagarde, in a rare fashion, indicating that there will be more 50bps hikes for a period of time. The judgement was probably based on expectation that recession in Eurozone would only be a shallow one. There are now expectations for at least two more 50bps hikes in February and March. Some economists raised their forecast of ECB terminal rate to 3.25-3.75% range, comparing to the current 2.50%.
Fed's new economic projection was seen as more hawkish than expected, with median estimate of federal funds rate reading 5.1% in 2023, above 5% level. Indeed, 17 policy markets penciled in rate at 5.125% and above next year, with 7 expecting 5.375% and above. Comparing to the current 4.25-4.50%, there could be three to four 25bps hikes.
SNB didn't rule out more rate hikes ahead. But with hawkish ECB, SNB will more likely follow than not, too keep exchange rate steady to counter inflation. BoE voting was some what dovish with two members voted for no change even though one voted for a 75bps hike.
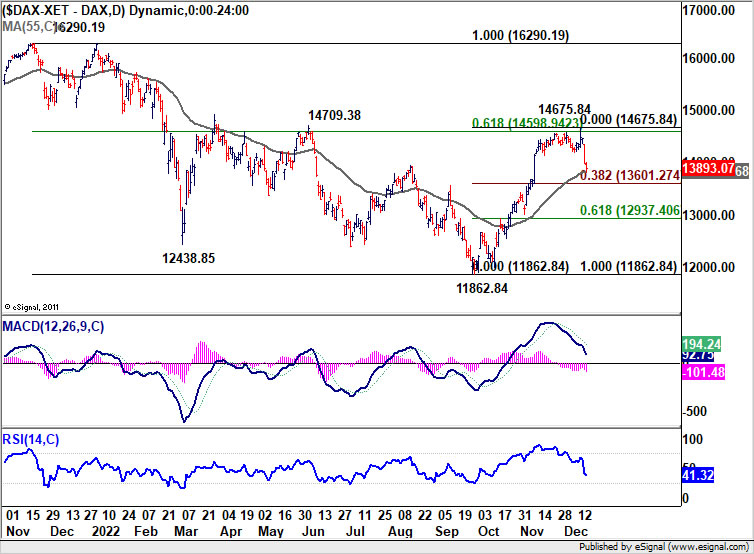
The net result is an U-turn in market sentiment. DAX's steep decline towards the end of the week confirmed short term topping at 14675.84. It's now sitting close to support zone between 38.2% retracement of 11862.84 to 14675.84 at 13601.27, and 55 day EMA (now at 13828.58). Recovery from this support zone will keep the corrective pattern from 14675.84 as a ranging one. However, firm break of the zone will open up deeper decline back to 61.8% retracement at 12937.40, and possibly below.
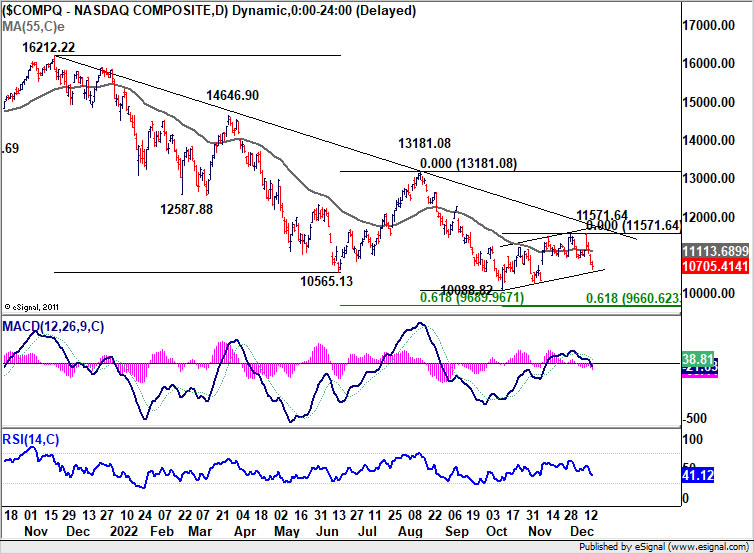
In the US, NASDAQ's decline raised the chance that consolidation from 10088.82 has completed at 11571.64, and the larger down trend from 16212.22 is ready to resume. Further decline is now in favor to retest 10088.82 low in the near term, or even further to double projection target 9660.62/9689.96 (61.8% projection of 13181.08 to 10082.82 from 11571.64 and 61.8% projection from 16212.22 to 10565.13 from 13181.08 at 9689.96). Stronger support is likely from there to complete the down trend. If that's the case, then DOW's pull back from 34595.51 should be contained well above 28600.94 low.
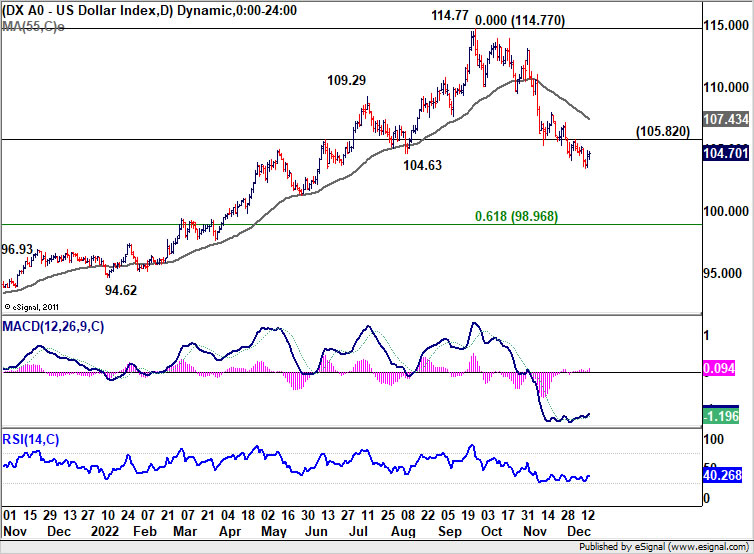
Dollar index continued to lose downside momentum, rebound overdue
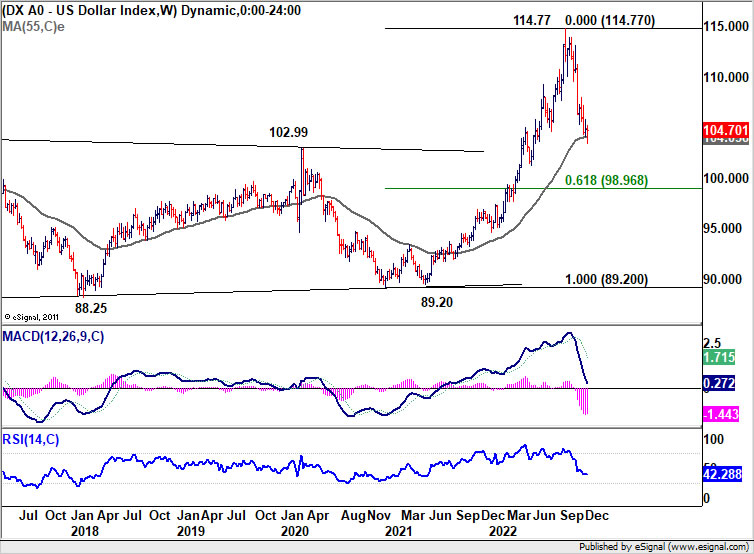
Dollar index edged lower last week but continued to lose downside momentum. Euro's strength is clearly limiting DXY's recovery. Still, a rebound is overdue considering that it's pressing 55 week EMA (now at 104.05). Break of 105.82 resistance should indicate short term bottoming and bring stronger rebound back to 55 day EMA (now at 107.43) and above. However, sustained trading below the 55 week EMA will open up deeper decline to 61.8% retracement of 89.20to 114.77 at 98.96.
Will overbought condition cap EUR/CAD's up trend?
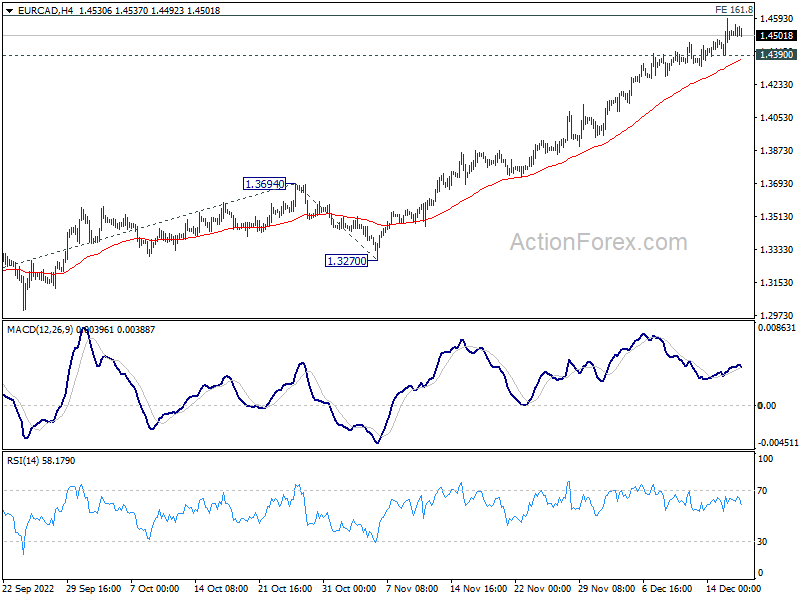
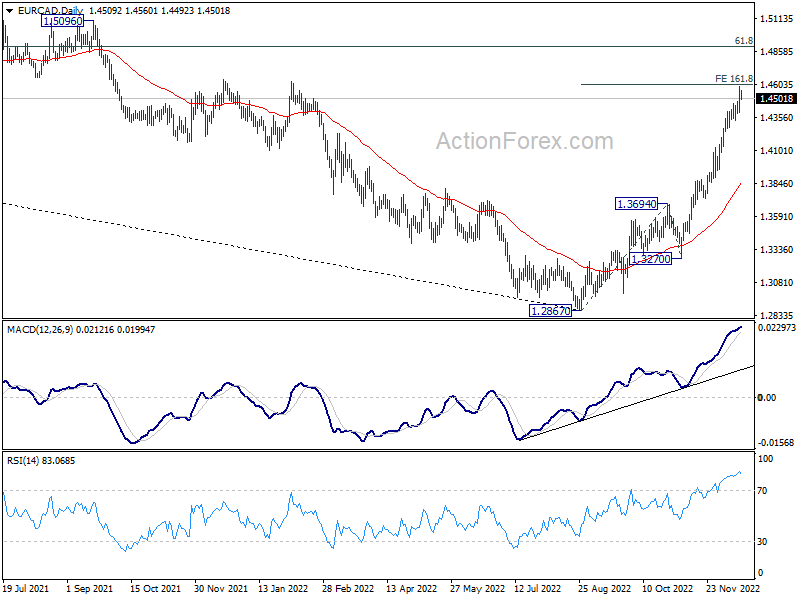
Euro ended as the winner of the week. Its strength was rather clear against commodity currencies, but relatively less certain against others. EUR/CAD's up trend from 1.2867 continued to as high as 1.4591 last week, just inch below 161.8% projection of 1.2867 to 1.3694 from 1.3270 at 1.4608. For now, further rise is expected as long as 1.4390 minor support holds. Sustained break of 1.4608 will put focus to key long term fibonacci level of 1.6151 to 1.2867 at 1.4897.
However, break of 1.4390 will indicate the short term topping, on overbought condition as seen in daily RSI. Some corrective trading should be seen with bias mildly on the downside, before the up trend resumes at a later stage. Such development, if happens, could be a sign of some weakness in Euro elsewhere, like against Dollar and Yen.
AUD/JPY finally ready for downside breakout?
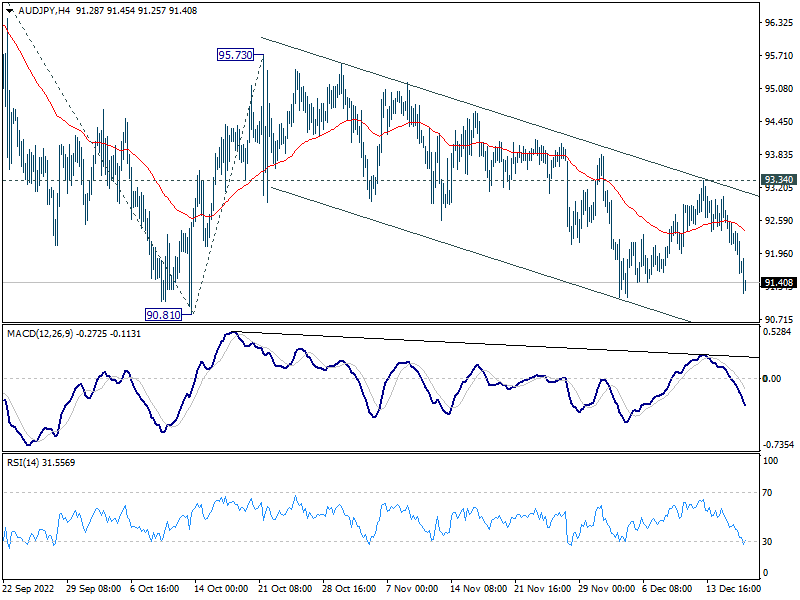
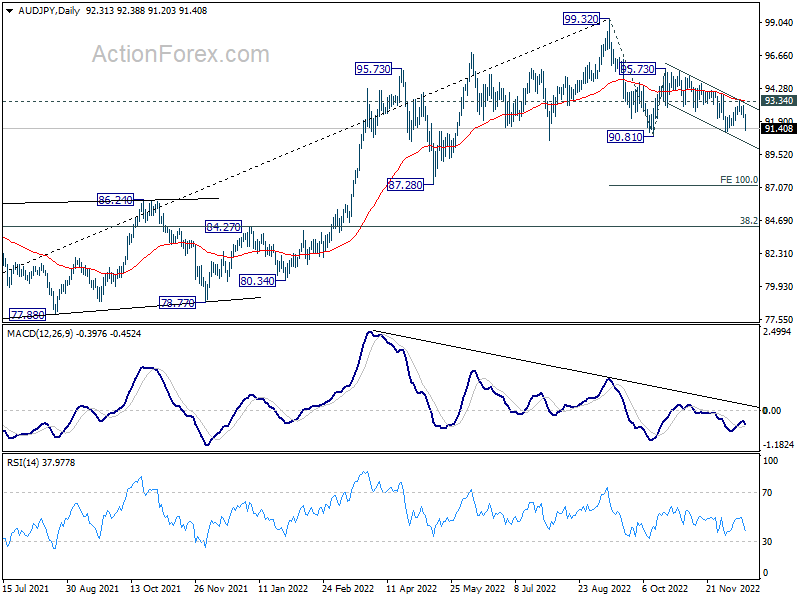
Australian Dollar ended as the worst performer, on expectation of lower RBA terminal rate comparing with others, return of risk-off sentiment, and uncertainty over China's infection situations.
AUD/JPY's price actions from 95.73 has been rather indecisive. Yet, being capped below falling 55 day EMA was clearly a bearish sign. Further decline is expected as long as 93.94 resistance holds. Firm break of 90.81 support will resume the fall form 99.32 to 100% projection of 99.32 to 90.81 from 95.73 at 87.22, which is close to 87.28 structural support.
GBP/USD Weekly Outlook
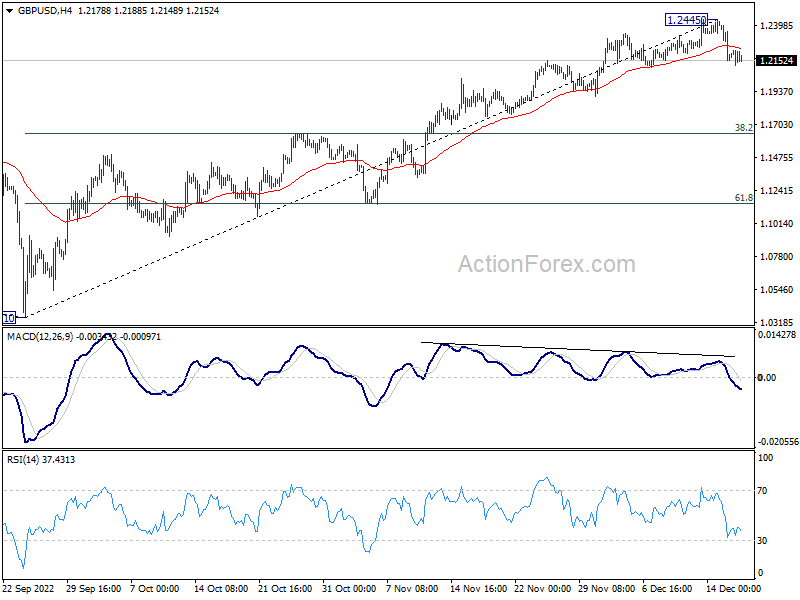
GBP/USD rose further to 1.2445 last week but formed a short term top there and reversed. Initial bias is mildly on the downside this week for 55 day EMA (now at 1.1853). Firm break there will target 38.2% retracement of 1.0351 to 1.2445 at 1.1645. For now, risk will stay on the downside as long as 1.2445 resistance holds, in case of recovery.
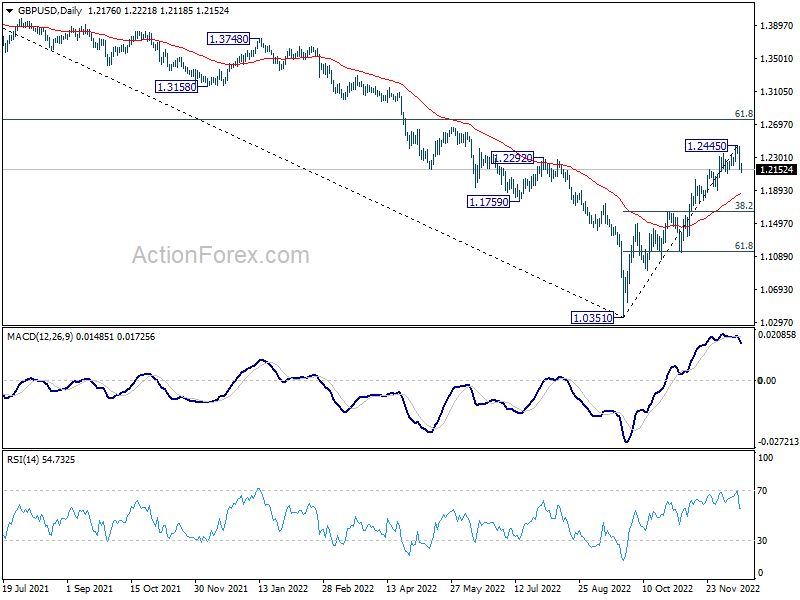
In the bigger picture, rise from 1.0351 medium term bottom is at least correcting whole down trend from 1.4248 (2021 high). Further rise is expected as long as 1.1644 resistance turned support holds. Next target is 61.8% retracement of 1.4248 to 1.0351 at 1.2759. Sustained break there will pave the way back to 1.4248. This will remain the favored case as long as 55 day EMA (now at 1.1853) holds.
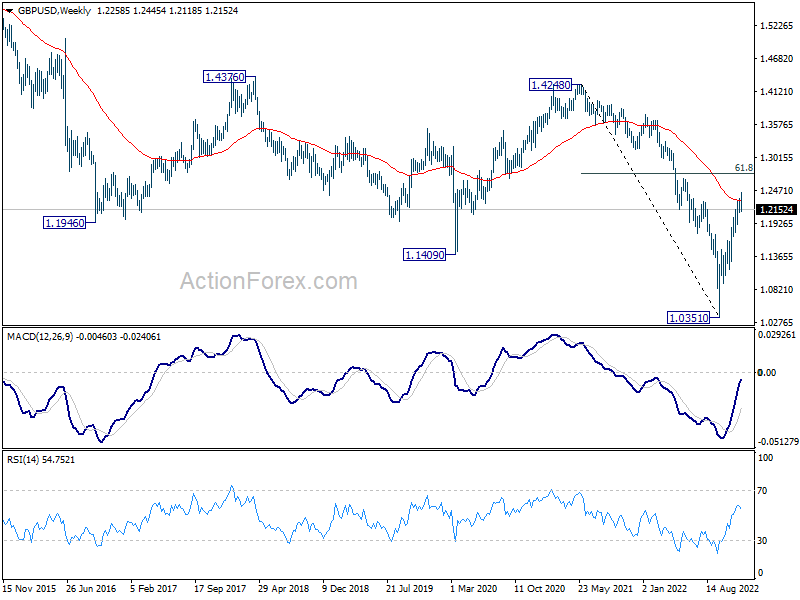
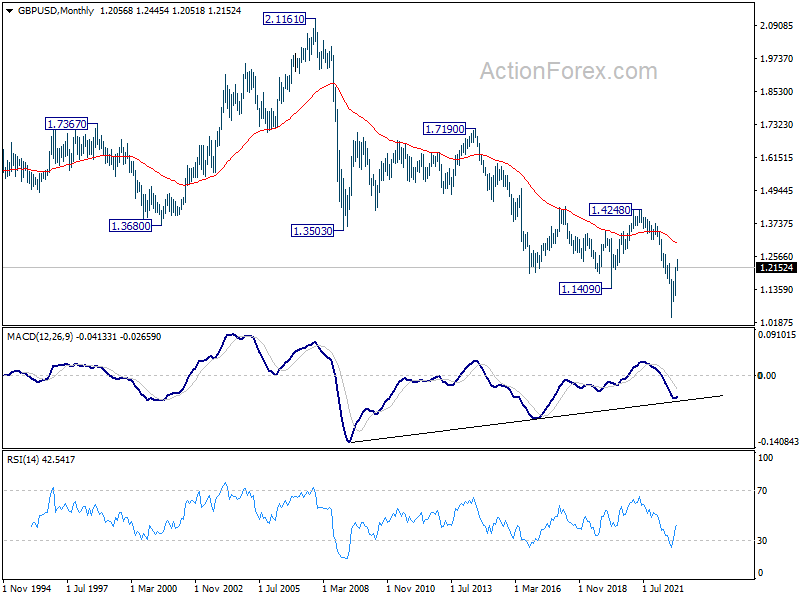
In the longer term picture, as long as 1.4248 resistance holds (2021 high), long term outlook will remain neutral at best. Down trend from 2.1161 (2007) could still resume for another low through 1.0351 at a later stage.
EUR/USD Weekly Outlook
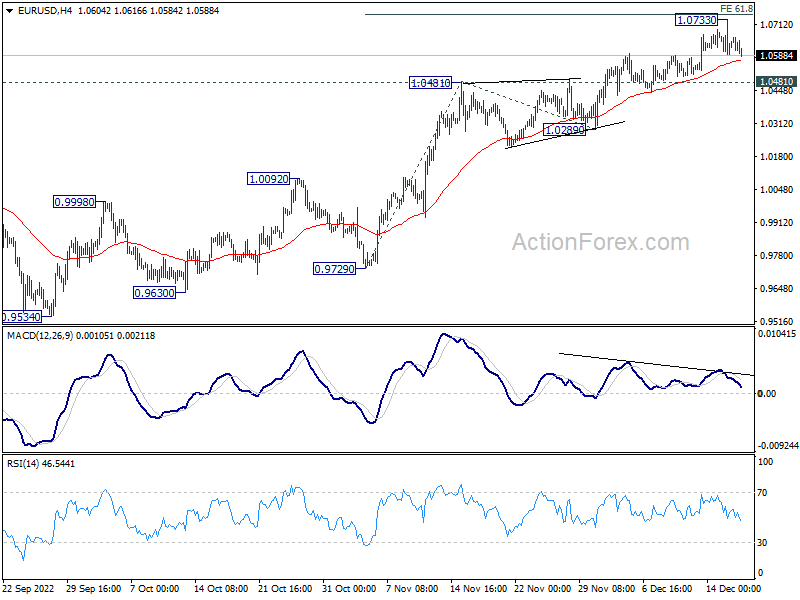
EUR/USD's up trend extended to 1.0733 last week but retreated since then. Initial bias remains neutral this week first. Further rally is expected as long as 1.0481 resistance turned support holds. Firm break of 61.8% projection of 0.9729 to 1.0481 from 1.0289 at 1.0754 will pave the way to 100% projection at 1.1041. However, firm break of 1.0481 will confirm short term topping and bring deeper fall to 1.0289 support.
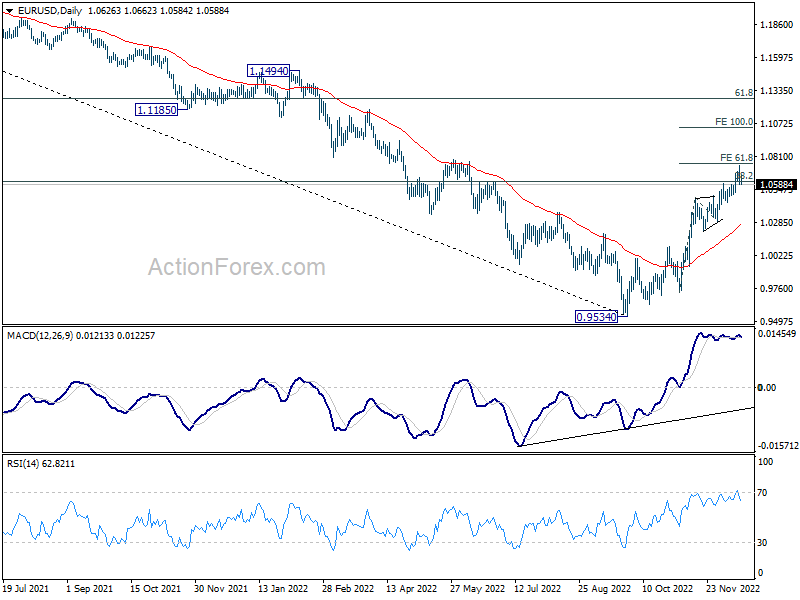
In the bigger picture, focus stays on 38.2% retracement of 1.2348 (2021 high) to 0.9534 at 1.0609. Rejection by 1.0609 will suggest that price actions from 0.9534 medium term bottom are developing into a corrective pattern. Thus, medium bearishness is retained for another fall through 0.9534 at a later stage. However, sustained break of 1.0609 will raise the chance of trend reversal and target 61.8% retracement at 1.1273.
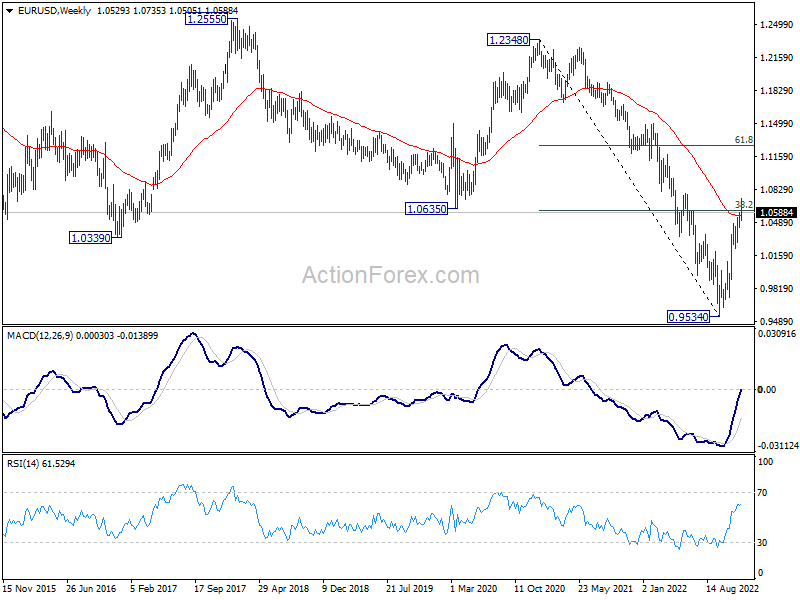
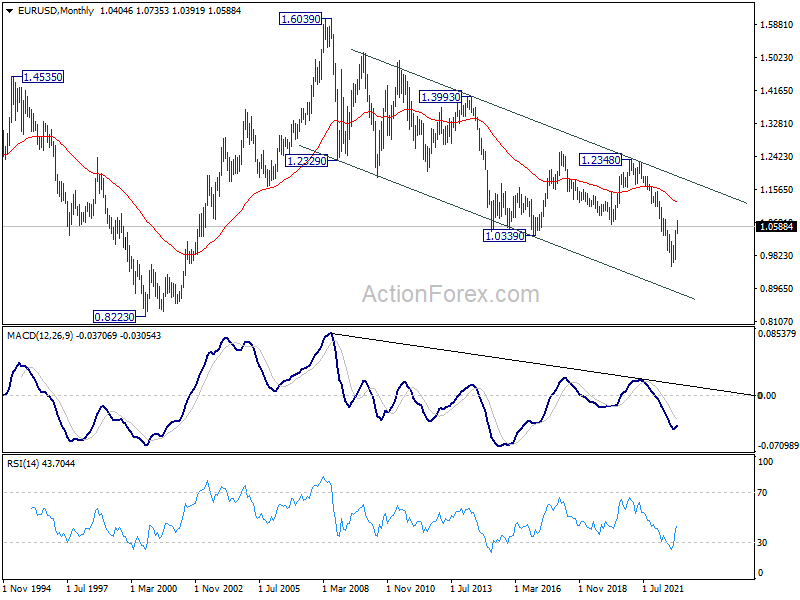
In the long term picture, as long as 1.0635 support turned resistance holds (2020 low), long term down trend from 1.6039 (2008) could still extend through 0.9534 at a later stage. However, sustained break of 1.0635 will confirm bottoming and at least turn long term outlook neutral.
USD/JPY Weekly Outlook
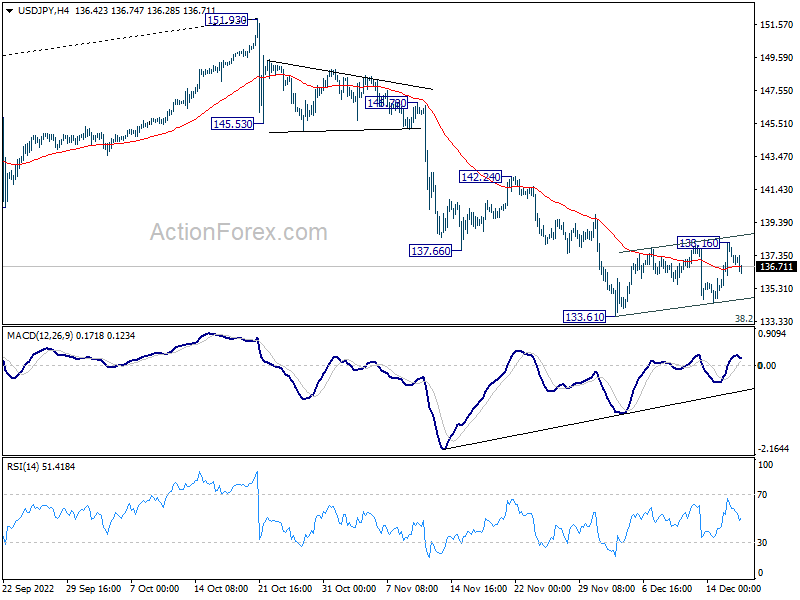
USD/JPY gyrated higher to 138.16 last week but failed to extend the rally. Initial bias is turned neutral this week first. On the upside, break of 138.16 will resume the rebound to 55 day EMA (now at 140.30). On the downside, however, firm break of 133.61 support and 133.07 medium term fibonacci level will confirm resumption of whole fall from 151.93.
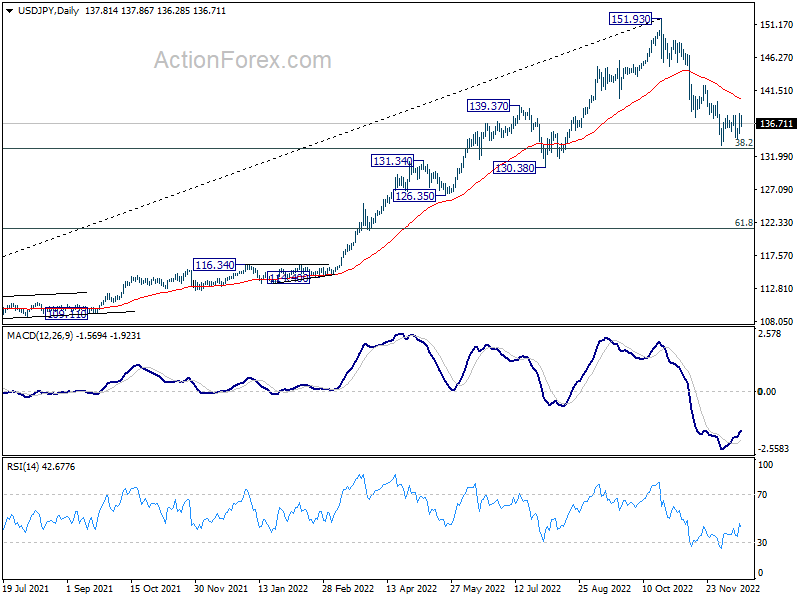
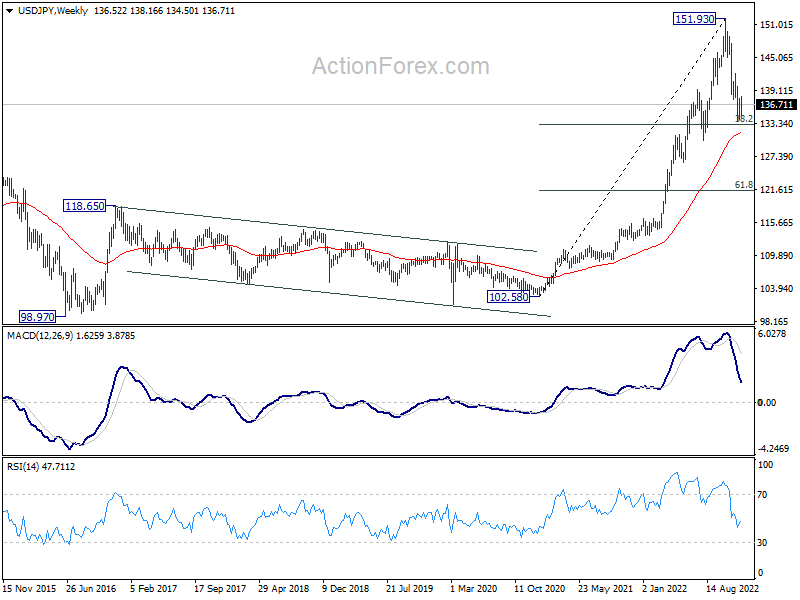
In the bigger picture, price actions from 151.93 medium term could be just a corrective pattern to up trend from 102.58 (2021 low). Strong support from 38.2% retracement of 102.58 to 151.93 at 133.07 and 55 week EMA (now at 131.71) will set the range for such corrective pattern. However, sustained break of 55 week EMA will pave the way to 61.8% retracement at 121.43.
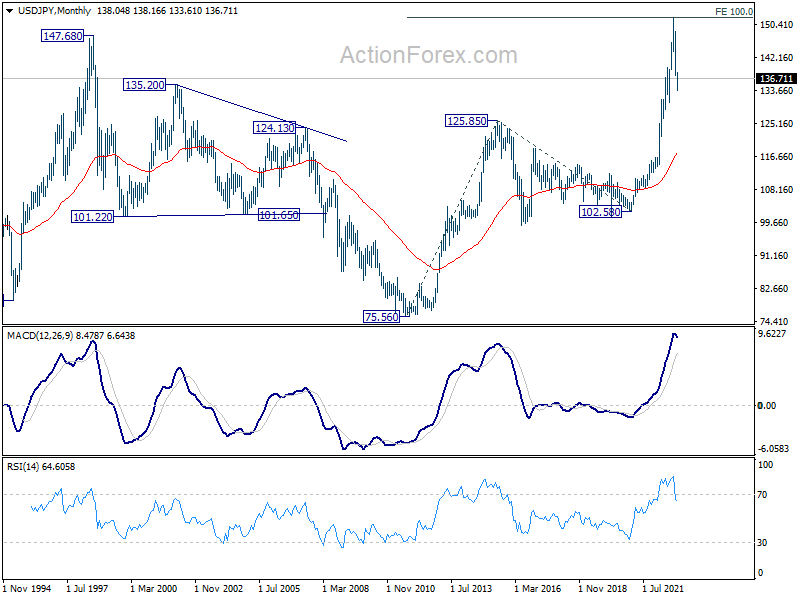
In the long term picture, rise from 102.58, as part of the up trend from 75.56 (2011 low) was put to a halt at 151.93, just ahead of 100% projection of 75.56 to 125.85 from 102.58 at 152.87. There is no clear sign of long term reversal yet. Such up trend is expected to resume at a later stage, as long as 125.85 resistance turned support holds.
GBP/USD Weekly Outlook
GBP/USD rose further to 1.2445 last week but formed a short term top there and reversed. Initial bias is mildly on the downside this week for 55 day EMA (now at 1.1853). Firm break there will target 38.2% retracement of 1.0351 to 1.2445 at 1.1645. For now, risk will stay on the downside as long as 1.2445 resistance holds, in case of recovery.
In the bigger picture, rise from 1.0351 medium term bottom is at least correcting whole down trend from 1.4248 (2021 high). Further rise is expected as long as 1.1644 resistance turned support holds. Next target is 61.8% retracement of 1.4248 to 1.0351 at 1.2759. Sustained break there will pave the way back to 1.4248. This will remain the favored case as long as 55 day EMA (now at 1.1853) holds.
In the longer term picture, as long as 1.4248 resistance holds (2021 high), long term outlook will remain neutral at best. Down trend from 2.1161 (2007) could still resume for another low through 1.0351 at a later stage.
USD/CHF Weekly Outlook
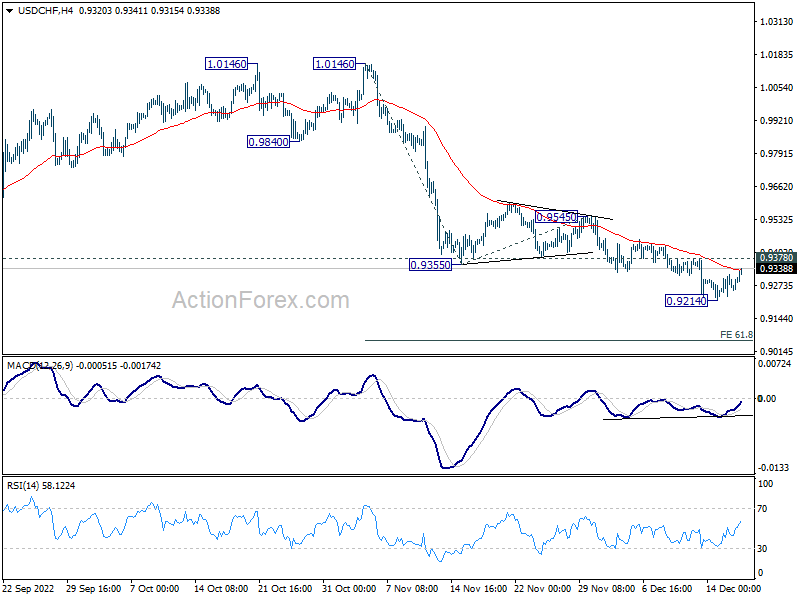
USD/CHF's decline from 1.0146 extended further to 0.9214 last week but recovered again. Initial bias remains neutral this week first. On the downside. break of 0.9214 will resume the fall and target 61.8% projection of 1.0146 to 0.9355 from 0.9545 at 0.9056. However, break of 0.9378 resistance will indicate short term bottoming and turn bias back to the upside for 0.9545 resistance instead.
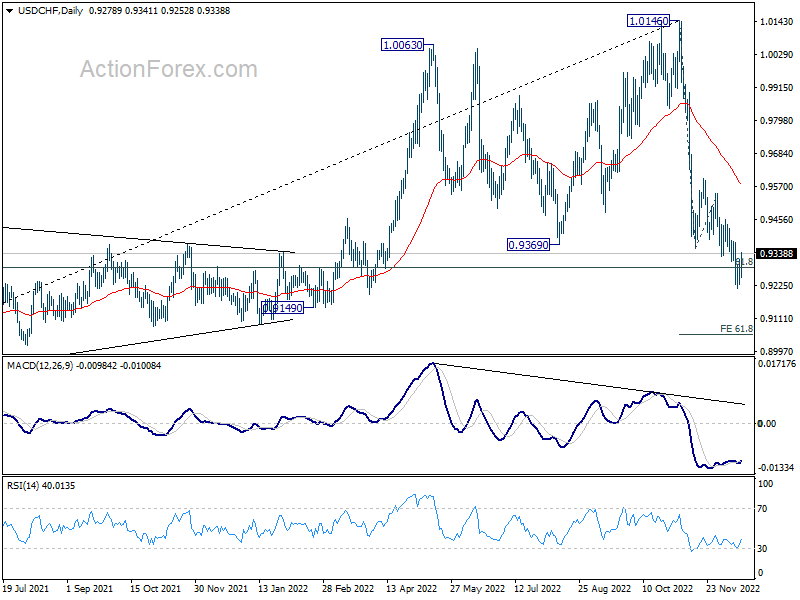
In the bigger picture, rise from 0.8756 (2021 low) has completed at 1.0146, well ahead of 1.0342 long term resistance (2016 high). Based on current downside momentum, fall from 1.0146 might be a medium term down trend itself. Sustained break of 61.8% retracement of 0.8756 to 1.0146 at 0.9287 will pave the way to 0.8756. In any case, risk will stay on the downside as long as 0.9545 resistance holds.
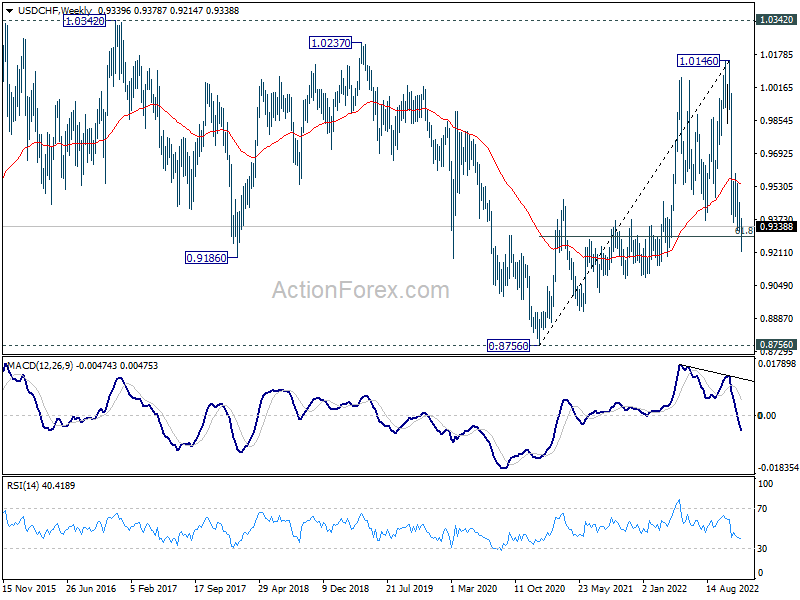
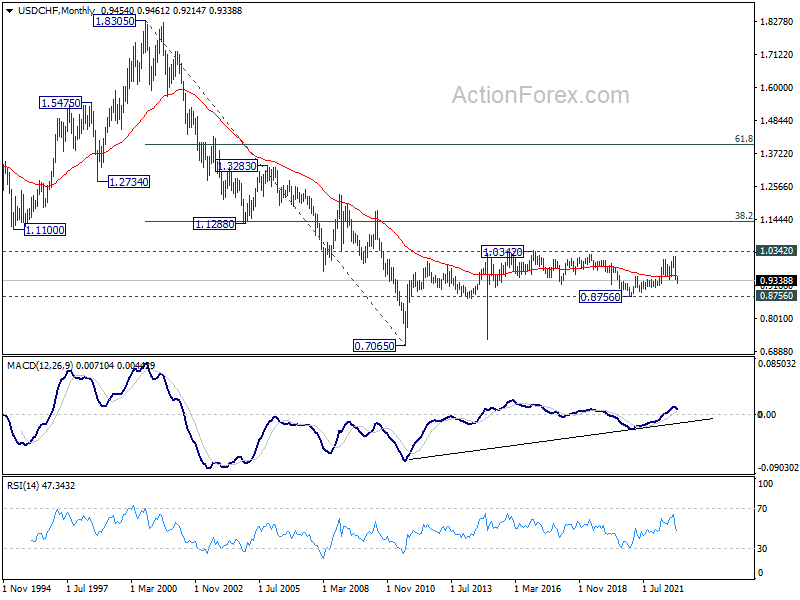
In the long term picture, long term sideway pattern from 1.0342 (2016 high) is extending and it's probably in another medium term down leg. Downside will likely be contained by 0.8756 support in case of deeper fall. Overall, range trading should continue until further development.
AUD/USD Weekly Outlook
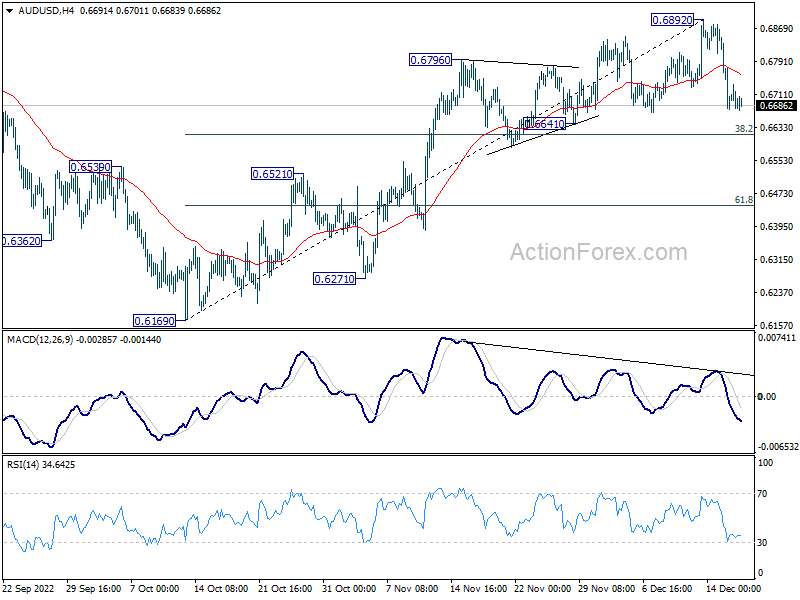
A short term top should be formed at 0.6892 last week after the deep decline from there. Initial bias in AUD/USD remains on the downside this week for 38.2% retracement of 0.6169 to 0.6892 at 0.6616. Sustained break there will suggest rejection by 0.66871 fibonacci level. Deeper fall should then be seen to 61.8% retracement at 0.6445. For now, risk will stay mildly on the downside as long as 0.6892 resistance holds, in case of recovery.
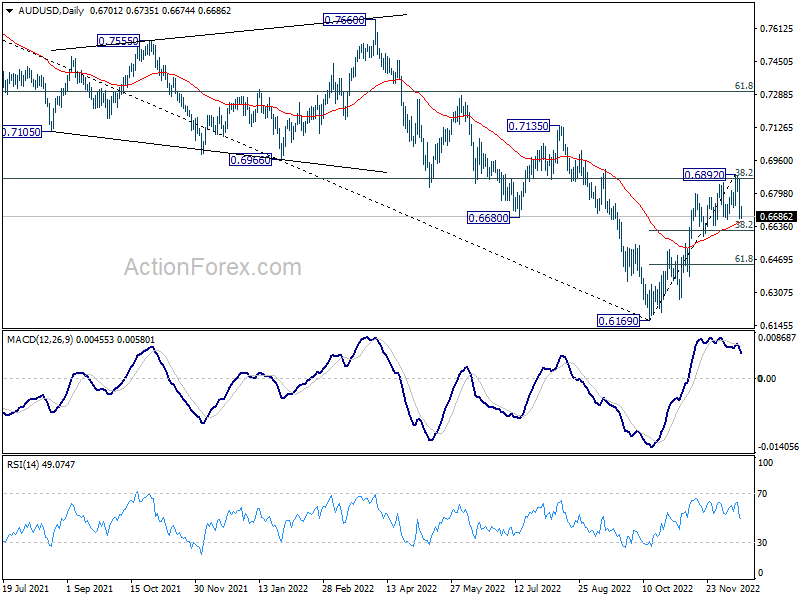
In the bigger picture, it's still unsure if price actions from 0.6169 medium term bottom are developing into a corrective pattern or trend rejection. Rejection by 38.2% retracement of 0.8006 to 0.6169 at 0.6871 will maintain medium term bearishness for another fall through 0.6169 at a later stage. However, firm break of 0.6871, and sustained trading above 55 week EMA (now at 0.6909) will raise the chance of the start of a bullish up trend.
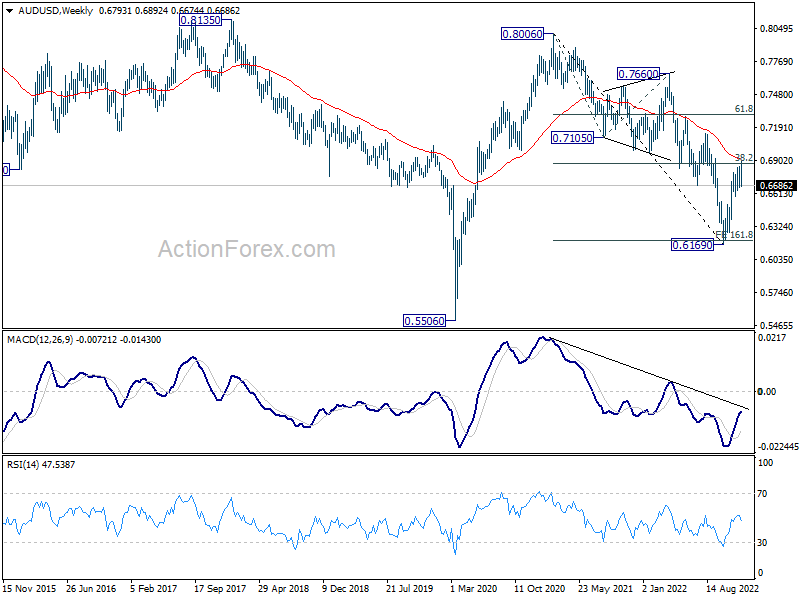
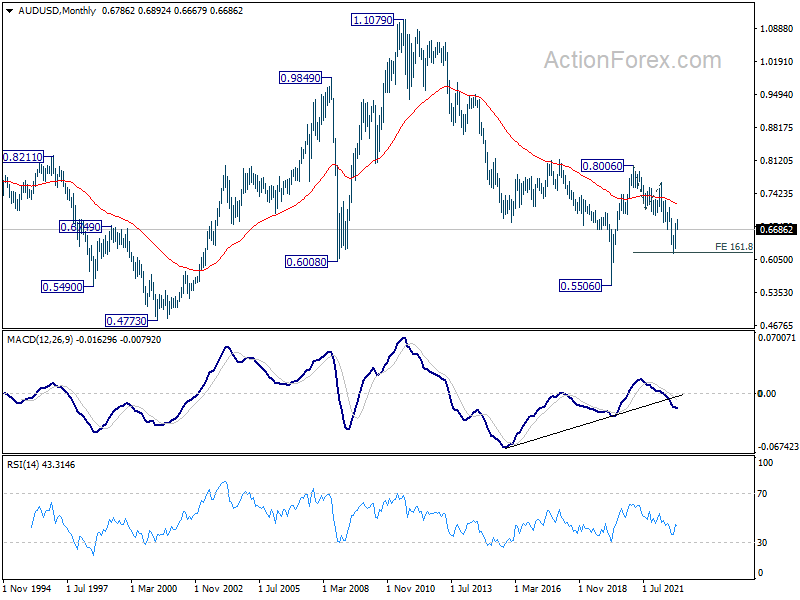
In the long term picture, the down trend from 0.8006 could still be seen as a corrective move, considering that it failed to break through 161.8% projection of 0.8006 to 0.7105 from 0.7660 at 0.6202 decisively. Strong rebound from current level will keep long term outlook neutral first. However, sustained break of 0.6202 will open up deep fall to retest 0.5506.
USD/CAD Weekly Outlook
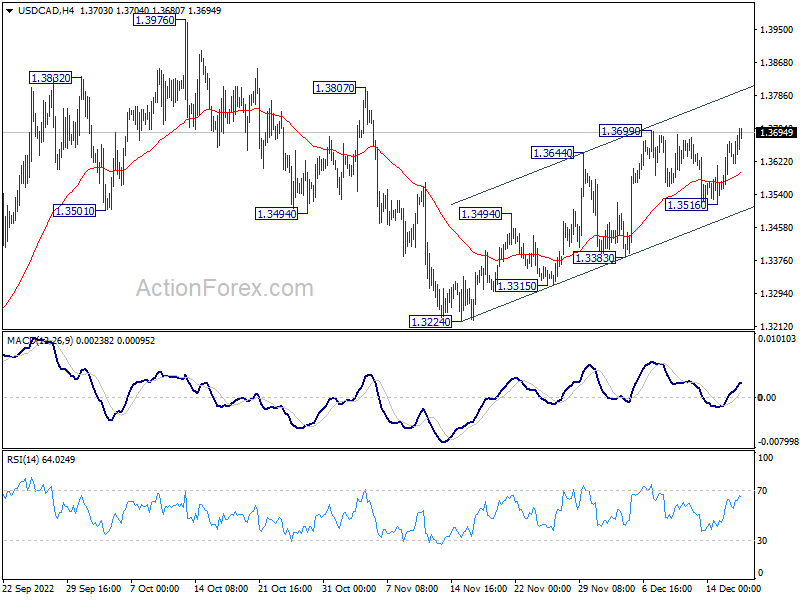
USD/CAD's rise from 1.3224 resumed through 1.3699 last week after interim pull back. Initial bias is back on the upside this week. The favored case is still that correction from 1.3976 has completed at 1.3224. Break of 1.3807 will bring retest of 1.3976 high.
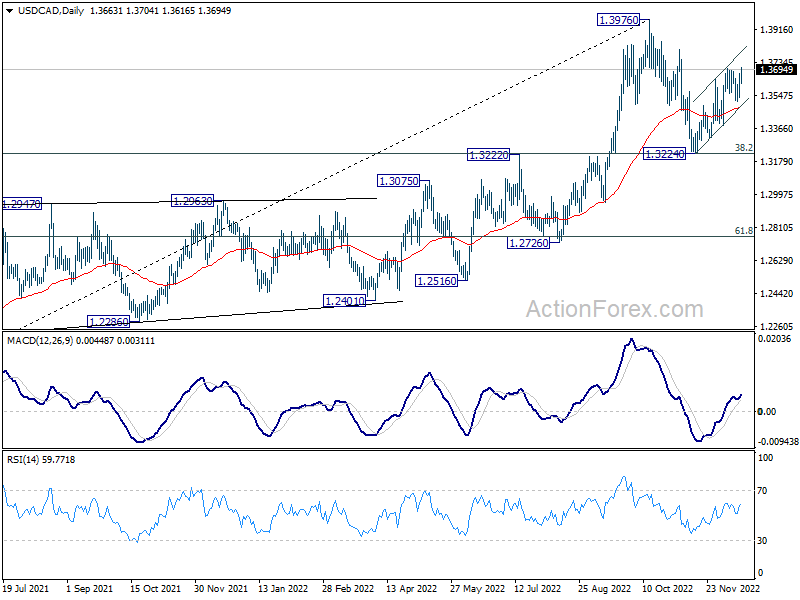
In the bigger picture, as long as 1.3222 cluster support (38.2% retracement of 1.2005 to 1.3976 at 1.3223) holds, larger up trend from 1.2005 (2021 low) is still expected to resume through 1.3976 high at a later stage. However, firm break of 1.3222/3 will indicate that the trend might have reversed. Deeper fall would be seen to next cluster support at 1.2726 (61.8% retracement at 1.2758).
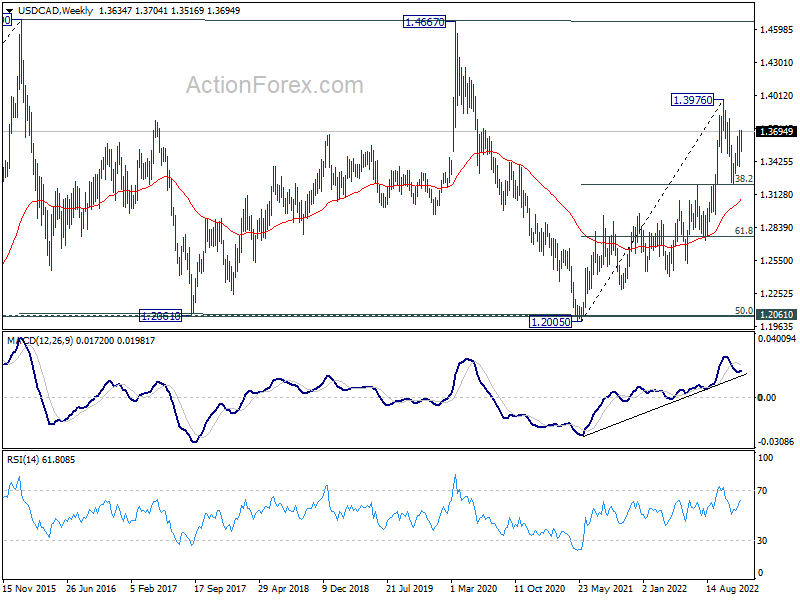
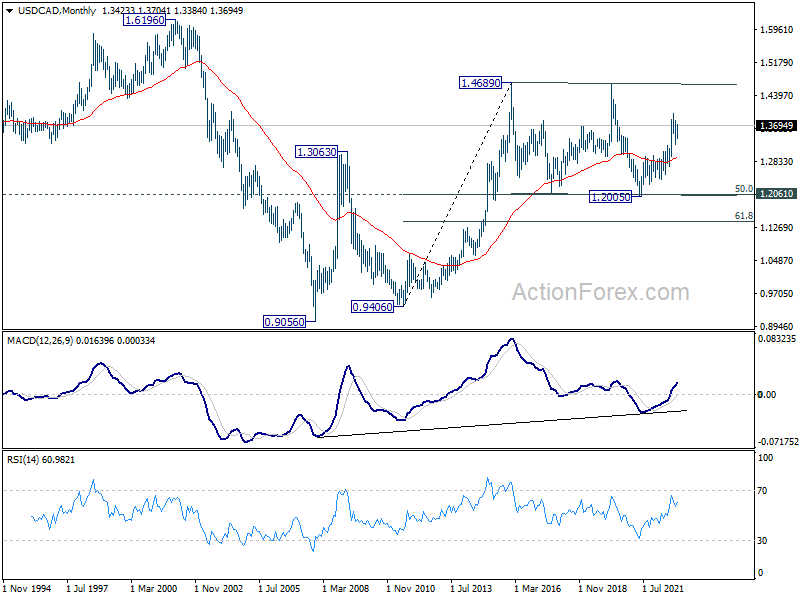
In the longer term picture, price actions from 1.4689 (2016 high) are seen as a consolidation pattern only, which might have completed at 1.2005. That is, up trend from 0.9506 (2007 low) is expected to resume at a later stage. This will remain the favored case as long as 1.2061 support holds, which is close to 50% retracement of 0.9406 to 1.4689 at 1.2048.
GBP/JPY Weekly Outlook
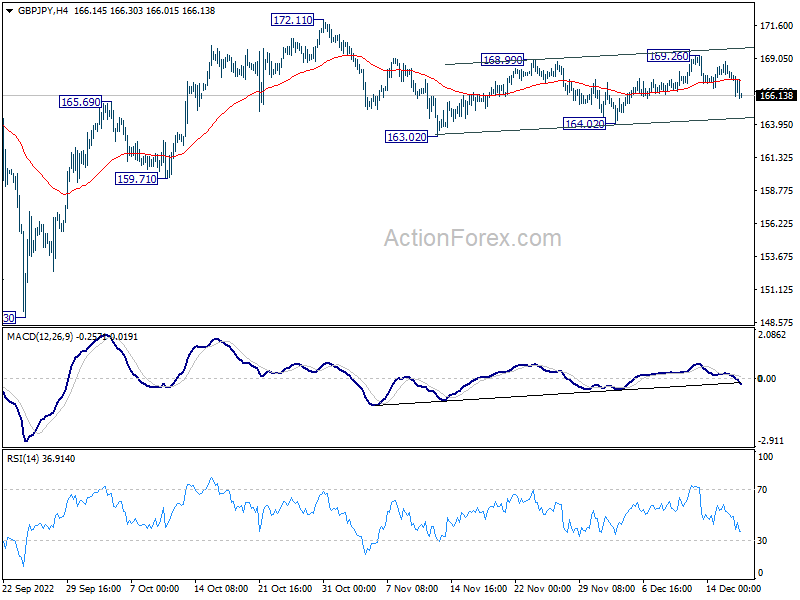
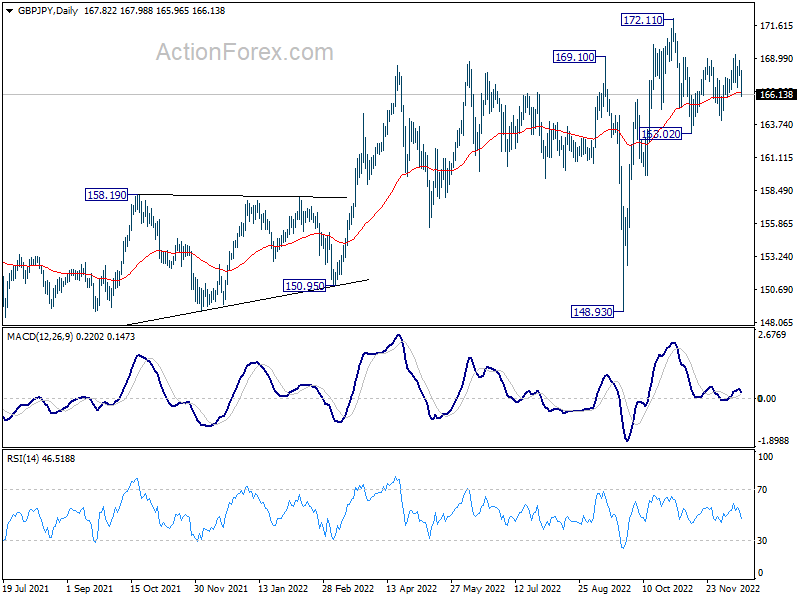
Despite edging higher to 169.26 last week, GBP/JPY quickly reversed. Initial bias remains neutral this week first. On the downside, break of 164.02 support will resume the whole fall from 172.11 through 163.02 support. On the upside, above 169.26 will target a retest on 172.11 high.
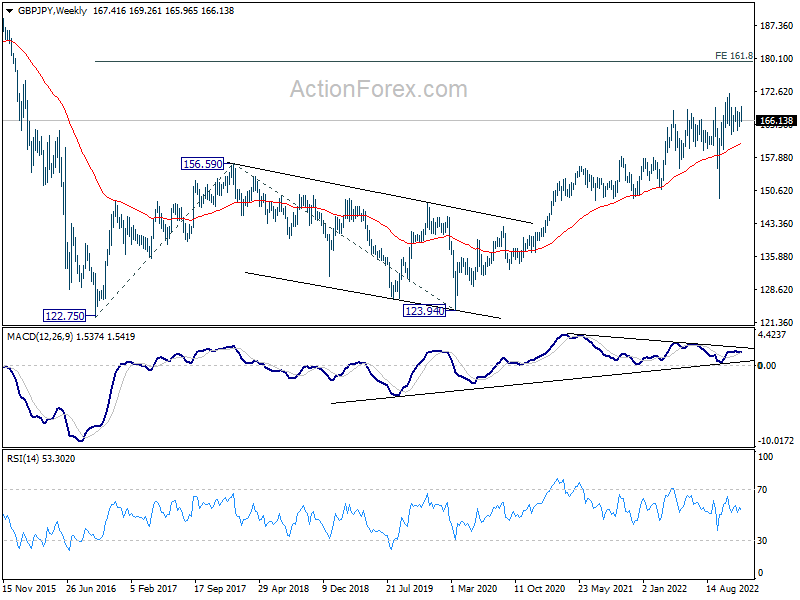
In the bigger picture, medium term upside momentum has been diminishing as seen in bearish divergence condition in weekly MACD. Sustained break of 55 week EMA (now at 161.09) will argue that it's already correcting whole up trend from 123.94 (2020 low). Nevertheless, before that, such up trend could still extend through 172.11 high.
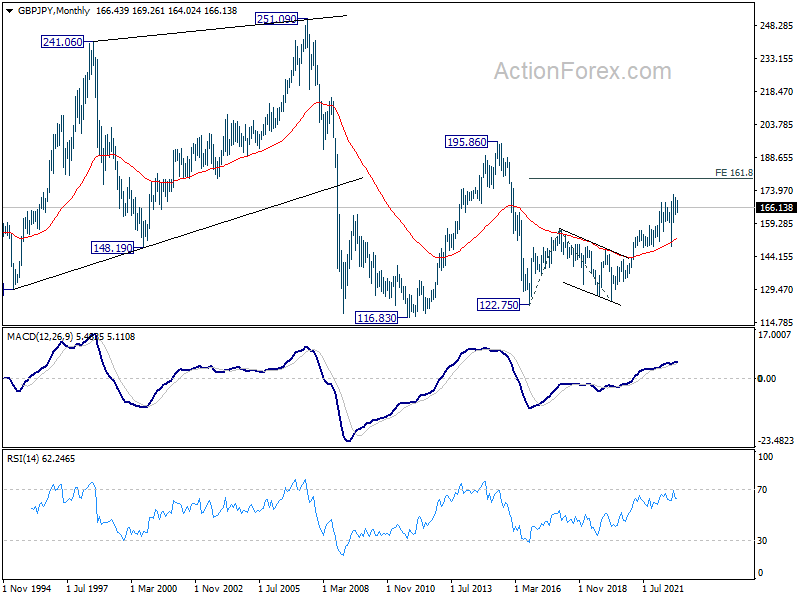
In the longer term picture, as long as 55 month EMA (now at 152.38) holds, rise from 122.75 could still extend higher at a later stage.
EUR/JPY Weekly Outlook
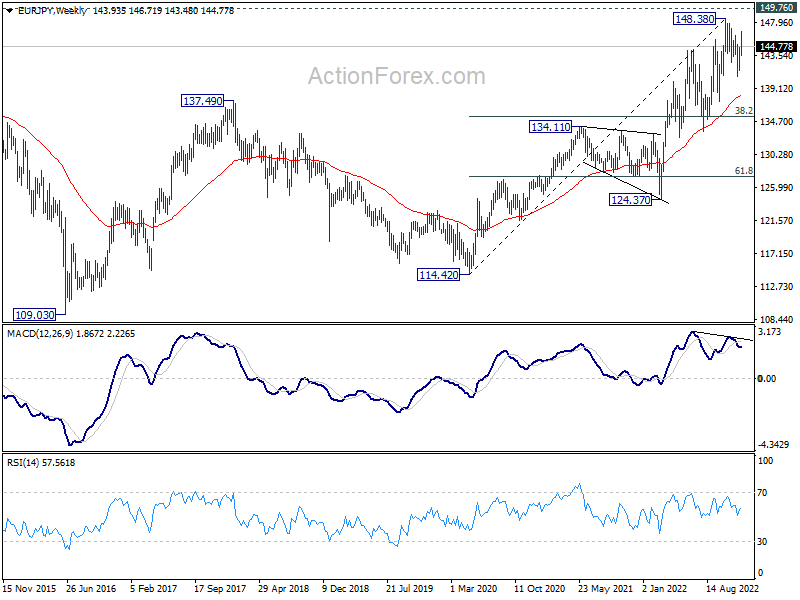
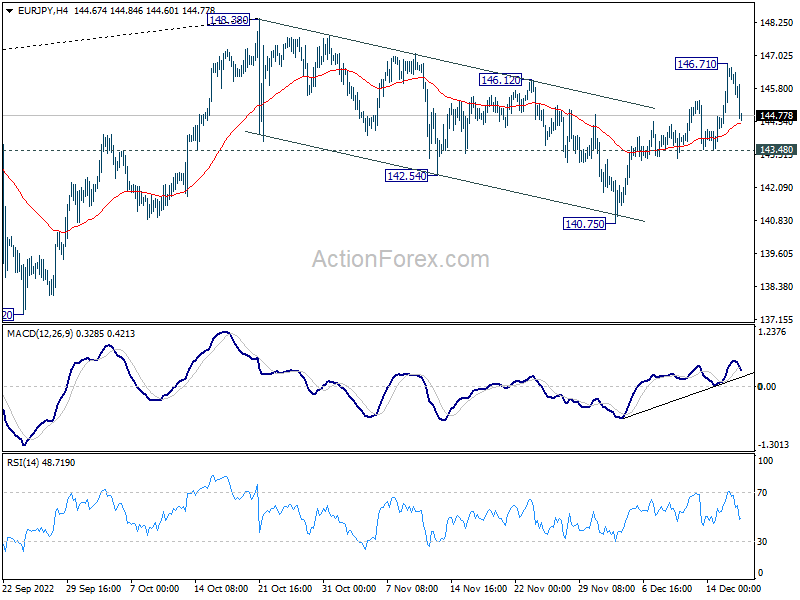
EUR/JPY's rally last week argues that correction from 148.38 has completed at 140.75 already. But as a temporary top was formed at 146.71, initial bias is turned neutral this week first. On the upside, break of 146.71 will resume the rise from 140.75 to retest 148.38 high. However, break of 143.48 support will dampen this bullish case and bring deeper fall back to 140.75 support instead.
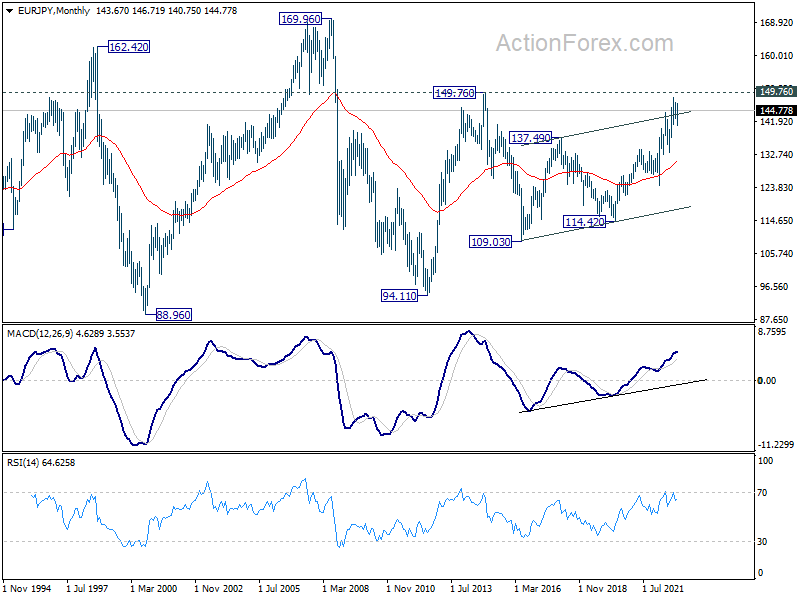
In the bigger picture, as long as 55 week EMA (now at 138.32) holds, larger up trend from 114.42 (2020 low) is still in progress for 149.76 long term resistance. However, firm break of 55 week EMA will bring deeper fall to 38.2% retracement of 114.42 to 148.38 at 135.40 before completing the correction from 148.38.
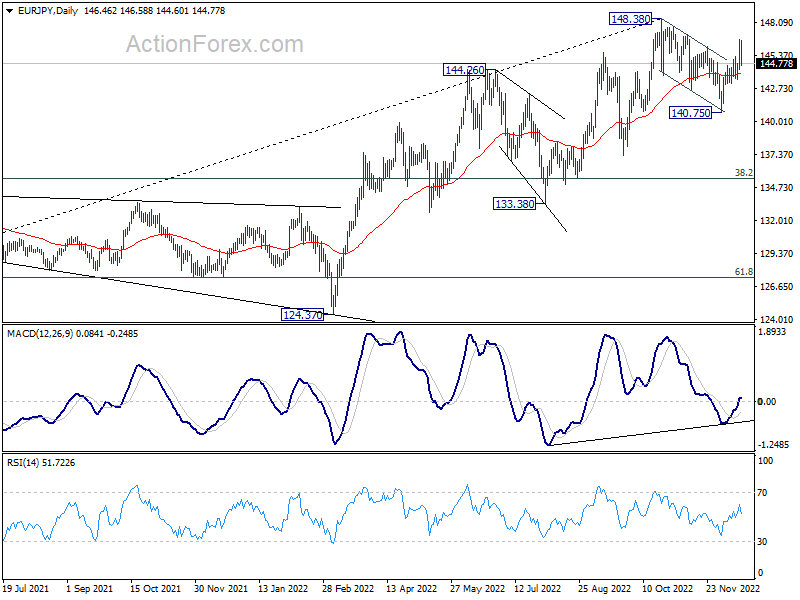
In the long term picture, outlook will stay bullish as long as 134.11 resistance turned support holds (2021 high). Sustained break of 149.76 (2014 high) will open up further rally, as resumption of the rise from 94.11 (2012 low), towards 169.96 (2008 high).