Sample Category Title
Eurozone CPI finalized at 10.1% yoy in Nov, core CPI at 5.0% yoy
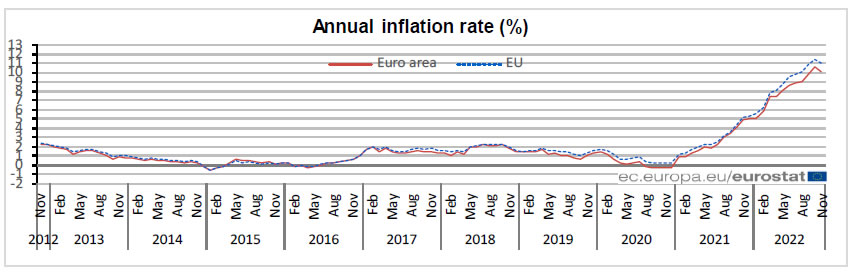
Eurozone CPI was finalized at 10.1% yoy in November, down from October's 10.6% yoy. CPI core was finalized at 5.0%, unchanged from prior month's reading. The highest contribution came from energy (+3.82%), followed by food, alcohol & tobacco (+2.84%), services (+1.76%) and non-energy industrial goods (+1.63%).
EU CPI was finalized at 11.1% mom, down from October's 11.5% yoy. The lowest annual rates were registered in Spain (6.7%), France (7.1%) and Malta (7.2%). The highest annual rates were recorded in Hungary (23.1%), Latvia (21.7%), Estonia and Lithuania (both 21.4%). Compared with October, annual inflation fell in sixteen Member States, remained stable in three and rose in eight.
ECB Rehn: More 50bps hike at least as far as I see in Feb and Mar
ECB Governing Council member Olli Rehn said, "we will stay the course as President (Christine) Lagarde yesterday indicated and this will likely mean 50 basis point rate hikes in the coming meetings, at least as far as I see in February, and March."
Another Governing Council member Robert Holzmann said the signal that more 50bps rate hikes are coming was "a toughly hawkish statement that for me is equivalent to the 75". He added that ECB could "go deep into restrictive territory if needed".
ECB Villeroy: The match is over in fighting inflation
ECB Governing Council member Francois Villeroy de Galhau told BFM Business radio that "the match is not over" in fighting inflation, adding that rate hikes remain the main tool.
Regarding the quantitative tightening on the APP by EUR 15B per month from March, he said, "we will re-examine it in June and we will probably increase the reduction starting in July,"
"The European economy is more resilient than we feared even a few weeks ago," he said. "There will be a strong slowdown in 2023. We will escape what certain people call a hard landing. We will have a rather significant rebound in 2024 and 2025."
USDCAD Stuck in Range, Supported by 50-day SMA
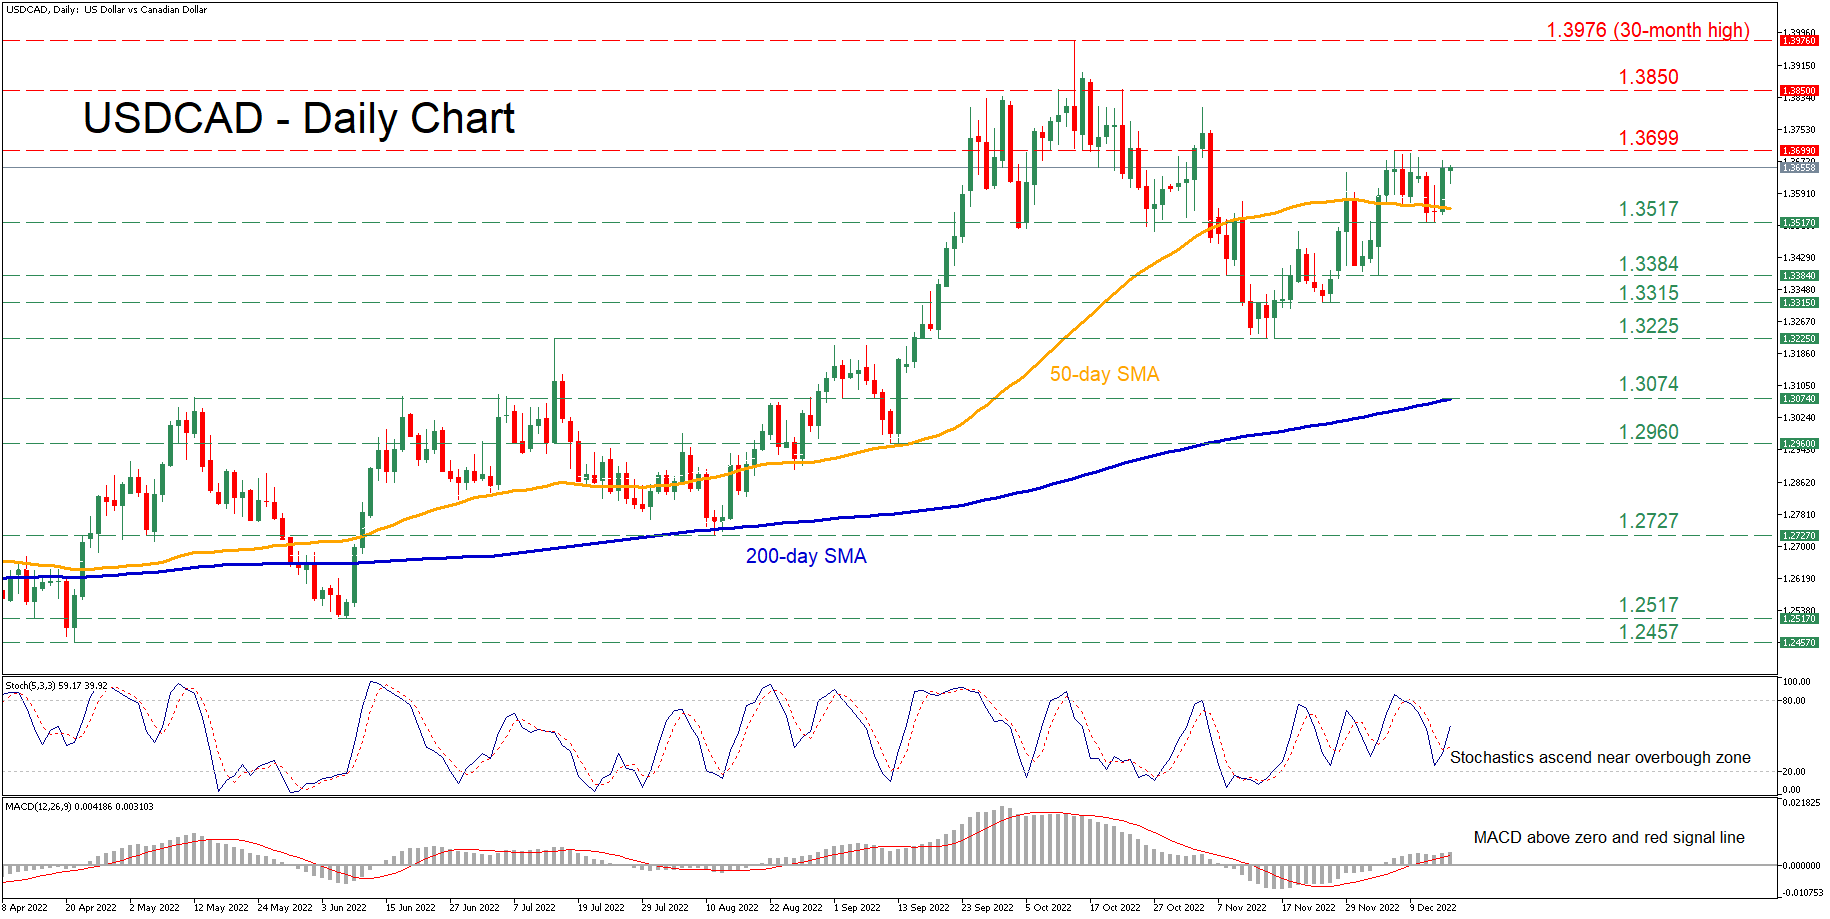
USDCAD has been in an uptrend since March, storming to a fresh 30-month high of 1.3976 before experiencing a downside correction. Even though the pair erased part of its recent pullback, it has been rangebound in the last few daily sessions, with the 50-day simple moving average (SMA) capping its downside.
The momentum indicators currently suggest that bullish forces are intensifying. Specifically, the stochastic oscillator is ascending after posting a bullish cross, while the MACD histogram is strengthening above both zero and its red signal line.
Should bullish forces persist, the price could edge higher to test the recent resistance region of 1.3699. Piercing through this zone, the spotlight could then turn to the 1.3850 barrier registered in October. An upside violation might then set the stage for the 30-month high of 1.3976.
Alternatively, if bearish forces regain control and push the price below the 50-day SMA, immediate support could be met at the recent low of 1.3517. Sliding beneath that floor, the bears could aim for 1.3384 before the 1.3315 hurdle appears on the radar. Failing to halt there, further declines may cease at the November low of 1.3225.
Overall, USDCAD is lacking a clear direction in the short-term picture after its rebound failed to strengthen. Therefore, a break above or below its recent range could be followed by a significant move towards the same direction.
GBP/USD: The Cable Dips Further on Renewed Risk Aversion
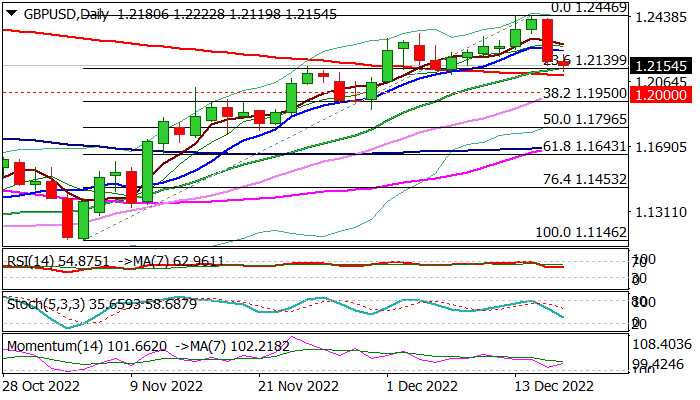
Cable remains in red on Friday and extends lower after nearly 2% drop on Thursday, pressured by renewed risk aversion after major central banks showed unexpectedly hawkish stance and prompted investors into safety of dollar.
Weaker than expected UK retail sales in November added to weakened sentiment, which offset potential positive impact upbeat UK services PMI.
Technical studies on daily chart weakened, although indicators are still positively aligned, but formation of reversal pattern and overbought studies on weekly chart warn of deeper pullback.
Fresh bears cracked initial Fibo support at 1.2219 (23.6% of 1.1146/1.2446 upleg) and pressure pivotal 200 DMA (1.2098), where headwinds could be expected.
Break here would risk extension towards key supports at 1.2000/1.1950 (psychological / Fibo 38.2%) break of which would sideline larger bulls and open way for deeper correction of an uptrend from Sep 26 multi-decade low (1.0342).
Broken daily Tenkan-sen (1.2276) reverted to solid resistance which should cap and keep fresh bears in play.
Res: 1.2239; 1.2276; 1.2446; 1.2520.
Sup: 1.2098; 1.2000; 1.1950; 1.1900.
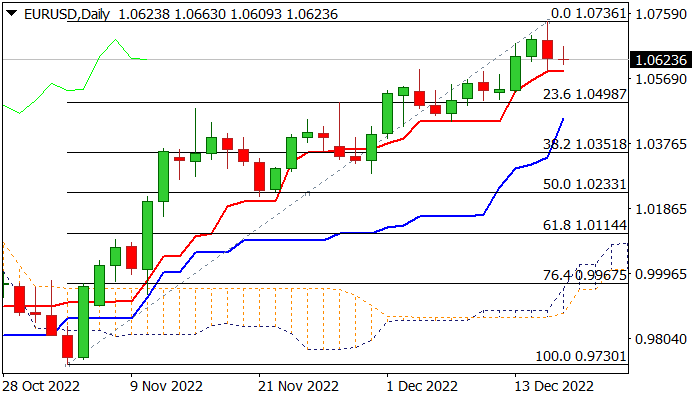
EUR/USD: Larger Bulls to Stay Intact above Daily Tenkan-Sen
The Euro remains at the back foot in European trading on Friday, after Thursday’s drop and formation of bearish engulfing which weighs on near-term action.
Larger bulls lost traction on approach to pivotal Fibo barrier at 1.0746 (61.8% of 1.1494/0.9535), but the pullback was so far shallow and contained by daily Tenkan-sen (1.0589).
Immediate bias is expected to remain with bulls while Tenkan line protects the downside and signal narrow consolidation before larger bulls resume.
The pair is on track for bullish weekly close that supports the notion, however caution is required as weekly indicators are overstretched and falling weekly cloud continues to pressure (cloud base lays at 1.0782).
Watch daily Tenkan-sen as break here would risk deeper pullback and put bulls on hold for potential test of pivotal 1.0350 support zone (Fibo 38.2% of 0.9730/1.0736 upleg, reinforced by 200DMA).
Res: 1.0663; 1.0746; 1.0782; 1.0936.
Sup: 1.0589; 1.0564; 1.0498; 1.0443.
Swiss Franc Reverses Slide after SNB Hike
SNB raises rates by 50 bp, Swiss franc rises
Major central banks were in the spotlight this week, as the Federal Reserve and the European Central Bank raised rates by 50 basis points at their final meeting of the year. These moves overshadowed a 50 bp rate increase by the Swiss National Bank, where rate moves are unusual – this week’s rate increase, which brought the benchmark rate to 1.0%, was only the third hike this year.
The driver behind the rate hike was the all-familiar battle to curb inflation. Switzerland’s inflation rate of 3% pales in comparison to the eurozone (10.0%) or the US (7.1%), but is above the SNB’s target of 0-2%. The SNB has been aggressive, raising rates by 50 bp in June and an oversize 75-bp hike in September. After years of negative rates, the Bank has dramatically changed policy, responding to what it called a “challenging situation” in a press release after the meeting.
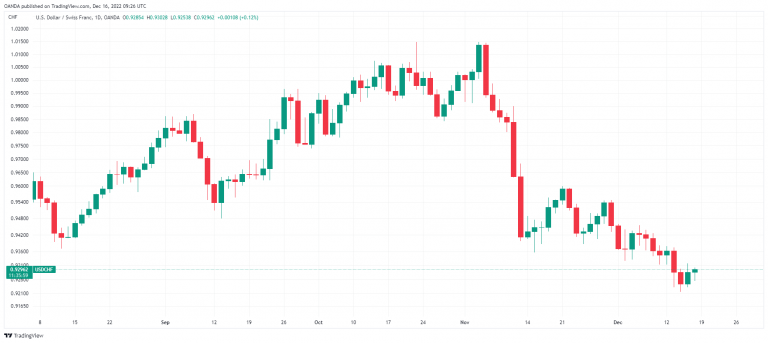
The SNB also reminded the markets that it was “willing to be active in the foreign exchange market as necessary”. The Bank has not hesitated in the past to intervene in order to prevent the Swiss franc from climbing too high and damaging the export sector. USD/CHF has declined over 7% since November 1st, and the SNB will be watching to see if the Swiss franc’s appreciation continues.
The markets are still digesting the Fed’s hawkish stance at this week’s meeting. Actually, anyone who has been listening to Jerome Powell and FOMC members would see that the Fed reiterated that it would continue to raise rates and that inflation remained far too high. The markets, however, have been marching to their own beat, expecting that a series of soft inflation reports might change the Fed’s tune.
There was talk of the Fed winding up its current rate cycle in February, but the rate statement dampened such hopes, stating that the Fed expected “”ongoing increases” in interest rates.” Powell dismissed the recent drop in inflation, saying more evidence was required that the downward trend was sustainable. It seems a given after this hawkish meeting that the terminal rate is likely to rise above 5%, with some forecasts projecting that rates will go as high as 5.6%.
USD/CHF Technical
- USD/CHF is testing resistance at 0.9285. The next resistance line is at 0.9372
- There is support at 0.9228 and 0.9144
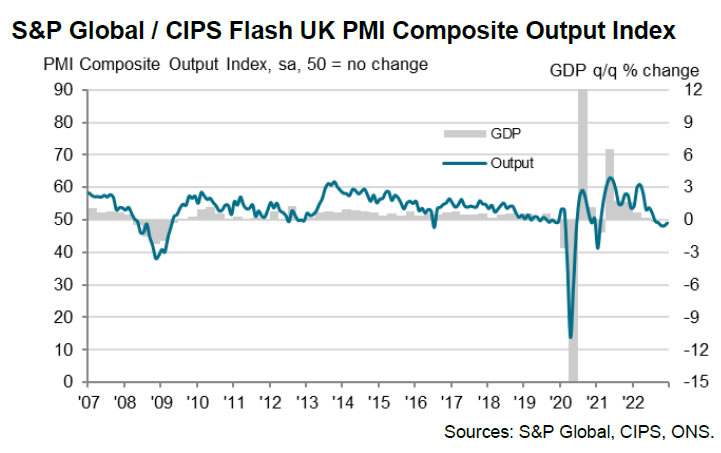
UK PMI manufacturing fell to 44.7, services recovery to 50.0
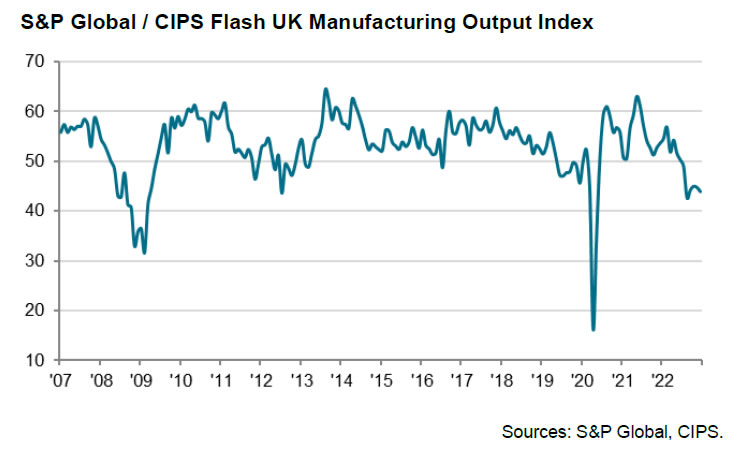
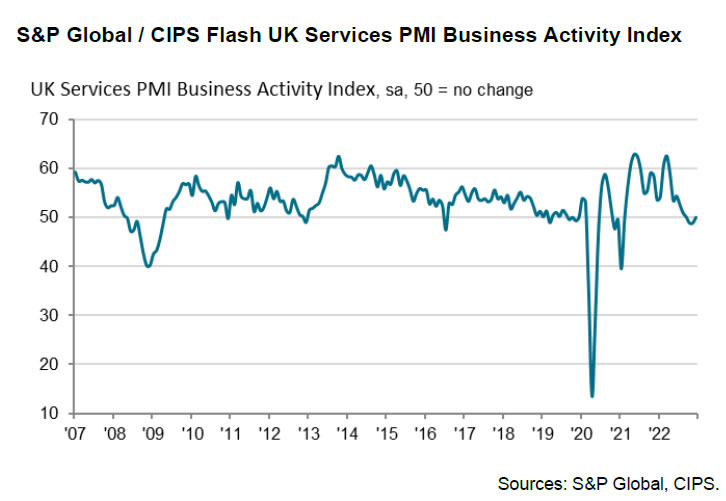
UK PMI Manufacturing dropped from 46.5 to 44.7 in December, a 31-month low. PMI Services rose from 48.8 to 50.0. PMI Composite rose from 48.2 to 49.0.
Chris Williamson, Chief Business Economist at S&P Global Market Intelligence said: "The December data add to the likelihood that the UK is in recession, with the PMI indicating a 0.3% GDP contraction in the fourth quarter after the 0.2% decline seen in the three months to September.
"For now, the downturn looks to be relatively mild, and the easing in the rate of decline in December is encouraging news, as is the further marked cooling of inflationary pressures. However, the fact that the downturn has moderated compared to the turmoil created in the immediate aftermath of the botched "mini budget", most notably in financial services, is no real cause for cheer. It is especially worrying to see business confidence and order book indicators remain so low by historical standards, with both of these key gauges signalling heightened degrees of economic stress.
"Hence it's no surprise to see that businesses are battening down the hatches, most notably by reducing headcounts, in a sign that the downturn not only has further to run but could yet accelerate again, especially given December's further hike to interest rates."
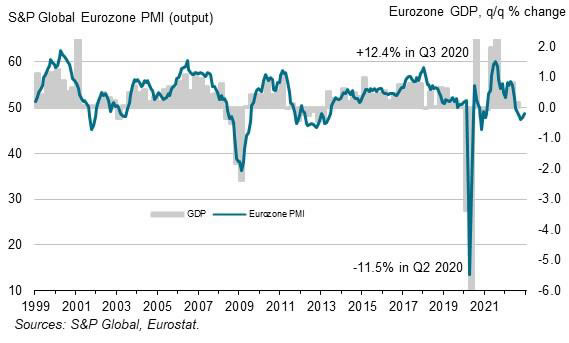
Eurozone PMI composite rose to 48.8, consistent with -0.2% GDP contraction in Q4
Eurozone PMI Manufacturing rose from 47.1 to 47.8 in December. PMI Services rose from 48.5 to 49.1. PMI Composite rose from 47.8 to 48.8. Still, the downside extended into its sixth successive month, even though rate of decline moderated.
Chris Williamson, Chief Business Economist at S&P Global Market Intelligence said: "While the further fall in business activity in December signals a strong possibility of recession, the survey also hints that any downturn will be milder than thought likely a few months ago. The data for the fourth quarter are consistent with GDP contracting at a quarterly rate of just less than 0.2%, and forward-looking indicators are currently boding well for the rate of decline to ease further in the first quarter."
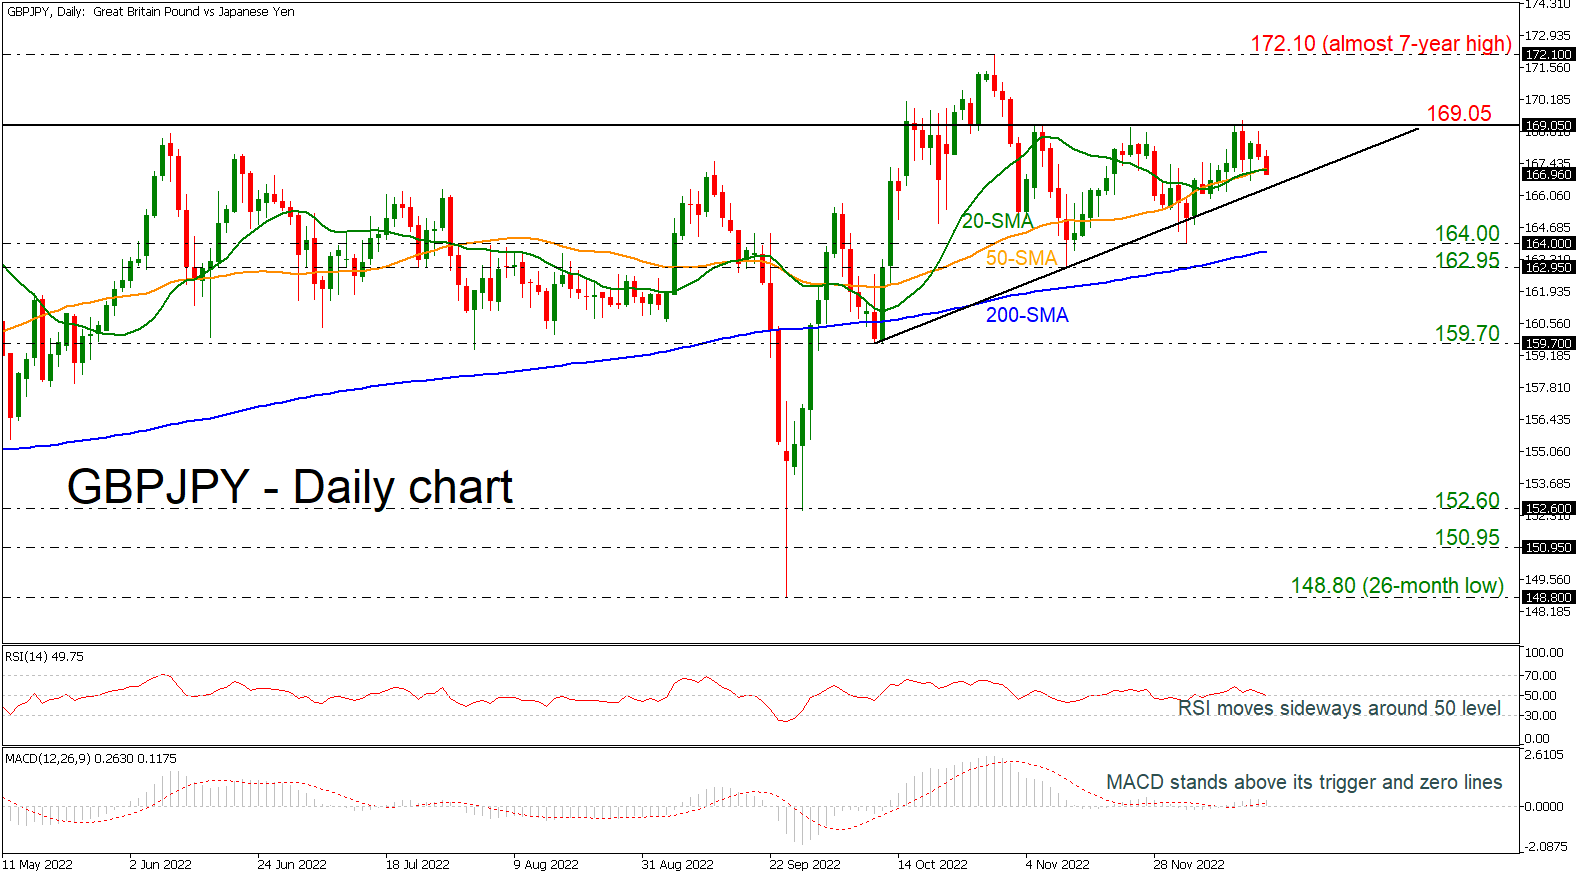
GBPJPY Hovers in Ascending Triangle Near 167.00
GBPJPY reversed to the downside to test its short-term simple moving averages (SMAs) after the pullback off the 169.05 barrier.
Although the pair has been printing higher lows above September's trough, it was unable to find enough buying power to chart new highs. In other discouraging signals, the RSI is pointing downwards near the neutral threshold of 50, while the MACD is moving with weak momentum near its trigger and zero lines.
Should the pair stretch south and break the upward line, it may find immediate support at the 164.00 round number and then near the 200-day SMA at 163.65. A significant step lower could worsen bearish sentiment, sending the price probably to 162.95. Then, a sharper decline could follow towsards the 159.70 support.
On the flip side, the 169.05 obstacle may halt again bullish actions, preventing a rally towards the almost seven-year high of 172.10. If traders continue to buy the pair, the price could rise until the inside swing low from April 2015 at 175.00.
In the short-term picture, GBPJPY is trading within an ascending triangle. While the formation is a bullish signal, traders will wait for a climb above 169.05 before they drive the pair higher. Alternatively, a break below the diagonal line could renew selling pressures.