

Sample Category Title
EUR/AUD Daily Outlook
Daily Pivots: (S1) 1.5520; (P) 1.5591; (R1) 1.5687; More...
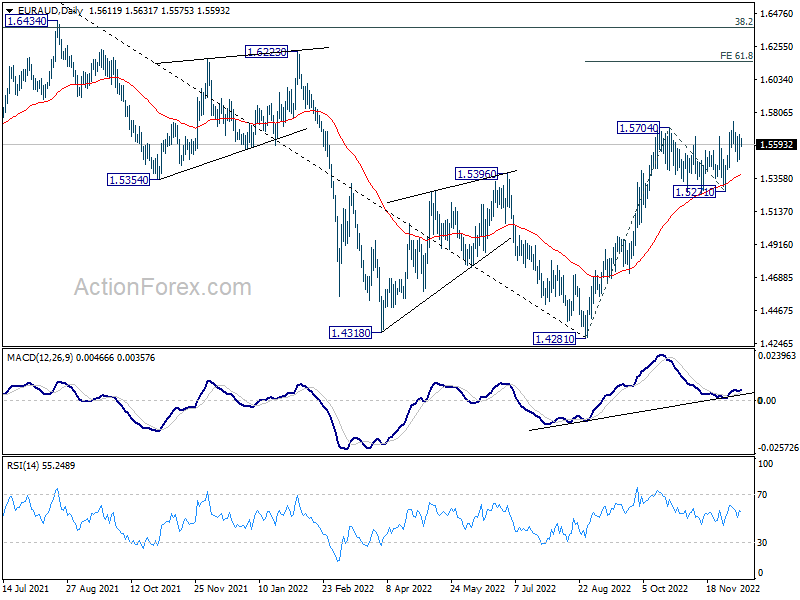
EUR/AUD is staying in consolidation from 1.5747 and intraday bias remains neutral at this point. As long as 1.5271 support holds, further rally is expected. On the upside, firm break of 1.5747 will resume larger rally from 1.4281. Next target is 61.8% projection of 1.4281 to 1.5704 from 1.5271 at 1.6150.
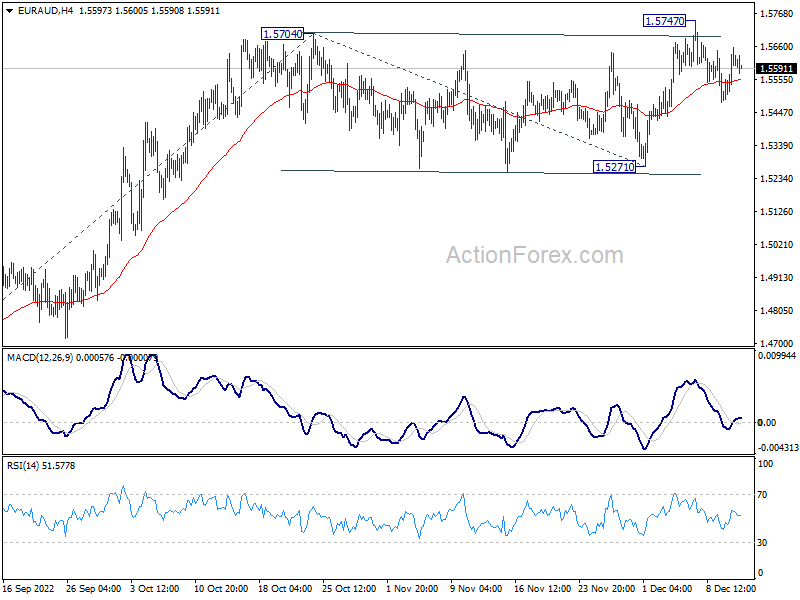
In the bigger picture, as long as 1.5271 support holds, rise from 1.4281 medium term bottom is expected to continue to 1.6434 key resistance next. However, firm break of 1.5271 will argue that such rebound has completed, and keep medium term outlook neutral at best. But in this case, more range trading should be seen above 1.4281 low first.
GBP/JPY Daily Outlook
Daily Pivots: (S1) 167.61; (P) 168.32; (R1) 169.50; More...
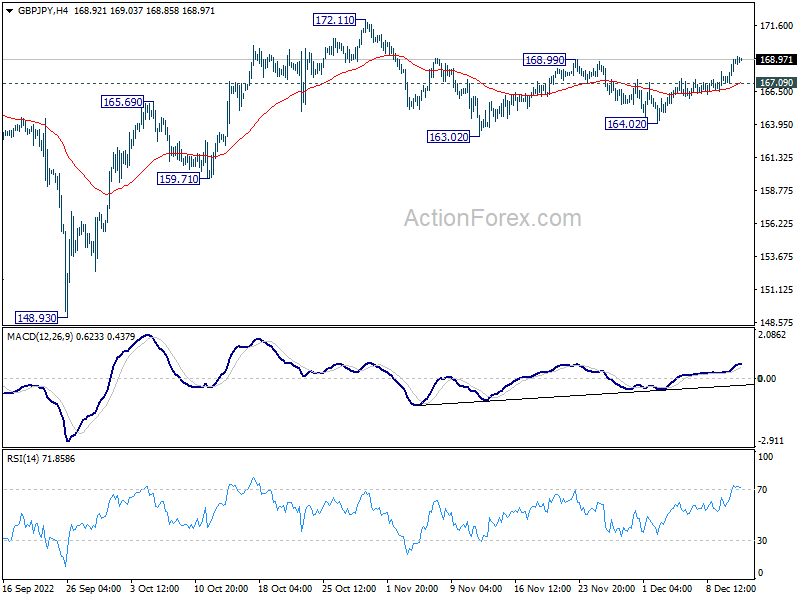
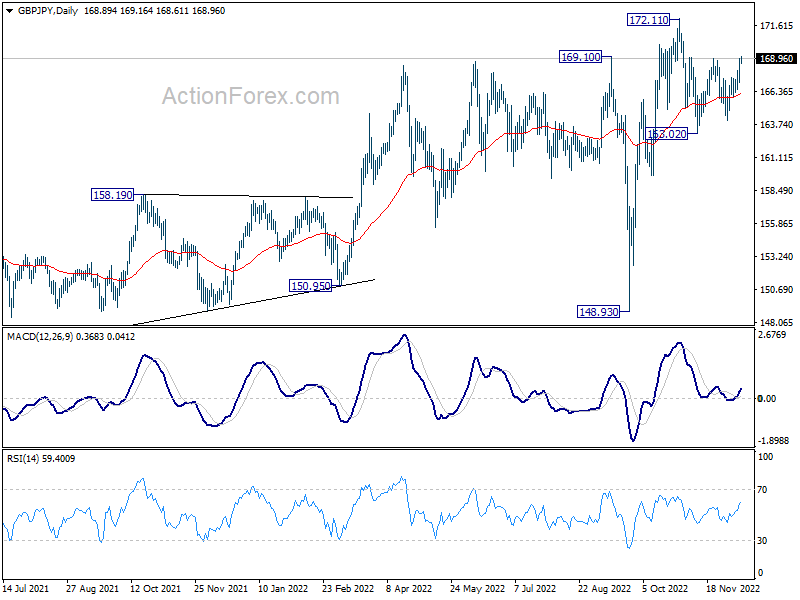
GBP/JPY's break of 168.99 resistance suggests that rebound from 163.02 is resuming. Intraday bias is back on the upside for retesting 172.11 high. Firm break there will resume larger up trend. On the downside, however, break of 167.09 will turn intraday bias neutral again , and extend near term corrective pattern.
In the bigger picture, medium term upside momentum has been diminishing as seen in bearish divergence condition in weekly MACD. Sustained break of 55 week EMA (now at 160.90) will argue that it's already correcting whole up trend from 123.94 (2020 low). Nevertheless, before that, such up trend could still extend through 172.11 high.
Technical Outlook and Review
USD/JPY:
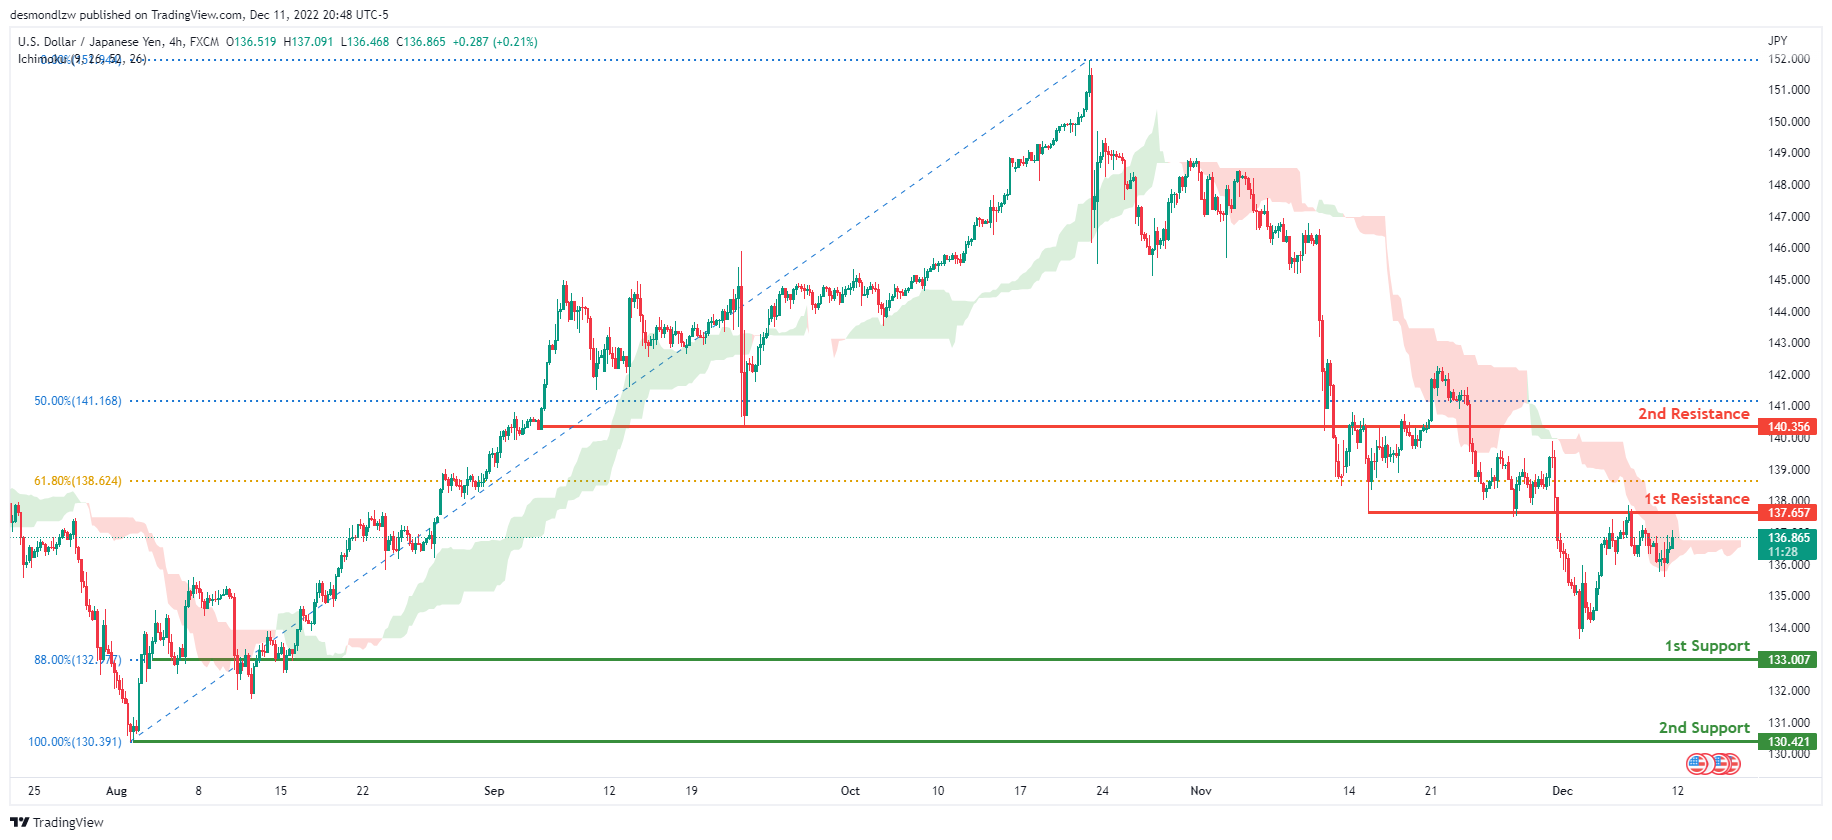
The current general bias for USDJPY on the H4 chart is bearish. To add confluence to this, the price is crossing under the Ichimoku cloud which indicates a bearish market. If the bearish momentum continues, expect USDJPY to continue heading towards the 1st support at 133.007 where the 88% Fibonacci line is. In an alternative scenario, price could head back up to retest the 1st resistance line at 137.657, where the 61.8% Fibonacci line and previous low are located.
Areas of consideration:
- H4 time frame, 1st resistance at 137.657
- H4 time frame, 1st support at 133.007
DXY:
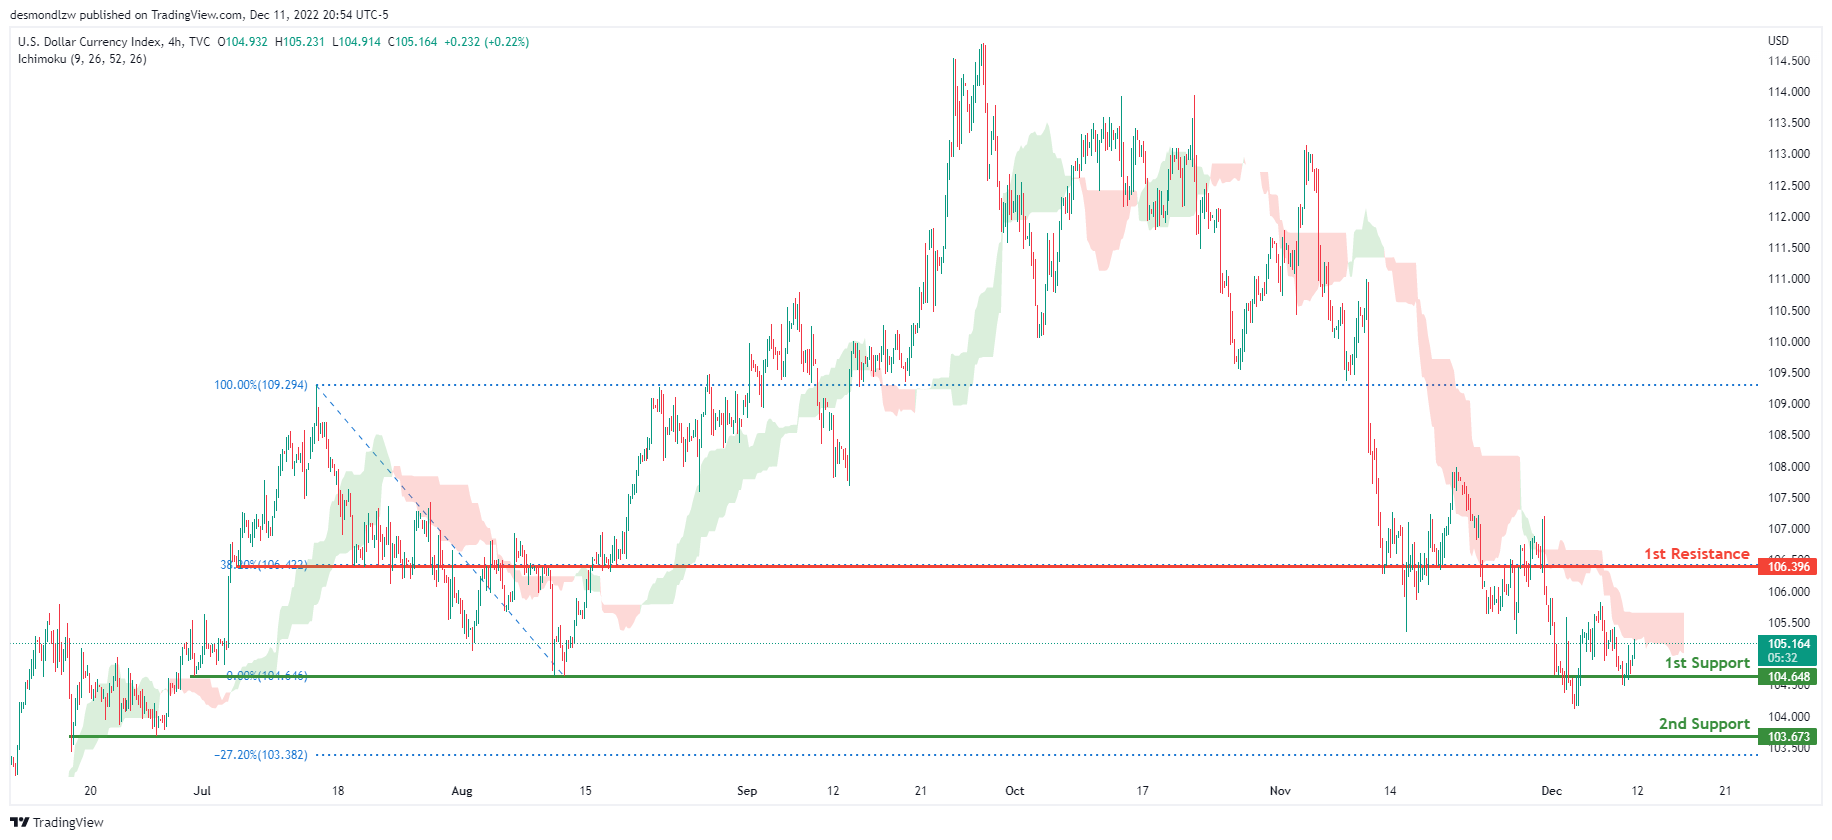
On the H4 chart, the overall bias for DXY is bearish. To add confluence to this, the price is below the Ichimoku cloud which indicates a bearish market. If this bearish momentum continues, expect the price to continue heading towards the 1st support line at 104.648, where the previous swing low is. In an alternative scenario, price could head back up and retest the 1st resistance line resistance at 106.396, where the 38.2% Fibonacci line is.
Areas of consideration:
- H4 time frame, 1st resistance at 106.396
- H4 time frame, 1st support at 104.648
EUR/USD:
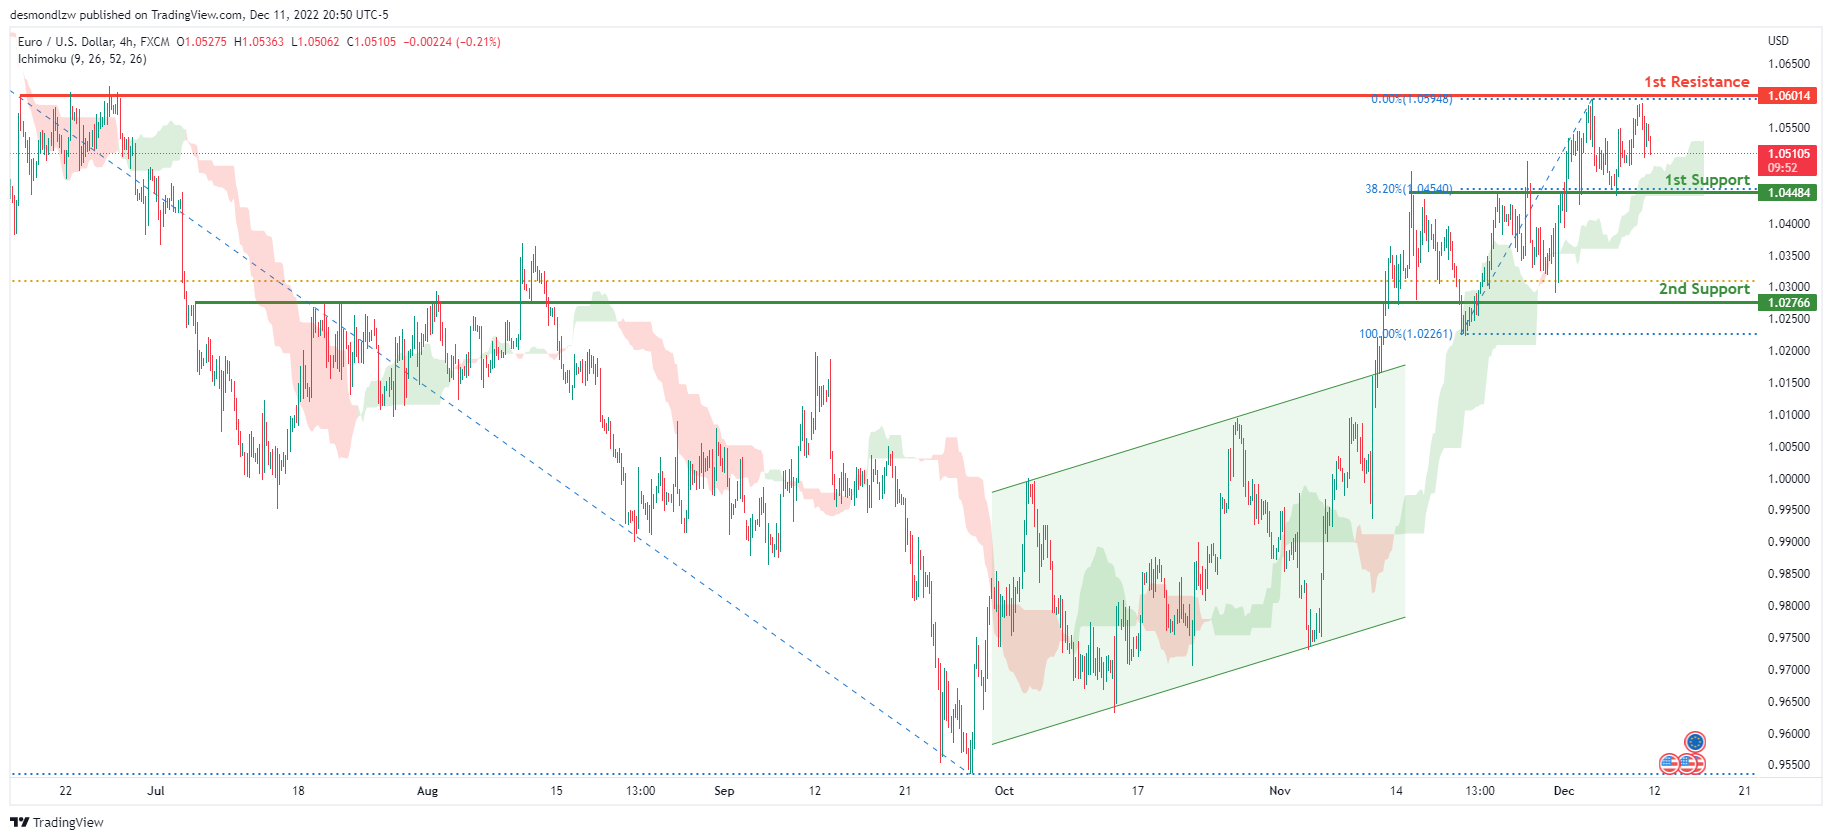
Looking at the H4 chart, my overall bias for EURUSD is bullish due to the current price being above the Ichimoku cloud, indicating a bullish market. To add confluence to this bias, price has also broken above the ascending bullish channel. If this bullish momentum continues, expect the price to possibly head towards the 1st resistance at 1.06014, where the previous swing high and 78.6% Fibonacci line are located., before heading towards the 2nd resistance at 1.07652, where the previous swing high is. In an alternate scenario, price could possibly head back down to break the 1st support level at 1.04484, where the previous high and 38.2% Fibonacci line are located before heading towards the 2nd support at 1.02766 where the 61.8% Fibonacci line is.
Areas of consideration :
- H4 1st resistance at 1.06014
- H4 1st support at 1.04484
- H4 2nd support at 1.02766
GBP/USD:
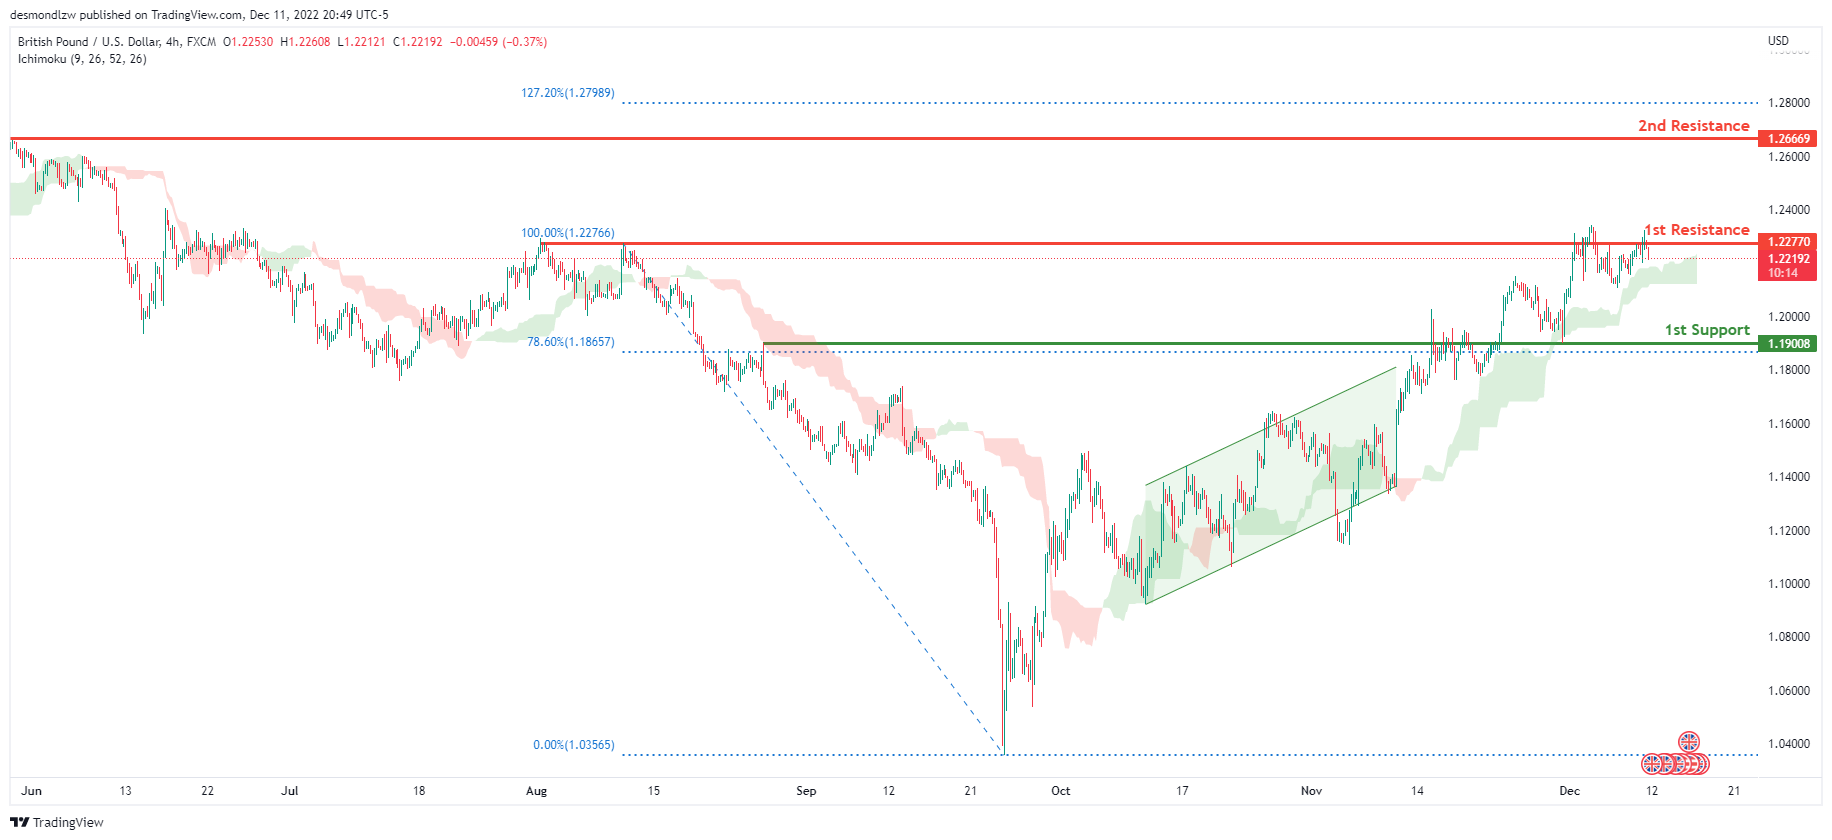
Looking at the H4 chart, my overall bias for GBPUSD is bullish due to the current price being above the Ichimoku cloud, indicating a bullish market. Expecting price to head back up to possibly break the 1st resistance line at 1.22770, where the previous high is, before heading towards the 2nd resistance at 1.26669, where the previous swing high is. In an alternative scenario, price could possibly head back down towards the 1st support at 1.19008, where the 78.6% Fibonacci line is.
Areas of consideration:
- H4 1st resistance at 1.22770
- H4 2nd resistance at 1.26669
- H4 1st support at 1.19008
USD/CHF:
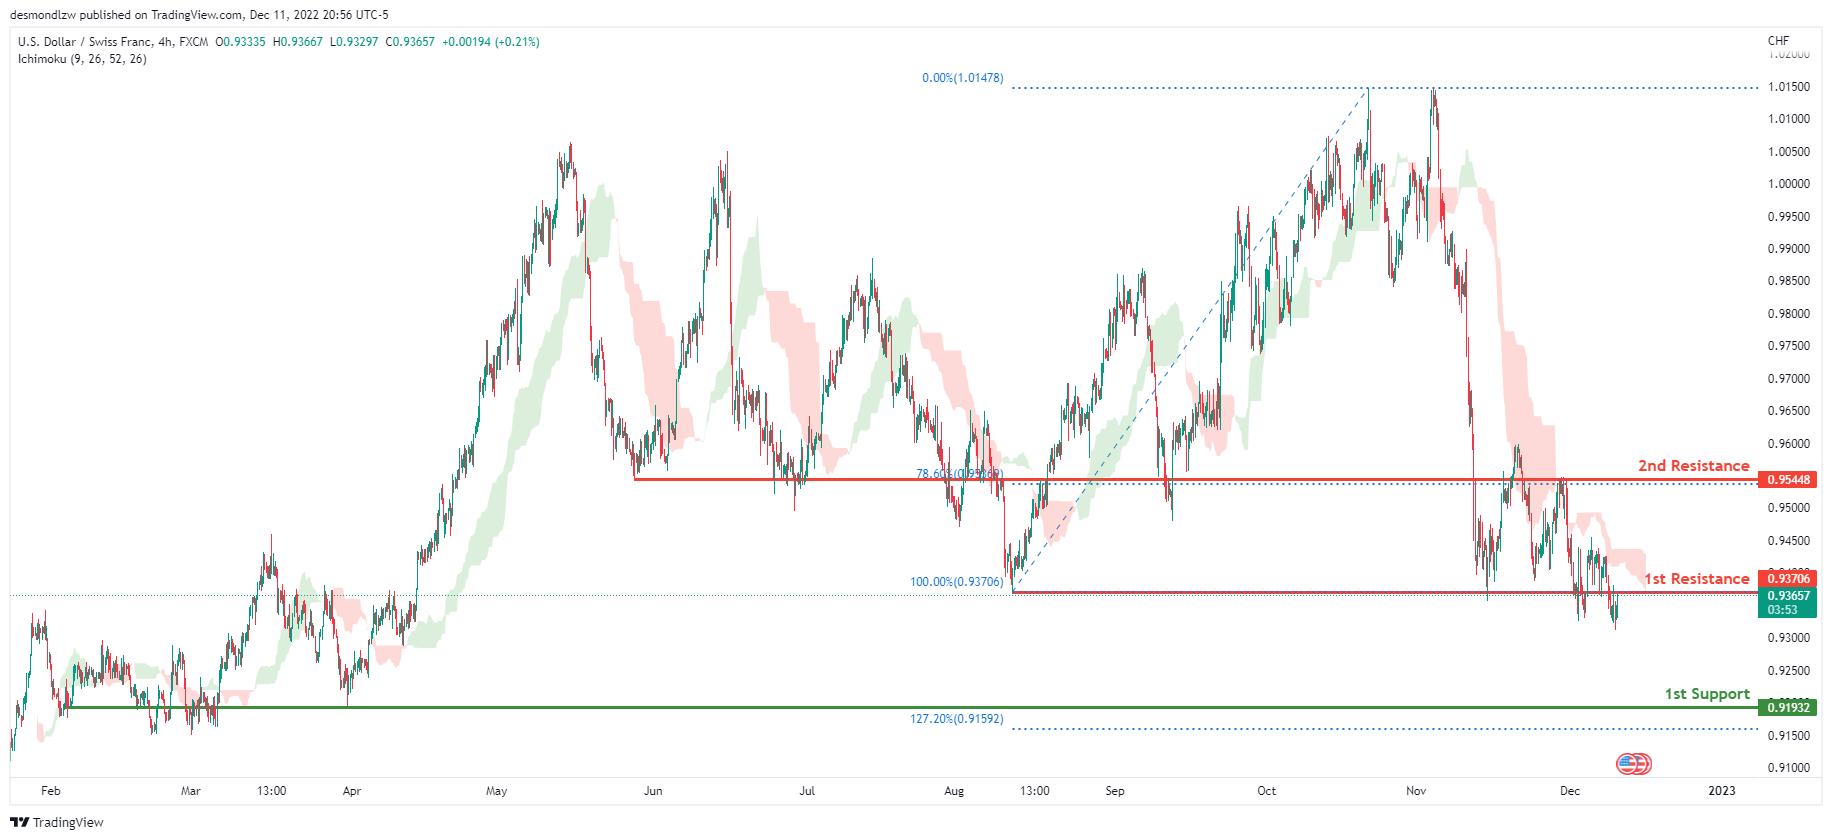
The overall bias for USDCHF on the H4 chart is bearish. In addition, the price is below the Ichimoku cloud, indicating a bearish market. If the current bearish trend continues, expect the price to head back down towards the 1st support line at 0.91932, where the previous swing low and 12.72% Fibonacci extension line is . In an alternative scenario, price could possibly head up towards the 1st resistance at 0.93706, where the previous swing low is .
Areas of consideration
- H4 1st support at 0.91932
- H4 1st resistance at 0.93706
XAU/USD (GOLD):
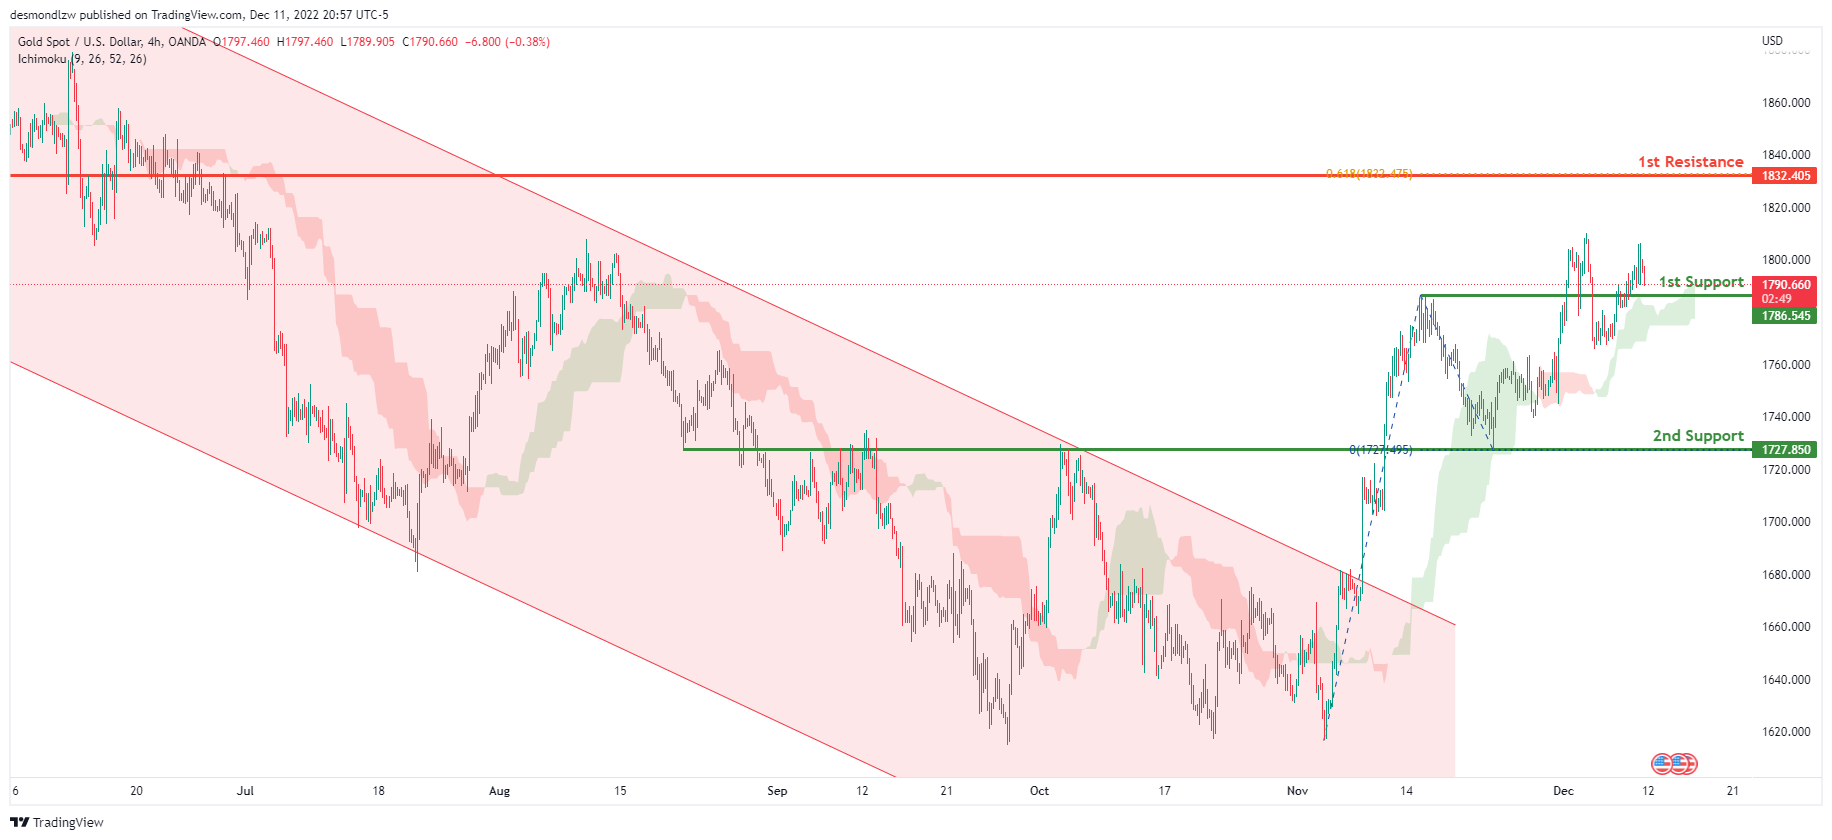
Looking at the H4 chart, my overall bias for XAUUSD is bullish due to the current price crossing above the Ichimoku cloud, indicating a bullish market. If this bullish momentum continues, expect the price to possibly break the 1st resistance at 1786.545, where the previous swing high is located, before heading towards the 2nd resistance at 1832.405, where the 61.8% Fibonacci projection line is. In an alternate scenario, price could possibly head back down towards the 1st support level at 1727.850, where the previous swing high is located
Areas of consideration:
- H4 time frame, 1st resistance at 1786.545
- H4 time frame, 1st support at 1727.850
AUD/USD:
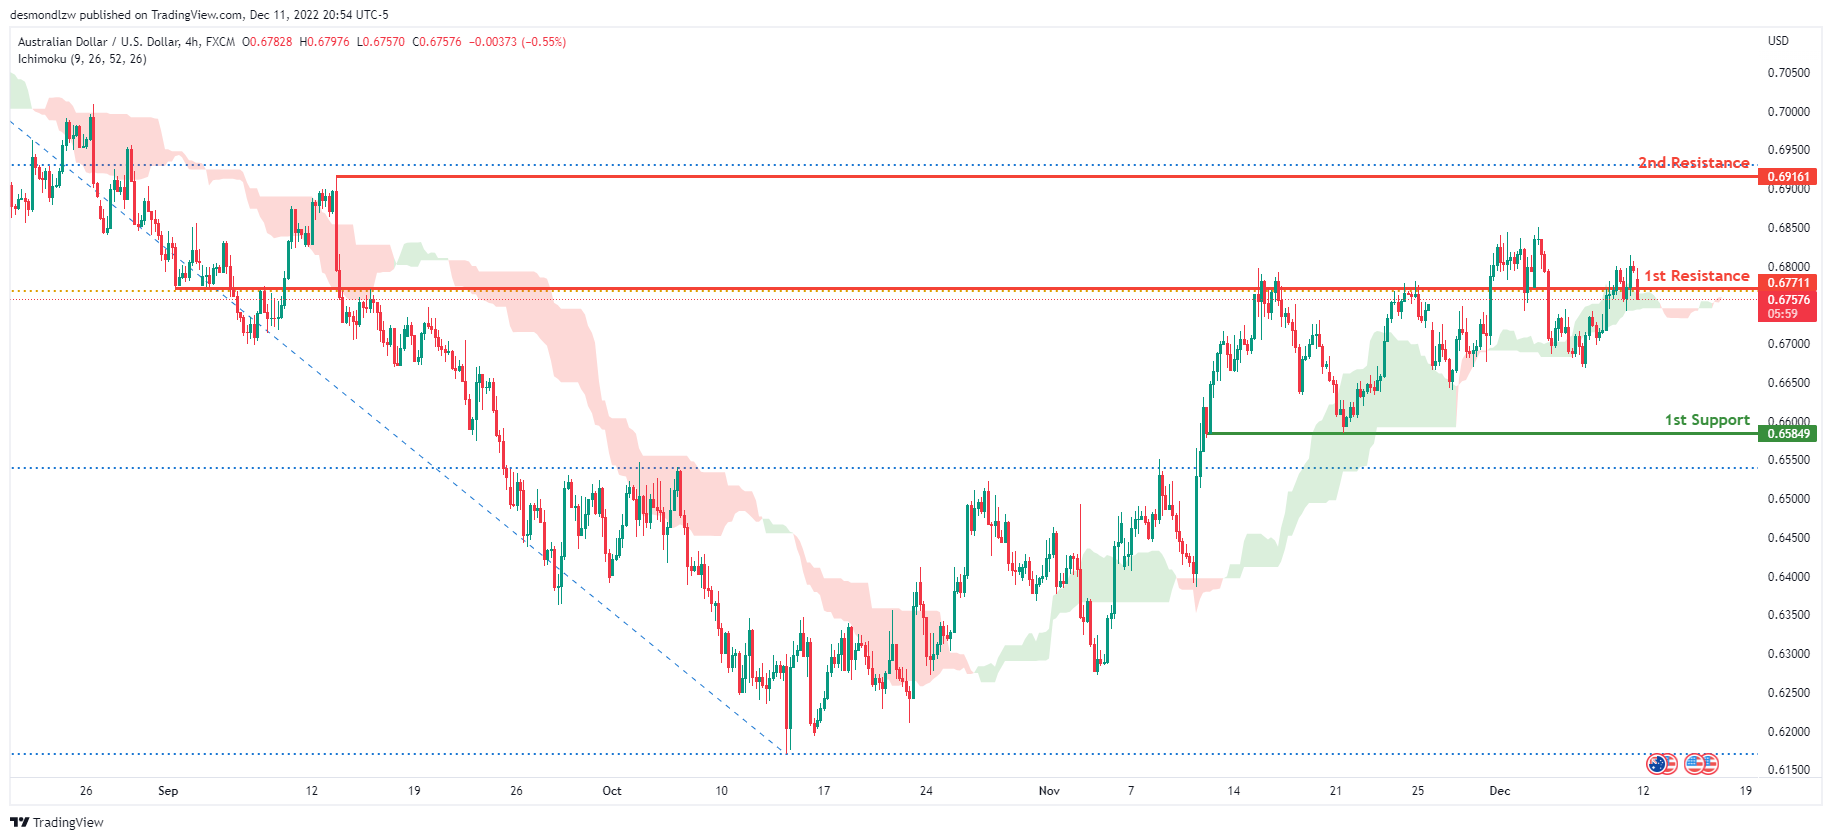
Looking at the H4 chart, my overall bias for AUDUSD is bullish due to the current price being above the Ichimoku cloud, indicating a bullish market. If this bullish momentum continues, expect the price to break the 1st resistance at 0.67711, where the 61.8% Fibonacci line is, before heading towards the 2nd resistance at 0.69161, where the 78.6% Fibonacci line is. In an alternative scenario, price could possibly head back down towards the 1st support line at 0.65849, where it is slightly above where the 38.2% Fibonacci line is.
Areas of consideration
- H4, 1st resistance at 0.67711
- H4, 2nd resistance at 0.69161
- H4, 1st support at 0.65849
NZD/USD:
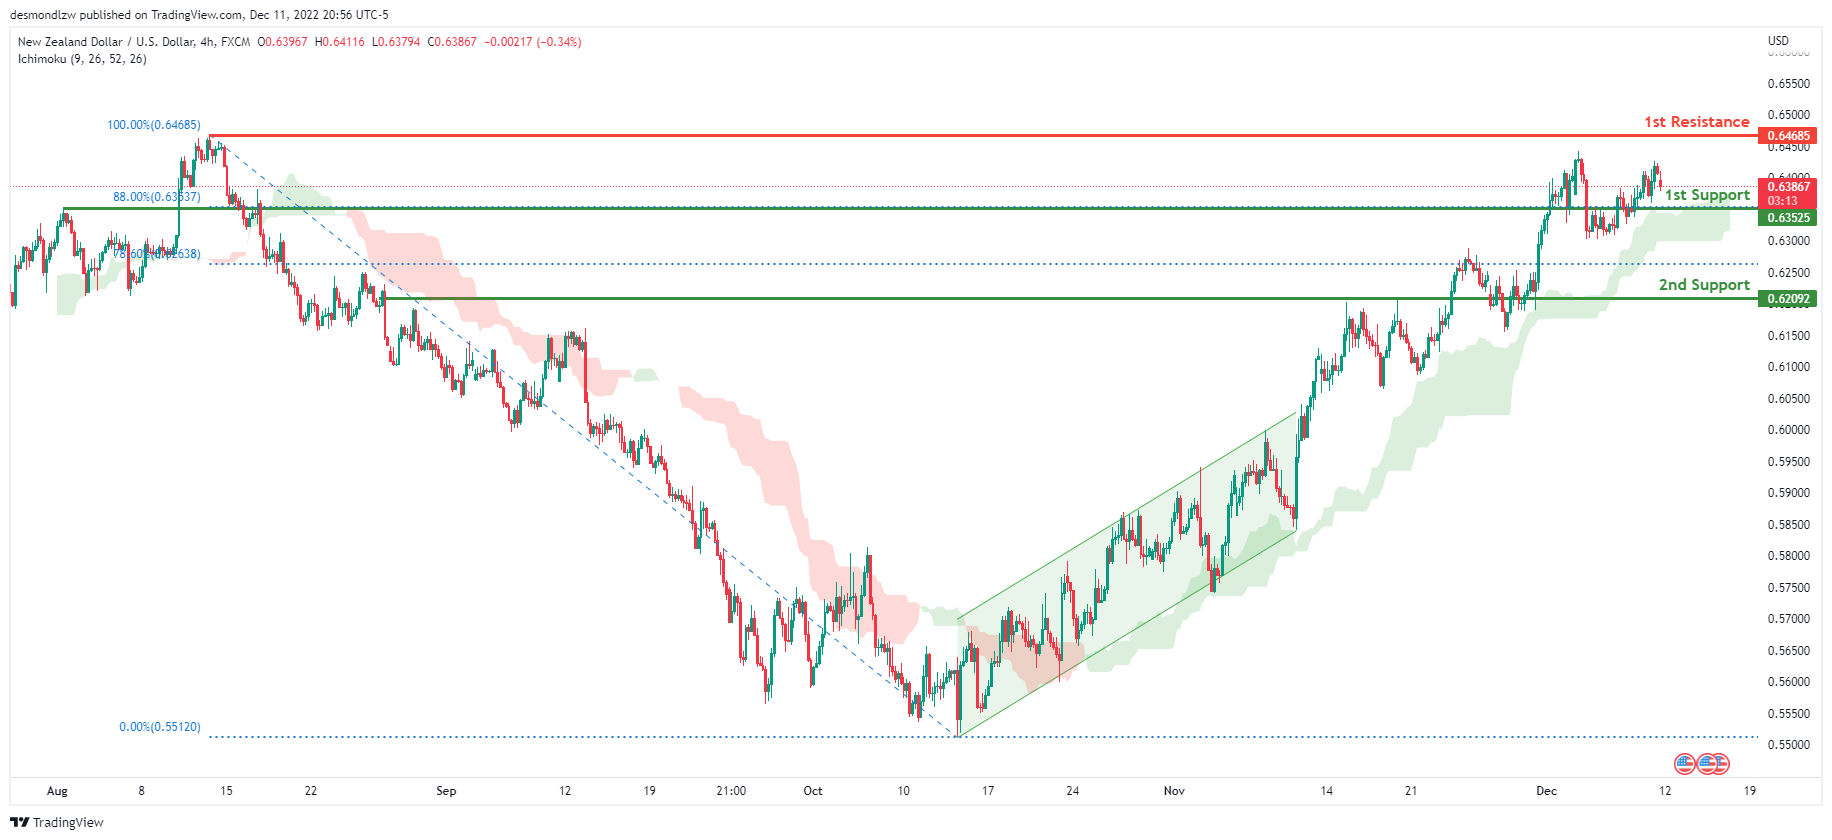
Looking at the H4 chart, my overall bias for NZDUSD is bullish due to the current price being above the Ichimoku cloud, indicating a bullish market.
To add confluence to this bias, price has broken out of the ascending channel. If this bullish momentum continues, expect the price to head up to the 1st resistance line at 0.64685, where the previous swing high is. Alternatively, the price may head back down towards the 1st support aat 0.63525, where the 88% Fibonacci line is.
Areas of consideration:
- H4 time frame, 1st resistance at 0.64685
- H4 time frame, 1st support at 0.63525
USD/CAD:
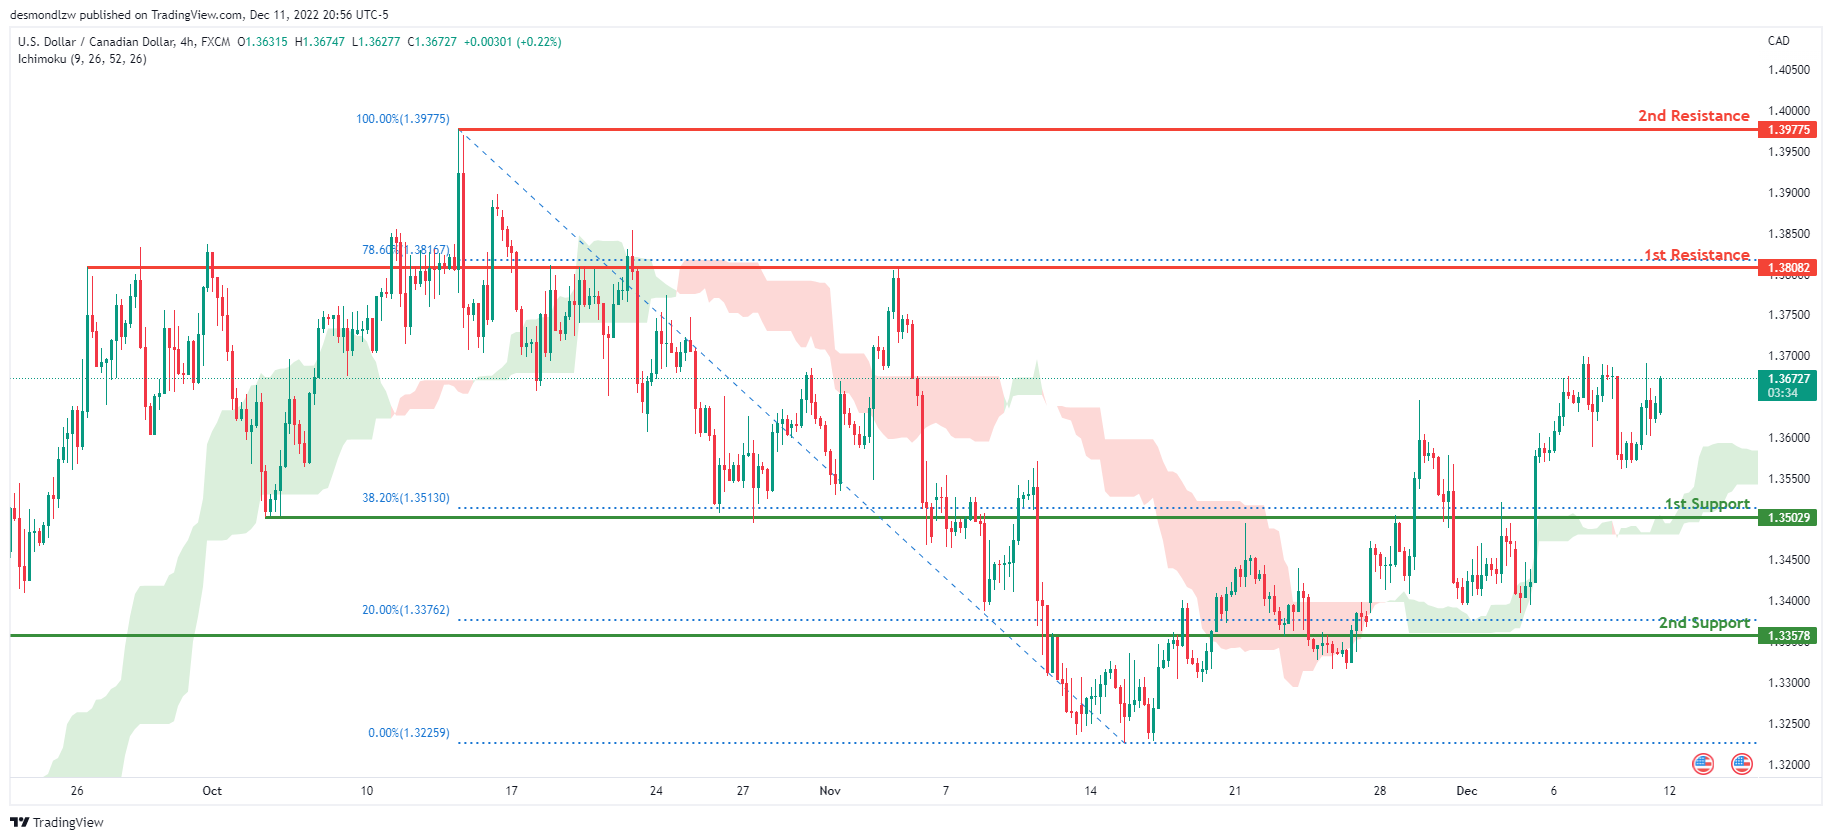
On the H4 chart, the overall bias for USDCAD is bullish. To add confluence to this, the price is above the Ichimoku cloud which indicates a bullish market. If this bullish momentum continues, expect the price to head towards 1st resistance line at 1.38082, where the 78.6% Fibonacci line is. In an alternative scenario, price could head back down to retest the 1st support at 1.35029, where the 38.2% Fibonacci line is.
Areas of consideration:
- H4 time frame, 1st resistance at 1.38082
- H4 time frame, 2nd resistance at 1.39775
- H4 time frame, 1st support at 1.35029
OIL:
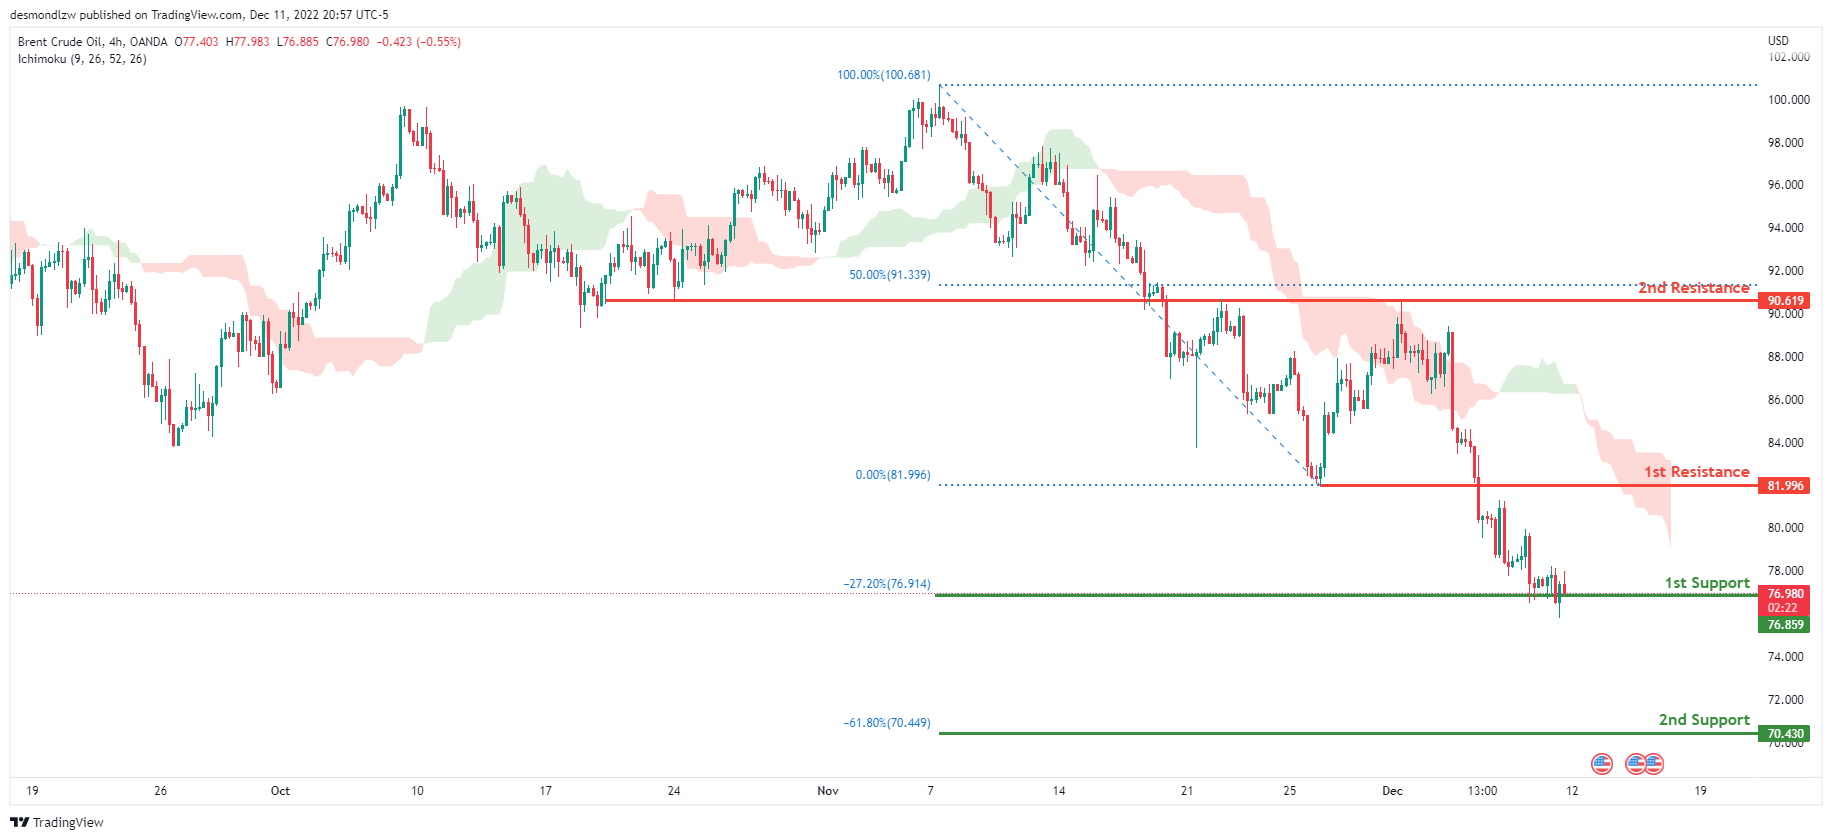
Looking at the H4 chart, my overall bias for BCOUSD is bearish due to the current price being below the Ichimoku cloud, indicating a bearish market. If this bearish momentum continues, expect price to possibly break the 1st support line at 76.859, where the -27.2% Fibonacci expansion line is, before heading towards the 2nd support at 70.430, where the -27.2% Fibonacci expansion line is. In an alternate scenario, price could possibly head back up to retest the 1st resistance line at 81.996, where the previous low is located.
Areas of consideration:
- H4 time frame, 1st resistance at 81.996
- H4 time frame, 1st support at 76.859
- H4 time frame, 2nd support at 70.430
Dow Jones Industrial Average:
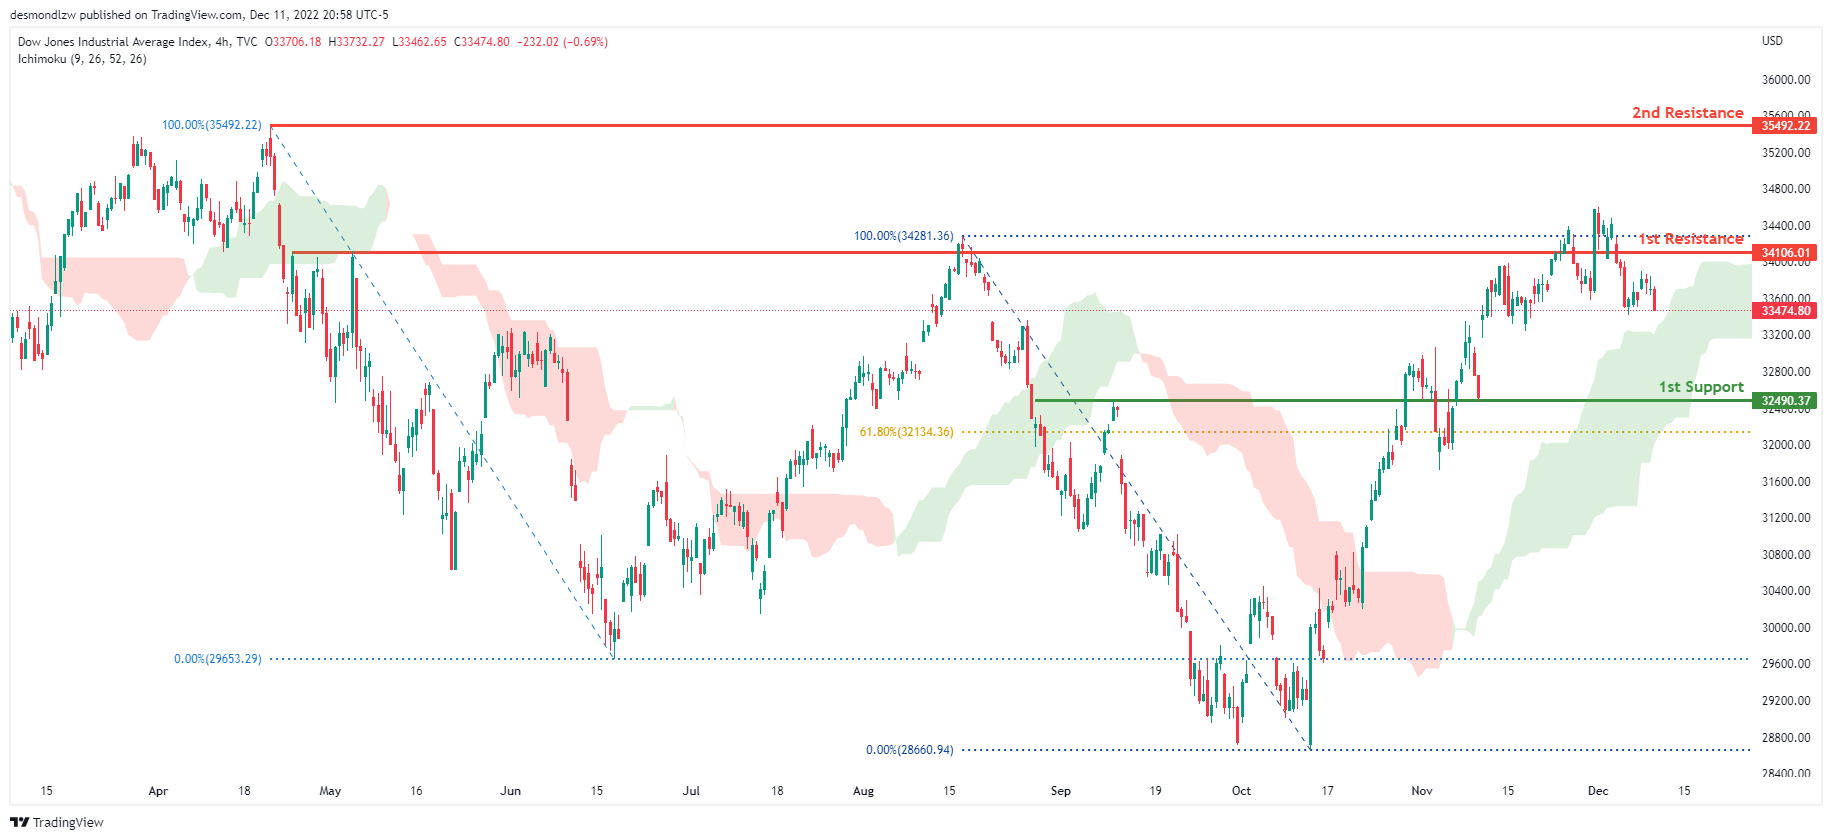
On the H4 chart, the overall bias for DJI is bullish. To add confluence to this, the price is above the Ichimoku cloud which indicates a bullish market. If this bullish momentum continues, expect the price to continue heading towards the 1st resistance line at 34106.01, where the previous swing high is. In an alternative scenario, price could head back down towards the 1st support at 32490.37, where the 61.8% Fibonacci line is.
Areas of consideration:
- H4 time frame, 1st support at 32490.37
- H4 time frame, 1st Resistance at 34106.01
DAX:
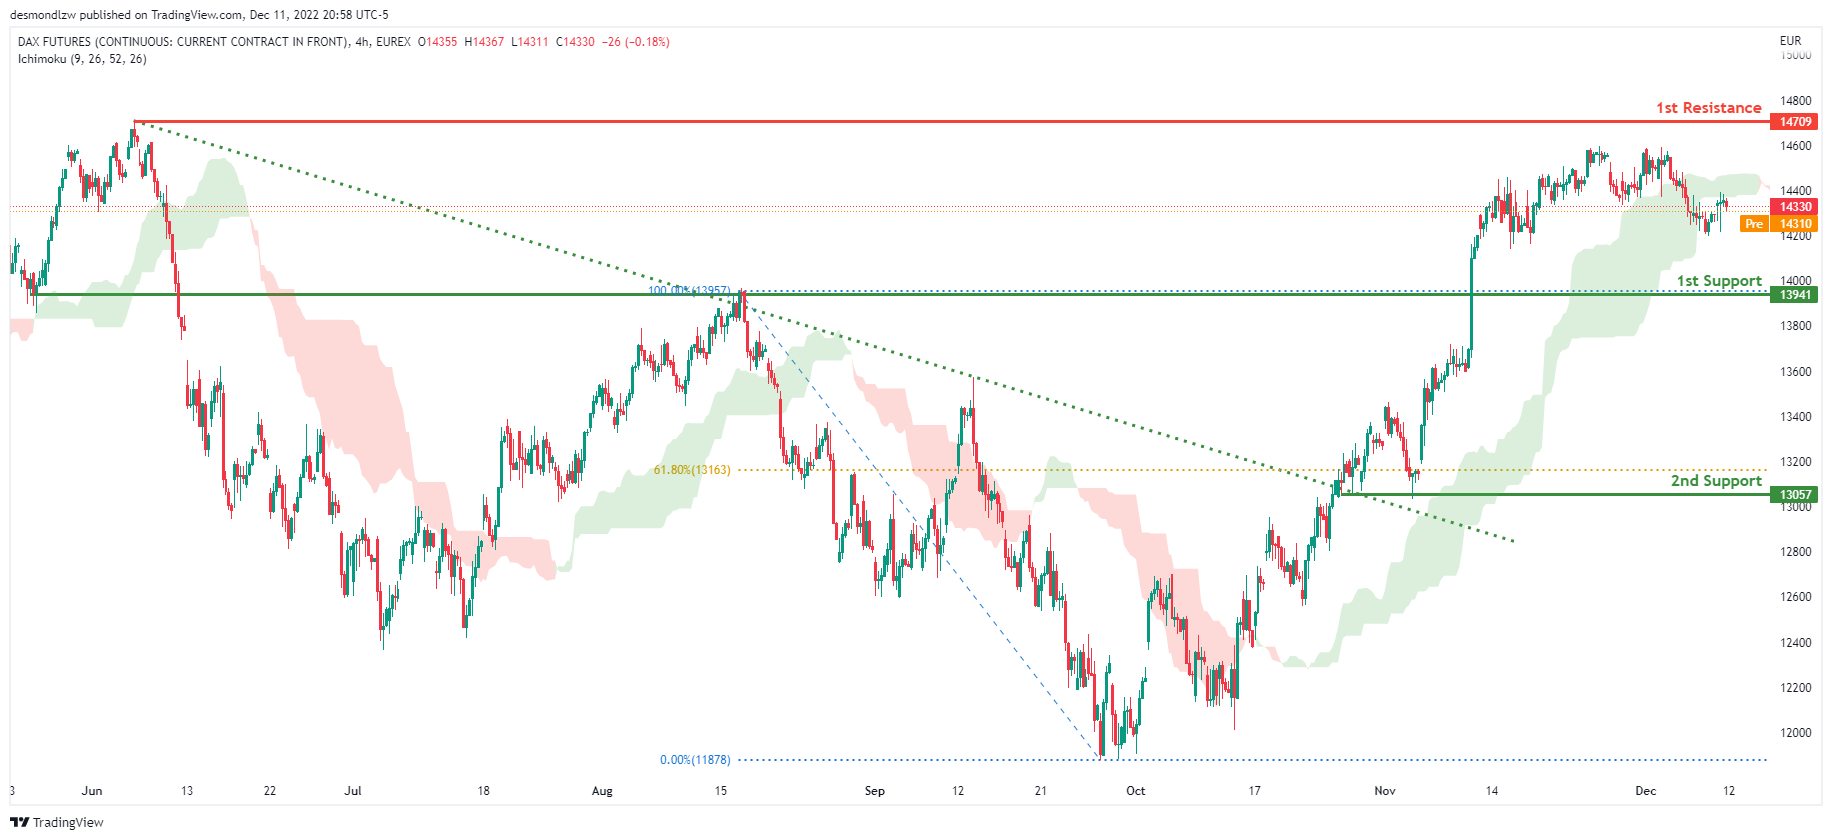
The H4 chart shows a bullish bias, with price breaking through the descending trendline and rising above the Ichimoku cloud. Price is expected to maintain its bullish momentum and rise to the first resistance level at 14709, where the previous swing high is located. Alternatively, the price could fall to the first support level at 13941, where the previous swing high was.
Areas of consideration:
- H4 time frame, 1st resistance is at 14709
- H4 time frame, 1st support is at 13941
ETHUSD:
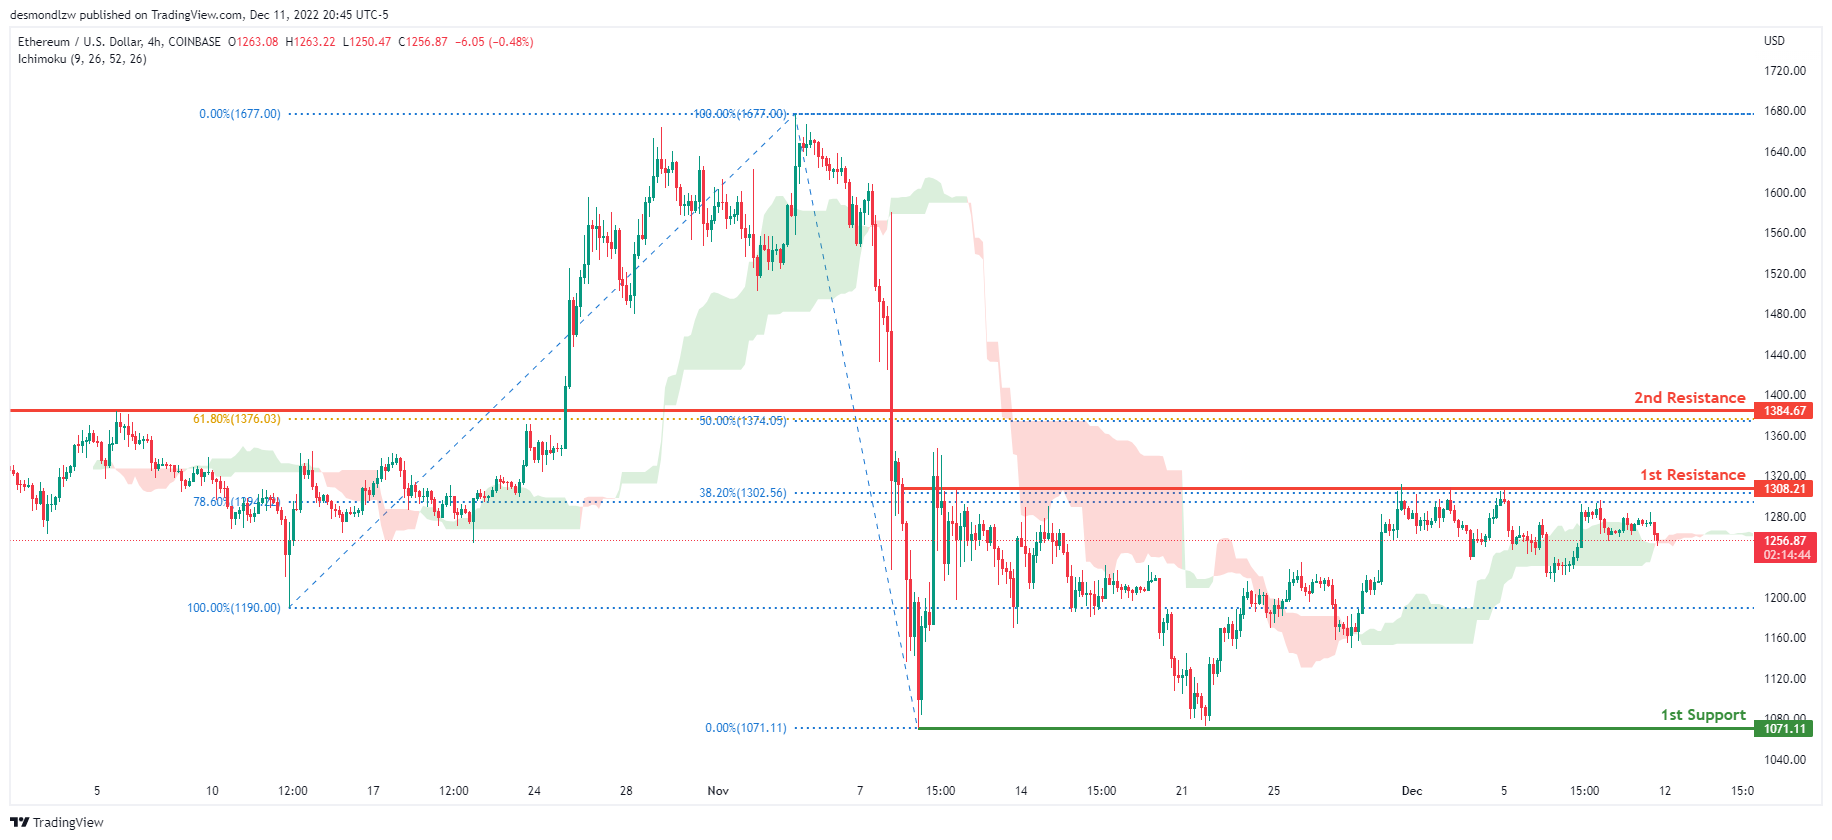
Looking at the H4 chart, my overall bias for ETHUSD is bearish due to the current price crossing below the Ichimoku cloud, indicating a bearish market. Expecting price to possibly head back down towards the 1st support at 1071.11, where the previous swing low is. In an alternative scenario, price could break the 1st resistance at 1308.21, where the 38.2% and 78.6% Fibonacci lines are before heading towards the 2nd resistance line at 1384.67, where the 50% and 61.8% Fibonacci lines are.
Areas of consideration:
- H4 time frame, 1st resistance of 1308.21
- H4 time frame, 2nd resistance of 1384.67
- H4 time frame, 1st support at 1071.11
BTCUSD:
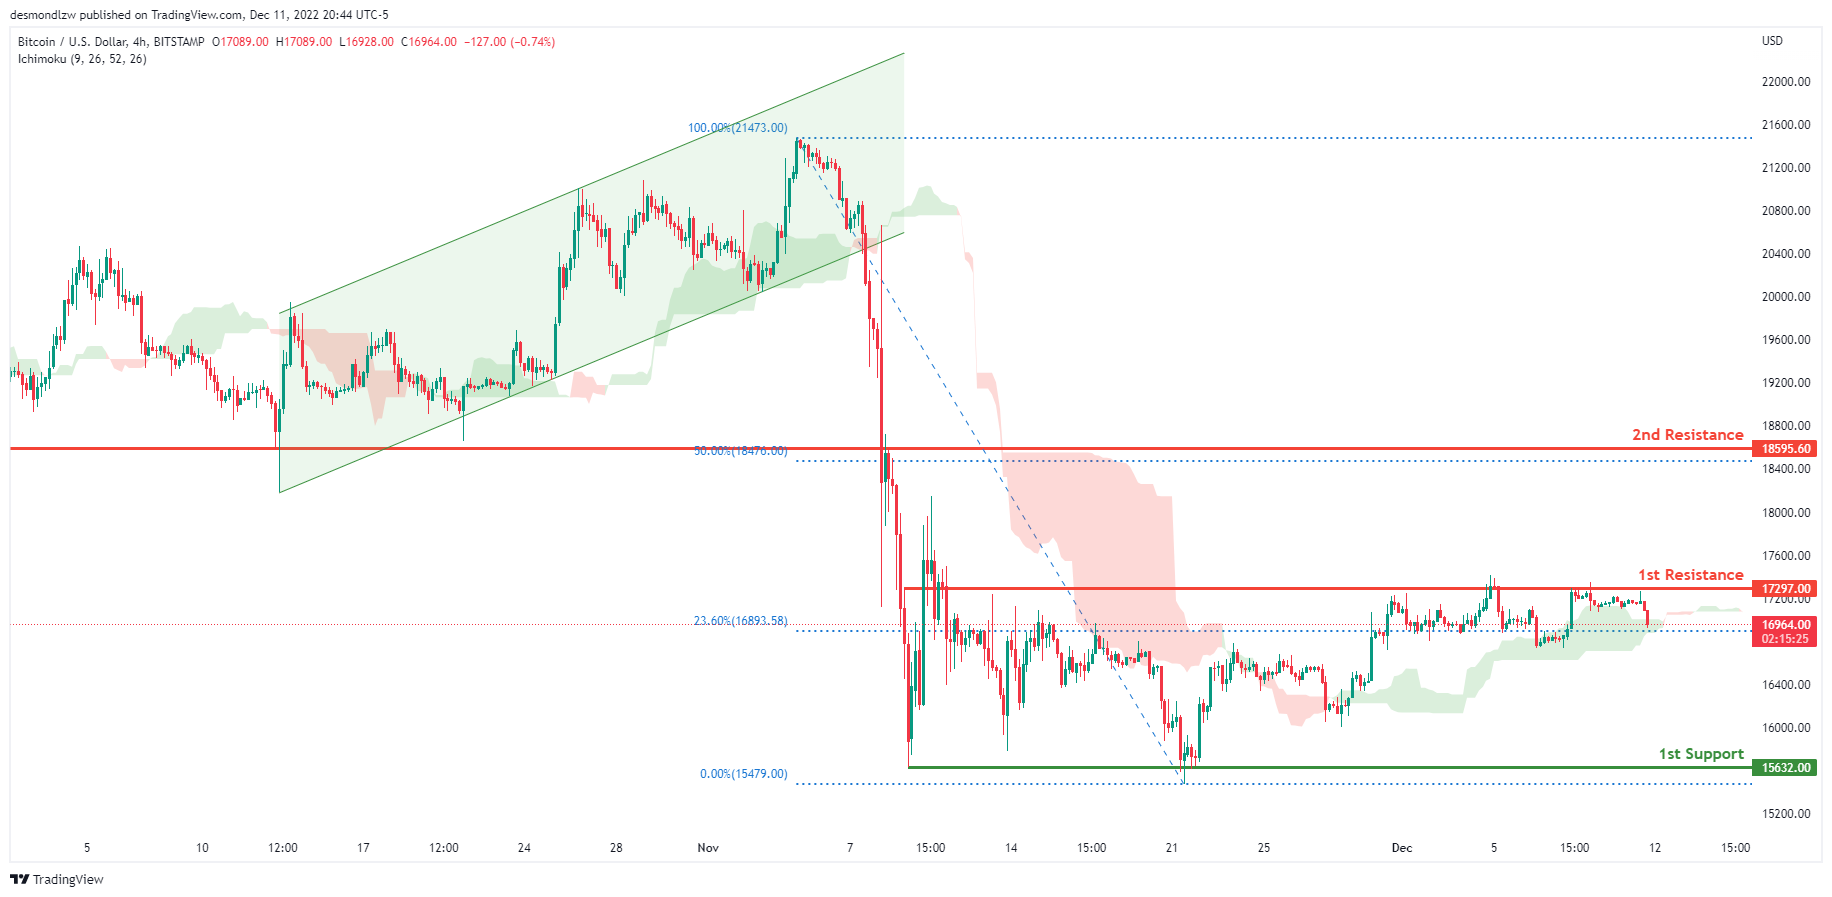
Looking at the H4 chart, my overall bias for BTCUSD is bearish due to the current price crossing below the Ichimoku cloud, indicating a bearish market. Expecting price to possibly head back down towards the 1st support at 15632.00, where the previous swing low is. In an alternative scenario, price could possibly break the 1st resistance at 17297.00, where the 23.6% Fibonacci line is before heading towards the 2nd resistance line at 18173.33, where the previous swing low is and 50% Fibonacci line are.
Areas of consideration:
- H4 time frame, 1st resistance 17297.00
- H4 time frame, 2nd resistance 18173.33
- H4 time frame, 1st support at 15632.00
S&P 500:
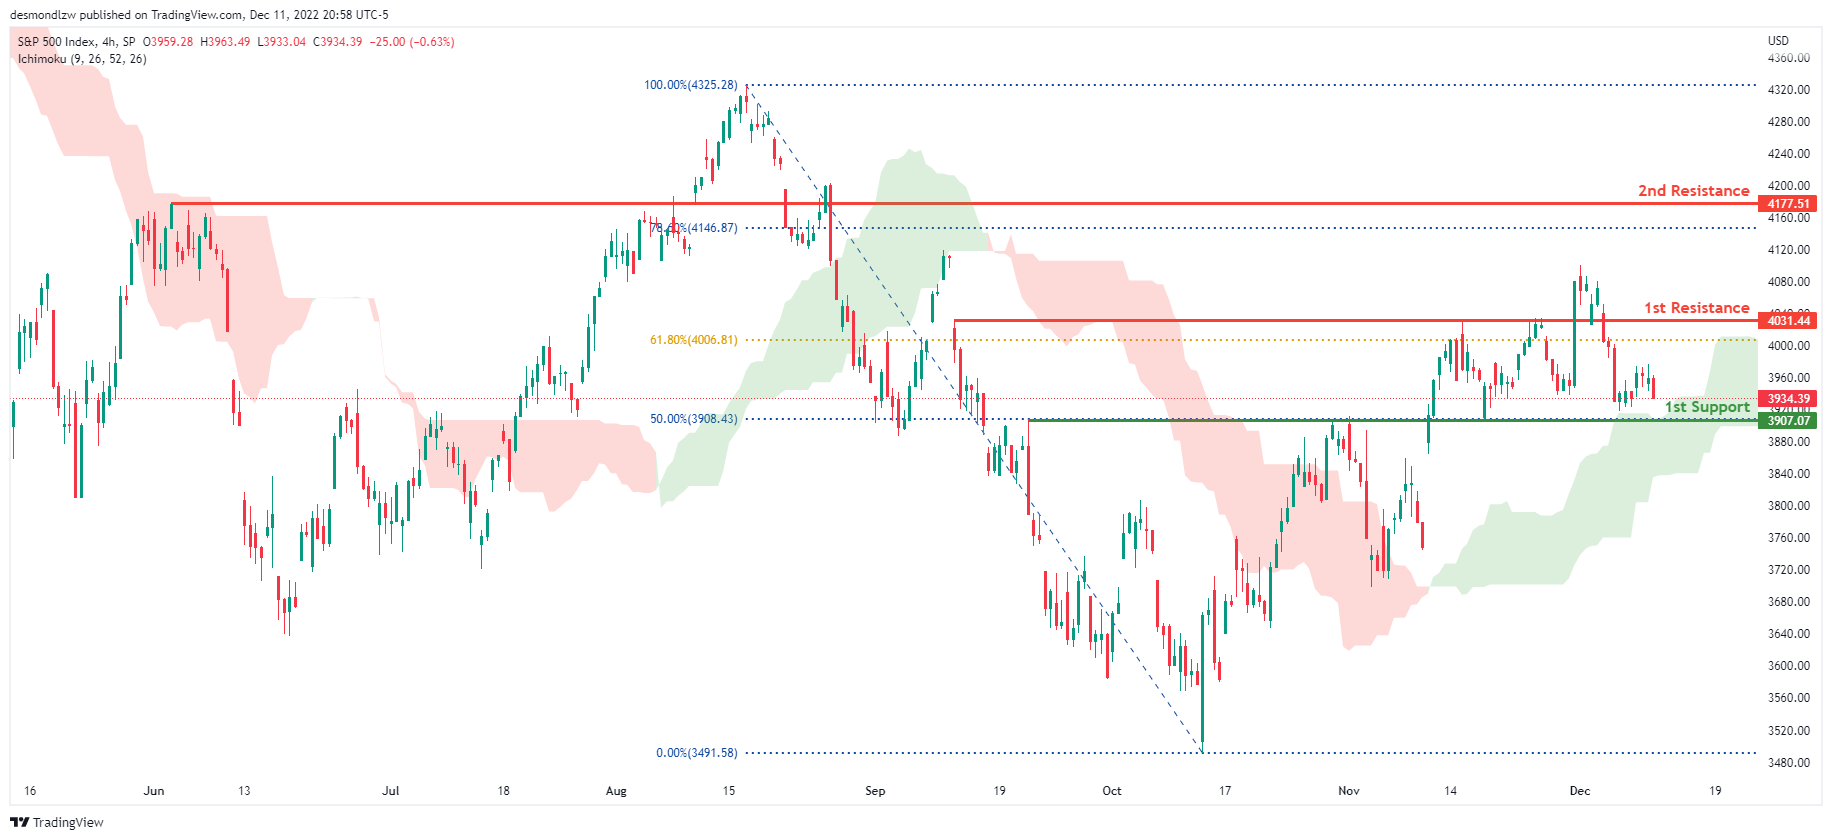
The overall bias for the S&500 on the H4 chart is bullish, with prices above the Ichimoku cloud. If the bullish momentum continues, the expected price to head towards the 1st resistance line is at 4031.44, where the 61.8% Fibonacci line is located. In an alternate scenario, price could return to the 1st support line at 3907.07, where the 50% Fibonacci line is located.
Areas of consideration:
- H4 time frame, 1st support at 3907.07
- H4 time frame, 1st resistance at 4031.44
EUR/JPY Daily Outlook
Daily Pivots: (S1) 144.14; (P) 144.62; (R1) 145.52; More....
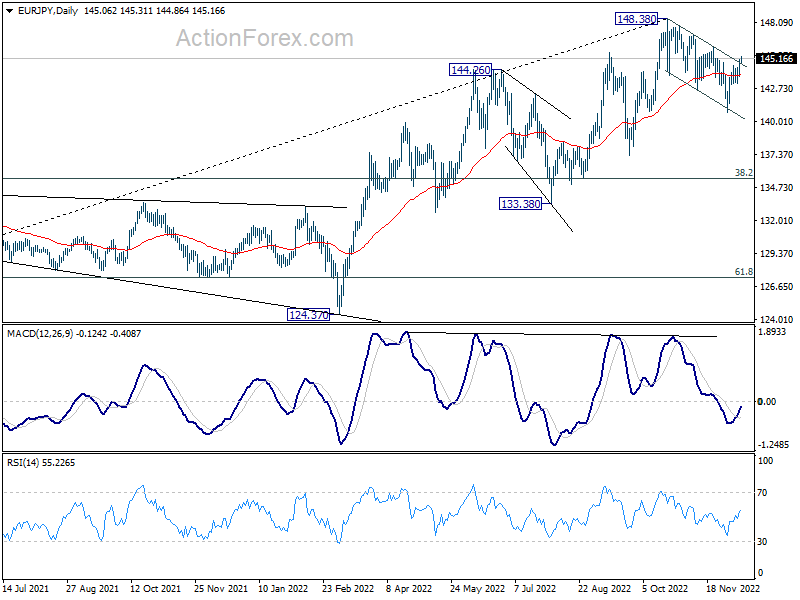
Intraday bias in EUR/JPY remains on the upside for the moment. Correction from 148.38 could have completed with three waves down to 140.75. Further rally would be seen to 146.12 resistance first. Firm break there will bring retest of 148.38 high. On the downside, however, break of 143.16 minor resistance will dampen this bullish case and turn intraday bias neutral again.
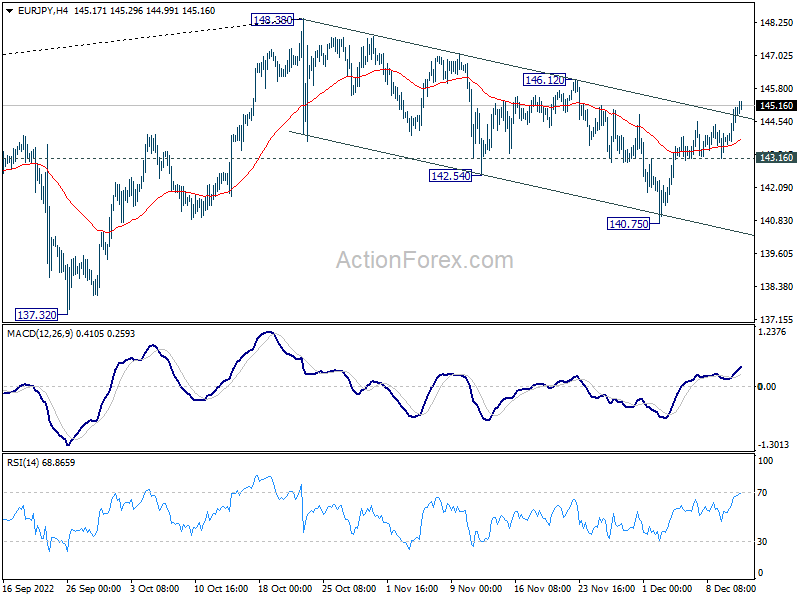
In the bigger picture, considering bearish divergence condition in weekly MACD, 148.38 could be a medium term top already. Fall from there is probably correcting whole up trend from 114.42 (2020 low). Deeper decline would be seen to 55 week EMA (now at 138.08), or further to 38.2% retracement of 114.42 to 148.38 at 135.40 before completion.
Yen Weakens in Otherwise Ranging Markets, Traders Stay Cautious
Yen is so far the clearly weaker one in otherwise ranging markets. Rebound in US stocks and treasury yield overnight was a factor in Yen's selling. But after all, there is no follow through weakness for now. Traders are generally still cautious ahead of the four central bank meetings later in the week. Before that, US CPI release today might also trigger some interim volatility.
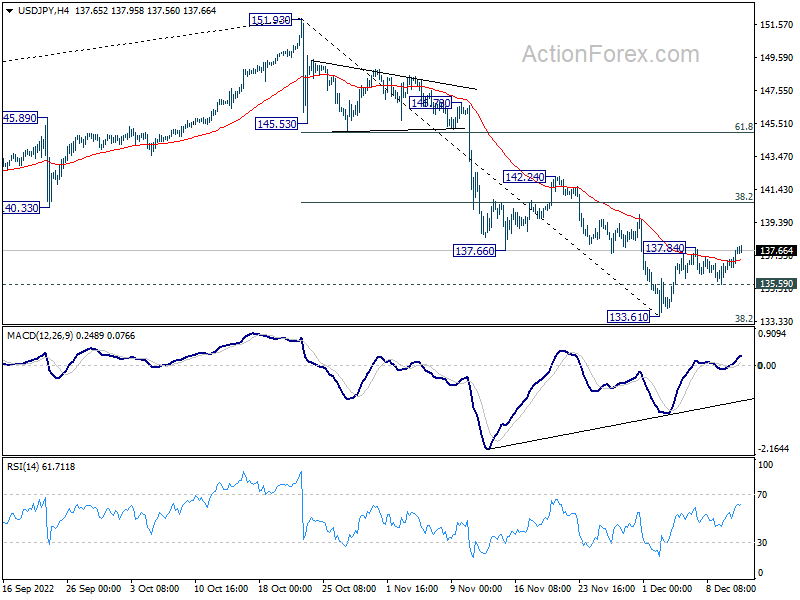
Technically, USD/JPY's breach of 137.84 temporary top suggests that rebound from 133.61 is resuming. While upside momentum is weak, further rise will remain mildly in favor as long as 135.59 minor support holds. Next target is 38.2% retracement of 151.93 to 133.61 at 140.60, which is close to 55 day EMA (now at 140.80).
In Asia, at the time of writing, Nikkei is up 0.37%. Hong Kong HSI is up 0.36%. China Shanghai SSE is down -0.07%. Singapore Strait Times is up 0.90%. Japan 10-year JGB yield is down -0.0037 at 0.253. Overnight DOW rose 1.58%. S&P 500 rose 1.43%. NASDAQ rose 1.26%. 10-year yield rose 0.044 to 3.611.
BoC Macklem: Higher interest rates are working to rebalance the economy
BoC Governor Tiff Macklem said in a speech yesterday, "Higher interest rates are working to rebalance the economy. Domestic demand is slowing, and we expect growth in gross domestic product will be close to zero through to the middle of next year as the economy adjusts to higher interest rates. This will relieve domestic price pressures, and inflation will come down."
He reiterated the position that the central bank will be considering "whether there is a need to increase the policy rate further". He explained, "This means that decisions to raise the rate or to pause and assess the impact of past rate increases will depend on incoming data and our judgments about the outlook for inflation."
Macklem also said BoC is "watching very closely to see how the economy is responding to higher interest rates". It is looking at an job market data, how supply chains are resolving, how business are passing on costs, measures of core inflation, and inflation expectations.
Australia Westpac consumer sentiment bounced from near record low
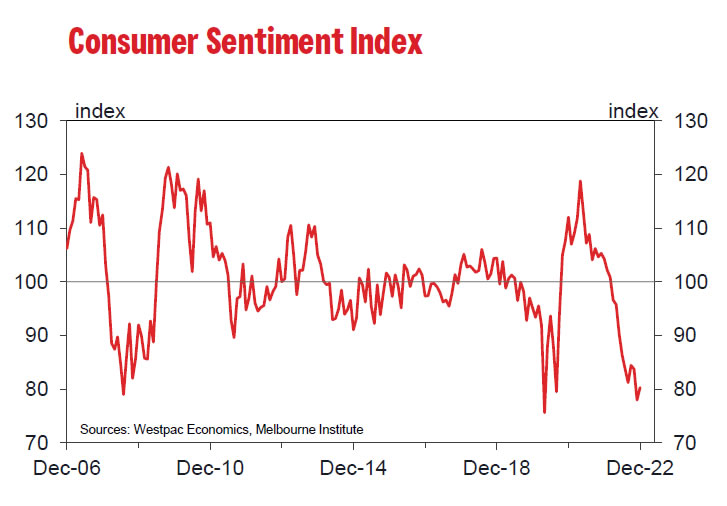
Australia Westpac Consumer Sentiment Index bounced from near record low and rose 3% from 78.0 to 80.3 in December. But the level remains comparable to the lows see during the pandemic and the Global Financial Crisis.
Concerns over inflation remained dominant among respondents, followed by budget and taxation, economic conditions and interest rates.
Westpac expects RBA to continue to deliver on its "strong tightening bias" in February and hike by 25bps, and signal that there is still more work to be done.
Australia NAB business conditions hold up, but confidence turned negative
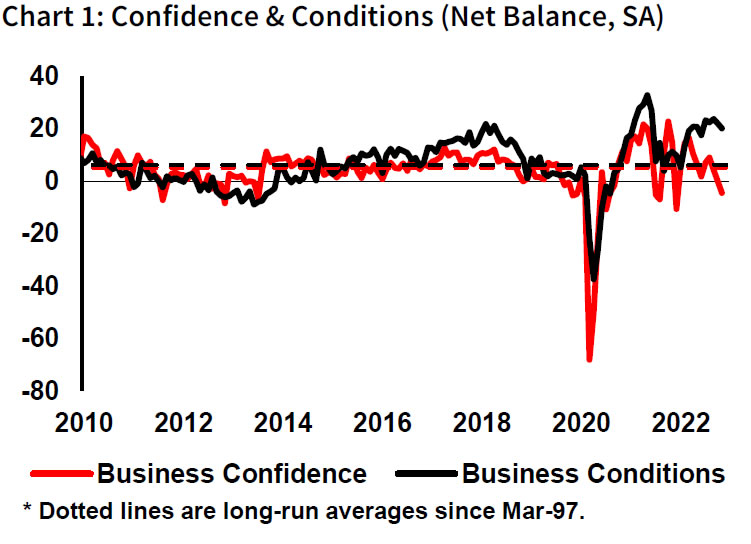
Australia NAB Business Confidence dropped from 0 to -4 in November, below zero for the first time since December 2021. Business Conditions dropped from 22 to 20, but remained elevated. Looking at some details, trading conditions dropped from 30 to 28. Profitability conditions dropped from 21 to 20. Employment conditions dropped from 14 to 13.
NAB Chief Economist Alan Oster. "There was a slight softening across a number of industries but the level of business conditions really still remains elevated across the board including in key consumer-facing sectors such as retail and recreation & personal services, and across the states."
"Confidence is now negative, for the first time this year, despite the strength in conditions," said Oster. "The gap between current business conditions and business confidence is now at a record level in the history of the survey – with the exception of March 2020 – pointing to heightened concerns about the resilience of the economy in the period ahead as inflation and higher rates begin to weigh on consumers."
Looking ahead
UK employment data, Germany ZEW economic sentiment will be the main focus in European session. Swiss SECO will also publish economic forecasts. Later in the day, US CPI will take center stage.
EUR/JPY Daily Outlook
Daily Pivots: (S1) 144.14; (P) 144.62; (R1) 145.52; More....
Intraday bias in EUR/JPY remains on the upside for the moment. Correction from 148.38 could have completed with three waves down to 140.75. Further rally would be seen to 146.12 resistance first. Firm break there will bring retest of 148.38 high. On the downside, however, break of 143.16 minor resistance will dampen this bullish case and turn intraday bias neutral again.
In the bigger picture, considering bearish divergence condition in weekly MACD, 148.38 could be a medium term top already. Fall from there is probably correcting whole up trend from 114.42 (2020 low). Deeper decline would be seen to 55 week EMA (now at 138.08), or further to 38.2% retracement of 114.42 to 148.38 at 135.40 before completion.
Economic Indicators Update
| GMT | Ccy | Events | Actual | Forecast | Previous | Revised |
|---|---|---|---|---|---|---|
| 23:30 | AUD | Westpac Consumer Confidence Dec | 3.00% | -6.90% | ||
| 00:30 | AUD | NAB Business Confidence Nov | -4 | 0 | ||
| 00:30 | AUD | NAB Business Conditions Nov | 20 | 22 | ||
| 07:00 | GBP | Claimant Count Change Nov | 3.5K | 3.3K | ||
| 07:00 | GBP | ILO Unemployment Rate (3M) Oct | 3.70% | 3.60% | ||
| 07:00 | GBP | Average Earnings Excluding Bonus 3M/Y Oct | 5.70% | 5.70% | ||
| 07:00 | GBP | Average Earnings Including Bonus 3M/Y Oct | 6.20% | 6.00% | ||
| 07:00 | EUR | Germany CPI M/M Nov F | -0.50% | -0.50% | ||
| 07:00 | EUR | Germany CPI Y/Y Nov F | 10.00% | 10.00% | ||
| 08:00 | CHF | SECO Economic Forecasts | ||||
| 09:00 | EUR | Italy Industrial Output M/M Oct | -0.30% | -1.80% | ||
| 10:00 | EUR | Germany ZEW Economic Sentiment Dec | -26.3 | -36.7 | ||
| 10:00 | EUR | Germany ZEW Current Situation Dec | -64.5 | |||
| 10:00 | EUR | Eurozone ZEW Economic Sentiment Dec | -25.3 | -38.7 | ||
| 11:00 | USD | NFIB Business Optimism Index Nov | 90.8 | 91.3 | ||
| 13:30 | USD | CPI M/M Nov | 0.50% | 0.40% | ||
| 13:30 | USD | CPI Y/Y Nov | 7.70% | 7.70% | ||
| 13:30 | USD | CPI Core M/M Nov | 0.60% | 0.30% | ||
| 13:30 | USD | CPI Core Y/Y Nov | 6.40% | 6.30% |
Australia NAB business conditions hold up, but confidence turned negative
Australia NAB Business Confidence dropped from 0 to -4 in November, below zero for the first time since December 2021. Business Conditions dropped from 22 to 20, but remained elevated. Looking at some details, trading conditions dropped from 30 to 28. Profitability conditions dropped from 21 to 20. Employment conditions dropped from 14 to 13.
NAB Chief Economist Alan Oster. "There was a slight softening across a number of industries but the level of business conditions really still remains elevated across the board including in key consumer-facing sectors such as retail and recreation & personal services, and across the states."
"Confidence is now negative, for the first time this year, despite the strength in conditions," said Oster. "The gap between current business conditions and business confidence is now at a record level in the history of the survey – with the exception of March 2020 – pointing to heightened concerns about the resilience of the economy in the period ahead as inflation and higher rates begin to weigh on consumers."
Australia Westpac consumer sentiment bounced from near record low
Australia Westpac Consumer Sentiment Index bounced from near record low and rose 3% from 78.0 to 80.3 in December. But the level remains comparable to the lows see during the pandemic and the Global Financial Crisis.
Concerns over inflation remained dominant among respondents, followed by budget and taxation, economic conditions and interest rates.
Westpac expects RBA to continue to deliver on its "strong tightening bias" in February and hike by 25bps, and signal that there is still more work to be done.
BoC Macklem: Higher interest rates are working to rebalance the economy
BoC Governor Tiff Macklem said in a speech yesterday, "Higher interest rates are working to rebalance the economy. Domestic demand is slowing, and we expect growth in gross domestic product will be close to zero through to the middle of next year as the economy adjusts to higher interest rates. This will relieve domestic price pressures, and inflation will come down."
He reiterated the position that the central bank will be considering "whether there is a need to increase the policy rate further". He explained, "This means that decisions to raise the rate or to pause and assess the impact of past rate increases will depend on incoming data and our judgments about the outlook for inflation."
Macklem also said BoC is "watching very closely to see how the economy is responding to higher interest rates". It is looking at an job market data, how supply chains are resolving, how business are passing on costs, measures of core inflation, and inflation expectations.
GBP/USD Eyes Upside Break, US CPI Next
Key Highlights
- GBP/USD could rally further above the 1.2350 and 1.2400 levels.
- A major bullish trend line is forming with support near 1.2225 on the 4-hours chart.
- The UK Claimant count could change -13.3K in Nov 2022.
- The US CPI could increase 7.3% in Nov 2022 (YoY), down from +7.7%.
GBP/USD Technical Analysis
The British started a fresh increase above 1.2000 against the US Dollar. GBP/USD settled above the 1.2120 level to move into a positive zone.
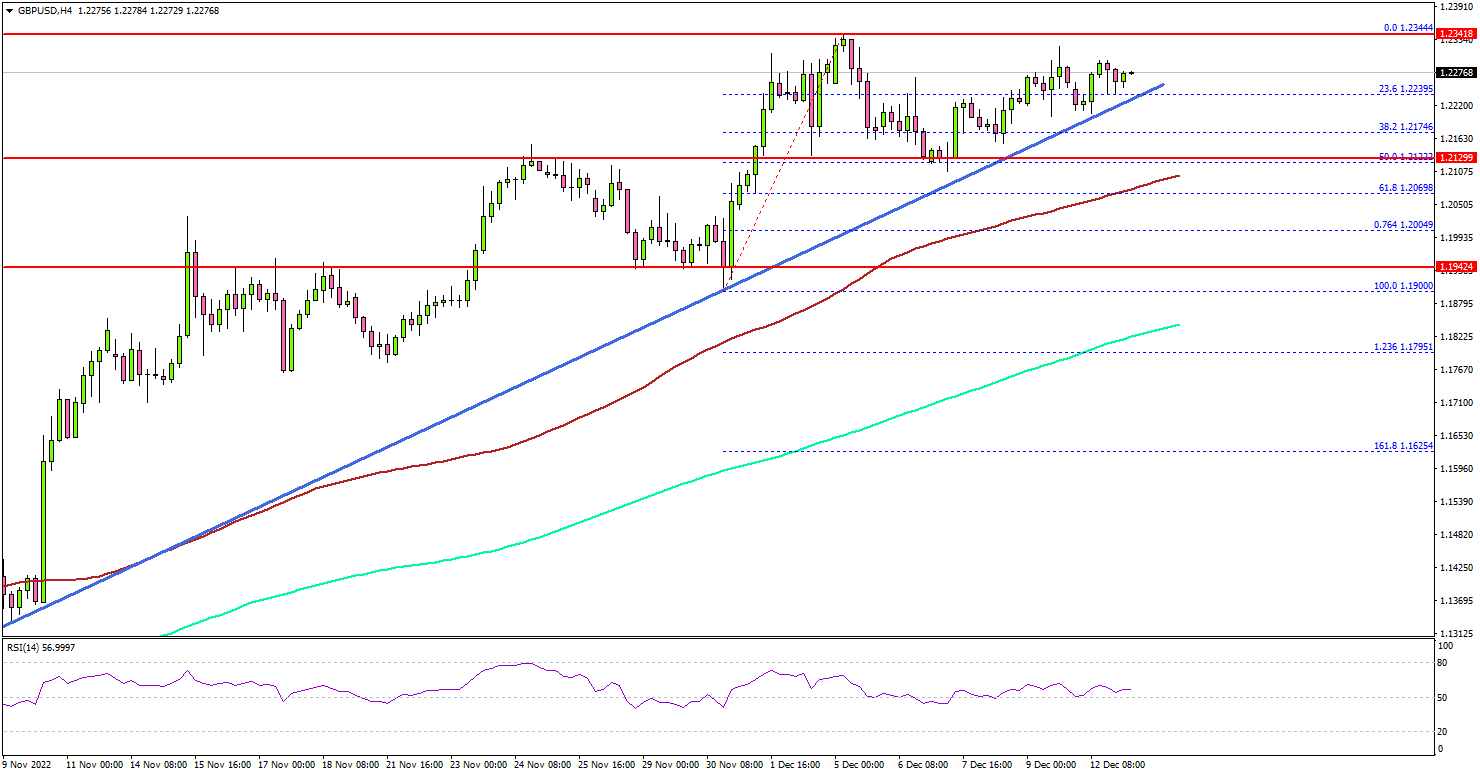
Looking at the 4-hours chart, the pair gained pace above the 1.2150 level. The pair even settled above the 1.2200 level, the 100 simple moving average (red, 4-hours), and the 200 simple moving average (green, 4-hours).
This past week, the pair attempted an upside break above 1.2350 but failed. As a result, there was a downside correction to 1.2100. It remained well supported and started a fresh increase above 1.2200.
There is also a major bullish trend line forming with support near 1.2225 on the same chart. The next major support is near the 1.2120 zone.
Any more losses might send the pair towards the 1.2080 support zone and the 100 simple moving average (red, 4-hours). If the bears push the pair further lower, there might be a test of the 1.1840 support zone.
On the upside, the pair is facing resistance near the 1.2320. The next major resistance may perhaps be near 1.2350. A clear move above the 1.2350 resistance might start another decent increase.
In the stated case, GBP/USD may perhaps test 1.2420. Any more gains could set the pace for a move towards the 1.2500 resistance zone.
Looking at EUR/USD, the pair is also showing bullish signs and there are chances of a move above the 1.0620 resistance zone.
Economic Releases
- UK Claimant Count Change for Nov 2022 – Forecast -13.3K, versus -3.3K previous.
- UK ILO Unemployment Rate Oct 2022 (3M) – Forecast 3.7%, versus 3.6% previous.
- US Consumer Price Index for Nov 2022 (MoM) – Forecast +0.3%, versus +0.4% previous.
- US Consumer Price Index for Nov 2022 (YoY) – Forecast +7.3%, versus +7.7% previous.
- US Consumer Price Index Ex Food & Energy for Nov 2022 (YoY) – Forecast +6.1%, versus +6.3% previous.
Will the ECB Signal the Need for More Rate Hikes?
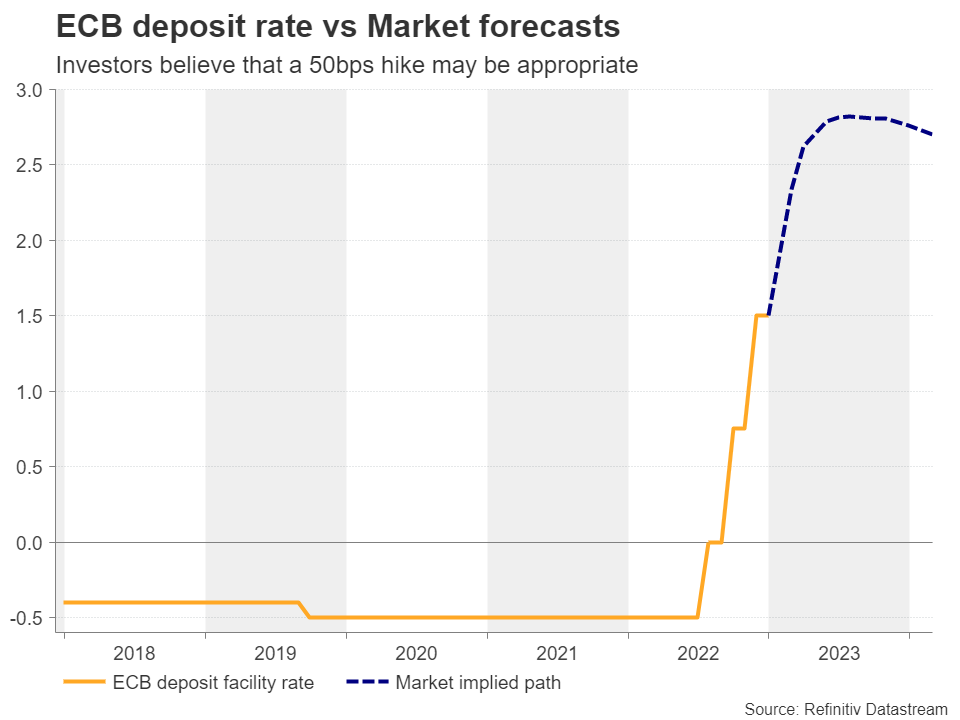
Following the slowdown in the euro area inflation during the month of November, investors changed their minds with regards to whether another triple hike is needed by the ECB, with hopes of a peak in sky-high prices allowing them to conclude that a 50bps increment may be more appropriate. The ECB meets on Thursday at 13:15 GMT, and it remains to be seen whether investors are right or wrong. A bigger question though may be what kind of signals officials will offer with regards to their future plans, and how the euro may react.
Investors believe that a 50bps hike may be appropriate
Since deciding to begin its tightening crusade in July, the ECB has been raising interest rates at its fastest pace on record, already adding 200 basis points to its key deposit rate. At its latest gathering, the Bank delivered its second 75bps hike, with the minutes of that meeting revealing that policymakers were anxious about inflation becoming entrenched.
However, according to preliminary data, inflation slowed by more than expected in November, with the headline rate of the harmonized index of consumer prices sliding to 10.0% y/y from 10.6%. This offered a degree of relief to investors, who scaled back bets of a third triple hike and became more convinced that a 50bps increment may be appropriate. That said, according to money markets, there is a decent 30% chance of another triple hike, which means that not all participants believe that a slowdown is appropriate. According to a Reuters poll, 7 out of 60 economists surveyed also believe that a more aggressive action is warranted.
Spotlight to fall on accompanying language
Ergo, a 50bps hike may come as a disappointment to those expecting a bolder move and the euro may slide on such a decision. That said, any hike-related retreat may remain limited and short-lived, as a half-point hike is the base case scenario. Traders are likely to quickly turn their attention to the accompanying statement for clues and hints with regards to the Bank’s future course of action. Although the updated macroeconomic projections are a downside risk for the euro, as they could point to a recession in 2023, a hawkish message and even a split Council with some members favoring a larger hike could eventually prove supportive for the euro.
Ahead of the November inflation data, ECB President Christine Lagarde said that inflation has not peaked, while chief economist Philip Lane more recently said that they will have to raise rates several more times, even if inflation is now close to its peak, remarks which add some credence to the hawkish case.
Economic releases permit a hawkish tone
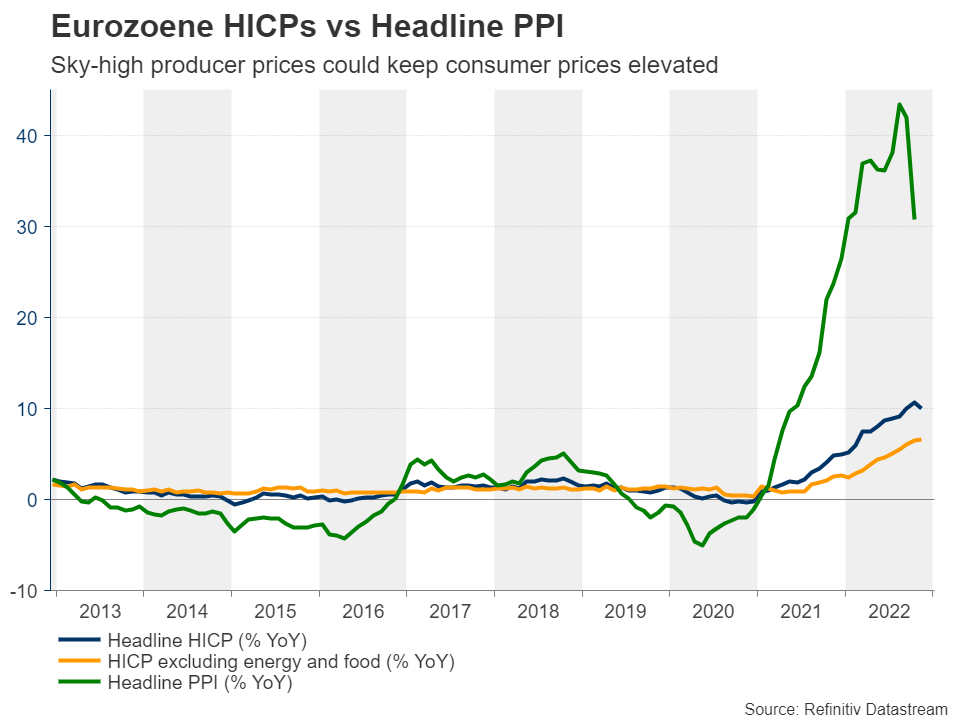
After all, headline inflation remains in double digits, core inflation has yet to show signs of topping, while the headline PPI rate, despite a deep slowdown during last month, remains at unparalleled levels (around 30%). Surging producer prices could well be channeled into consumer prices in coming months, which doesn’t allow room for complacency. On top of that, the S&P Global composite PMI pointed to another month of contraction in November, but it rose instead of sliding like it was initially forecast. Yes, a recession in the euro area seems inevitable, and the ECB’s forecasts may well confirm that, but the PMIs may have added to hopes that the wounds may not be as deep as feared a couple of months ago, thereby giving another reason to policymakers for signaling that this fight against inflation is not over yet.
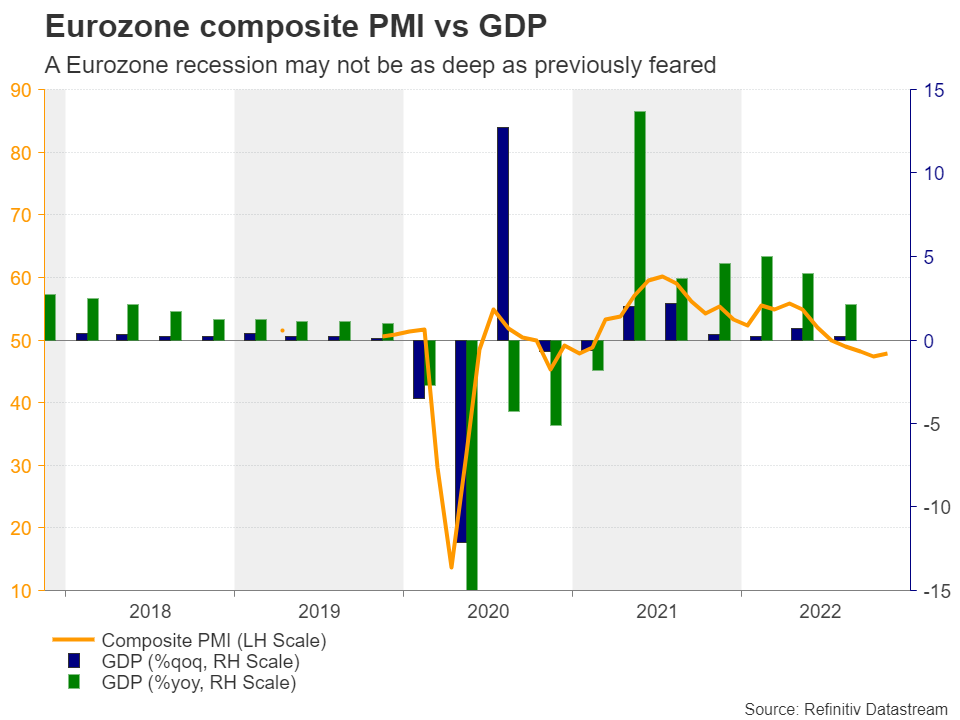
This tilts the risks surrounding the reaction of the euro to the upside, even in the case of a 50bps hike. For the euro to stay wounded in the aftermath, the statement and President Lagarde may have to signal and highlight that inflation has already peaked, which according to the aforementioned data doesn’t seem a likely scenario.
Euro/dollar awaits not only the ECB, but the Fed as well
However, how the euro will perform against its US counterpart may also depend on the outcome of the FOMC decision just the day before. So, for the common currency to perform well against the greenback in case ECB officials appear in their hawkish suits, the Fed decision may need to have a dovish flavor. A median dot for 2023 below the terminal rate projected by the market could perhaps do the trick. Of course, if the ECB pushes the triple-hike button for a third consecutive time, the euro is likely to shoot higher without caring what the Fed has done.
From a technical standpoint, euro/dollar has been struggling to break above the 1.0600 zone, which offered strong resistance back in June and also coincides with the 38.2% Fibonacci retracement level of the May 2021 – September 2022 downtrend. A dovish Fed and/or a hawkish ECB could result in the break above that obstacle, a move that could see scope for upside extensions towards the 1.0800 territory, marked by the high of May 30.
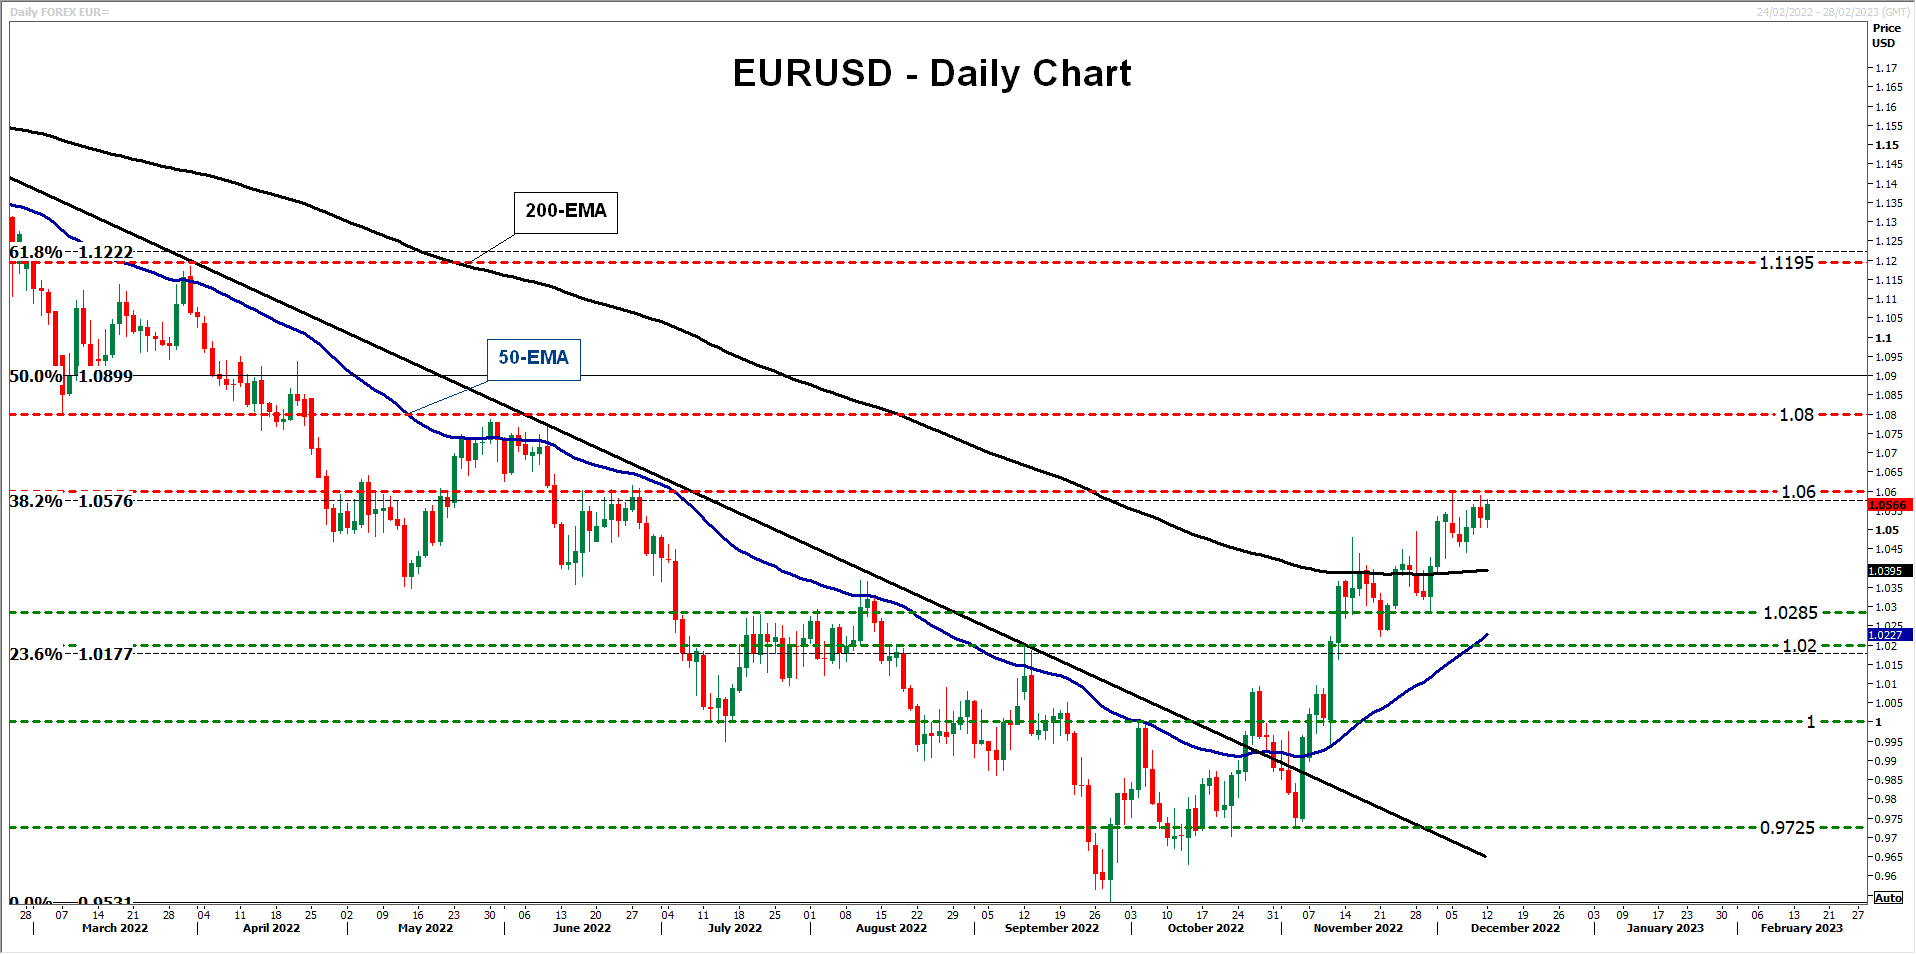
Now, in the less likely case of ECB policymakers signaling that euro area inflation has already peaked, the pair may pull back and perhaps test the support zone of 1.0285, marked by the low of November 30, or the 1.0200 area, defined as support by the inside swing high of September 12.