

Sample Category Title
Dollar Index: Primary Triple Zigzag Likely to Complete Near 101.59
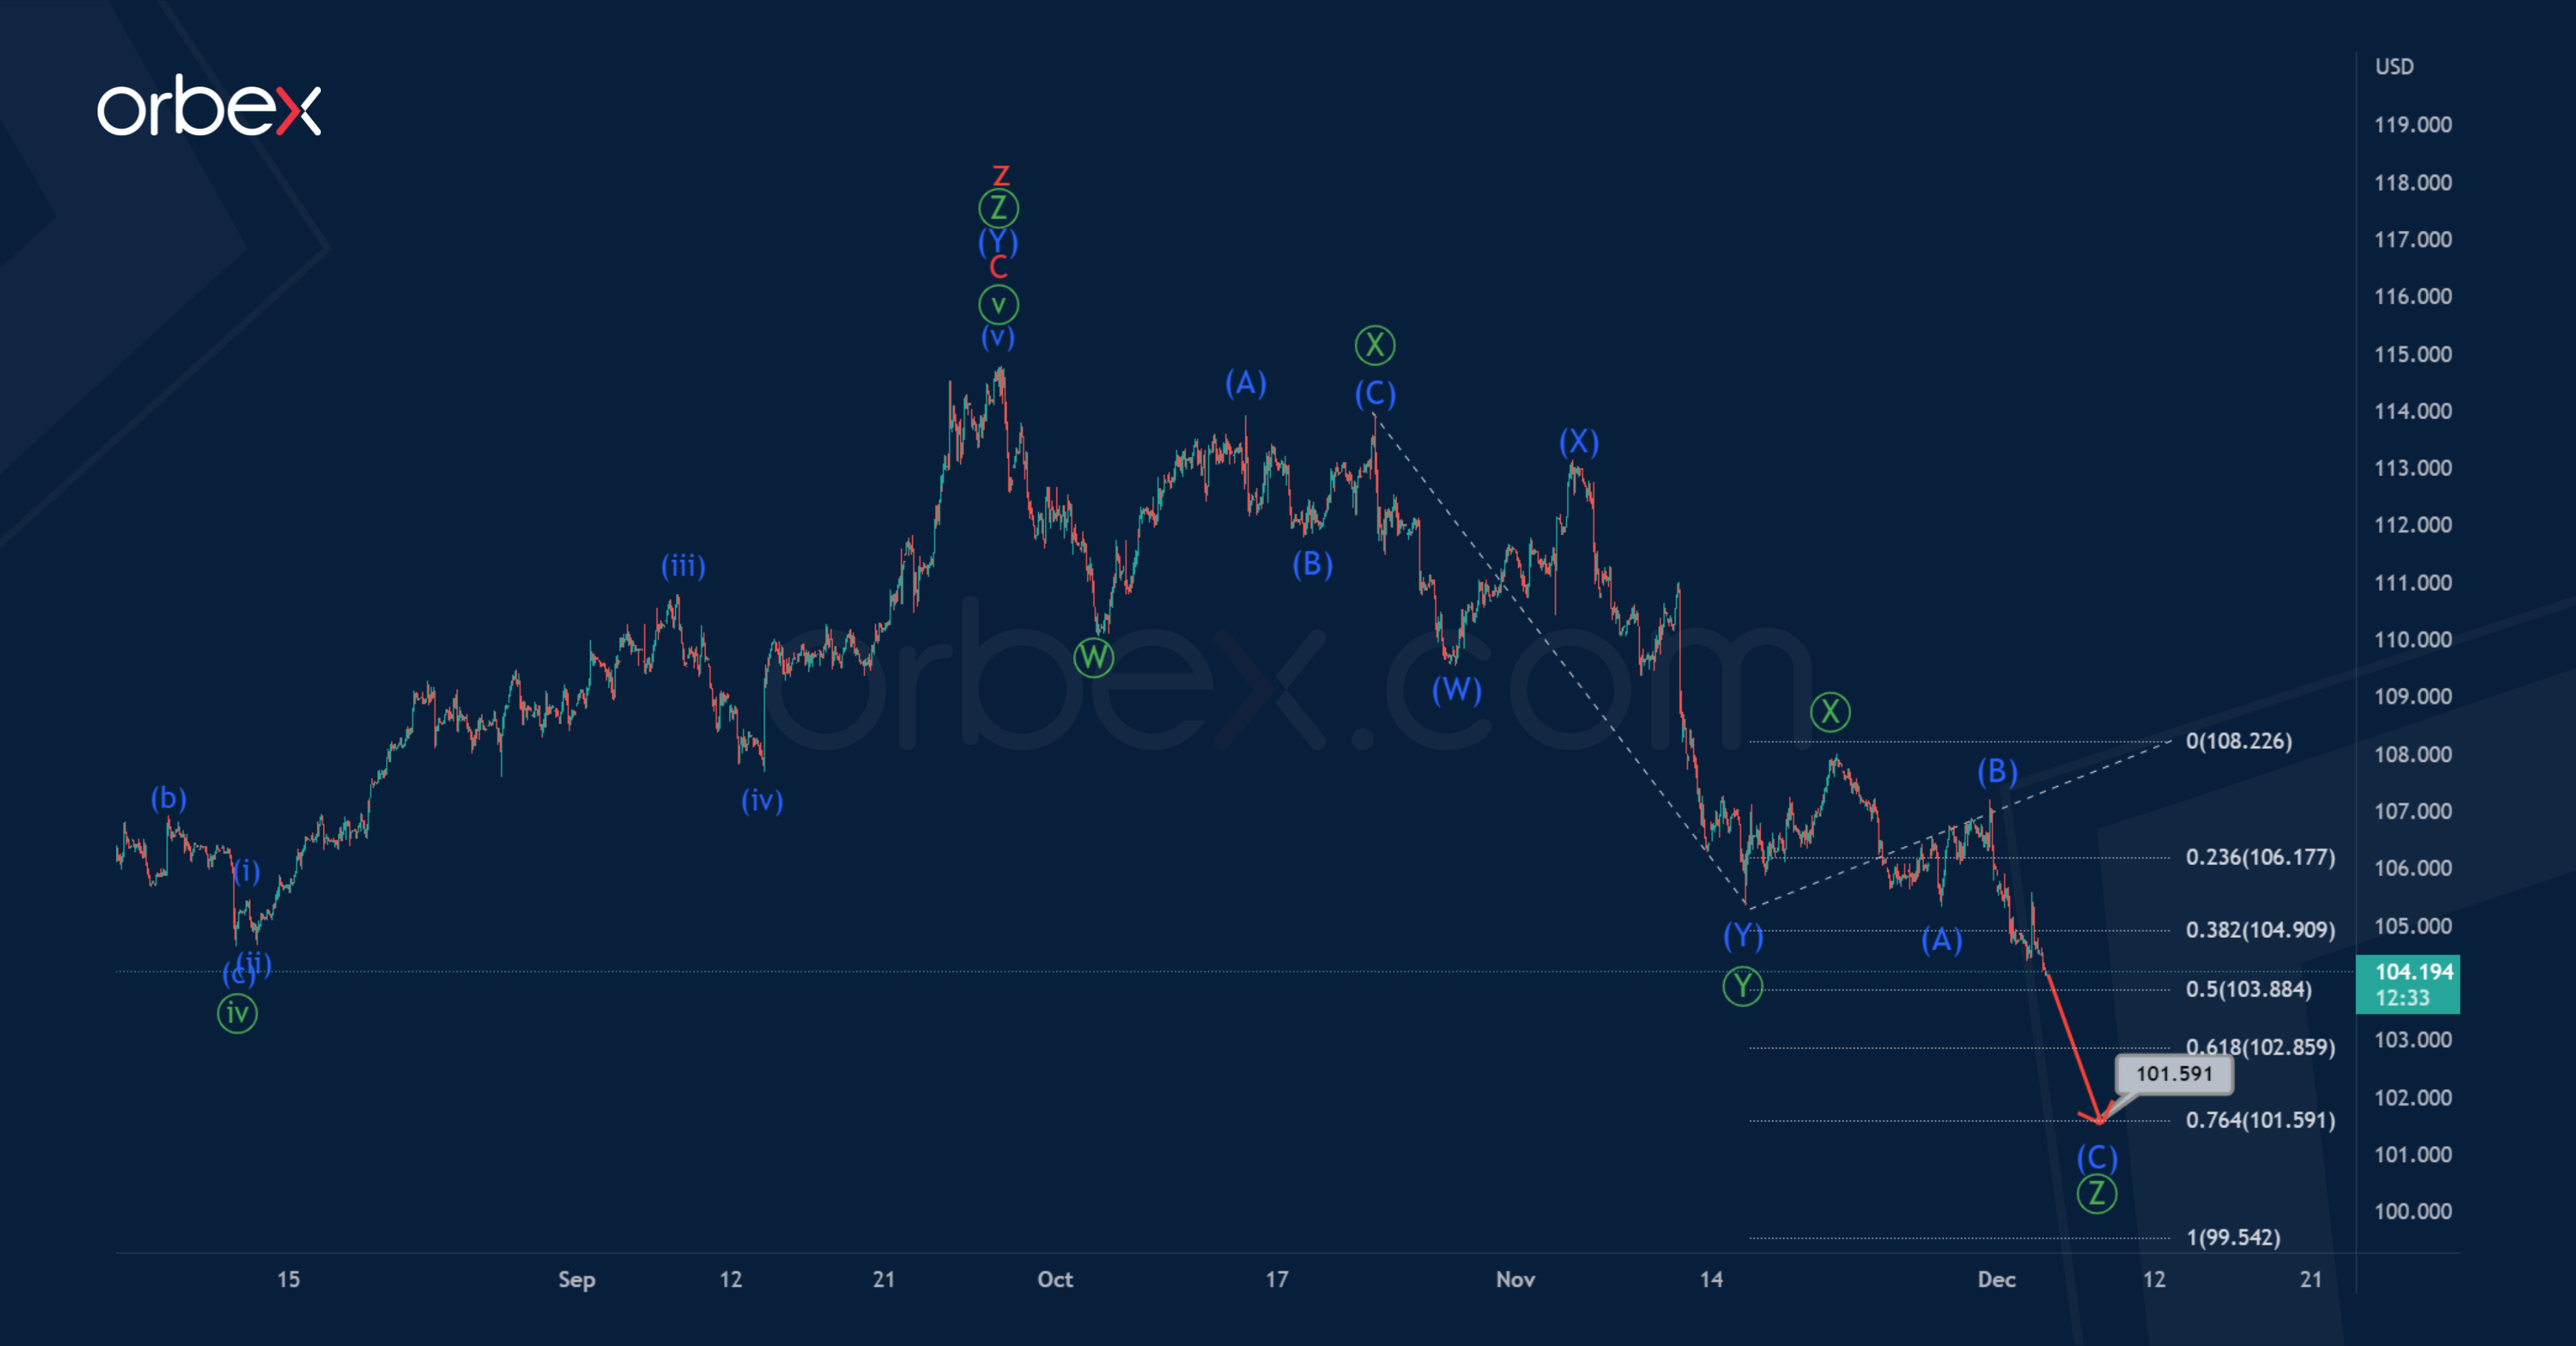
The hourly chart of the DXY index shows the end of the global corrective trend, which took the form of a triple zigzag consisting of five main cycle waves w-x-y-x-z.
Thus, the market may currently be at the beginning of the first part of a major bearish trend.
It is assumed that the bears form a triple zigzag pattern Ⓦ-Ⓧ-Ⓨ-Ⓧ-Ⓩ. It seems that the sub-waves Ⓦ-Ⓧ-Ⓨ-Ⓧ have already been completed. In the near future, the price is expected to continue falling in the primary wave Ⓩ. Its end is possible near 101.59. At that level, it will be at 76.4% of wave Ⓨ.
Let's consider an alternative option in which the formation of a cycle triple zigzag will continue.
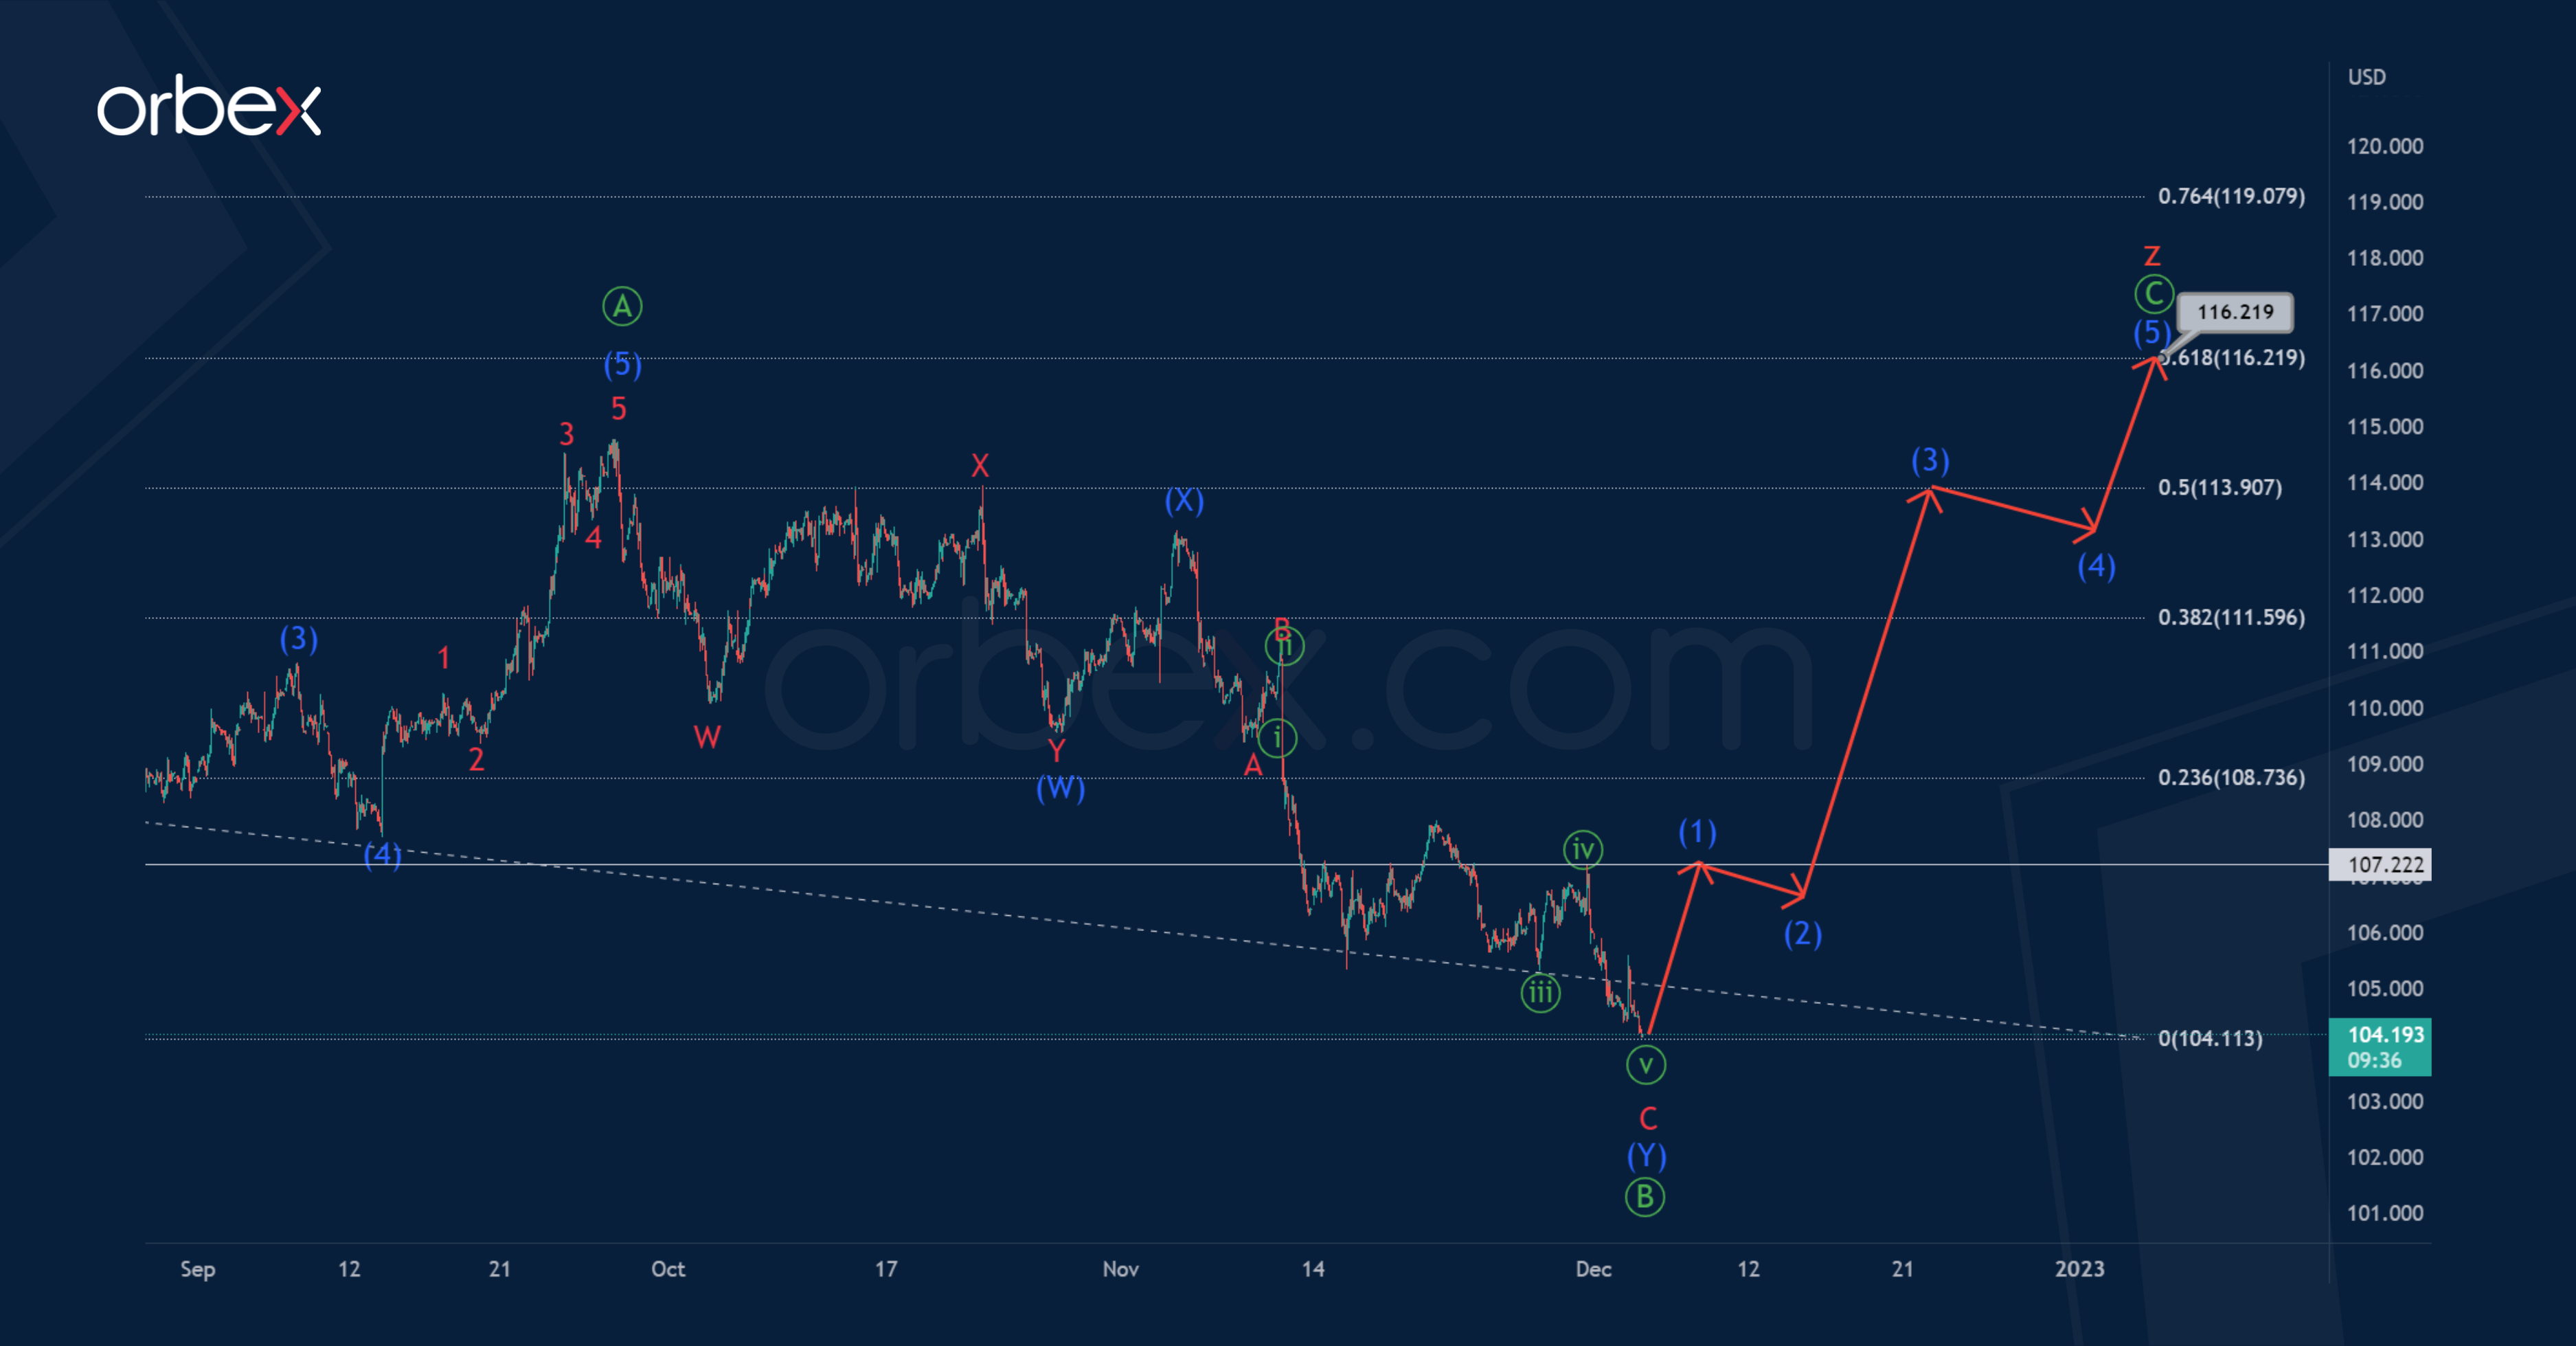
Most likely, we see a zigzag price movement in the wave z.
The wave z may take the form of a zigzag Ⓐ-Ⓑ-Ⓒ, where the first impulse Ⓐ and the correction Ⓑ in the form of an intermediate double zigzag are already completed. The entire wave z can complete its pattern near 116.21 level. At that level, it will be at the 61.8% Fibonacci extension of wave y.
The first sub-wave (1), which is part of the primary wave Ⓒ, is likely to reach the level of 107.22, marked by a minute correction.
US 30 Bounces off Support
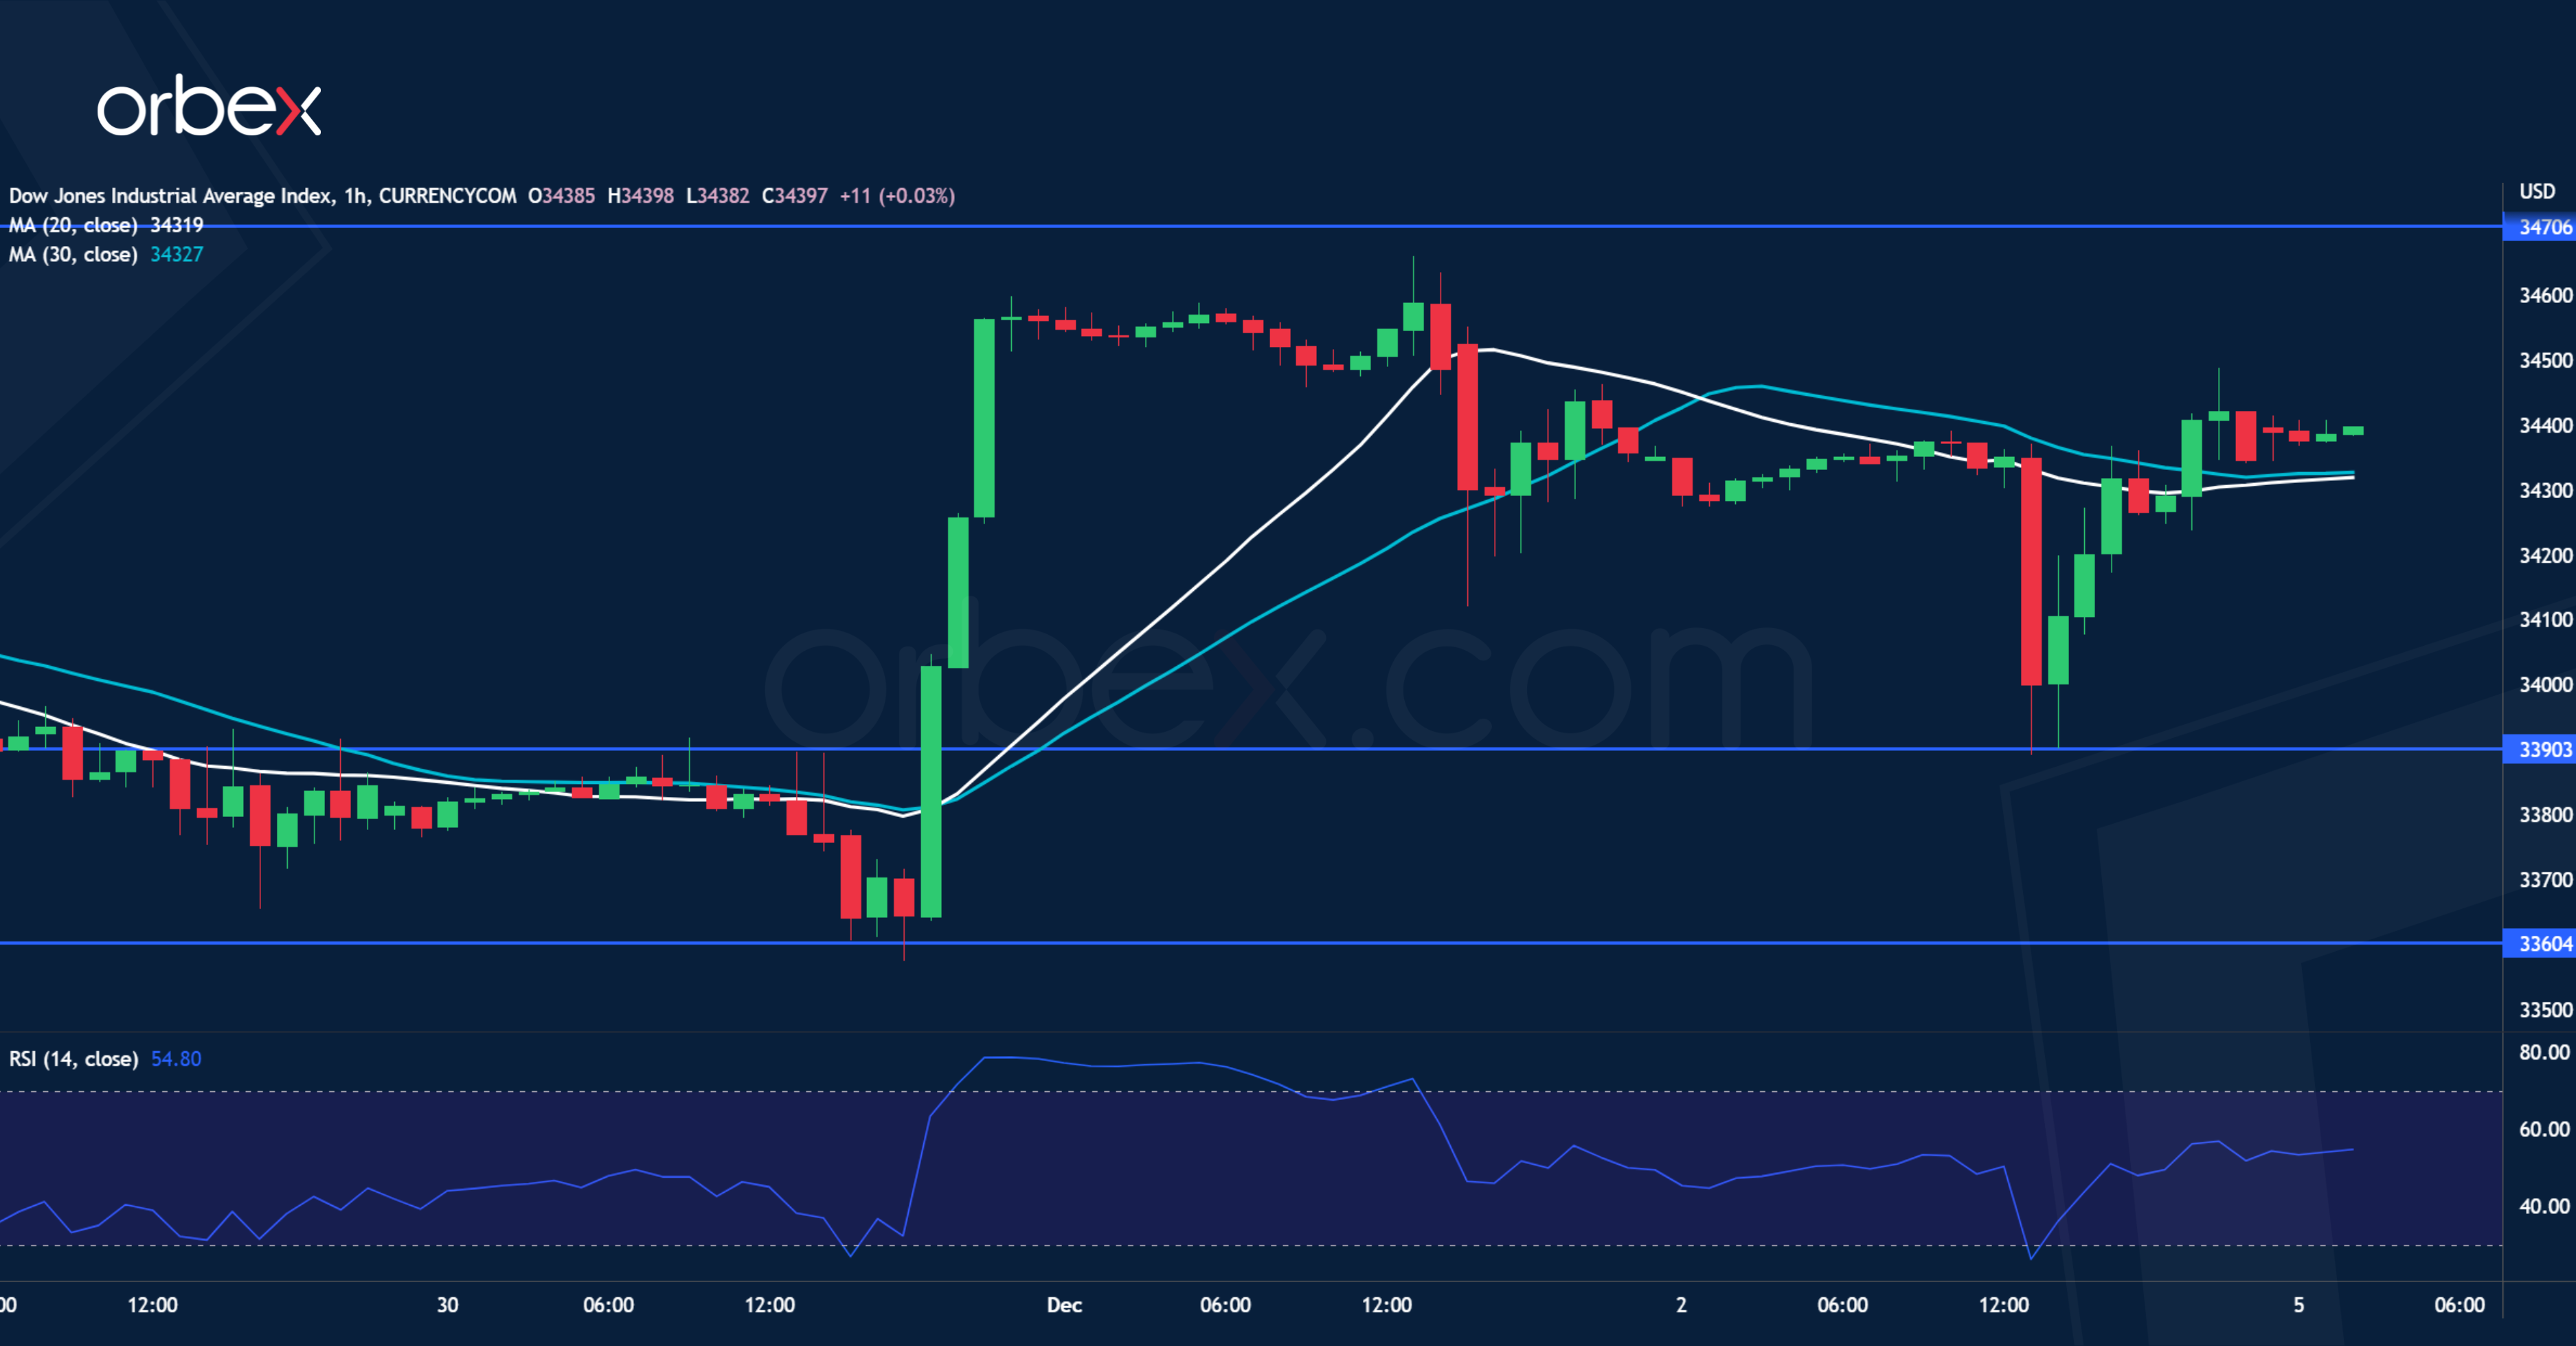
The Dow Jones 30 whipsawed as traders took profit post-NFP. The index has been looking to hold onto its recent gains after a rally above August’s high of 34300. A bounce off the previous consolidation range near 33600 and over the 20-day moving average suggests that the uptrend is still intact. The demand zone between 33600 and 33900 is key in keeping the current bullish framework valid. A close above 34700 could trigger a new round of momentum buying and send the price to last April’s high of 35500.
EUR/GBP Struggles for Support
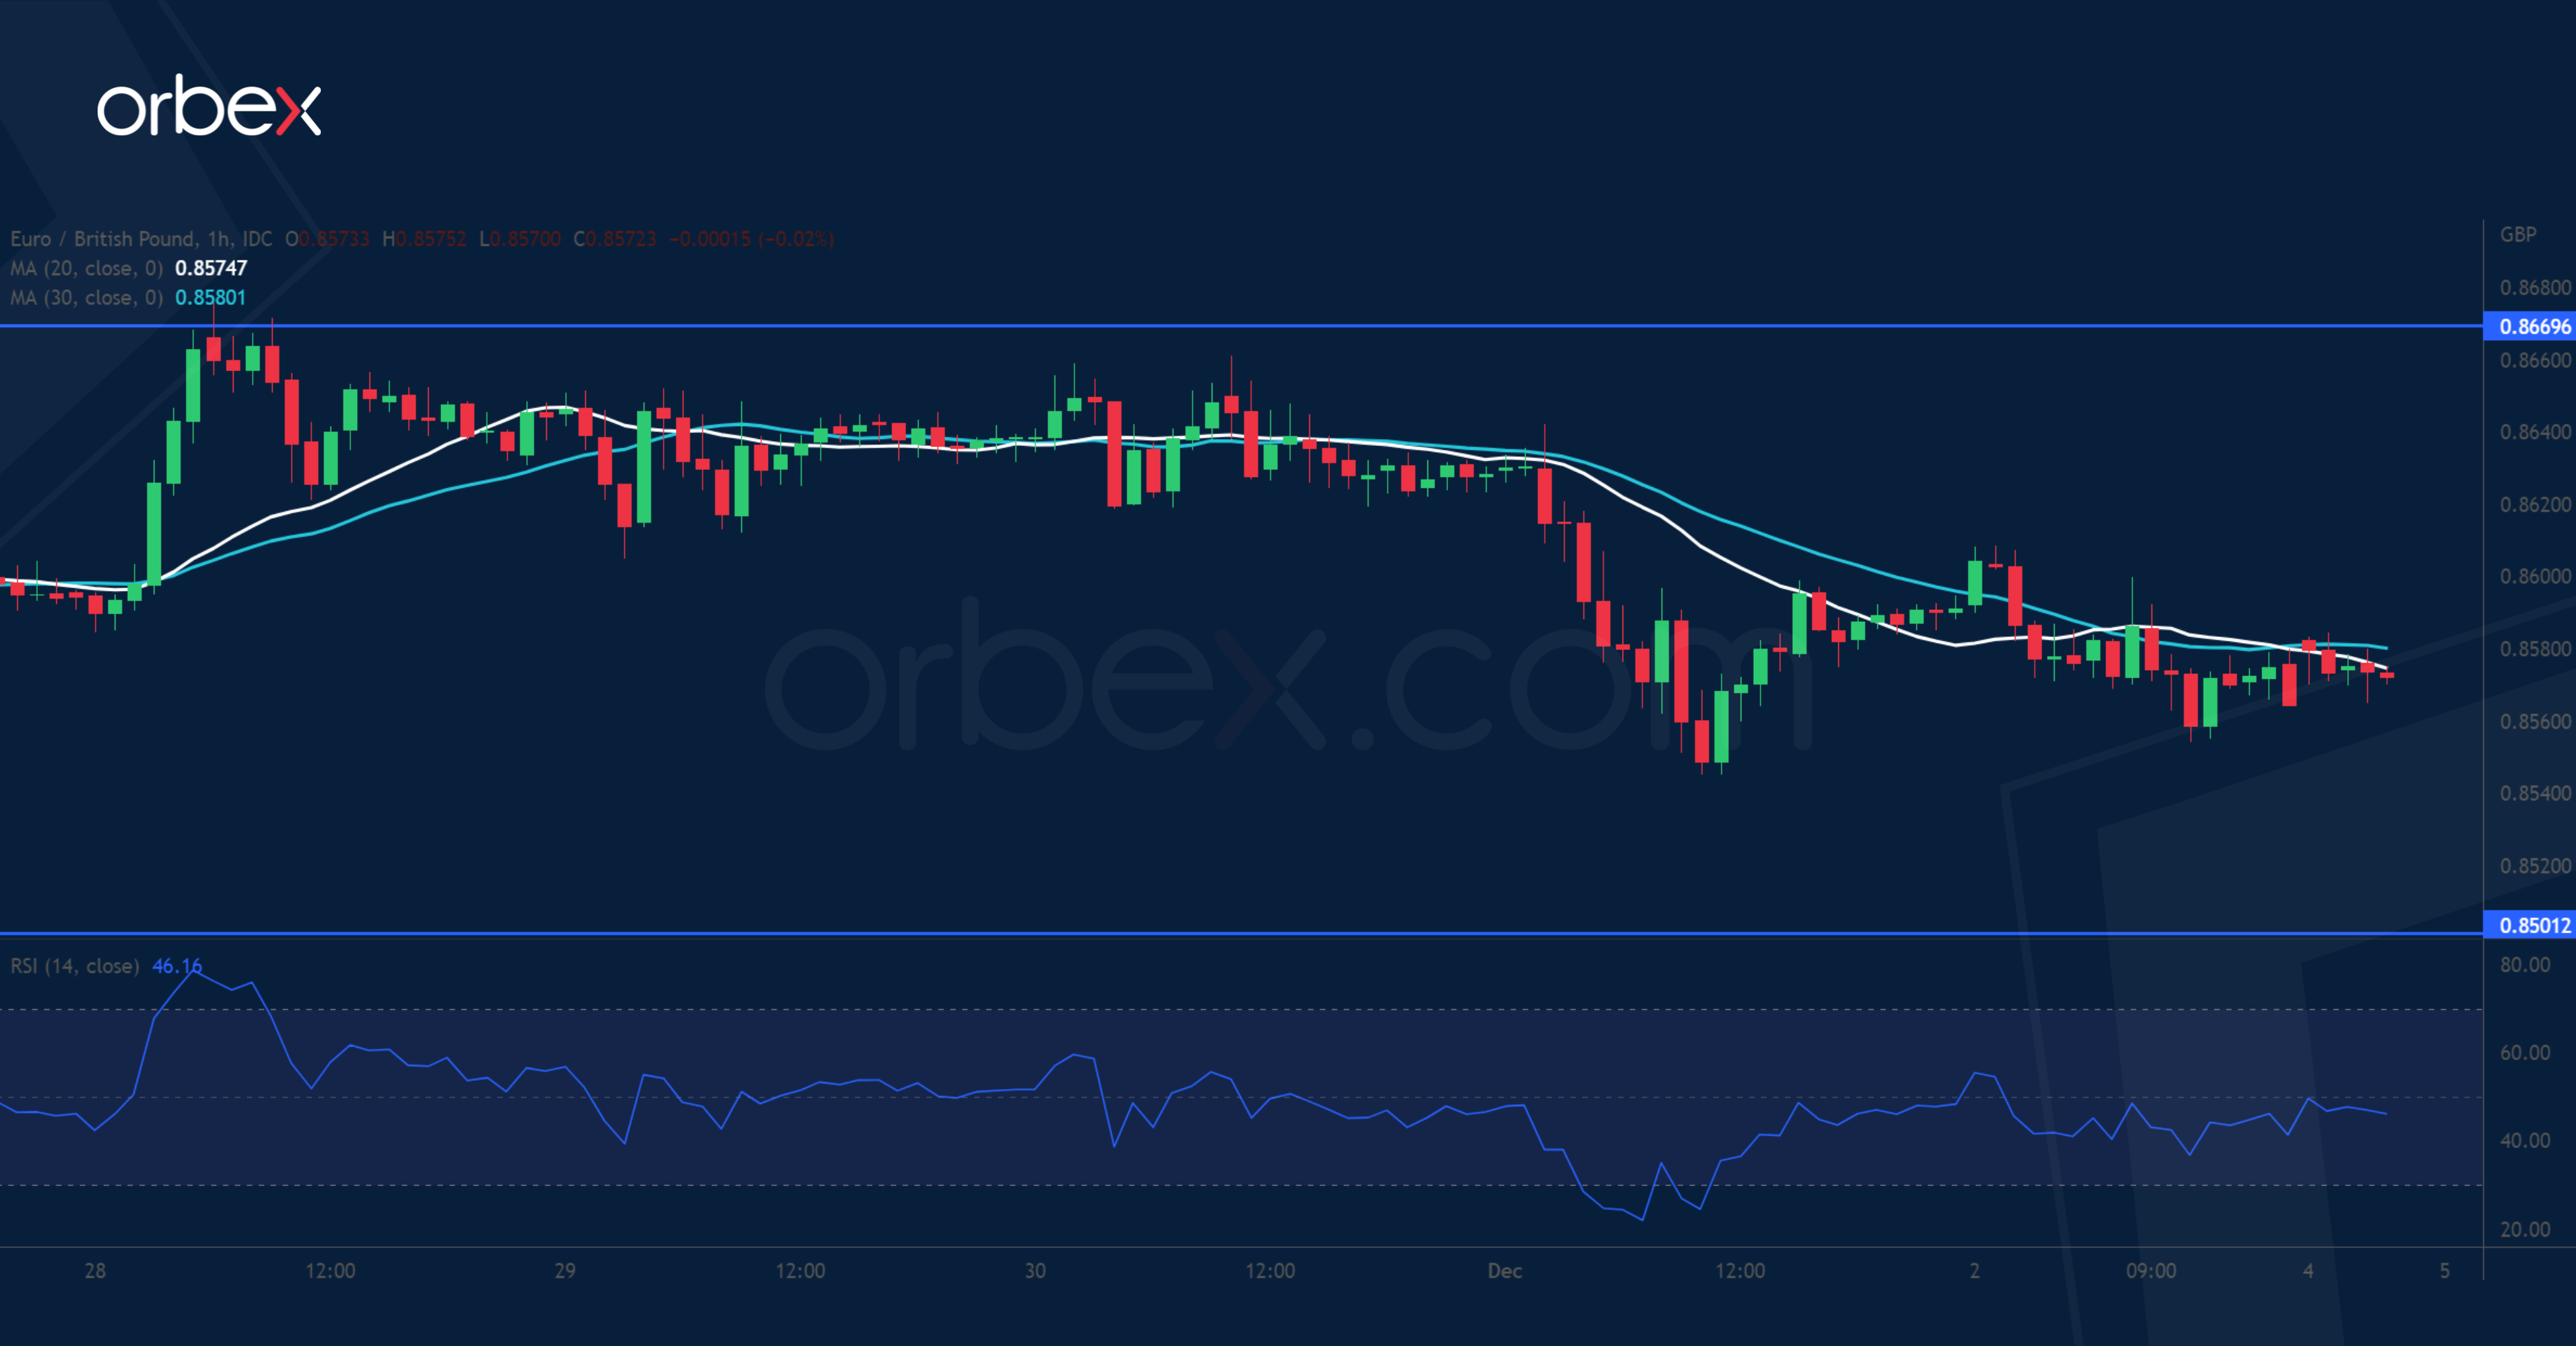
The higher-beta pound outperforms across the board thanks to improved risk sentiment. The recent rebound came to a halt at 0.8670 and a subsequent fall below the critical floor at 0.8570 indicates that the path of least resistance is down. This is an invalidation of the rally from early September after a two-month long consolidation. As buying interest becomes scarce, the bears may see a rebound as an opportunity to sell into strength. 0.8500 would be the next target should the sell-off regains momentum.
USD/CHF Remains Under Pressure
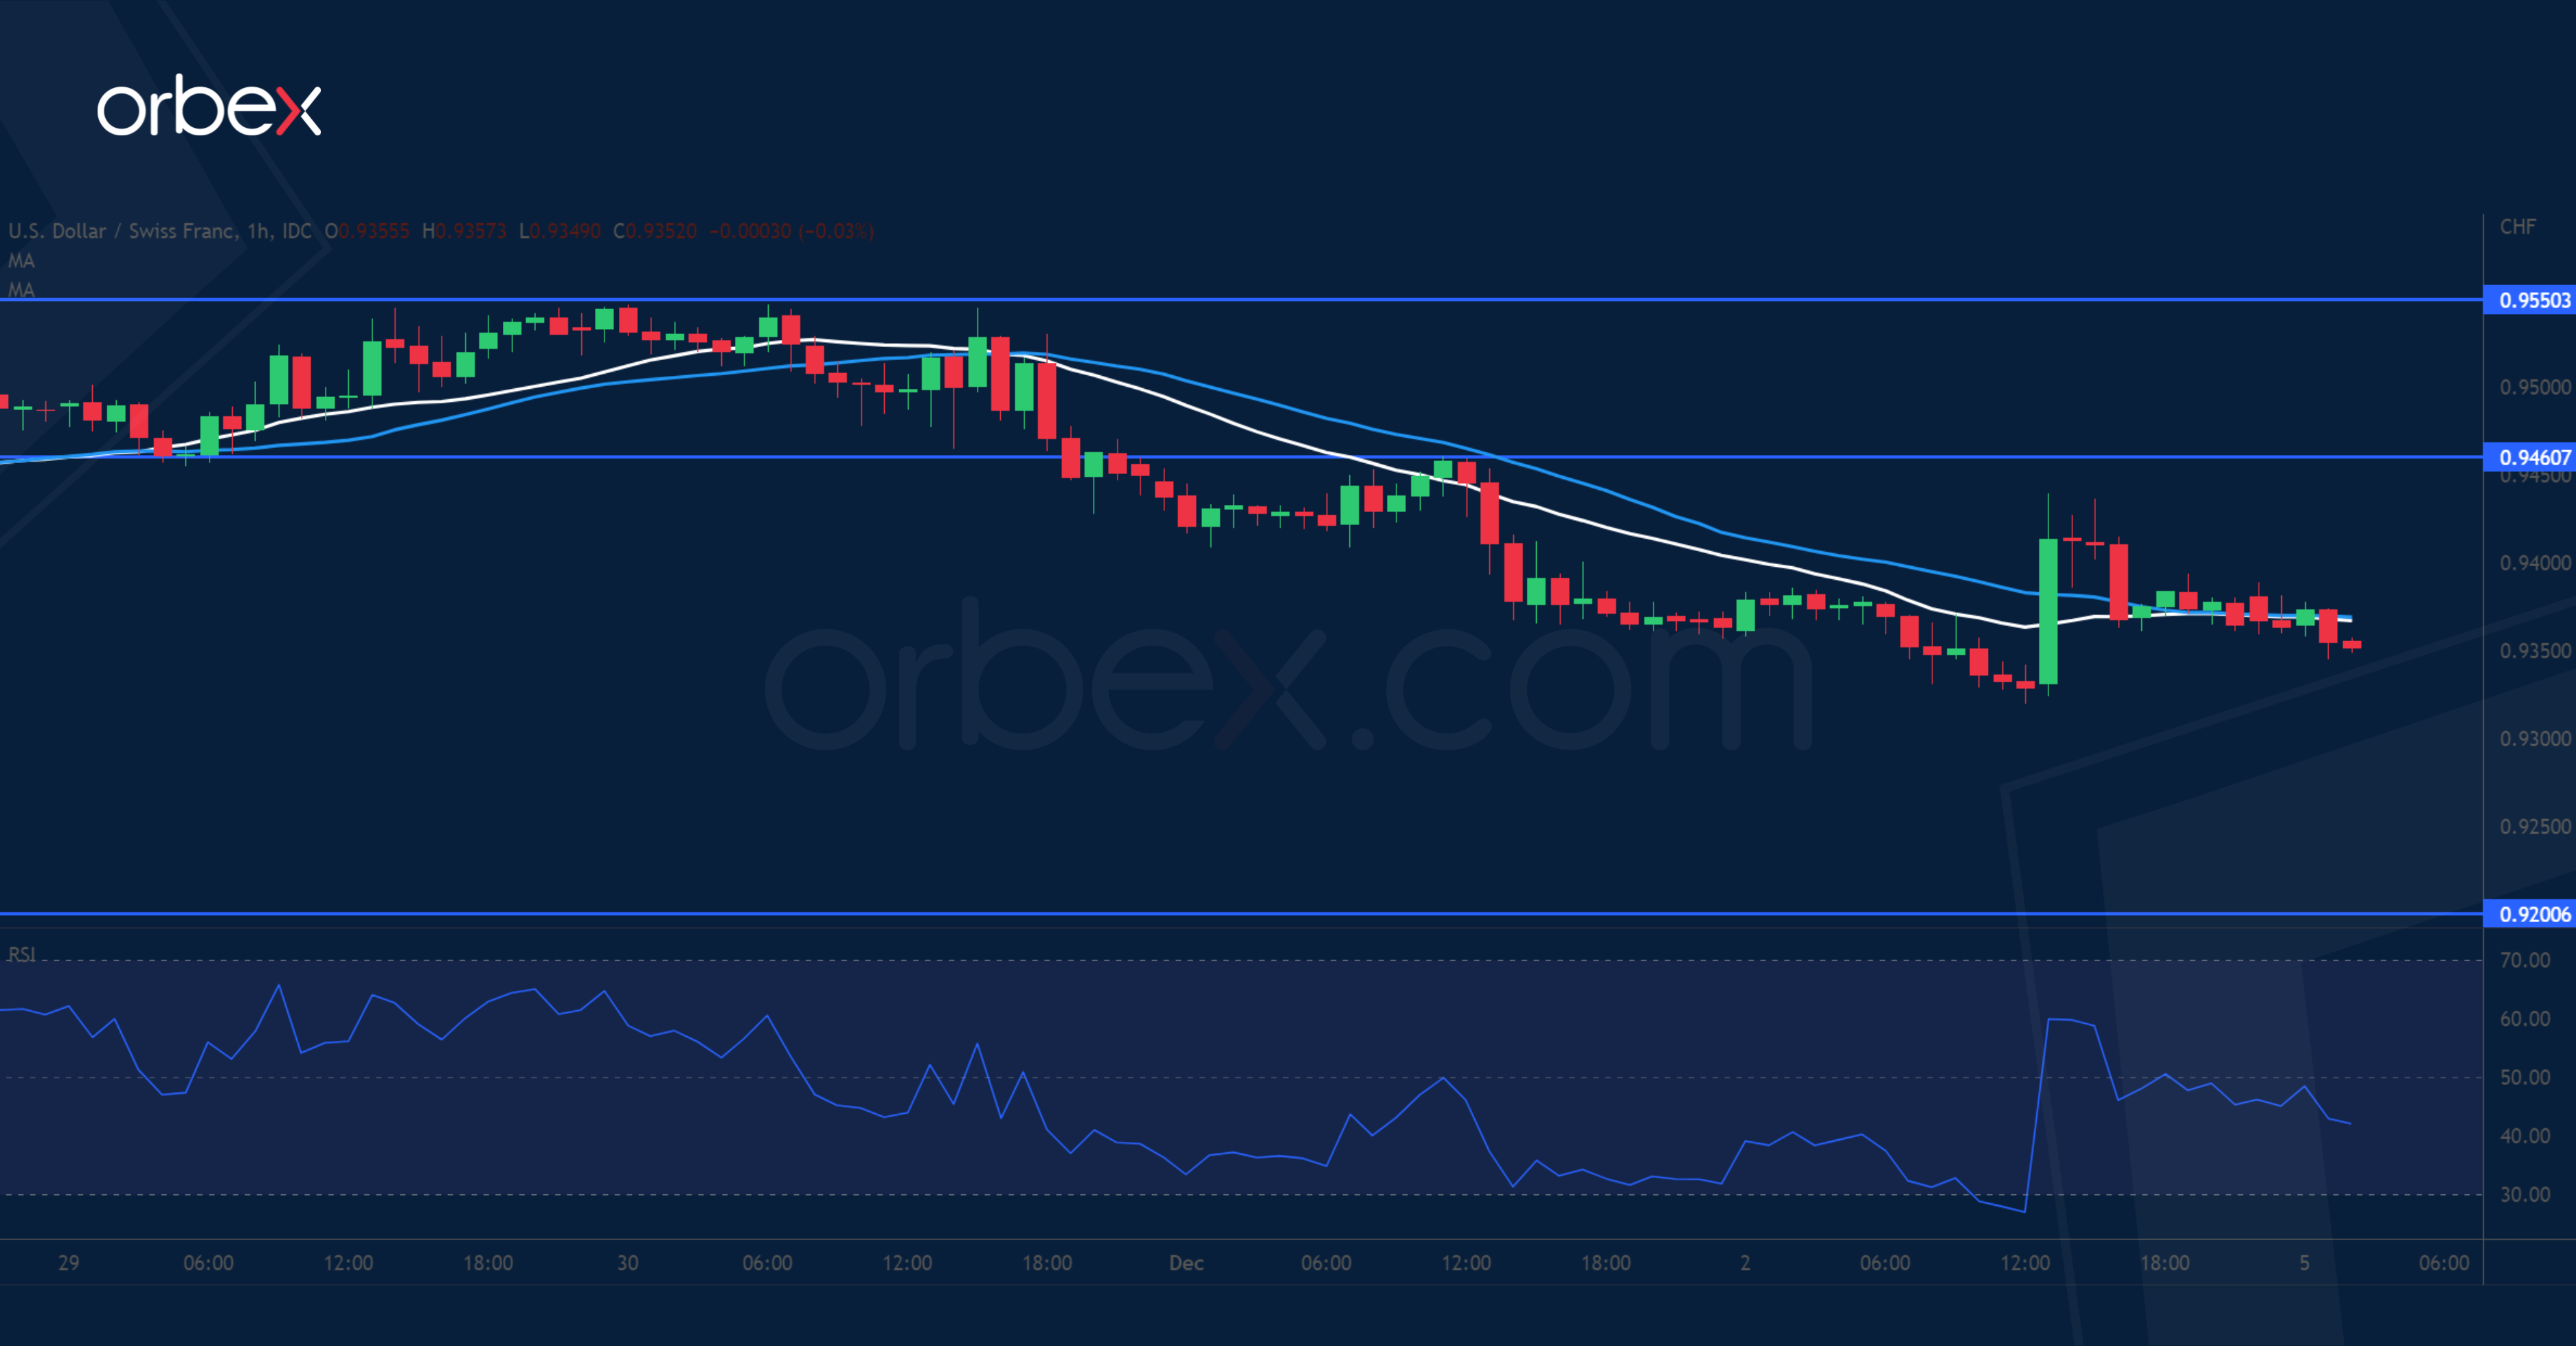
The US dollar jumped over strong wage growth in November. A drop below the recent low of 0.9370 further weighed on sentiment by invalidating the double bottom between August and November. As the latest buyers are forced to bail out, the directional bias remains down. The pair is setting sail for last April’s low of 0.9200. The RSI’s oversold condition led to a bounce which might be capped by strong selling interest. 0.9460 is the first hurdle and the bulls will need to clear 0.9550 before they could press for a recovery.
GBP/JPY Daily Outlook
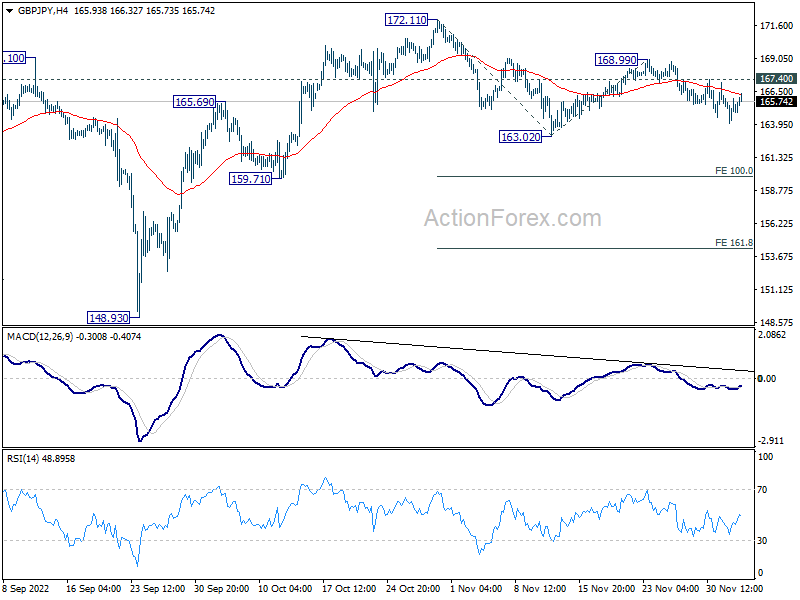
Daily Pivots: (S1) 164.10; (P) 165.04; (R1) 166.05; More...
Intraday bias in GBP/JPY is turned neutral with current recovery, but further decline is still expected as long as 167.40 resistance intact. Decisive break of 163.02 will resume the whole fall from 172.11, and target 100% projection of 172.11 to 163.02 from 168.99 at 159.90.
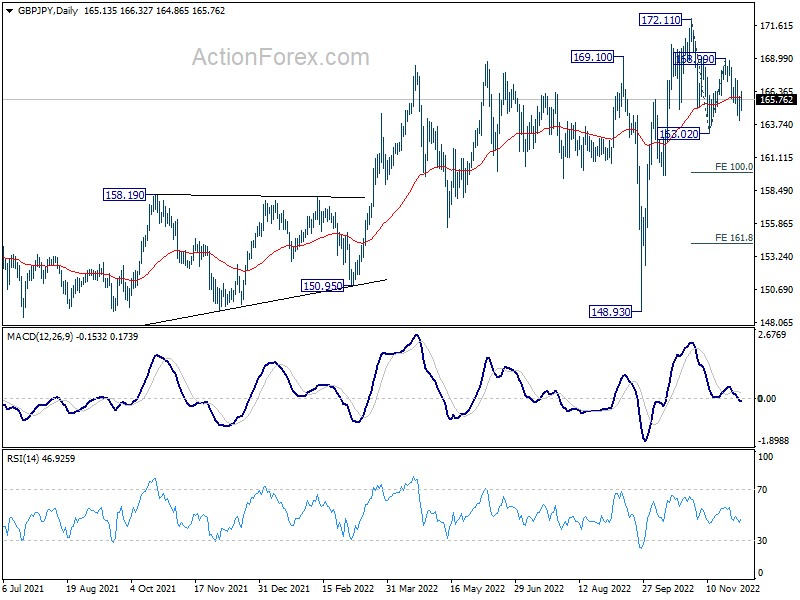
In the bigger picture, medium term upside momentum has been diminishing as seen in bearish divergence condition in weekly MACD. Sustained break of 55 week EMA (now at 160.66) will argue that it's already correcting whole up trend from 123.94 (2020 low). Nevertheless, before that, such up trend could still extend through 172.11 high.
EUR/JPY Daily Outlook
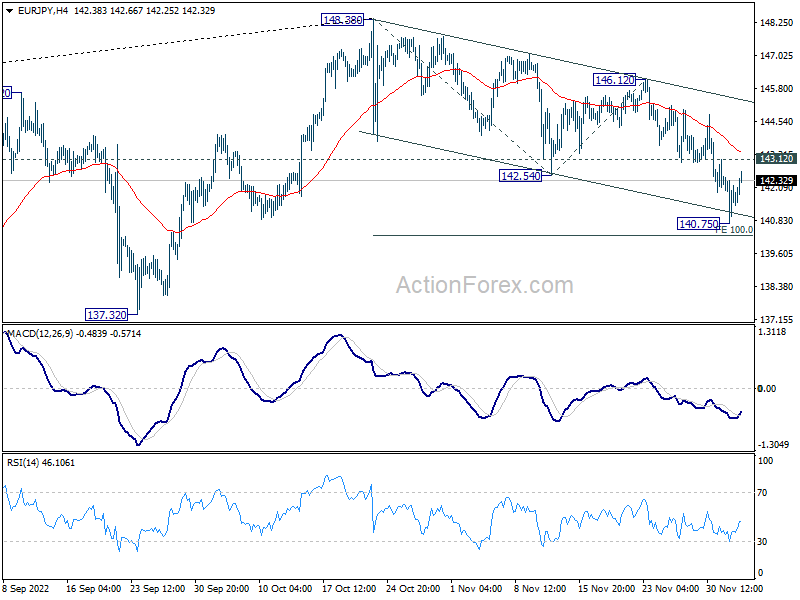
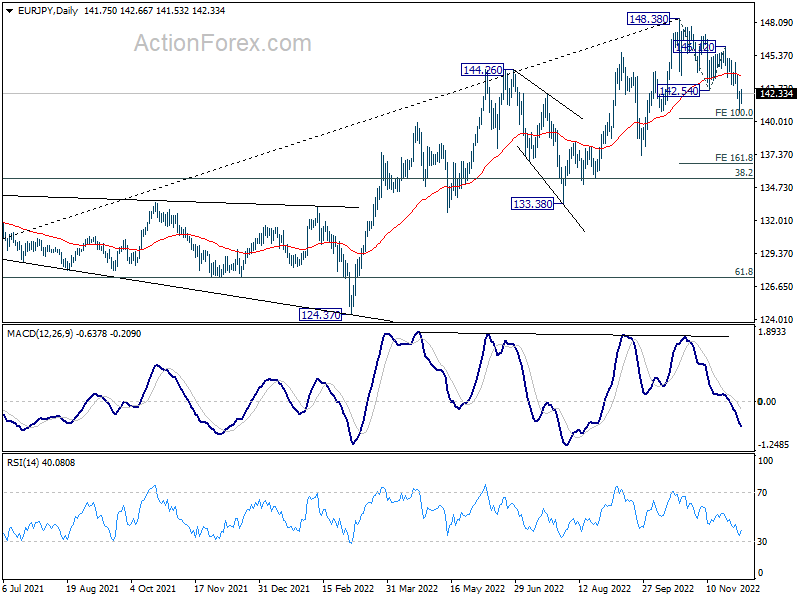
Daily Pivots: (S1) 140.75; (P) 141.61; (R1) 142.46; More....
Intraday bias in EUR/JPY is turned neutral with today's recovery. But further decline is expected as long as 146.12 resistance holds. Break of 140.75 will resume the fall from 148.38 to 100% projection of 148.38 to 142.54 from 146.12 at 140.28. Firm break there could prompt downside acceleration to 161.8% projection at 136.67 next.
In the bigger picture, considering bearish divergence condition in weekly MACD, 148.38 could be a medium term top already. Fall from there is probably correcting whole up trend from 114.42 (2020 low). Deeper decline would be seen to 55 week EMA (now at 137.37), or further to 38.2% retracement of 114.42 to 148.38 at 135.40 before completion.
EUR/GBP Daily Outlook
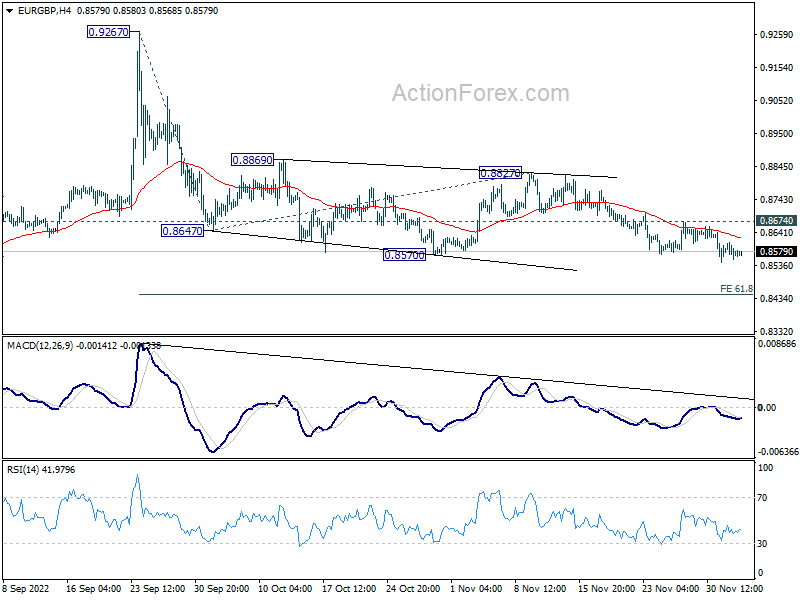
Daily Pivots: (S1) 0.8552; (P) 0.8581; (R1) 0.8605; More...
Intraday bias in EUR/GBP remains mildly on the downside at this point. Current decline from 0.9267 should target 61.8% projection of 0.9267 to 0.8647 from 0.8827 at 0.8444 next. On the upside, above 0.8674 minor resistance will turn intraday bias neutral first. But further decline will remain in favor as long as 0.8827 resistance holds.
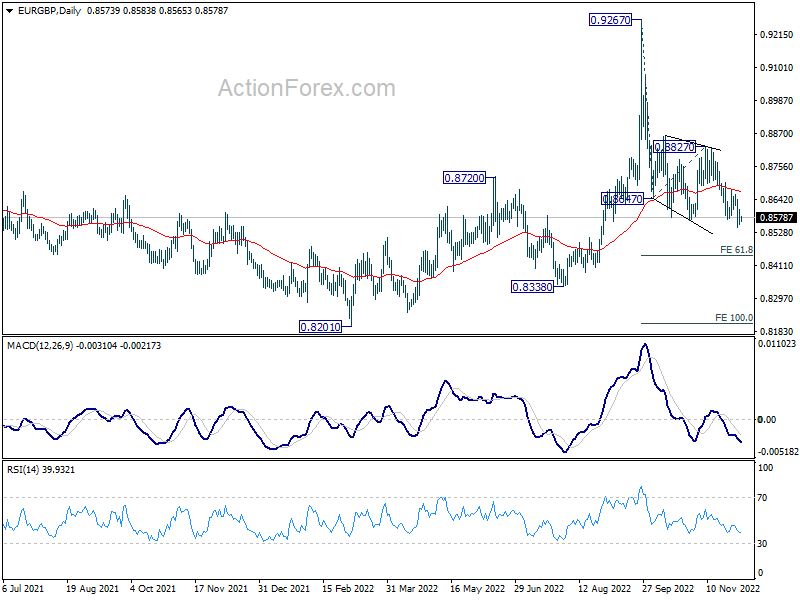
In the bigger picture, current development suggests that fall from 0.9267 is a down leg inside long term range pattern. Deeper fall could be seen towards 0.8201/8338 support zone. But strong support should be seen there to bring reversal. Nevertheless, firm break of 0.8827 resistance will turn favor to the case that such decline is merely a correction in the up trend from 0.8201. That is, further rally would be seen at a later stage through 0.9267.
EUR/AUD Daily Outlook
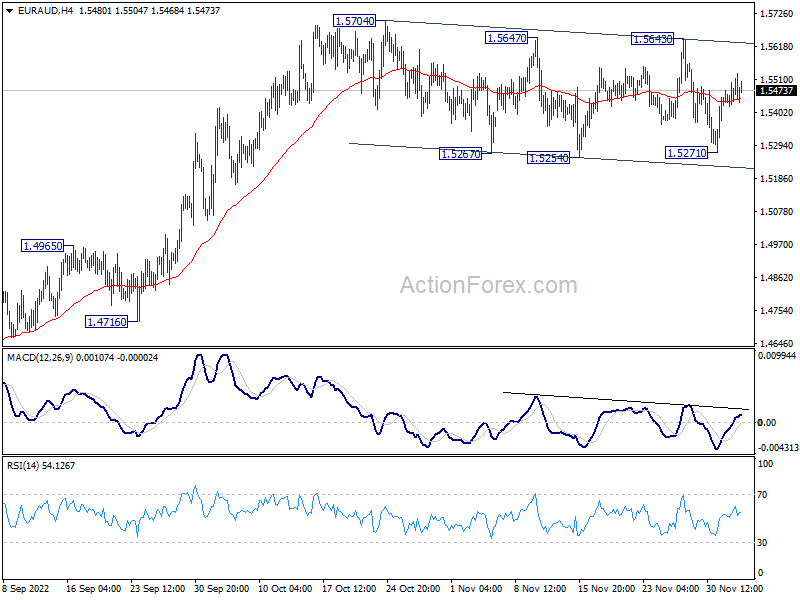
Daily Pivots: (S1) 1.5454; (P) 1.5485; (R1) 1.5547; More...
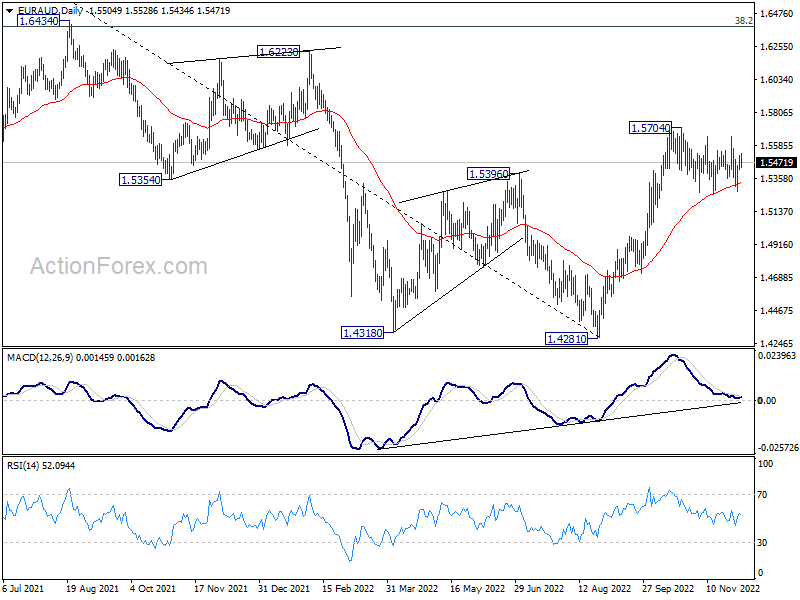
EUR/AUD is still bounded in sideway consolidation from 1.5704 and intraday bias remains neutral. In case of another fall, downside should be contained by 55 day EMA (now at 1.5332) to bring rebound. On the upside, decisive break of 1.5704 will resume larger rise from 1.4281. However, sustained trading below 55 day EMA will bring deeper correction towards 1.4965 resistance turned support.
In the bigger picture, a medium term bottom should be in place at 1.4281, on bullish convergence condition in daily MACD. Further rise would be seen back to 1.6434 key resistance next. Break of 1.4965 resistance turned support is needed to indicate reversal. Otherwise, further rally will remain in favor.
EUR/CHF Daily Outlook
Daily Pivots: (S1) 0.9838; (P) 0.9861; (R1) 0.9899; More....
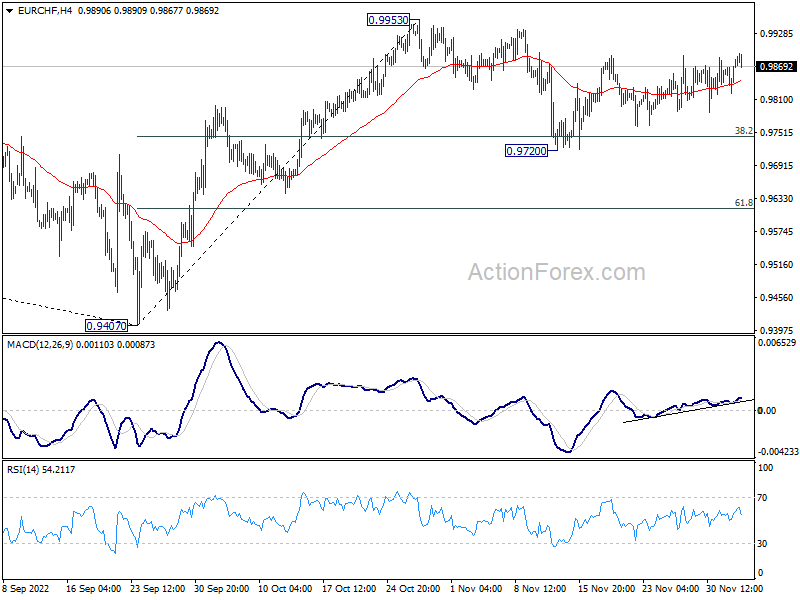
EUR/CHF is still bounded in sideway consolidation form 0.9953 and intraday bias stays neutral. On the upside, firm break of 0.9953 resistance will resume larger rally from 0.9407 to 1.0072 fibonacci level. However, break of 0.9720 will extend the decline from 0.9953 to 61.8% retracement of 0.8407 to 0.9953 at 0.9616.
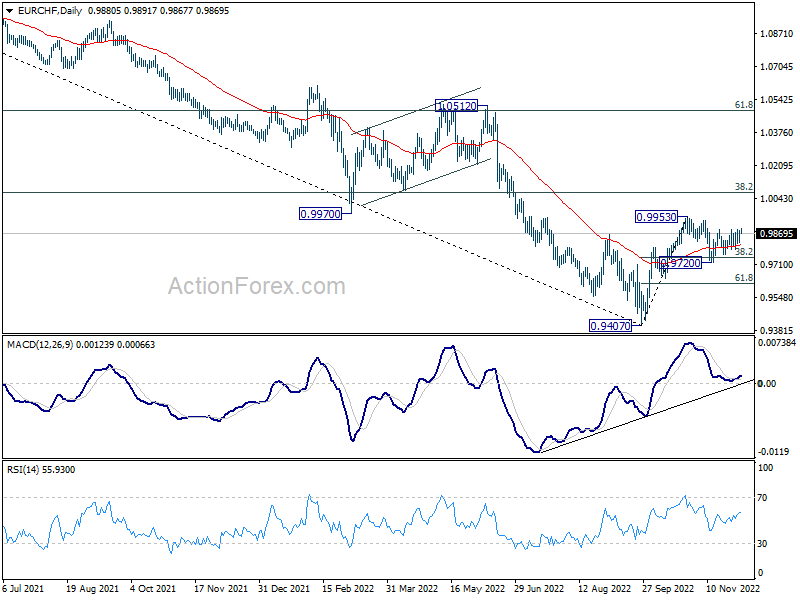
In the bigger picture, prior rejection by 0.9970 support turned resistance retains medium term bearishness. That is, while 0.9407 is a medium term bottom, price actions from there would develope into a corrective pattern rather than a reversal. Down trend resumption through 0.9407 is mildly favored at a later stage. This will remain the favored case now, as long 38.2% retracement of 1.1149 to 0.9407 at 1.0072 holds.
This Morning’s Risk Vibe is Related to Looser Chinese Covid-rules
Market
The reaction to Friday’s strong payrolls report is telling. Net job growth beat consensus at 263k with average hourly earnings growth accelerating to 0.6% M/M and 5.1% Y/Y. The unemployment rate stabilized at 3.7%, though a lower participation rate helped. The payrolls confirm the still red hot US labour market and seemed to serve as the perfect excuse to stop current corrections on bond/FX/stock markets going into the final Fed policy meeting of the year. In a first reaction, this all played out: the dollar firmed, the US yield curve turned more inverse with Treasuries falling and main US indices opening almost 2% lower. Strange enough, these Pavlov-moves didn’t gain traction. On the contrary, by the end of US dealings, most of them were almost completely erased. It all suggests strong market comfort regarding a Fed policy moderation, especially since last Wednesday’s speech by FOMC Chair Powell. This tide probably won’t change until that December 14 Fed meeting, with the only big data point remaining being next Tuesday’s November CPI readings. While the Fed will shrink the magnitude of its rate hike from 75 bps to 50 bps, markets remain very complacent about Fed speak about a higher peak policy rate peak and vowing against rate cuts in 2023. Perhaps the new FOMC dot plot might open some eyes.
US yield changes eventually ranged between +4.2 bps (2-yr) and -5.1 bps (30-yr). The US 10-yr yield is currently testing the June top at 3.5% with 50% retracement on the Aug/Oct move higher luring at 3.42%. Changes on the German curve varied between +8.6 bps (2-yr) and -2.9 bps (30-yr) by the European closing bell, but these don’t (completely) take into account the US market-reversal. The German 10-yr yield is at risk of losing 1.77%/1.82% support at the open this morning (October low/38% retracement on Aug/Oct move higher). The trade-weighted dollar spiked from 104.50 to 105.50 after payrolls, before returning this gain and sliding towards 104 this morning in a positive Asian risk climate. EUR/USD went from 1.0540 towards 1.0430 and currently changes hands near 1.0575. Next technical marks are 1.0747 (62% retracement on this year’s slide) and 1.0806 (March low). Main US stock markets closed unchanged.
This morning’s risk vibe is related to looser Chinese Covid-rules with Shanghai for example scrapping PCF testing requirements to enter outdoor public venues. Measures will continue to be optimized and adjusted. Local stock markets gain up to 4% for Hong Kong while the Chinese yuan surges below USD/CNY 7 for the first time since September as CNY strength meets USD weakness. Today’s eco calendar contains US non-manufacturing ISM, but we don’t think it will be of any relevance.
News Headline
S&P changed the outlook on the French AA rating from stable to negative as it sees rising risks to the country’s public finances and the resulting reduction in fiscal space. France already has a large general government debt which faces implementation risk associated with the country’s structural reform agenda, an economic slowdown and the ECB’s monetary tightening. S&P could lower the rating if general government debt to GDP doesn’t decline over the 2023-25 period. It reduced the 2023 growth outlook to 0.2% from 1.7% while 2023 the budget deficit is expected at 5.4% of GDP. With the deficit expected to average 4.9% in 2023-25 period, government debt is expected to rise to 112% of GDP. At the same time, Moody’s kept the outlook on its French Aa2 rating unchanged at stable as the agency sees the risks to France’s credit profile as balanced. It assesses France as a wealthy and diversified economy. The country has strong debt affordability in spite of an elevated debt level, according to Moody’s.
The Confederation of British Industry (CBI) substantially downgraded its forecast of the UK economy. CBI now expects the economy to contract 0.4% next year due to high inflation and as companies scale back investments. CBI also doesn’t expect activity (GDP) to return to a pre-Covid level before mid-2024. Unemployment is expected to rise to 5.0% end 2023/early 2024. Inflation is only expected to ease slowly. Inflation printed at 11.1% in October this year. CBI expects average price growth of 6.7% next year and 2.9% in 2024. Business investment at the end of 2024 is still seen 9% below its pre-pandemic level and output per worker 2% lower.