Sample Category Title
ETHUSD Waits for Some Volatility
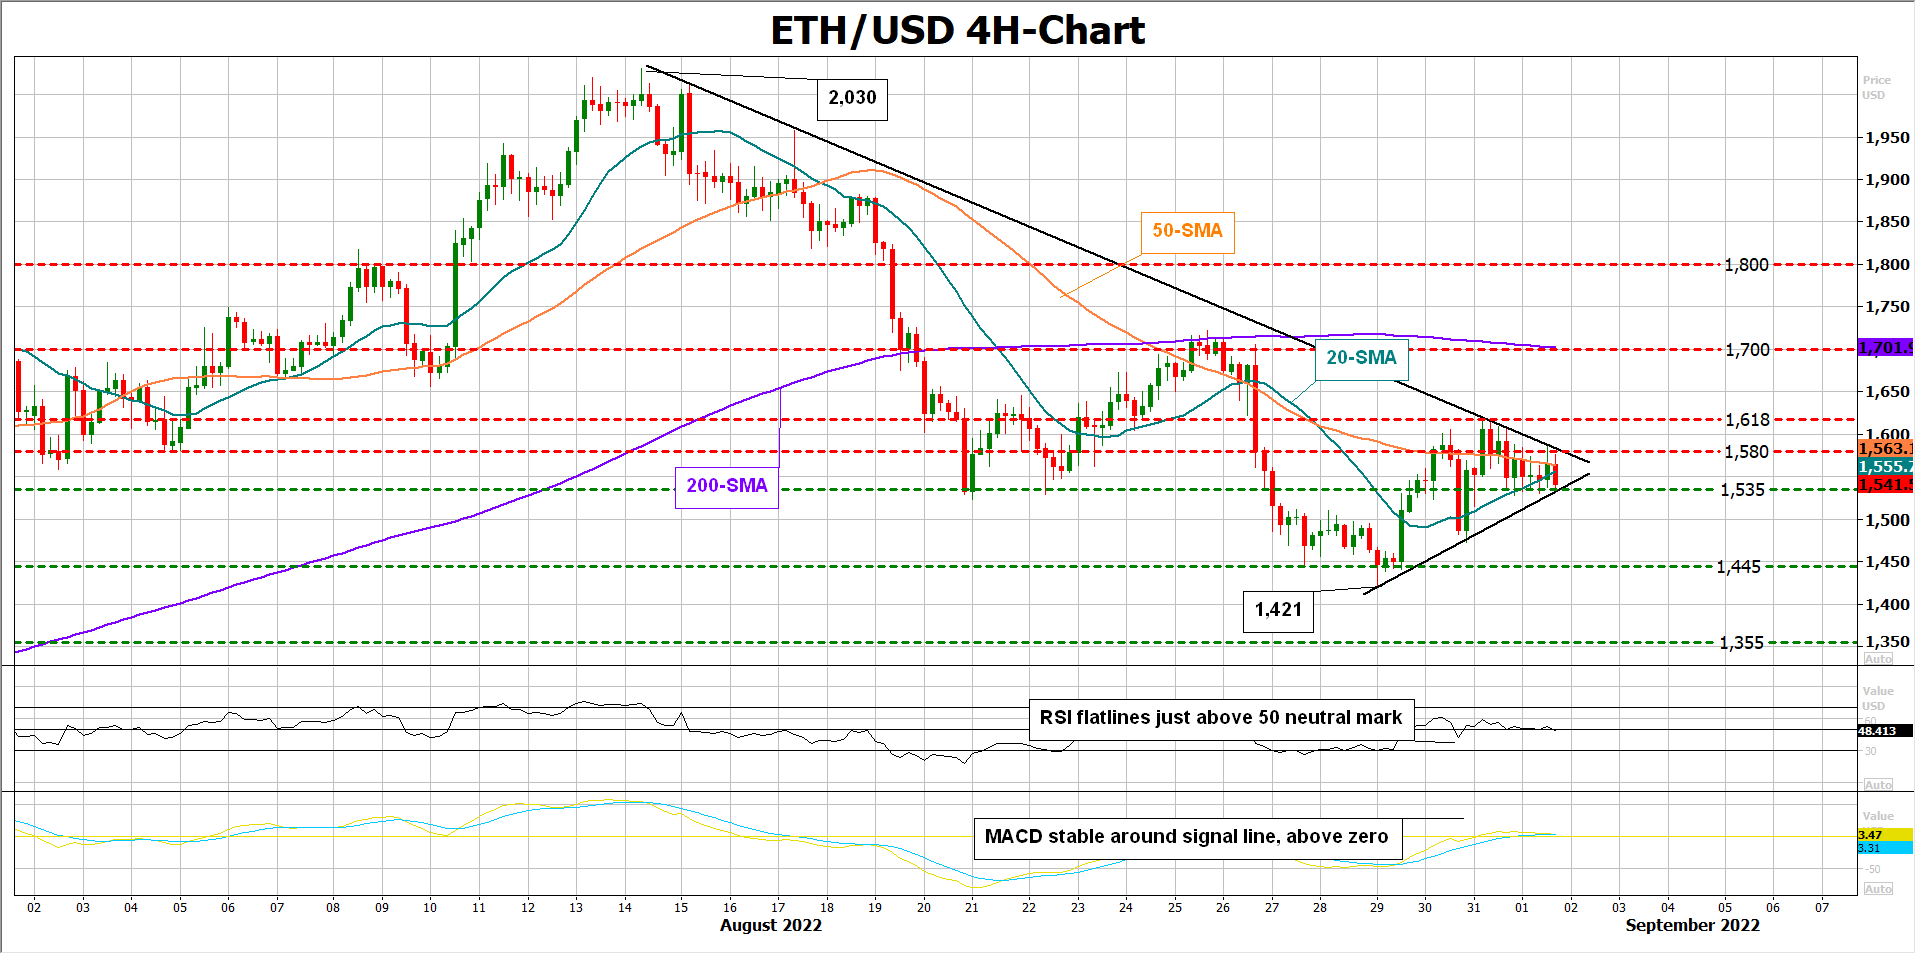
ETHUSD (ethereum) seems to be completing a symmetrical triangle within the 1,535 – 1,580 territory on the four-hour chart, formed by the resistance trendline that has been navigating the market to the downside since the August peak at 2,030 and the ascending trendline stretched from the previous low of 1,421.
The sideways trajectory in the RSI and the MACD is reflecting a neutral bias, though with the former standing marginally above its 50 neutral mark and the latter holding slightly above its red signal line, the bulls may have luck on their side.
In case the price pierces the triangle on the upside at 1,580 and closes above its latest high of 1,618, buying interest could intensify towards the constraining 200-period simple moving average (SMA) at 1,702. Another victory here could spark a new bullish wave towards the 1,800 barrier.
Alternatively, should the bears regain control below 1,535, the second most popular crypto could tumble towards the 1,445 support region, a break of which could promt an extension towards July’s trough of 1,355. Not far below, sellers may wait for a decisive close below the 1,300 – 1,275 restrictive zone before targeting the 1,300 round level.
In brief, ETHUSD is currently in a neutral mood. Any decisive move above 1,580 or below 1,535 could direct the market accordingly. Yet, in the bigger picture, only a rally above 1,700 would dissolve the negative trajectory.
Fed Continues to Guide US Economy Towards a Recession
- Despite falling into a technical recession during H1, the recent easing in gasoline prices will support positive real private consumption growth during H2.
- Headline inflation has peaked, but labour market and underlying price pressures remain strong. Fed will be forced to hike US economy into a recession in 2023.
- We adjust the GDP forecasts to +1.6% in 2022 (from +2.4%) and -0.2% for 2023 (from +0.1%). The downward revision for 2022 largely reflects the weaker-than-expected growth during H1, but risks remain tilted to the downside for 2023.
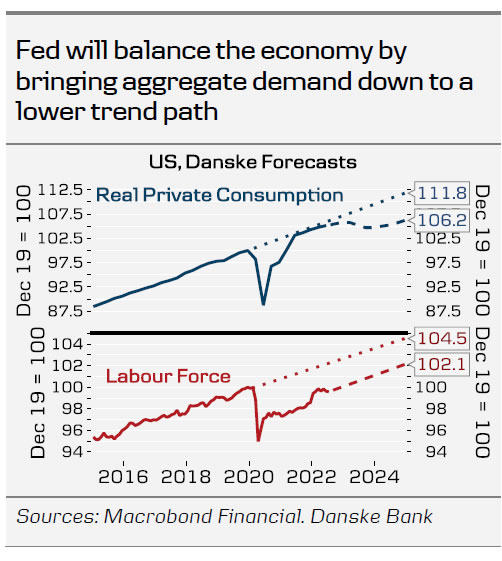
Despite the recession fears, US economy performed relatively well over the summer, as the GDP contraction in Q2 was driven by slower inventory growth. Aggregate demand, fuelled by the pandemic-era stimulus, recovered near its pre-covid trend already in late 2021, and despite the sharp decline in consumers' real incomes, the July retail sales continued to signal broad-based growth in nominal spending. As we highlighted in Research US - Higher for longer, 19 August, the persistent drop in the US labour force combined with demand near pre-pandemic trend signals, that output gap has turned positive.
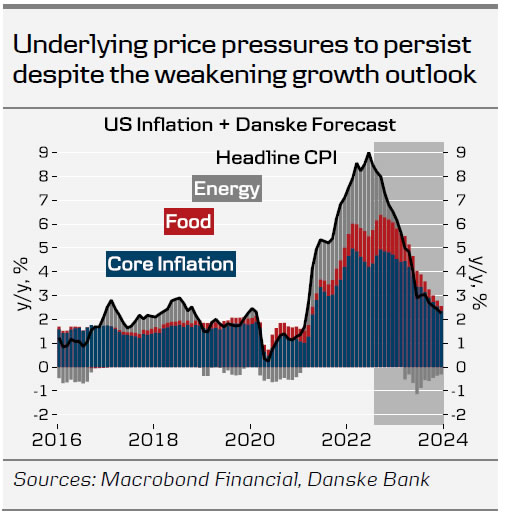
While we see European inflation accelerating further towards the fall, US headline inflation has likely already peaked in June. Gasoline prices are down 23% from the peak, and we now expect energy contribution to turn negative in 6 months' time, which implies further declines in headline inflation. In addition, food-related futures prices have fallen from the recent peaks and PMI indices point towards continuing easing in supply chain challenges. That said, the positive output gap combined with the tight labour markets will continue to fuel the underlying price pressures until Fed brings the aggregate demand back into equilibrium by tightening financial conditions further.
Labour market shows few signs of cooling
The economic imbalance challenging the Fed is the most evident in the labour markets, as even though labour demand appears to have peaked, the ratio of job openings to unemployed remains at historically high levels. Unit labour cost growth outpaced the high consumer price inflation during H1, suggesting that businesses are pressured to continue hiking prices also in the future. Given the 2% inflation target and productivity growth averaging just above 1% during 2010s, wage growth around 3% would be consistent with Fed's goals, while in July the realized pace was 5.8% m/m AR.
The combination of rapid wage growth and the recent fall in gasoline prices implies that real incomes recovered in July & August. This is in stark contrast to Europe, where the escalating energy crisis continues to erode consumers' purchasing power at a record pace. Despite the negative GDP prints in H1, private consumption continued to grow, albeit at a subdued pace. With the main headwind of negative real income growth now easing, we expect GDP to rebound moderately during the 2nd half of the year.
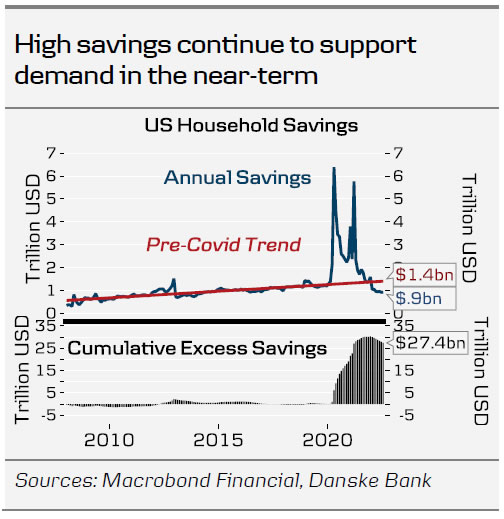
High demand for energy and especially LNG ensures that US exports outlook remains relatively positive, while imports are likely to decline on the back of gradually easing demand and still normalizing goods consumption. Net exports - which was the key negative contributor to the weak Q1 GDP print - will likely turn positive during H2.
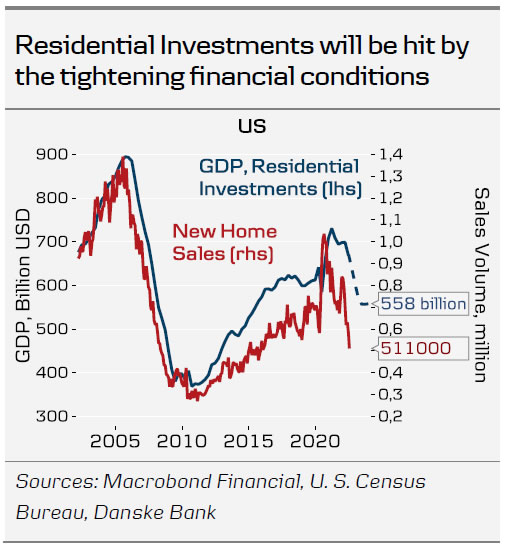
Investment outlook is less optimistic, with especially residential investments likely to decline as Fed continues hiking rates. Longer-term fixed mortgage rates are already between 5-6%, and consequently home sales volumes have plunged clearly below pre-covid trend, while inventories of finished homes have risen rapidly.
We still expect the US economy to fall into a moderate recession in Q2 2023. The exact timing and depth of the recession depends on the Fed's chosen path of policy tightening. The recent communication suggests, that Fed policymakers prefer an approach, where financial conditions are tightened to moderately restrictive levels (Fed Funds around 3.5- 4.0%) and held there well into the next year, instead of rapidly hiking rates closer to 5-6%.
This implies lower risk of a near-term recession, but also that growth will remain below potential for longer. It will take time, until the economic imbalance driving the inflationary pressures has been corrected, and this will likely also be reflected in the stickier components of inflation remaining above target at least for 1-2 years. We do expect core inflation to gradually ease towards 2023 driven especially by core goods prices, but see core CPI still around 3% y/y by the end of next year.
Growth risks remain tilted to the downside
The downside scenario for growth is related to faster slowdown in private consumption fuelled by weakening labour market sentiment. According to PMI/ISM sub-indices, companies' inventories have rebounded as real demand growth remains moderate and supply chain difficulties have eased. Weak growth outlook will weigh on companies' pricing power, revenues and put increasing focus on costs. Especially real goods consumption is bound to continue weakening, as it remains abnormally high due to the lingering pandemic effects. The possible consequences for labour demand could start to have a negative impact on real private consumption. From Fed's perspective, this is desirable to some point as labour market conditions remain too tight, but a combination of weakening employment and slowing real consumption could spiral into a deeper recession than what was originally anticipated. We continue to emphasize, that engineering 'soft landings' has historically been difficult, and we see growth risks tilted to the downside.
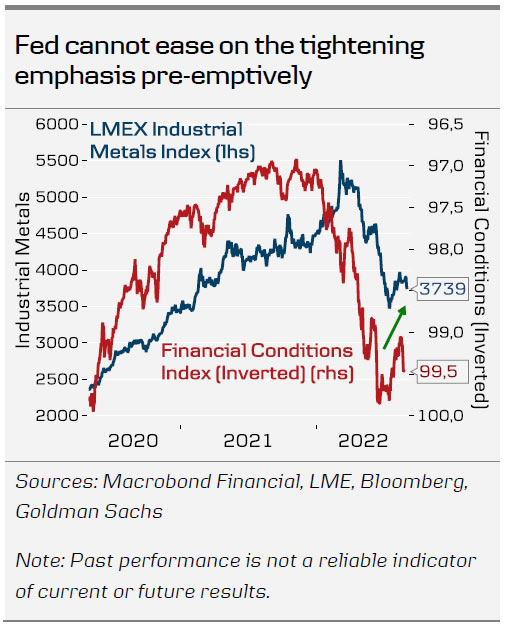
Another risk scenario relates to Fed giving up on the tightening emphasis too early, leading to repeating cycles of (commodity-driven) inflationary waves and weak growth due to persistently tight monetary policy. Fed got the first taste of this in July, as markets began pricing in rate cuts for 2023, which lead to easing in financial conditions and subsequently a modest rebound in certain commodity prices. In our view, Fed does not have the luxury of giving up on the restrictive policy narrative for now, as underlying inflation pressures remain high – even if recession risks become increasingly apparent. Fed might have to accept, that the economy will have to go through a deeper-than-anticipated recession in order to avoid years of stagflation down the line.
GBPUSD Wave Analysis
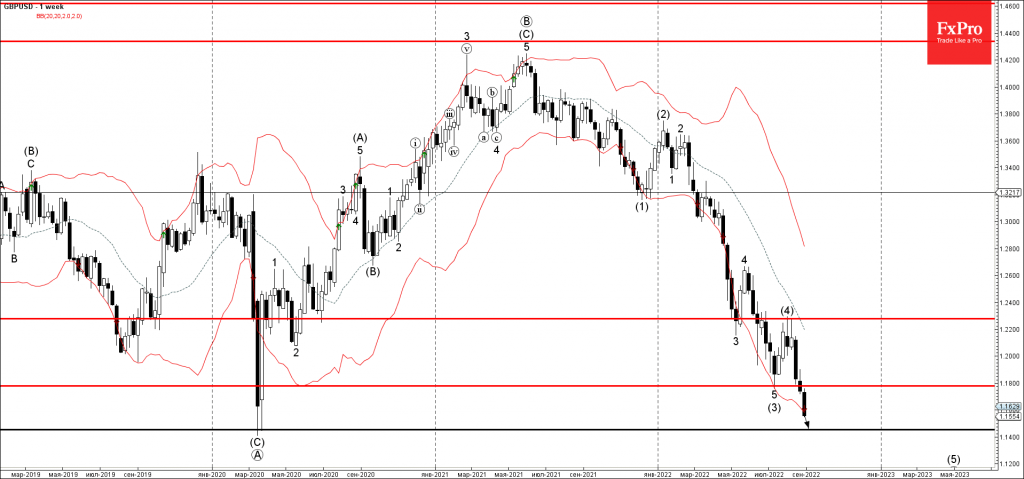
- GBPUSD broke key support level 1.1800
- Likely to test major support level 1.1455
GBPUSD currency pair under the bearish pressure after the earlier breakout of the key support level 1.1800 (low of the previous medium-term impulse wave (3)).
The downward reversal from the resistance level 1.3200 stopped the earlier short-term correction 2.
Given the powerful weekly downtrend – Sterling can be expected to fall further toward the next major support level 1.1455 (former multi-month low from the start of 2020).
EURCAD Wave Analysis
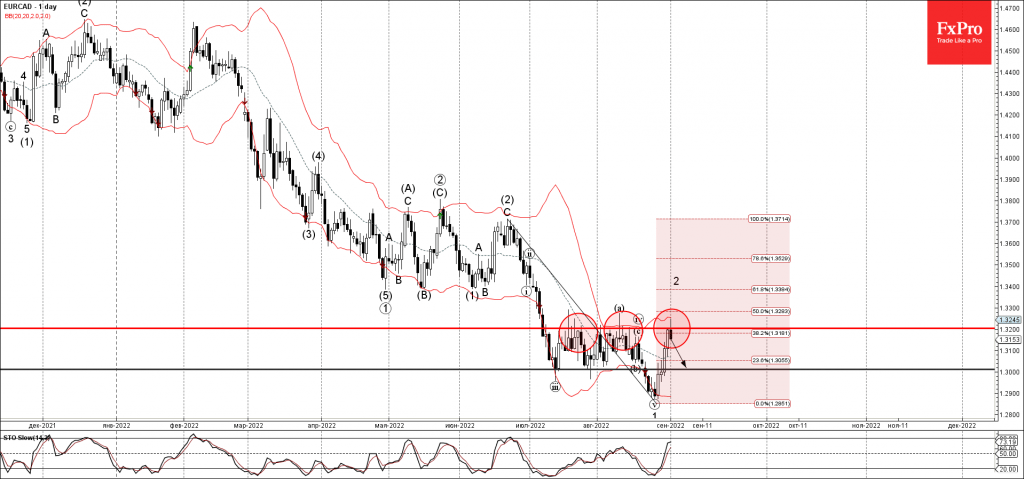
- EURCAD reversed from resistance level 1.3200
- Likely to fall to support level 1.3000
EURCAD currency pair recently reversed down from the resistance level 1.3200, intersecting with the upper Bollinger Bond and the 38.2% Fibonacci correction of the downward impulse from June.
The downward reversal from the resistance level 1.3200 stopped the earlier short-term correction 2.
Given the strong long-term downtrend and moderate euro bearishness – EURCAD can be expected to fall further toward the next round support level 1.3000.
Sunset Market Commentary
Markets
Over the previous days, Fed and ECB policy makers advocating a protracted hiking cycle with yields to stay higher triggered a congruent sell-off in bonds and equities. Even with few important eco data on the agenda (except for the US manufacturing ISM to be published after finishing this report), this pattern basically continued today. German and EMU 2-y swap yields are little changed. Yields at longer maturities still ad up 6/10 bps in the 10/30-y sector. The 10-y euro swap yield just didn’t touch the 2.50% barrier. With a 75 bps ECB rate hike fully discounted for next week’s meeting, maybe there is a good case for investors at the very short end to move to somewhat of a more neutral positioning going into next week’s ECB meeting. The uptrend in yields temporarily ran into resistance at the end of the European morning session/early in US dealings. However, a better than expected US jobless claims (232k vs 248k expected) was already enough to restore the reigning dynamics. The US yield curve also bear steepens with yields adding 1 bps (2-y) to 7.5 bps (30-y). German power prices and oil (brent $93.85) are easing further. The Dutch reference gas contract maintained recent decline. Some other cyclical commodities (copper) also corrected further south. However, as this correction is mainly the result of a deteriorating prospect for global growth, it didn’t help to ease the risk-off mood on equity markets. The EuroStoxx50 is losing another 1.5%. US indices open with losses of up to 1.0% (Nasdaq). China announcing a new lockdown in the city of Chengdu only lengthened the already impressively long list of economic uncertainties.
Yesterday, the dollar didn’t fully profit from its safe haven status, at least partially due to some (short term) euro resilience. However, today the US currency again takes the lead. DXY (109.30) is revisiting the cycle top. USD/JPY (139.55) surpassed the July peak, trading at the strongest level since 1998. After a few sessions of relative calm, EUR/USD again dropped below parity (0.9985 currently). Persistent uncertainty on the energy crisis with the risk of a longer period of stagflation for now caps any sustained rebound of the single currency. EUR/GBP also takes a pause as after recent sharp rally trading at 0.8630 compared to an intraday top near 0.8670. The move probably is mainly euro weakness rather than the precursor of a sustained sterling comeback.
News Headlines
Swiss inflation quickened from status quo in July to 0.3% m/m in August. On yearly basis, this means prices are now 3.5% higher, a little more than the 3.4% expected. The Swiss National Bank in June delivered a surprise 50 bps rate hike to -0,25%. Its president, Thomas Jordan, warned last week that strong price gains may be here to stay, citing structural factors that could lead to persistently higher inflationary pressures in the coming years. He also said that pressures are spreading to goods and services that are not directly affected by either the pandemic or the war. Combined with today’s data, another increase in rates on September 22 seems a done deal. Doing so would mark the end of a 7-year era of negative rates. The Swiss franc marginally strengthened vs the euro following the CPI release. EUR/CHF is trading at 0.979.
Going into next week’s policy meeting, several National Bank of Poland policymakers have expressed support for another rate hike. Litwiniuk this morning called for 25 bps or more while his colleague Kochalski still sees room for additional tightening, but with moves smaller than previously (25 bps instead of 50 bps). Kotecki said that recent CPI developments (accelerating more than expected from 15.6% to 16.1%) mean another hike in September or October. He also cited the deterioration of the zloty in recent weeks and the fact that other central banks continue policy tightening as well. The Polish currency strengthened for a fourth day straight today. EUR/PLN (4.718) remains north of 4.70 support though.
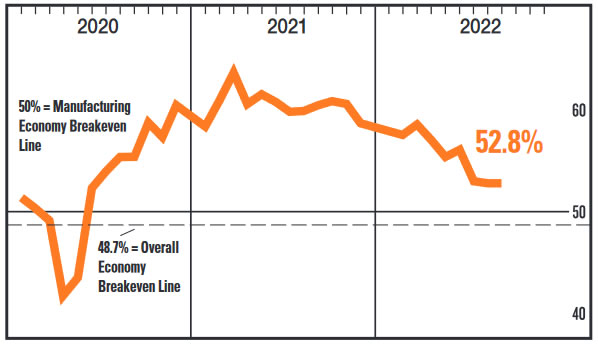
US ISM manufacturing unchanged at 52.8, prices dropped to 52.5, employment jumped to 54.2
US ISM Manufacturing PMI was unchanged at 52.8 in August, slightly above expectation of 52.6. Looking at some details, new orders rose from 48.0 to 51.3. Production dropped from 53.5 to 50.4. Employment jumped from 49.9 to 54.2. Prices dropped sharply from 60.0 to 52.5.
ISM said: "Manufacturing performed well for the 27th straight month. With (1) supplier delivery performance recording its fourth straight month of improvement, (2) price increase growth slowing significantly for the second consecutive month, (3) hiring and total employment both positive and expanding and (4) lead times easing across all three categories of purchasing activity, the sector is at or approaching supply/demand equilibrium."
Also, "the past relationship between the Manufacturing PMI and the overall economy indicates that the Manufacturing PMI for August (52.8 percent) corresponds to a 1.4-percent increase in real gross domestic product (GDP) on an annualized basis."
Euro Falls on Soft German Manufacturing Data
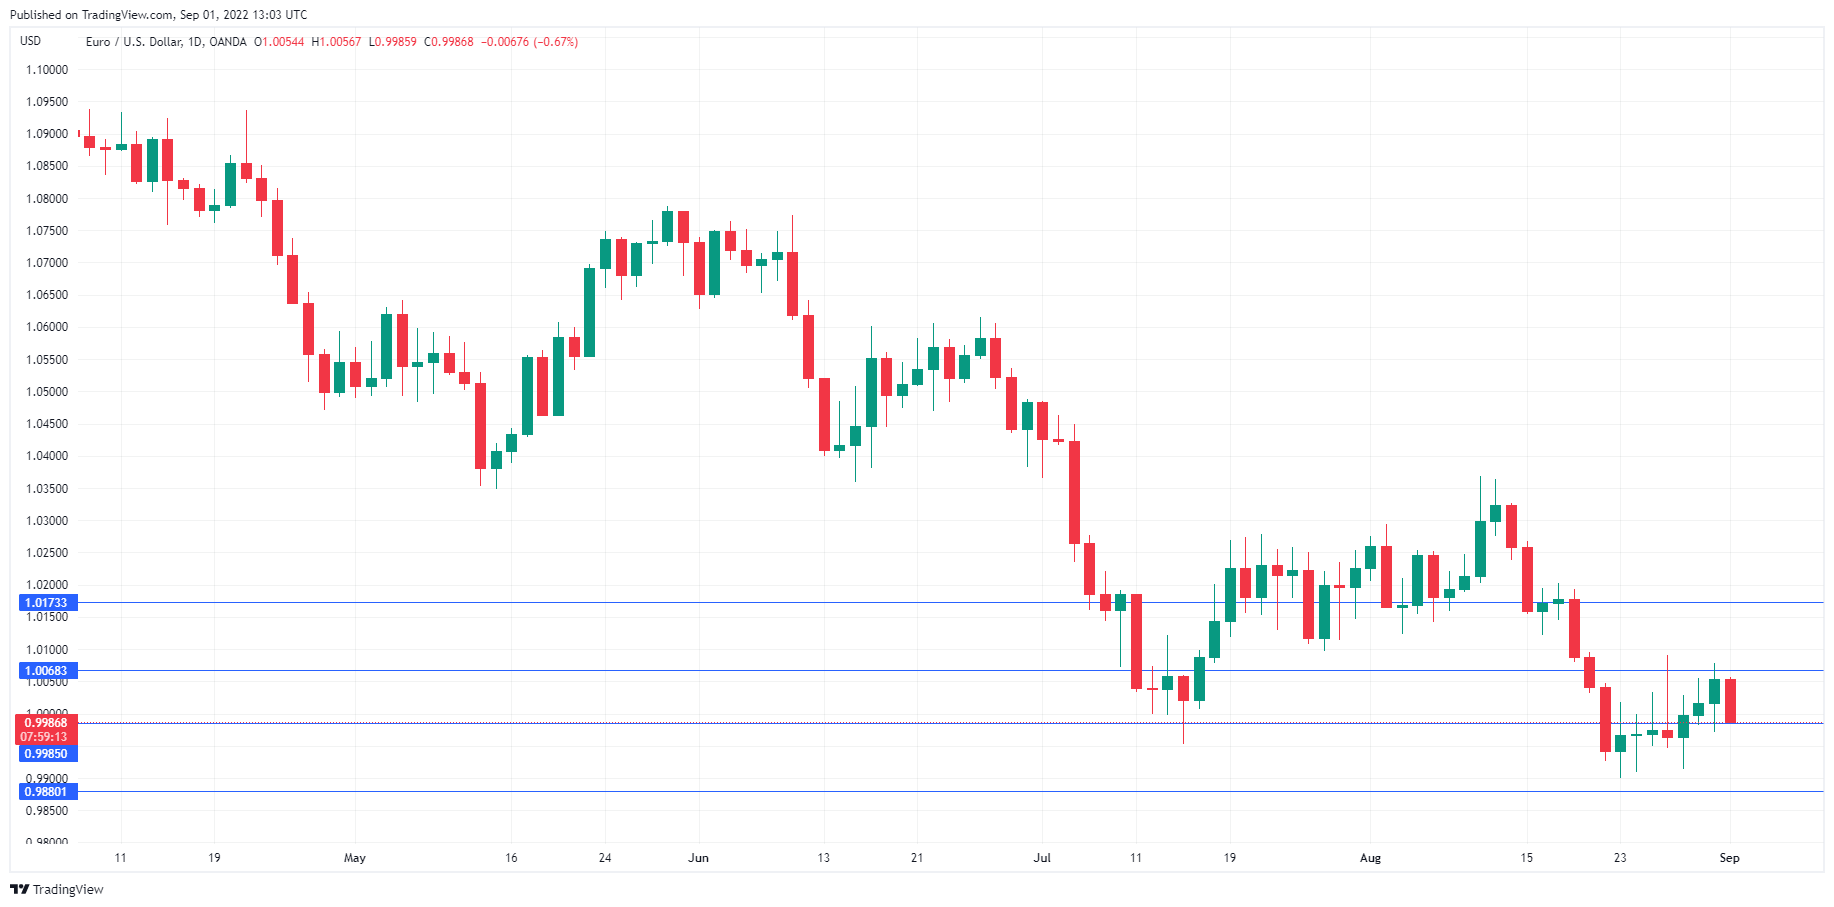
The euro has posted sharp losses today and has dropped below parity. In the North American session, EUR/USD is trading at 0.9989, down 0.65%.
German Manufacturing PMI remains in contraction
Germany’s manufacturing sector continues to struggle. The August Manufacturing PMI dipped to 49.1, down from 49.3 in July. The drop was not dramatic, but it marked a second straight reading of contraction, and was the lowest level since May 2o20, at the start of the Covid pandemic. Manufacturing, indeed the entire German economy, has been hurt by the uncertain outlook and rising inflation. With an energy crisis this winter a constant worry in Europe, cost pressures remain high and are showing an upside risk.
Inflation in the eurozone continues to move higher. This week, Germany and the eurozone reported that inflation accelerated in August. In Germany, inflation jumped to 7.9%, up from 7.5% in July. It was a similar trend in the eurozone, with inflation rising to 9.1%, up from July’s record high of 8.9%. Unlike the Fed or the BoE, which have dramatically raised interest rates, the ECB’s benchmark rate stands at just 0.50%, which will have little effect on inflation. The ECB has fallen behind and is paying the price after dismissing rising inflation as transitory and maintaining its ultra-loose policy. The ECB’s next meeting is on September 8th and the August inflation reports have boosted expectations for a super-size 75 basis point rate increase. Such a move would likely provide the euro with some badly-needed support.
On Friday, the US releases nonfarm payrolls, one of the most important events on the economic calendar. The August report is expected to show a strong gain of 300 thousand, after the unexpected massive gain of 528 thousand in July. We could see some significant movement from the US dollar on Friday – a strong reading would likely boost the US dollar, while a weak release would likely weigh on the greenback.
EUR/USD Technical
- EUR/USD is testing support at 0.9985. Below, there is support at 0.9880
- There is resistance at 1.0068 and 1.0173
August US NFP: A Return to Normal?
Last month, markets were caught by surprise when the BLS reported that NFP had grown by over half a million. But over 300,000 of those jobs came from the birth-death adjustment. It's unlikely the adjustment will be as large this time around, but that doesn't mean that markets won't be once again caught off guard.
The consensus is that 300K jobs were created last month, compared to 528K in July. That is about average for the year so far, and well above the level that is normal. Which isn't all that surprising considering that there are still almost two job openings for every jobseeker. On the other hand, the number of people working additional jobs (second and even third jobs) is the highest it's been in years.
How the market could react
Usually NFP has an impact on expectations for monetary policy, since it's the preferred employment measure for the Fed. However, several FOMC members have implied that an increase in unemployment would be acceptable to bring inflation down. In fact, in Powell's Jackson Hole speech, the "pain" comment included the expectation of higher unemployment.
So, a deteriorating employment situation is unlikely to dissuade the Fed from hiking. On the other hand, the markets are pretty much pricing in a 75bps hike at the next meeting. So another substantial beat will simply confirm what is already expected about further tightening.
So, good news is good news?
An improving jobs situation in the US could imply that the economy is still vibrant. Jobs numbers are seen as a lagging indicator of economic health. With the latest debate on whether the US is in a recession or not, that jobs numbers stay strong could leave investors with the sensation that the two quarters of negative GDP growth were more of an anomaly than the start of a trend. Better than expected numbers could finally provide a little optimism to the markets.
On the other hand, the range of expectations is pretty broad, from 75K to 452K. There isn't a clustering of expectations around a specific number, meaning that there could be increased market volatility in response.
The indicators matter
The unemployment rate is expected to remain steady at 3.5%, but the labor force participation rate is expected to increase just slightly to 62.2% from 62.1% prior. That so many jobs have been created over the last year, but the unemployment rate has remained steady, that could be an indicator of labor market tightness.
With inflation being such a large concern, there might be added focus on the average hourly earnings component. Average earnings are expected to accelerate modestly to 5.3% annual growth from 5.2% prior. With inflation at 8.5%, the average worker in the US is still seeing a drop in real earnings.
EUR/USD Mid-Day Outlook
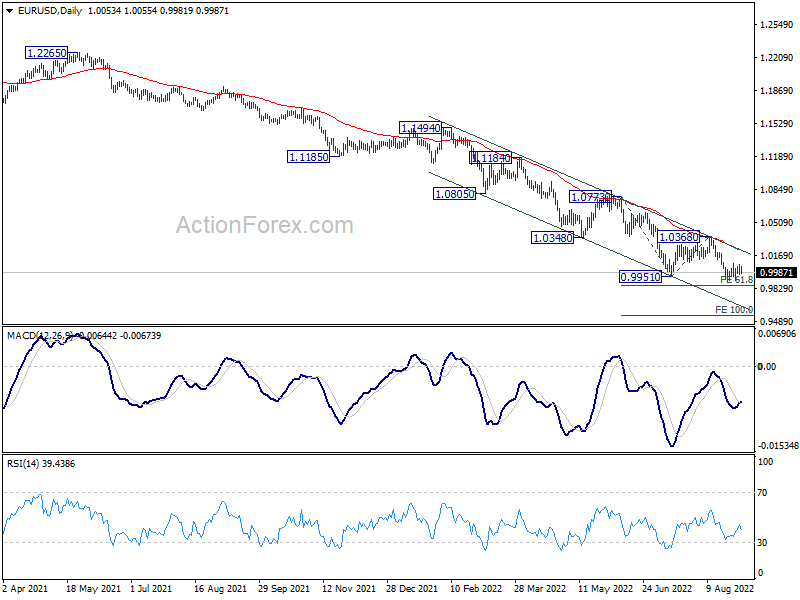
Daily Pivots: (S1) 0.9990; (P) 1.0035; (R1) 1.0097; More...
Intraday bias in EUR/USD remains neutral for the moment. Further decline is expected with 1.0094 resistance intact. On the downside, break of 0.9899 will resume larger down trend to 61.8% projection of 1.0773 to 0.9951 from 1.0368 at 0.9860. Firm break there should prompt downside acceleration to 100% projection at 0.9546. However, firm break of 1.0094 minor resistance will dampen this bearish view, and turn bias back to the upside for 1.0368 resistance instead.
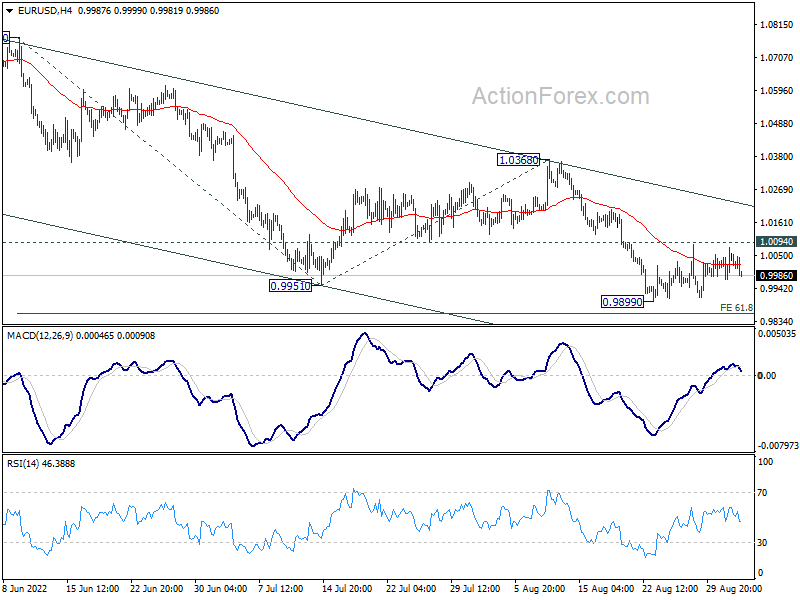
In the bigger picture, down trend from 1.6039 (2008 high) is still in progress. Next target is 100% projection of 1.3993 to 1.0339 from 1.2348 at 0.8694. In any case, outlook will stay bearish as long as 1.0368 resistance holds, in case of strong rebound.
USD/CHF Mid-Day Outlook
Daily Pivots: (S1) 0.9734; (P) 0.9771; (R1) 0.9814; More...
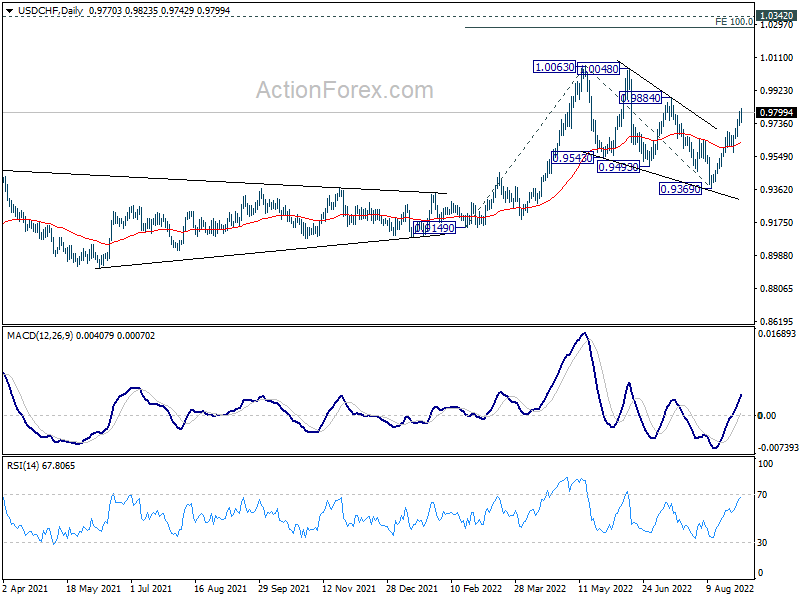
Intraday bias in USD/CHF stays on the upside at this point. Current rally should target 0.9884 resistance first. Break there will argue that larger up trend is ready for resumption through 1.0063. On the downside, break of 0.9658 minor support will mix up the outlook and turn intraday bias neutral first.
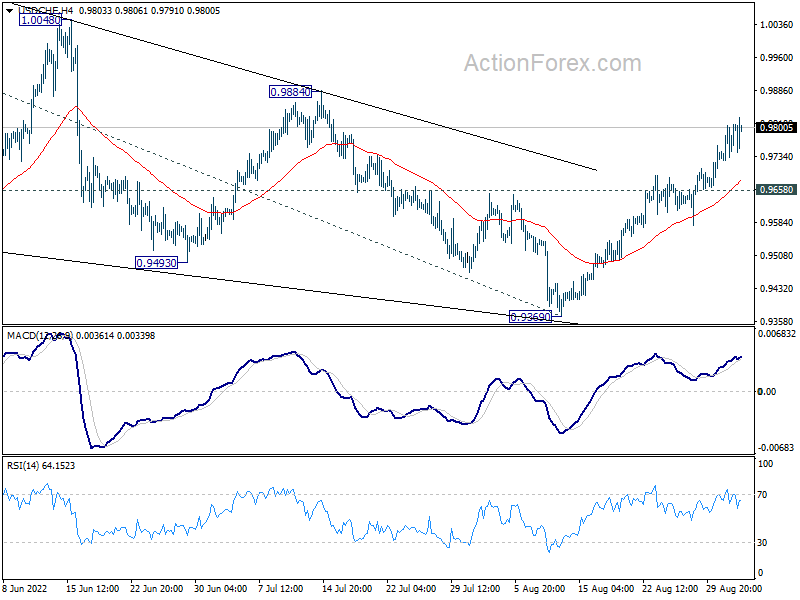
In the bigger picture, current development suggests that up trend from 0.8756 (2021 low) is still in progress. Sustained break of 1.0063 will target 100% projection of 0.9149 to 1.0063 from 0.9369 at 1.0283, and then 1.0342 (2016 high). For now, this will remain the favored case as long as 0.9369 support holds, even in case of deep pull back.