Sample Category Title
EUR/AUD Daily Outlook
Daily Pivots: (S1) 1.4862; (P) 1.4975; (R1) 1.5085; More...
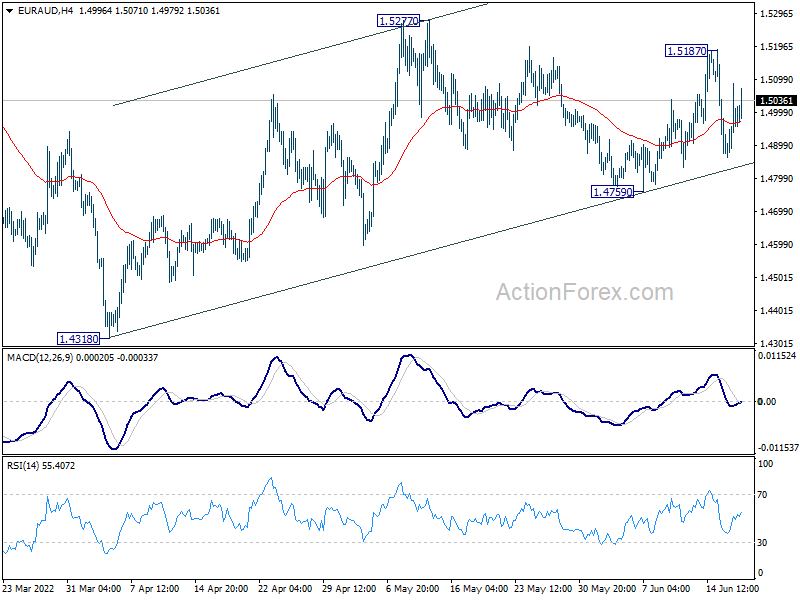
Intraday bias in EUR/AUD remains neutral at this point. On the downside, break of 1.4759 support will suggest that rebound from 1.4318 has completed. Intraday bias will be turn back to the downside for retesting 1.4318 low. On the upside, above 1.5187 will target 1.5277 resistance and than 1.5354 support turned resistance next.
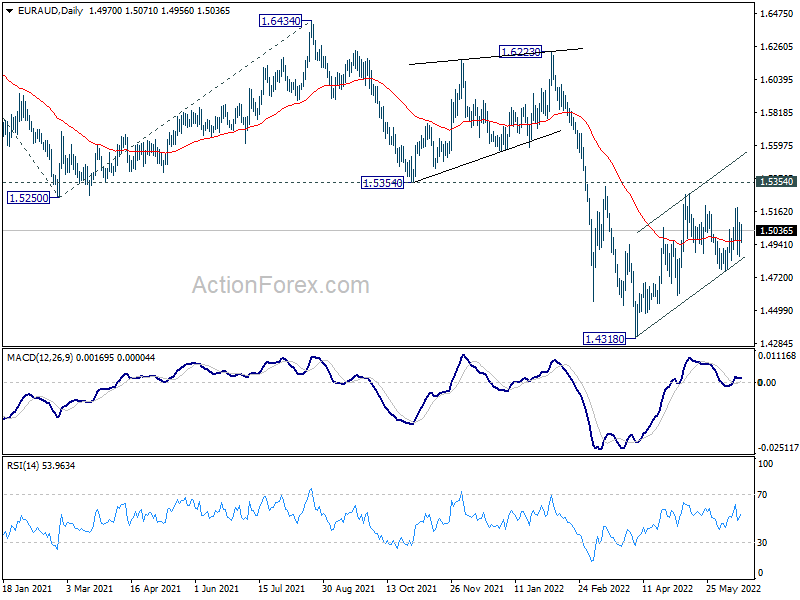
In the bigger picture, as long as 1.5354 support turned resistance holds, larger down trend from 1.9799 (2020 high) is still expected to continue. On resumption, next target is 61.8% projection of 1.9799 to 1.5250 from 1.6434 at 1.3623, which is close to 1.3624 long term support (2017 low). However, firm break of 1.5354 will indicate medium term bottoming and bring stronger rally back to 1.6434 key resistance.
EUR/GBP Daily Outlook
Daily Pivots: (S1) 0.8492; (P) 0.8563; (R1) 0.8614; More...
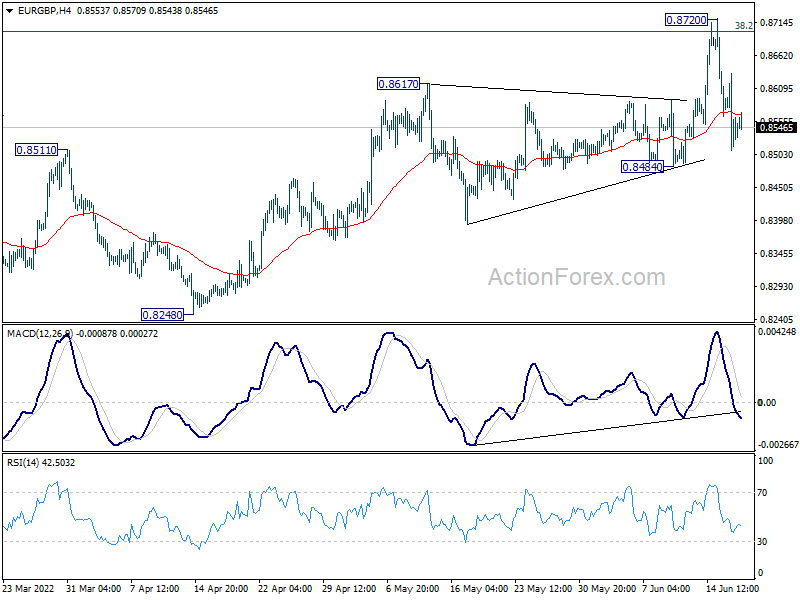
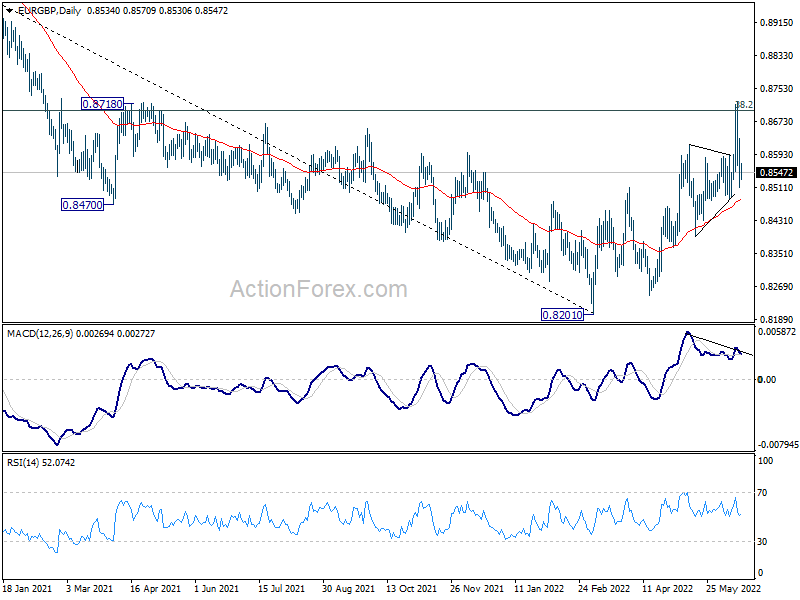
Intraday bias in EUR/GBP stays neutral at this point. Further rise is expected as long as 0.8484 support holds. Break of 0.8720 and sustained trading above 0.8697 medium term fibonacci level will carry larger bullish implication. Next target is 0.9003 fibonacci level. However, break of 0.8484 will indicate rejection by 0.8697 and turn near term outlook bearish.
In the bigger picture, rise from 0.8201 medium term bottom could could either be a correction to the down trend from 0.9499 (2020 high), or a medium term up trend itself. Sustained break of 38.2% retracement of 0.9499 to 0.8201 at 0.8697 will affirm the latter case, and pave the way to 61.8% retracement at 0.9003. However, rejection by 0.8697 will maintain medium term bearishness.
EUR/CHF Daily Outlook
Daily Pivots: (S1) 1.0081; (P) 1.0249; (R1) 1.0367; More....
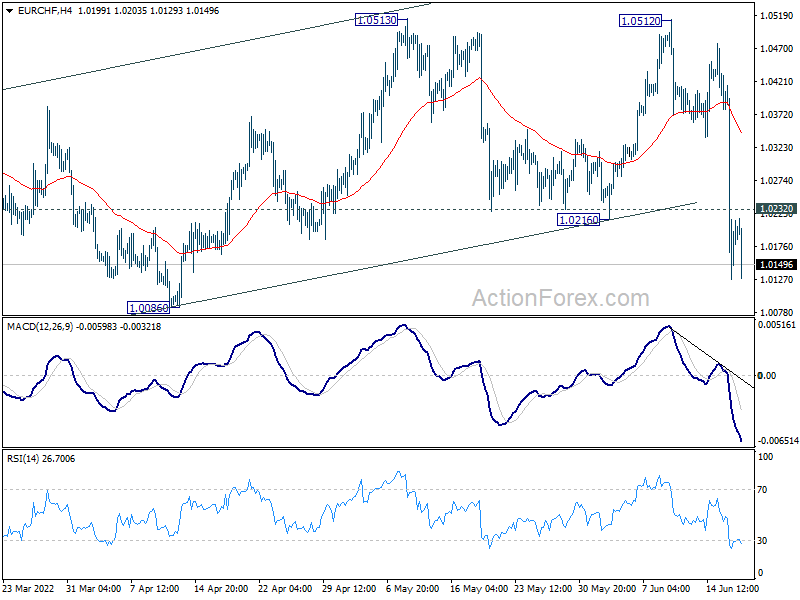
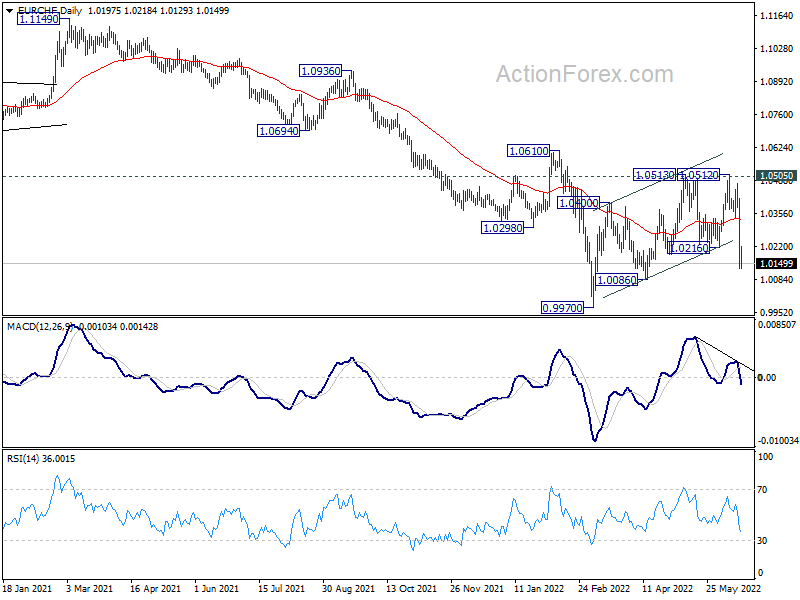
Intraday bias in EUR/CHF stays on the downside for 1.0086 support first. Corrective rebound from 0.9970 should have completed already, after second rejection by 1.0505 support turned resistance. Break of 1.0086 will bring retest of 0.9970 low. On the upside, above 1.0232 minor resistance will turn intraday bias neutral first. But risk will stay on the downside as long as 1.0512 resistance holds, in case of recovery.
In the bigger picture, as long as 1.0505 support turned resistance (2020 low) holds, long term down trend from 1.2004 (2018 high) is expected to continue. Next target is 100% projection of 1.2004 to 1.0505 to 1.1149 at 0.9650. However, firm break of 1.0505 will suggest medium term bottoming, and bring stronger rebound towards 1.1149 structural resistance.
USDCAD Looks for More Upside; 1.2875 in Focus
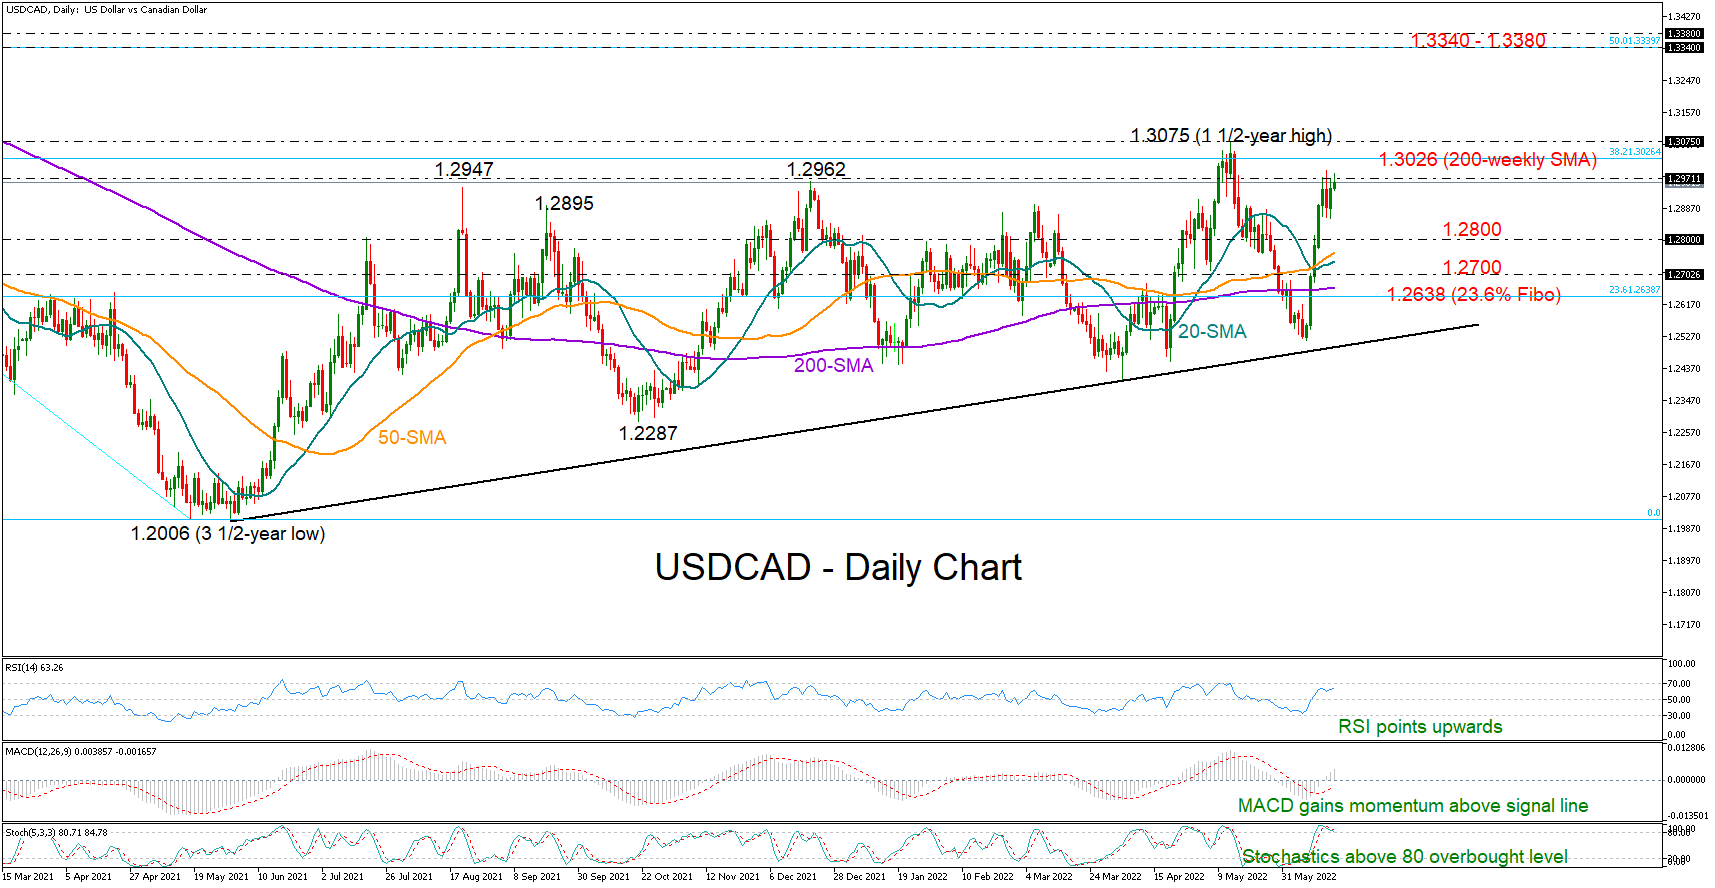
USDCAD has been confined within the 1.2859 – 1.2875 zone over the past three days, but its short-term outlook continues to look bright.
Particularly, the MACD remains positively charged above its signal and zero lines, while the rising RSI has yet to reach its 70 overbought mark, both suggesting that last week’s impressive rally off 1.2516 could gain more legs. On the other hand, the Stochastics have pivoted southwards, though the indicators remain above their 80 overbought level for now, keeping the bias on the bullish side for now.
If the 1.2875 nearby resistance gives way, the 1.3026 number, which overlaps the 200-weekly simple moving average (SMA) and the 38.2% Fibonacci retracement of the 2020 downtrend, may attract special attention before the spotlight turns to May’s peak of 1.3075. Should the bulls accelerate from here, the 50% Fibonacci of 1.3340 and the 1.3380 barricade from the second half of 2020, could be the next obstacle.
In case buying pressures fade immediately, the pair will again seek shelter around 1.2859. Slightly lower, the 1.2800 mark will be watched ahead of the 1.2700 psychological level, a break of which could bring the 200-day SMA and the 23.6% Fibonacci level of 1.2638 under examination.
Summarizing, USDCAD’s progress may further expand in the short term, likely bringing May’s ceiling into focus unless the bar at 1.2875 stands firm.
GBPJPY Advances Following Bounce Off 160.00
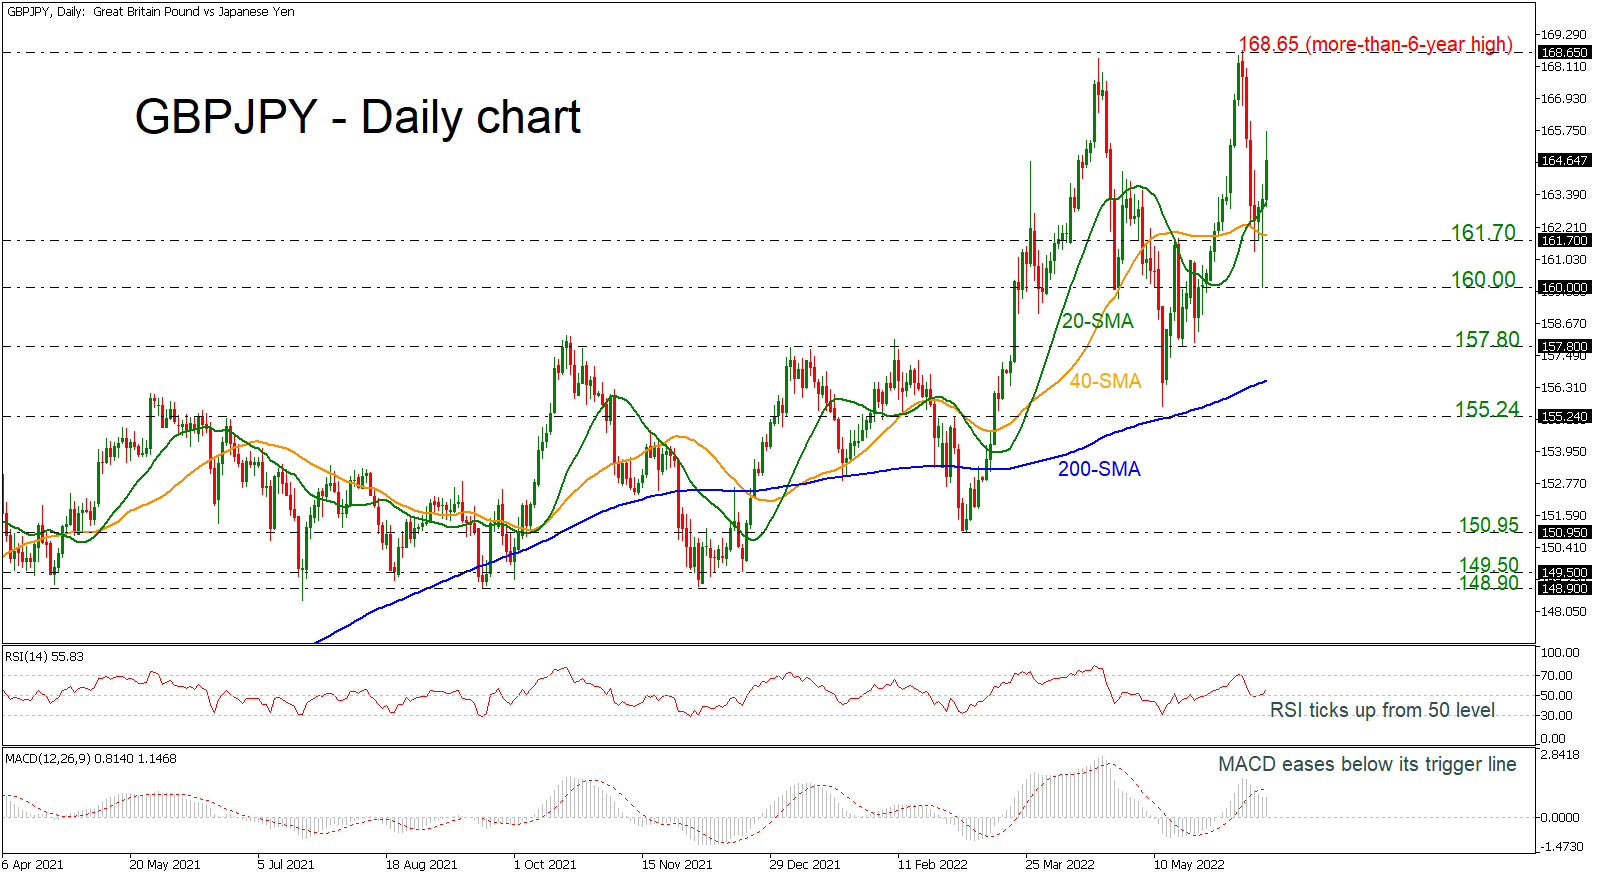
GBPJPY has been overperforming over the last few sessions after the rebound off the 160.00 psychological level. The RSI indicator is heading north above the neutral threshold of 50, while the MACD oscillator is falling below its trigger line in the positive region. In trend indicators, the 20- and 40-day simple moving averages (SMAs) posted a bullish crossover, confirming the recent bullish bias.
Should buyers drive towards the more-than-six-year high of 168.65 and jump above it, they could encounter initial strengthened resistance from the 175.00 round number, registered in April 2015.
Otherwise, if sellers take control, initial support could come from the 20-day SMA at 163.10 ahead of the 161.70 support and the 160.00 barrier underneath. Diving further, immediate limitations may arise from the 200-day SMA at 156.50.
All in all, the very short-term timeframe sustains the bullish mode for now. Also, a break above the more-than-six-year high could endorse the long-term positive outlook.
Elliott Wave Analysis: USD/JPY Back to the Highs
US stocks came down, this time with the USD as US yields found some resistance. But the main theme at the moment is JPY, which some sharp sell-off across the board following the latest BoJ policy remarks. »The bank will support financing, mainly of firms, and maintain stability in financial markets, and will not hesitate to take additional easing measures if necessary; it also expects short- and long-term policy interest rates to remain at their present or lower levels«. That sounds very dovish, so CB policy divergence between US and Japan is causing another bounce on USDJPY. We see nice intraday bounce that can take pair back to the highs, into wave five towards 136.50/137.00. Keep in mind that after every five waves market can slow down again, for another correction.

S&P 500 Falls into Bearish Trend
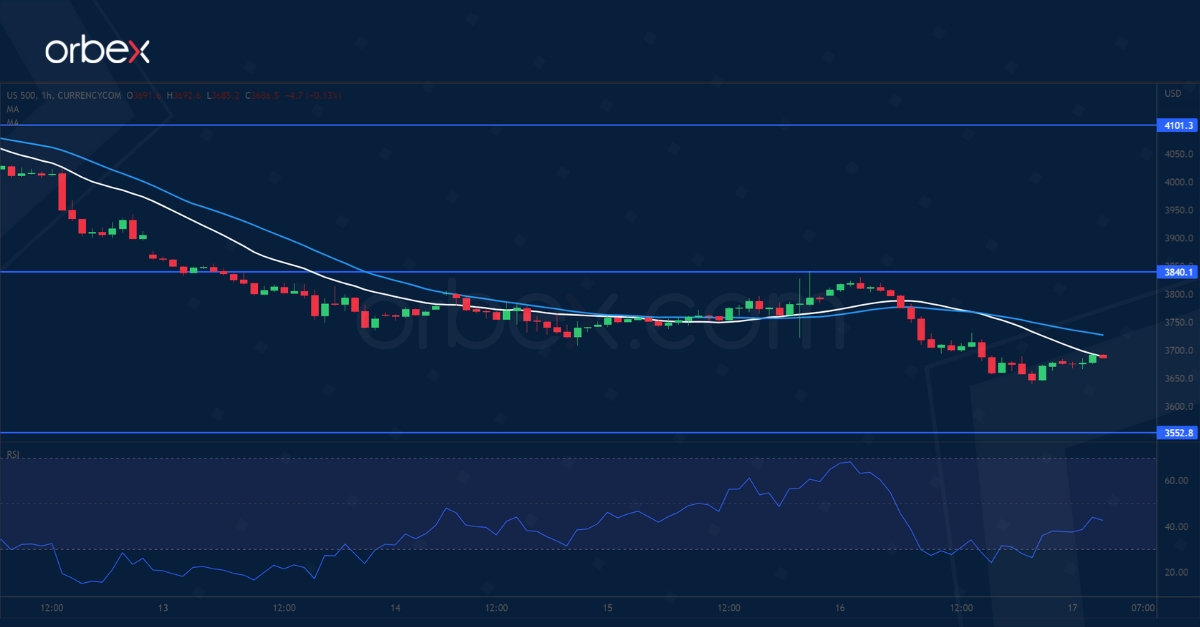
The S&P 500 struggles as the FOMC anticipates an economic downturn. A fall below the daily support at 3840 which has turned into a resistance might confirm the bear market. Sellers would continue to fade rebounds as sentiment deteriorates. The RSI’s dip into the oversold area may prompt some short-term sellers to cover. But unless the buy side manages to lift offers around 3840, the index could be vulnerable to a new round of sell-off. 3550 from November 2020 would be the next target.
GBP/USD Attempts to Rebound
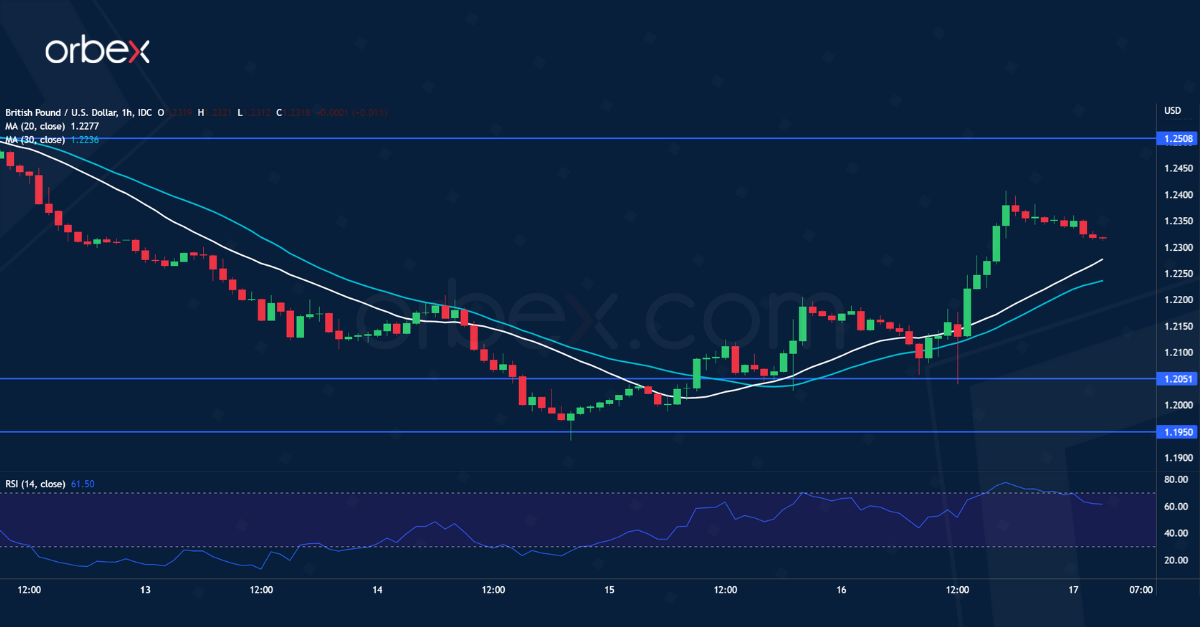
The pound rallied after the BoE raised its interest rates to 1.25%. A surge above 1.2200 has forced sellers to cover their positions, paving the way for a sharp rebound. A combination of profit-taking and momentum buying is propelling Sterling to the supply zone around 1.2500. Strong selling pressure could be expected though as the medium-term trend remains bearish. An overbought RSI may trigger a limited pullback as intraday traders take profit. 1.2050 at the origin of the rally is major support should this happen.
USD/CHF Breaks Support
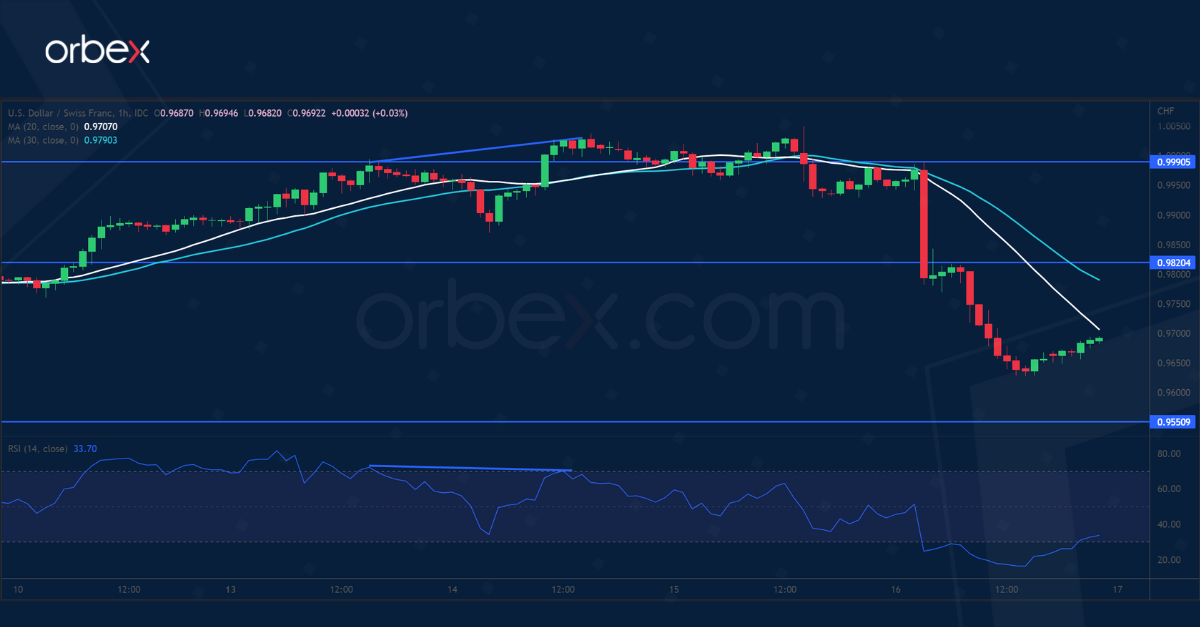
The Swiss franc soared after the SNB delivered a surprise 50-basis-point rate hike. The dollar came to a halt at May’s peak at 1.0050. A bearish divergence indicated a slowdown in the upward momentum. Then a fall below the base of the latest rebound at 0.9880 acted as a confirmation of a correction. Heightened volatility suggests that short-term buyers have bailed out and a break below 0.9780 further weighs on sentiment. 0.9550 is a critical floor to keep June’s rally intact. The bulls need to clear 0.9820 first to ease the pressure.
Dow Jones and Nasdaq 100 Slip as Fear of Recession Jumps
The US dollar index rose as volatility jumped sharply following the interest rate decision by the Federal Reserve. The Fed delivered its biggest rate hike since 1994 and hinted that it will continue hiking interest rates in a bid to deal with inflation. Still, there are signs that the hawkish Fed could backfire. For example, data published on Thursday showed that the country’s initial jobless claims rose by 229k in the previous week. At the same time, building permits declined by 7% in May after falling by 3% in April. Housing starts declined by a whopping 14.4% in May after rising by 5% in the previous month.
American equities dropped sharply as investors reacted to the interest rate decision by the Fed and the rising cost of doing business. The Dow Jones dropped by 800 points while the tech-heavy Nasdaq 100 index declined by over 500 points. They declined sharply after mortgage rates rose to the highest levels in over 13 years. At the same time, Tesla announced that it was hiking prices because of surging costs. Prices of some car models will rise by as much as $6000. Other companies are expected to see smaller margins because of the rising cost of doing business.
The economic calendar will be muted on Friday. The most important data to watch will be the headline consumer price index (CPI) data. Based on the recent estimate, analysts expect the data to show that the bloc’s headline CPI rose to 8.1% in May while the core CPI rose to 3.8%. This inflation is expected to keep rising in the coming months because of the soaring cost of oil and gas. Other important data will be the latest industrial inflation numbers from Canada. Jerome Powell will deliver his first statement after the rate hike while the US will publish the latest industrial and manufacturing production data.
EURUSD
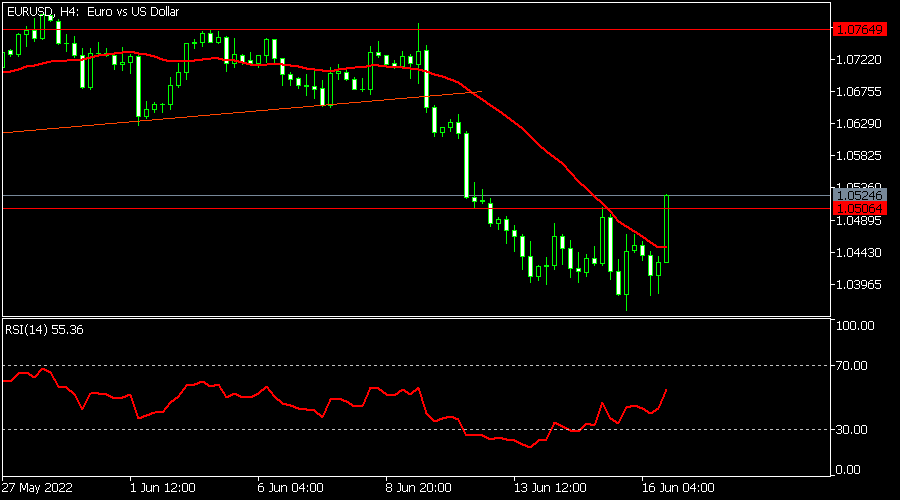
The EURUSD pair rose sharply ahead of the upcoming EU inflation data. It rose to a high of 1.0522, which was the highest level since June 13. The pair managed to move above the important resistance level at 1.0500. It has moved above the 25-day and 50-day moving averages while the RSI moved above the oversold level. In the long-term, the pair has formed an inverted cup and handle pattern, signaling that it will resume the downward trend.
USDCHF
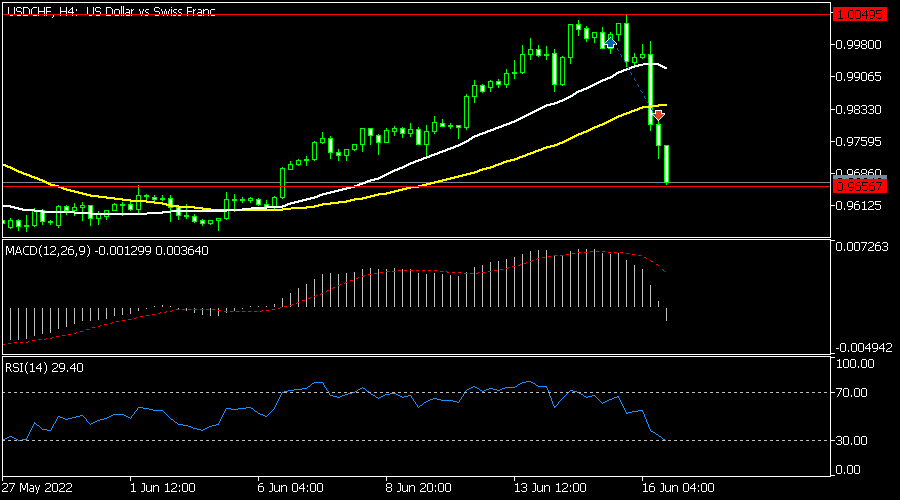
The USDCHF pair crashed hard after the surprise rate hike by the Swiss National Bank (SNB). The pair dropped to the important support level at 0.9645, which was the highest point on June 2. As it dropped, the pair invalidated the cup and handle pattern. The MACD and the Relative Strength Index (RSI) have been falling. The pair will likely have a relief rally on Friday.
USDCAD
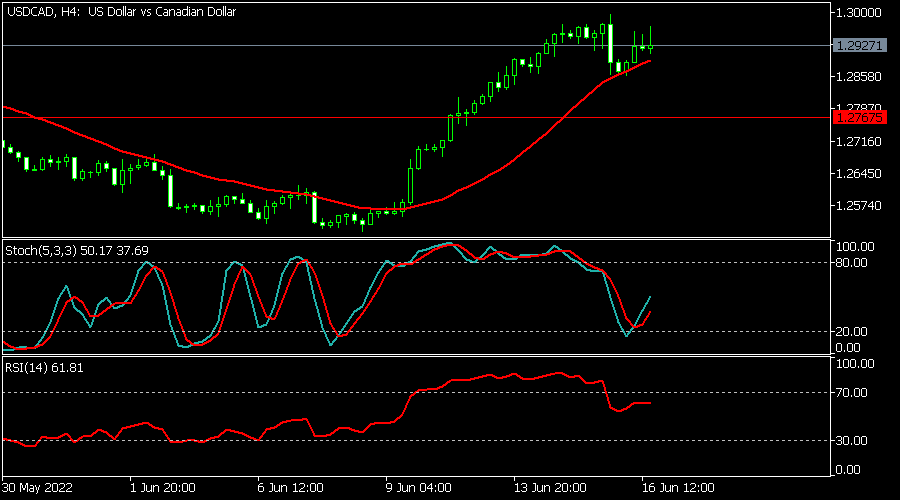
The USDCAD pair rose slightly as the US dollar strengthened. The pair is trading at 1.2927, which is slightly below this week’s high. The pair remains above the 25-day moving average while the Relative Strength Index (RSI) moved slightly below the overbought level. The Stochastic Oscillator moved slightly upwards. Therefore, the pair will likely keep rising as bulls target the key resistance at 1.300.