Sample Category Title
USD/JPY Daily Outlook
Daily Pivots: (S1) 115.50; (P) 115.93; (R1) 116.56; More...
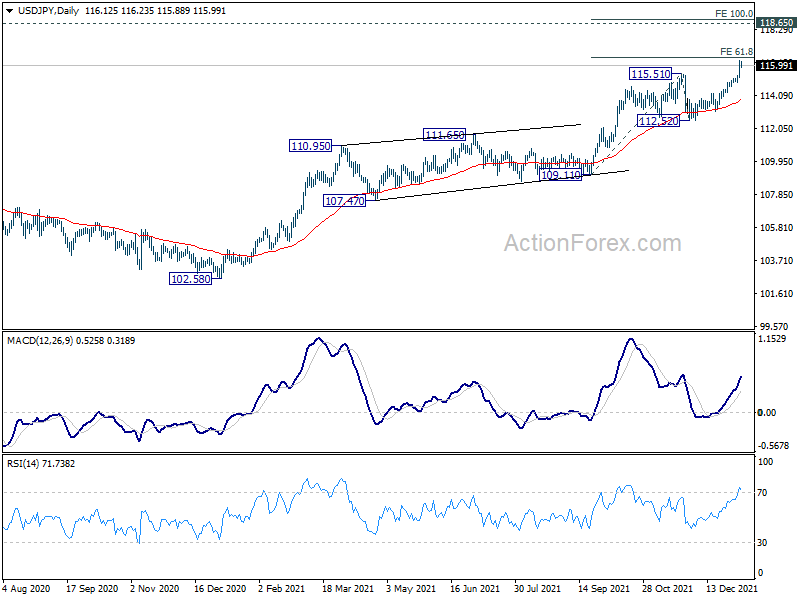
Intraday bias in USD/JPY remains on the upside for 61.8% projection of 109.11 to 115.51 from 112.52 at 116.47. Firm break there will extend the up trend from 102.58 to 100% projection at 118.90, which is close to 118.65 long term resistance. On the downside, below 115.64 minor support will turn intraday bias neutral and bring some consolidations, before staging another rally.
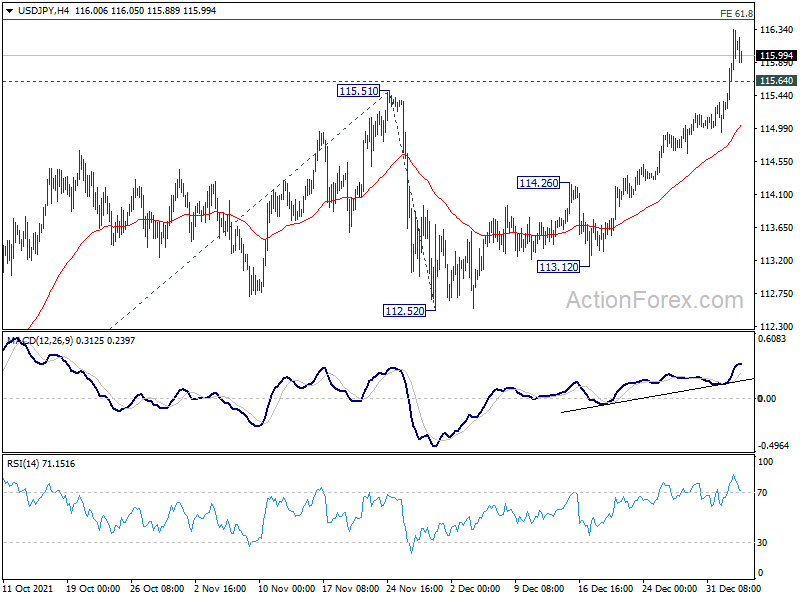
In the bigger picture, no change in the view that rise from 102.58 is the third leg of the up trend from 101.18 (2020 low). Such rally should target a test on 118.65 (2016 high). Sustained break there will pave the way to 120.85 (2015 high) and raise the chance of long term up trend resumption. For now, this will remain the favored case as long as 112.52 support holds, in case of deep pull back.
Markets Take a Breather ahead of FOMC Minutes, Sterling Strong, Yen Weak
The forex markets turn quiet in Asian session today. While DOW surged to new record high overnight, S&P 500 and NASDAQ closed slower. Asian markets are also mixed. Investors are holding their bets for now, awaiting FOMC minutes and, more importantly, US non-farm payrolls later in the week. For now, Yen remains overwhelmingly the worst performer following strong rally in treasury yields. Sterling is the strongest one with help from buying against Euro. Dollar is the second strongest it's still stuck in range except versus Yen.
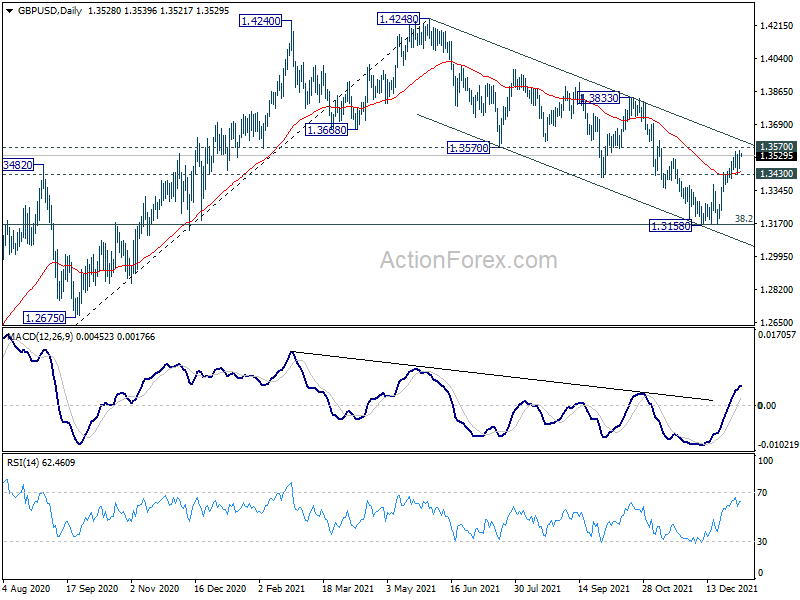
Technically, we'll keep an eye on GBP/USD for the next few days. It's now closely a key resistance zone between 1.3570 and channel resistance at 1.3606. We're seeing corrective fall from 1.4248 as complete with three waves down to 1.3158, after hitting 1.3164 medium term fibonacci level. Sustained break of the mentioned resistance zone will solidify this bullish case. However, rejection by the resistance zone will revive near term bearishness for another test on 1.3164. Sterling trade could make up their minds soon.
In Asia, at the time of writing, Nikkei is flat. Hong Kong HSI is down -0.78%. China Shanghai SSE is down -0.78%. Singapore Strait Times is down -0.29%. Japan 10-year JGB yield is down -0.001 at -0.088. Overnight, DOW rose 0.59% to new record high at 36799.65. S&P 500 dropped -0.06%. NASDAQ dropped -1.33%. 10-year yield rose 0.040 to 1.668.
Fed Kashkari: Threshold for rate hike could be met with Apr 2022 inflation data
Minneapolis Fed President Neel Kashkari said in an essay that he supported Fed's decision to increase the speed of tapering back in December FOMC meeting. Also, it brought forward two rate hikes into 2022 because "inflation has been higher and more persistent than I had expected."
Kashkari added, he'd prefer the forward guidance to commit to keeping federal funds rate at effective lower bound "until 12-month core PCE had exceeded 2 percent for 12 months." Based on this criteria, "the test that I preferred will likely be met when the April 2022 data are released the following month". The "threshold" (not trigger) for lift off would then be met.
Dollar index range bound with bullish bias ahead of FOMC minutes
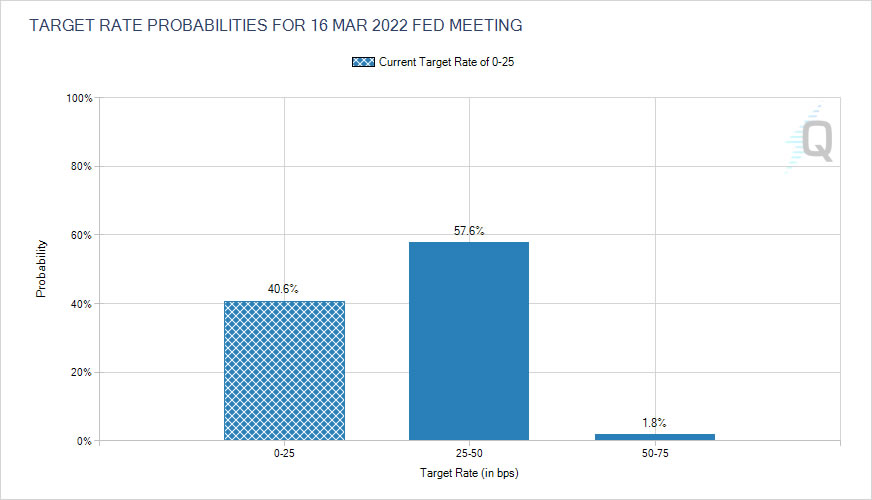
Minutes of the December FOMC meeting will be a major focus today. Back then, Fed decided to speed up tapering and end it in March instead of June. Also, the new projections saw three rate hikes this year. The markets would like to see more in-depth information an related discussion, and hints on the timing of the first hike. Currently, Fed fund futures are already pricing in nearly 60% chance that federal funds rate will be raised to 0.25-0.50% and above in March.
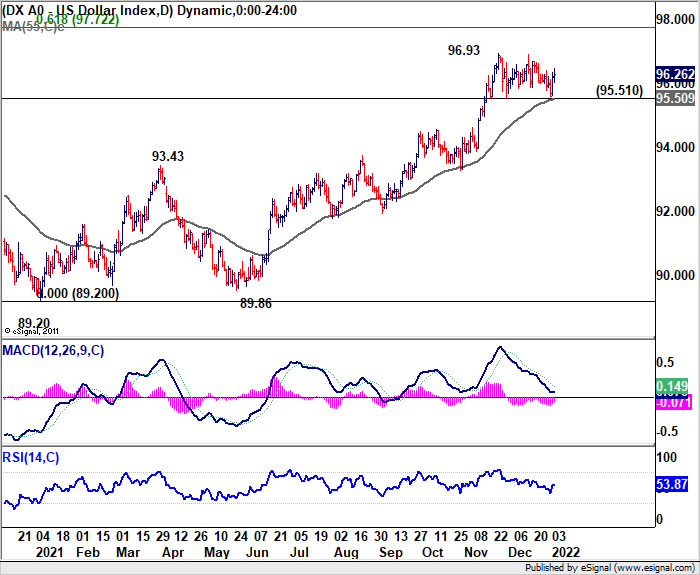
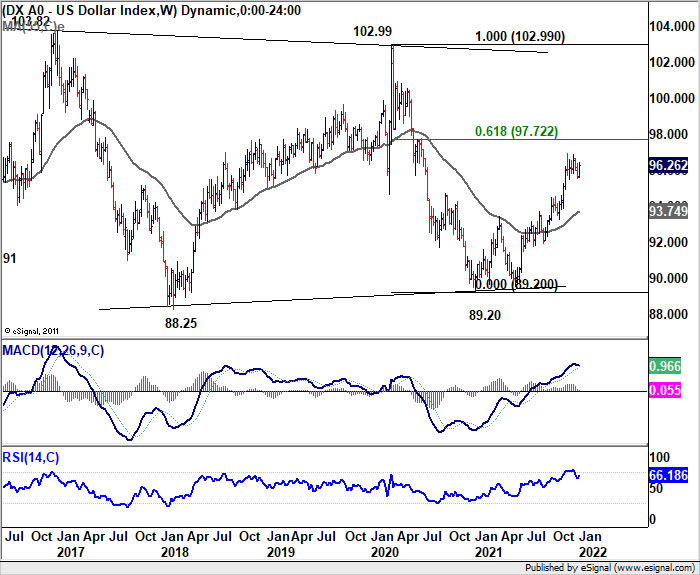
Dollar index is staying well in range of 95.51/96.93, much reflecting the movements in EUR/USD. With 95.51 support intact, further rally is expected in DXY, and an upside breakout could come as soon as a reaction to non-farm payroll report this week. A set of strong job numbers could easily push DXY through 61.8% retracement of 102.99 to 82.0 at 97.72. In the case, 100 handle would be within reach very soon.
Gold resilient, back above 1800 after brief dip
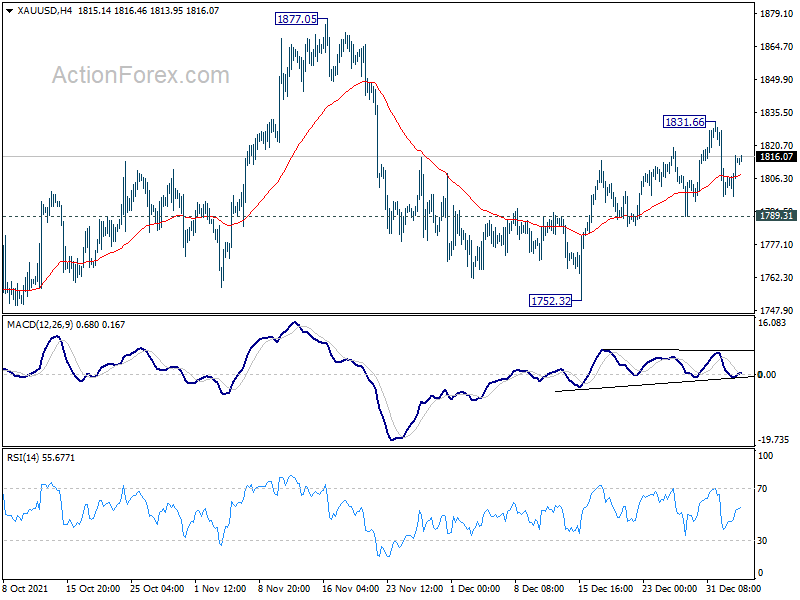
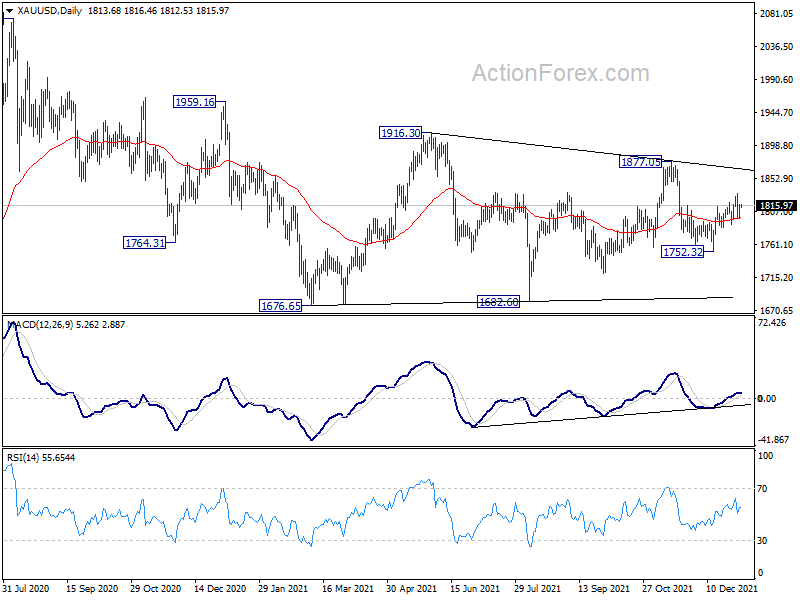
Gold dipped notably after hitting 1831.66, following Dollar's rally. But Gold remains resilient so far, holding above 1789.31 support, and it's back above 1800 handle. Further rally is still in favor and break of 1831.66 will resume the rally from 1752.32 towards 1877.05 resistance next.
Nevertheless, we're still seeing Gold as being a leg inside the range pattern from 1676.65. While a break of 1877.05 cannot be ruled out, we're not seeing much chance of breaking through 1916.30 medium term resistance. Meanwhile, break of 1789.31 support will argue that fall from 1877.05 is probably ready to resume through 1752.32.
On the data front
Japan monetary base rose 8.3% yoy in December. Eurozone PMI services final are the main feature in European session. Later in the day, US will release ADP employment. Canada will release building permits and new housing price index.
USD/JPY Daily Outlook
Daily Pivots: (S1) 115.50; (P) 115.93; (R1) 116.56; More...
Intraday bias in USD/JPY remains on the upside for 61.8% projection of 109.11 to 115.51 from 112.52 at 116.47. Firm break there will extend the up trend from 102.58 to 100% projection at 118.90, which is close to 118.65 long term resistance. On the downside, below 115.64 minor support will turn intraday bias neutral and bring some consolidations, before staging another rally.
In the bigger picture, no change in the view that rise from 102.58 is the third leg of the up trend from 101.18 (2020 low). Such rally should target a test on 118.65 (2016 high). Sustained break there will pave the way to 120.85 (2015 high) and raise the chance of long term up trend resumption. For now, this will remain the favored case as long as 112.52 support holds, in case of deep pull back.
Economic Indicators Update
| GMT | Ccy | Events | Actual | Forecast | Previous | Revised |
|---|---|---|---|---|---|---|
| 23:50 | JPY | Monetary Base Y/Y Dec | 8.30% | 9.30% | ||
| 05:00 | JPY | Consumer Confidence Dec | 40.9 | 39.2 | ||
| 08:45 | EUR | Italy Services PMI Dec | 53.7 | 55.9 | ||
| 08:50 | EUR | France Services PMI Dec F | 57.1 | 57.1 | ||
| 08:55 | EUR | Germany Services PMI Dec F | 48.4 | 48.4 | ||
| 09:00 | EUR | Eurozone Services PMI Dec F | 53.3 | 53.3 | ||
| 13:15 | USD | ADP Employment Change Dec | 358K | 534K | ||
| 13:30 | CAD | Building Permits M/M Nov | 1.50% | 1.30% | ||
| 13:30 | CAD | New Housing Price Index M/M Nov | 0.70% | 0.90% | ||
| 14:45 | USD | Services PMI Dec F | 57.5 | 57.5 | ||
| 15:30 | USD | Crude Oil Inventories | -2.7M | -3.6M | ||
| 19:00 | USD | FOMC Minutes |
Market Morning Briefing
STOCKS
Dow Jones and Dax have room to rise towards 37000 and 16300/400 respectively before we see a fall back. Nikkei has risen today, a strong break above 29500 can take the index up towards 30000, else a fall back to 28000 looks possible. Shanghai is consolidating between 3600-3650. Nifty needs to sustain above 17800 to be bullish towards 18200, else a fall back towards 17400 8s possible . Sensex looks bullish towards 60000.
Dow (36,799.65 +214.59 , 0.59%) has risen again and is heading towards 37000. The 37000 is a strong resistance which if holds can send the index down towards 34000. A strong break above 37000 is needed to test 38000 and negate the view of a dip towards 34000.
DAX (16,152.61, +131.88 , 0.82%) has risen sharply today. The view is bullish to see a rise towards 16300/400 before we see a dip back.
Nikkei (29,313.22 +11.43 , 0.039%) is heading towards 29500 as mentioned yesterday. A strong break above 29500 can take the index up towards 30000/31000.
Shanghai (3,620.54, −11.78, 0.32%) is consolidating between the range of 3600 and 3650. A strong break above 3650 can take the index up towards 3700, on the other hand a break on the downside can take the index down towards 3550.
Nifty (17805.25, +179.55 , 1.02%) has managed to close above the crucial level at 17800. The index needs to sustain above 17800 to test 18200, else a fall back towards 17400 can be seen.
Sensex (59,855.93, +672.71 , 1.14%) has also risen sharply yesterday. The view is bullish to see a rise towards 60000 and 61000 eventually.
COMMODITIES
The OPEC+ in its meeting yesterday decided to go by the scheduled increase in output by 400,000bpd from February 2022. Gold is trading within 1790-1820/30 for now and needs to break in order to test higher resistance at 1850. Silver can trade within 22.50-23.50 while Copper can slowly rise to 4.60/65 on a break above 4.50.
Brent (79.79) and WTI (76.79) have both dipped from 80.26 and 77.27 respectively but overall trades at higher levels than seen over the last few sessions. The OPEC+ in its meeting yesterday decided to continue with its scheduled 400,000 bpd increase in output from February 2022. We continue to look at immediate resistances of 81 and 78 to hold and produce a fall in the near term.
Gold (1815.40) has risen back instaed of falling below 1800. It has to sustain above 1790-1800 in order to initially consolidate between 1800 and 1820/30 before rising towards 1850 on the upside.
Silver (23.03) needs to initially rise to break above 23.50 to move up. Till then 22.50-23.50 can be a possible range.
Copper (4.4455) has risen well and can re-test 4.50 initially before rising higher towards 4.60/65 eventually.
FOREX
Dollar Index has risen well and can trade within the narrow 95.50-96.50 and broad 95-97 region. Euro has fallen below 1.13 but can rise back from 1.1250. Aussie and Pound look ranged for now. USDJPY has risen well above 115.50 and could be headed to 116.35/40 which needs to break to head further up. USDINR can face rejection at 74.60/80 else can rise to 75.00/20. USDCNY looks ranged while below 6.3850.
Dollar Index (96.232) has dipped from 96.50. The index is holding within 95.50-96.50 as mentioned yesterday and any break on either side would bring in the broader range of 95-97.
Euro (1.1291) has fallen below 1.13 contrary to our expectation of a rise towards 1.1400/50. Immediate support is seen near 1.1250 which if holds can produce a bounce.
EURJPY (130.93) fell sharply from 131.50 and while that holds, we may expect trade within 130-131.50 for now.
Aussie (0.7231) has scope to rise towards 0.73-0.7325 on the upside while immediate support is seen at 0.72.
Pound (1.3532) has scope to test 1.36 before falling from there to lower levels of 1.3450.
Dollar-Yen (115.98) has risen sharply breaking above 115.50 as expected. Now a rise to 116-118 is open for the medium term. Interim resistance at 116.35/40 can hold to produce a short corrective dip before the pair continues to move up. Overall trend remains up.
USDCNY (6.3718) has fallen back. While below 6.3850, view is bearish for a fall towards 6.36/34 eventually. Broad range of 6.3850-6.34 may hold for a couple of weeks.
{USDINR (74.5550) held below 74.60 yesterday. We need to see if 74.60/80 region holds to produce a corrective fall towards 74.40/20 or manages to give way for the pair to rise higher towards 75.00/20 on the upside. Watch crucial price action near 74.60/80 over the next few sessions.
INTEREST RATES
The US Treasury yields have risen further at the far-end. Crucial resistances are ahead for the yields which if broken will negate our view of seeing a sideways move and in turn will become more bullish to see further rise. We will have to wait and watch closely. The German yields also have limited room on the upside from here. We expect the key resistances coming up to halt the current rise and trigger a reversal. The 10Yr and 5Yr GoI have risen sharply yesterday and are now bullish to see further rise from here.
The US 2Yr (0.76%) and the 5Yr (1.36%) Treasury yields remain stable while the 10Yr (1.65%) and the 30Yr (2.05%) have risen further. The 10Yr has entered the crucial 1.65%-1.7% resistance zone while the 30Yr has little room to test its key resistance level of 2.1%. As mentioned yesterday, a strong rise past these levels will negate our view of seeing a pull-back and sideways range. In turn that will turn the outlook more bullish to see further higher levels. We will have to wait and watch.
The German 2Yr (-0.63%), 5Yr (-0.43%), 10Yr (-0.13%) and 30Yr (0.25%) sustains higher and stable. There is limited upside from here. The key resistances at -0.1%/-0.05% (10Yr) and 0.25%-0.30% (30Yr) are likely to cap the upside and drag the yields lower again going forward. As mentioned yesterday, a strong rise past these resistances is necessarily needed to become more bullish from here.
The Indian 10Yr (6.5173%) GoI and the 5Yr (5.8498%) GoI have both risen sharply above their respective key levels of 6.5% and 5.8%. The near-term outlook is bullish to test 6.55%-6.56% (10Yr) and 5.90%-5.91% (5Yr) on the upside.
DATA TODAY
5:00 10:30 IN Services PMI
...Kshitij Expn 57.9 ...Expected 57.8 ...Previous 58.1
3:15 18:45 US ADP Emp
..Kshitij Expn 86K ...Expected 358K ...Previous 534k
Data released yesterday:-
-------------------------
0:30 6:00 JP PMI
...Kshitij Expn 55.3 ...Expected 54.3 ...Previous 54.5 ...Actual 54.3
1:45 7:15 CN PMI
...Kshitij Expn 49.9 ...Expected 50.1 ...Previous 49.9 ...Actual 50.9
7:30 13:00 CH CPI
...Kshitij Expn -0.5 ...Previus 0.6 ...Actual 0.6
9:30 15:00 UK PMI
...Kshitij Expn 59.1 ...Expected 57.6 ...Previous 58.2 ...Actual 57.9
14:30 20:00 CA PMI
...Kshitij Expn 58.2 ...Previous 57.2 ...Actual 56.5
15:00 20:30 US Manufacturing ISM
...Kshitij Expn 62.4 ...Expected 60.4 ...Previous 61.1 ...Actual 68.2
Gold resilient, back above 1800 after brief dip
Gold dipped notably after hitting 1831.66, following Dollar's rally. But Gold remains resilient so far, holding above 1789.31 support, and it's back above 1800 handle. Further rally is still in favor and break of 1831.66 will resume the rally from 1752.32 towards 1877.05 resistance next.
Nevertheless, we're still seeing Gold as being a leg inside the range pattern from 1676.65. While a break of 1877.05 cannot be ruled out, we're not seeing much chance of breaking through 1916.30 medium term resistance. Meanwhile, break of 1789.31 support will argue that fall from 1877.05 is probably ready to resume through 1752.32.
Dollar index range bound with bullish bias ahead of FOMC minutes
Minutes of the December FOMC meeting will be a major focus today. Back then, Fed decided to speed up tapering and end it in March instead of June. Also, the new projections saw three rate hikes this year. The markets would like to see more in-depth information an related discussion, and hints on the timing of the first hike. Currently, Fed fund futures are already pricing in nearly 60% chance that federal funds rate will be raised to 0.25-0.50% and above in March.
Dollar index is staying well in range of 95.51/96.93, much reflecting the movements in EUR/USD. With 95.51 support intact, further rally is expected in DXY, and an upside breakout could come as soon as a reaction to non-farm payroll report this week. A set of strong job numbers could easily push DXY through 61.8% retracement of 102.99 to 82.0 at 97.72. In the case, 100 handle would be within reach very soon.
Elliott Wave View: Dow Futures (YM) Ending Wave 5
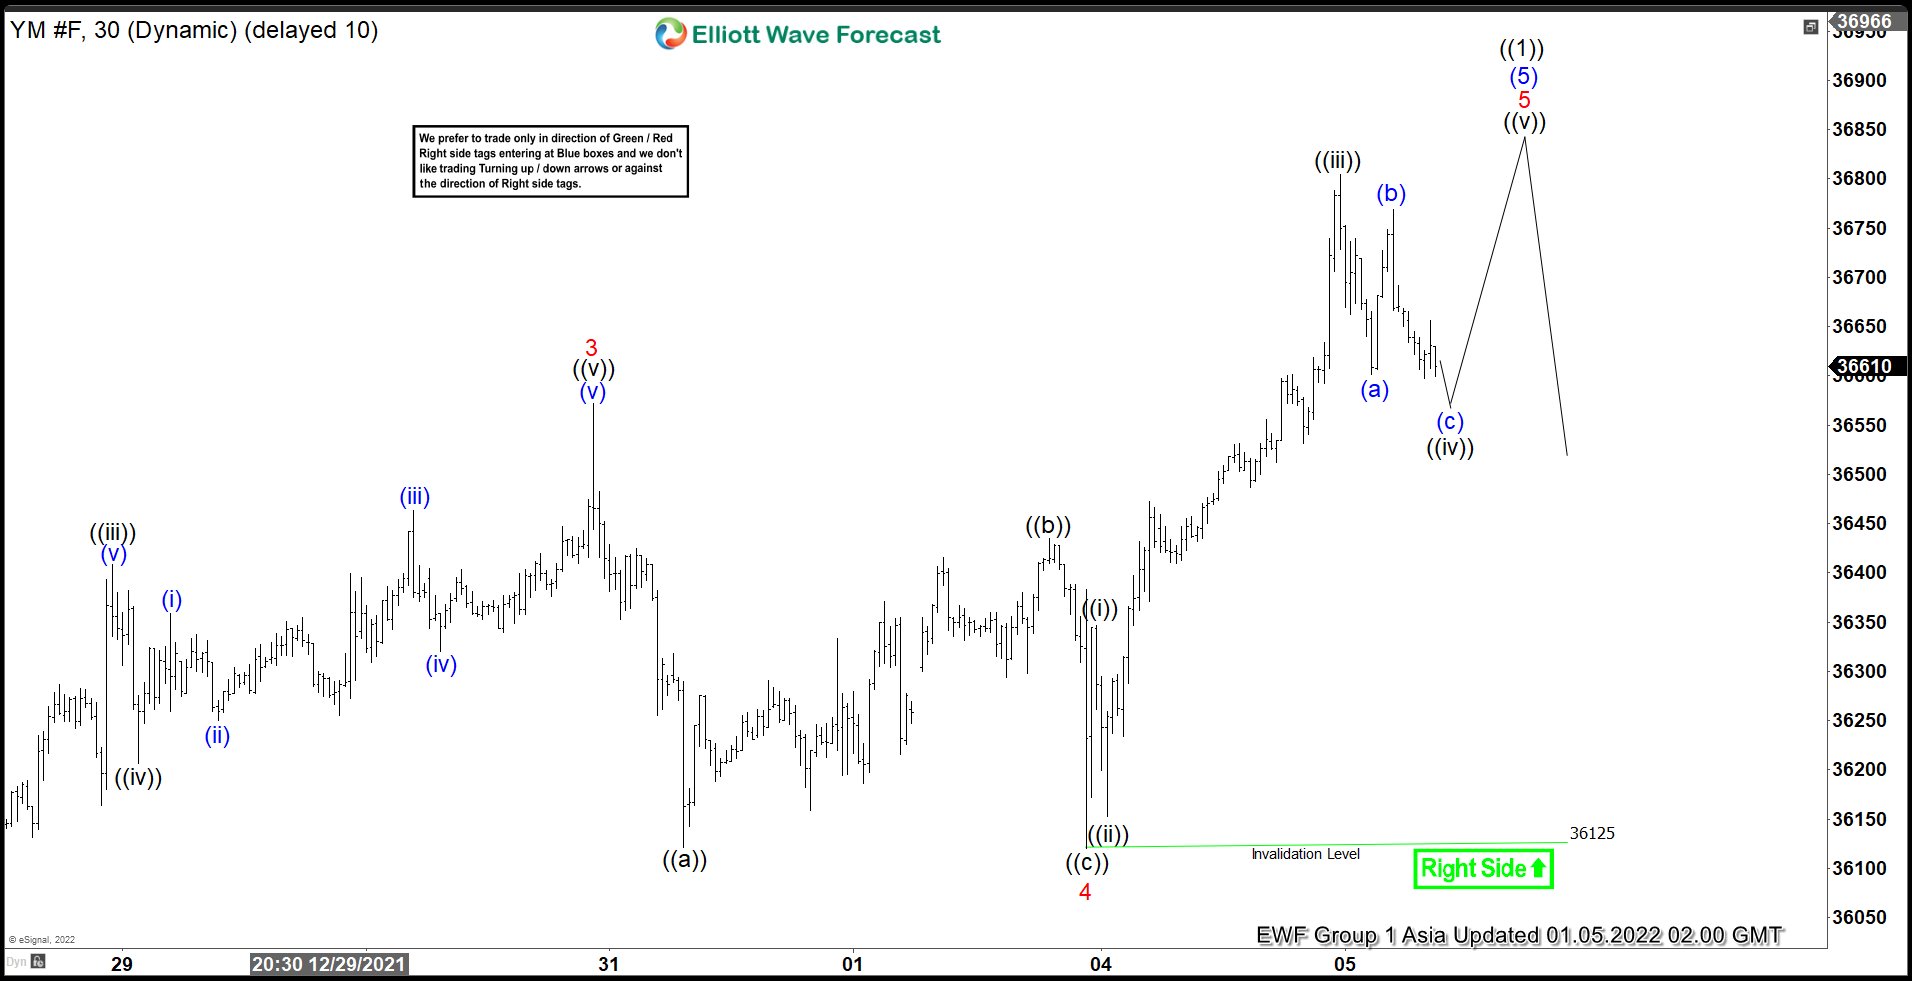
Short Term Elliott Wave View in Dow Futures (YM) suggests rally from December 2, 2021 low is unfolding as a 5 waves impulse Elliott Wave structure. Up from December 2 low, wave 1 ended at 36030 and dips in wave 2 ended at 34547. Index then resumes higher in wave 3 towards 36572 and pullback in wave 4 ended at 36120. The internal subdivision of wave 4 unfolded as a zigzag structure where wave ((a)) ended at 36121, wave ((b)) ended at 36435, and wave ((c)) ended at 36125.
Wave 5 is currently in progress as another impulse in lesser degree. Up from wave 4, wave ((i)) ended at 36347 and pullback in wave ((ii)) ended at 36153. Index then resumes higher in wave ((iii)) towards 36804. Near term, as far as pivot at 36125 low stays intact, expect wave ((iv)) dips to find support in the sequence of 3, 7, or 11 swing for 1 more push higher to end wave ((v)). The move higher should also complete wave 5 of 5 of ((1)) in higher degree. Afterwards, expect a larger pullback in 3 waves at least to correct cycle from December 2, 2021 low.
Dow Futures (YM) 1 Hour Elliott Wave Chart
Gold Price Holds Key Support, FOMC Next
Key Highlights
- Gold price is stable above the $1,785 and $1,780 support levels.
- It is facing a major resistance near $1,820 on the 4-hours chart.
- EUR/USD trimmed gains after it failed to clear the 1.1380 zone.
- GBP/USD remains elevated above the 1.3450 support zone.
Gold Price Technical Analysis
This past week, gold was able to gain pace above the $1,805 level against the US Dollar. The price cleared the $1,818 and $1,820 resistance levels before it faced resistance.
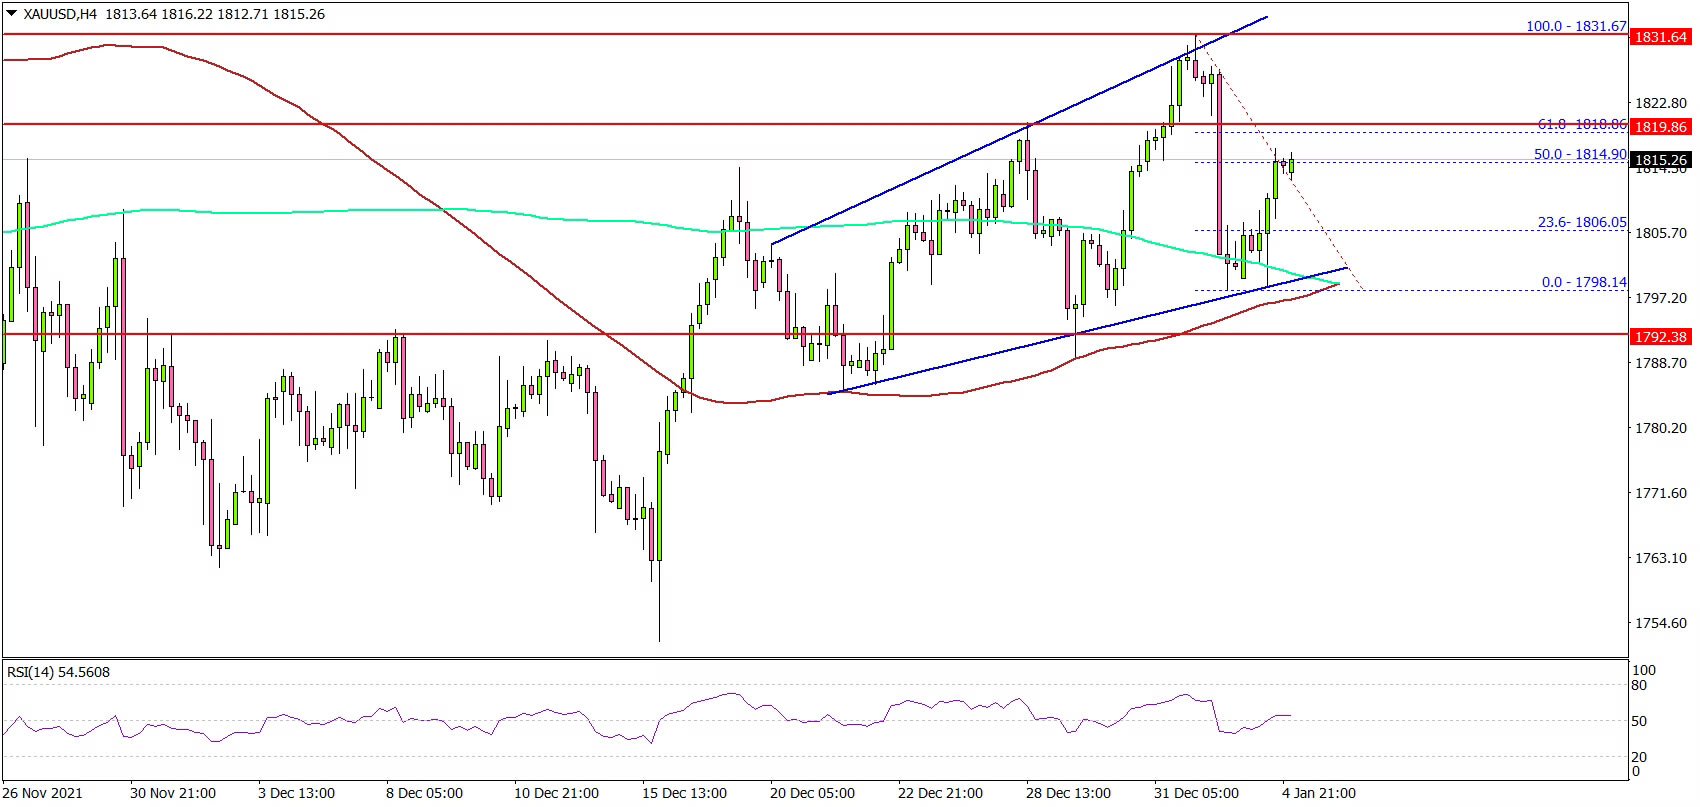
The 4-hours chart of XAU/USD indicates that the price traded as high as $1,831 before a fresh decline. There was a move below the $1,815 and $1,810 levels.
However, the bulls were active above the $1,800 level and the 200 simple moving average (green, 4-hours). On the upside, the price is facing resistance near the $1,818 level.
The main resistance is near the $1,830 level. A clear break above $1,830 could send the price toward the $1,850 resistance zone in the near term. The next key resistance is near the $1,865 level.
On the downside, the price might remain supported near $1,800. The main support is near $1,785, below which there is a risk of a move towards $1,760.
Fundamentally, the US ISM Manufacturing Index for Dec 2021 was released yesterday by the Institute for Supply Management (ISM). The market was looking for a decline from 61.1 to 60.2.
The actual result was lower than the forecast, as the US ISM Manufacturing Index declined from 61.1 to 58.7. Besides, the ISM Manufacturing New Orders Index declined from 61.5 to 60.4.
Looking at EUR/USD, the pair failed to clear the 1.1380 resistance zone and started a fresh decline below 1.1320.
Economic Releases to Watch Today
- Germany’s Services PMI for Dec 2021 - Forecast 48.4, versus 48.4 previous.
- Euro Zone Services PMI for Dec 2021 – Forecast 53.3, versus 53.3 previous.
- US Services PMI for Dec 2021 – Forecast 57.5, versus 57.5 previous.
- US ADP Employment Change for Dec 2021 - Forecast 400K, versus 534K previous.
FOMC Meeting Minutes.
Fed Kashkari: Threshold for rate hike could be met with Apr 2022 inflation data
Minneapolis Fed President Neel Kashkari said in an essay that he supported Fed's decision to increase the speed of tapering back in December FOMC meeting. Also, it brought forward two rate hikes into 2022 because "inflation has been higher and more persistent than I had expected."
Kashkari added, he'd prefer the forward guidance to commit to keeping federal funds rate at effective lower bound "until 12-month core PCE had exceeded 2 percent for 12 months." Based on this criteria, "the test that I preferred will likely be met when the April 2022 data are released the following month". The "threshold" (not trigger) for lift off would then be met.
Technical Outlook and Review
DXY:
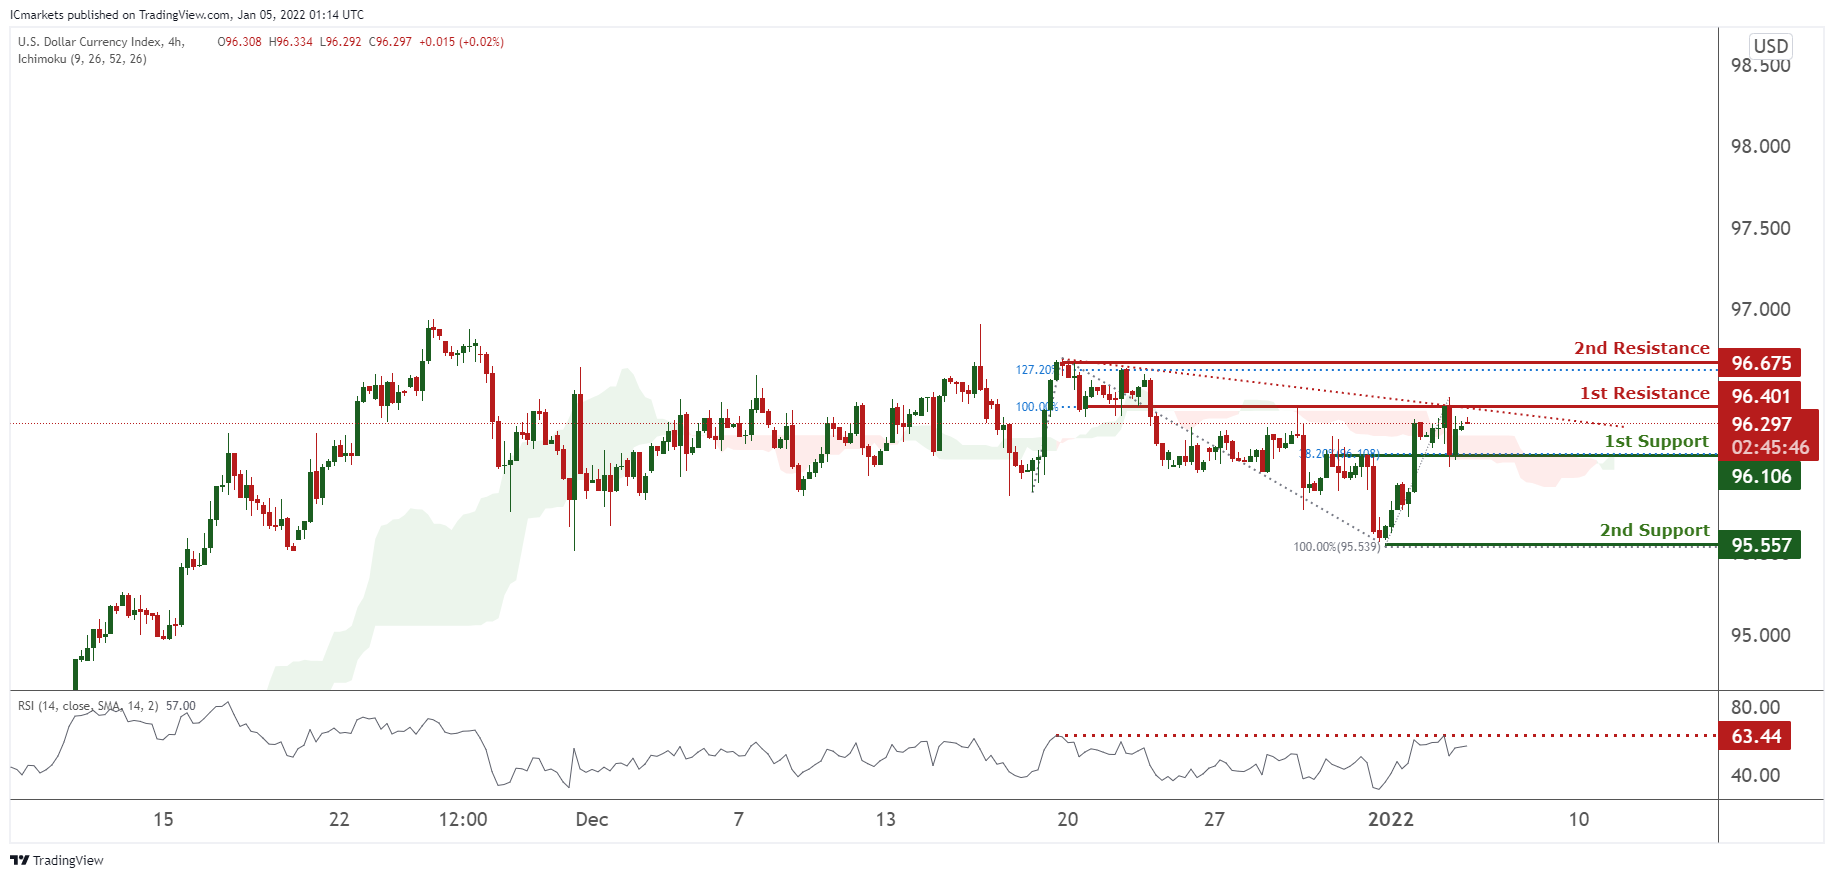
On the H4, prices are on bearish momentum and abiding to our bearish trendline. We see the potential for a dip from our 1st resistance at 96.401 in line with 100% Fibonacci extension towards our 1st support in line 96.106 with 38.2% Fibonacci retracement. RSI are at levels where dips previously occurred,and prices are trying to pass through our ichimoku clouds, further supporting our bearish bias.
Areas of consideration:
- H4 time frame, 1st resistance at 96.401
- H4 time frame, 1st support at 96.106
XAU/USD (GOLD):
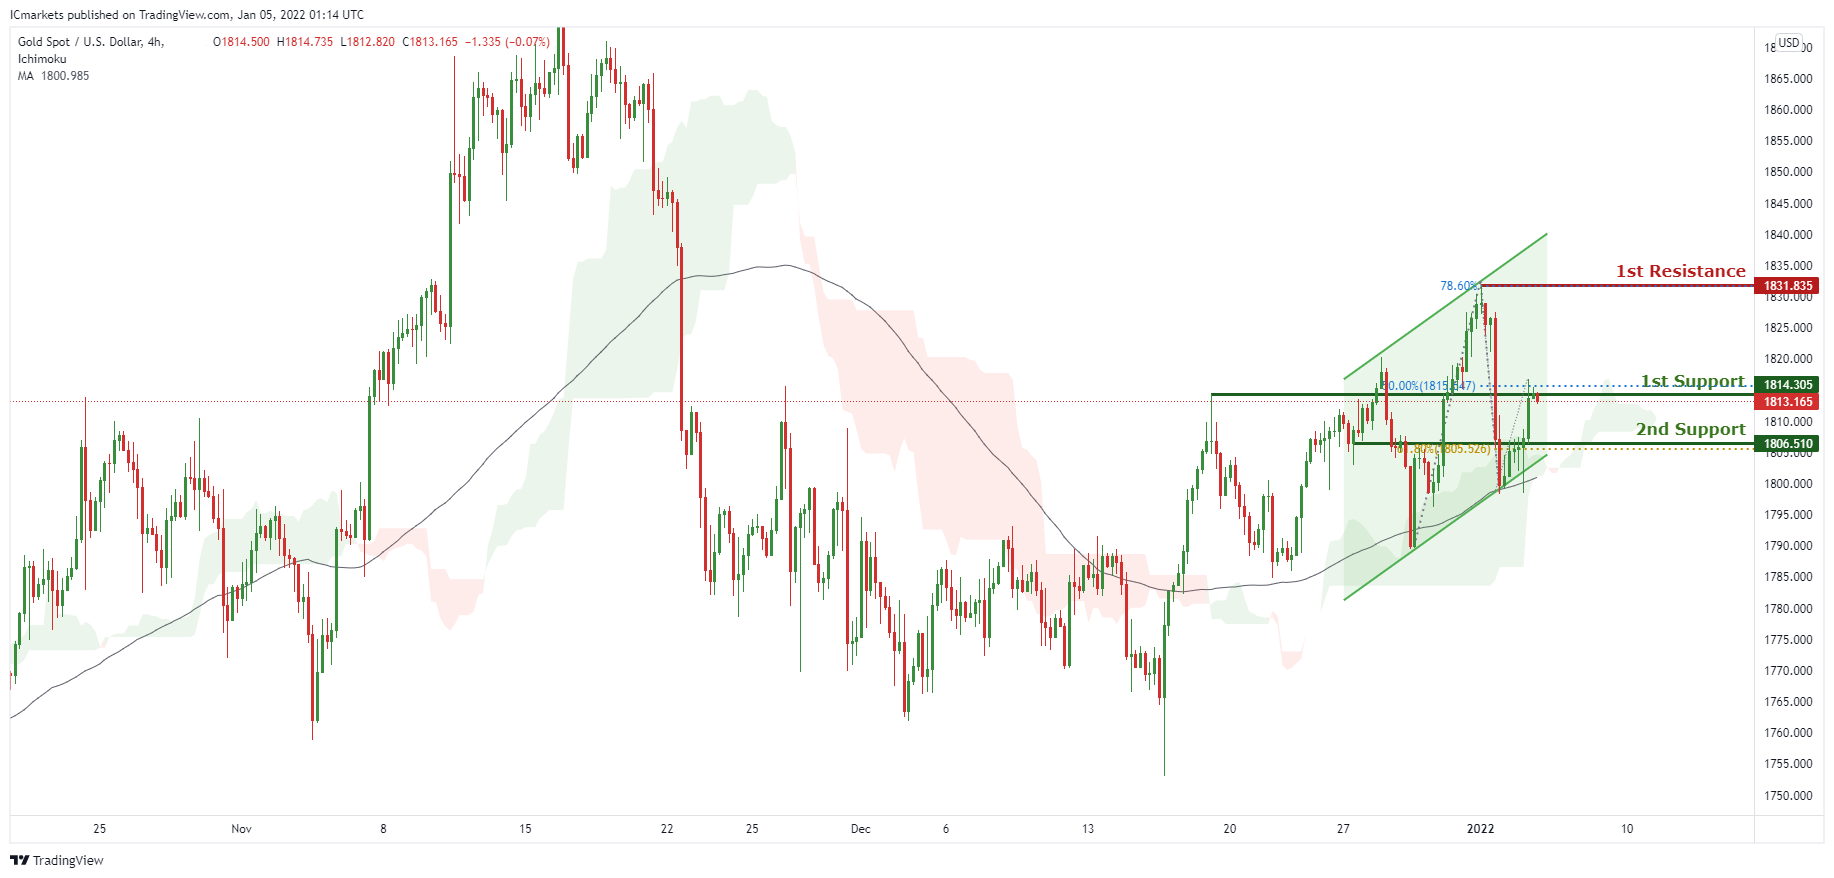
On the H4, prices are consolidating in a parallel channel and on bullish momentum. We see the potential for further upside from our 1st support at 1814.305 in line with 50% Fibonacci retracement towards our 1st resistance at 1831.835 in line with 78.6% Fibonacci extension. Prices are trading our MA and also ichimoku clouds, further supporting our bullish bias. Alternatively, our stop loss will be placed at 2nd support at 1906.510 in line with 61.8% Fibonacci retracement.
Areas of consideration:
- H4 1st support at 1814.305
- H4 1st resistance at 1831.845
GBP/USD
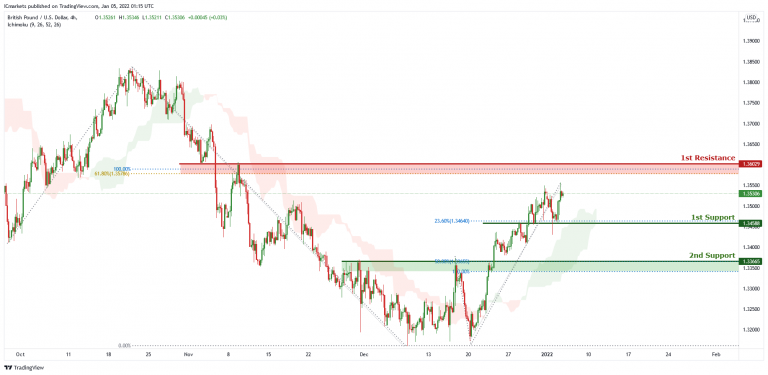
On the H4 chart, price is currently heading towards the key resistance level of 1.36029 which is also 100% Fibonacci projection and 61.8% Fibonacci retracement. Alternatively price can dip to the 1st support level of 1.34588 which is also 23.6% Fibonacci retracement. Our bullish bias is supported by the ichimoku cloud indicator as price is trading above it.
Areas of consideration:
- H4 1st support at 1.34588
- H4 1st resistance at 1.36029
USD/CHF
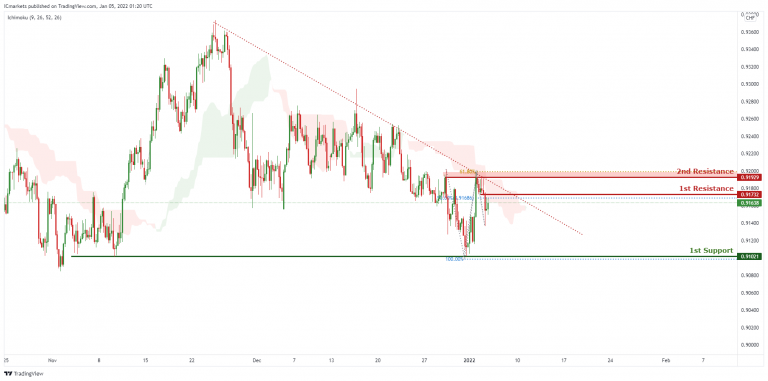
In reference to yesterday’s analysis, price is moving nicely towards 1st Support.. On the H4 timeframe, price is abiding to the descending trendline resistance, signifying an overall bearish momentum. We can expect price to drop from the 1st Resistance level in line with 50% Fibonacci retracement towards 1st Support in line with 100% Fibonacci projection. Our bearish bias is further supported by the price holding below the Ichimoku Cloud.
Areas of consideration:
- Watch 1st Support at 0.91021
- Watch 1st Resistance at 0.91732
EUR/USD :
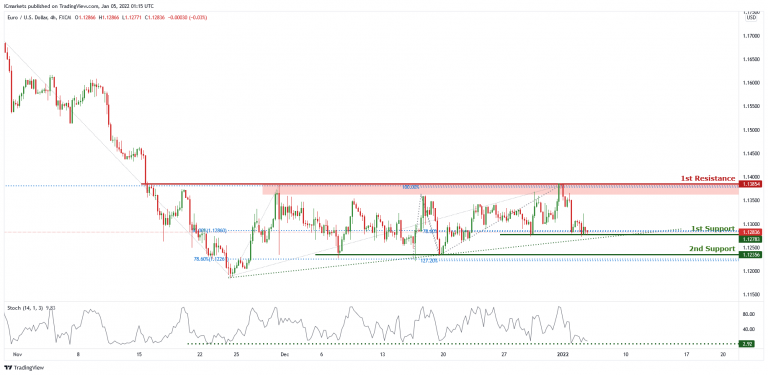
On the H4 chart, price is abiding by an ascending trendline and is near 1st support level of 1.12783 which is also 50% Fibonacci retracement and 78.6% Fibonacci projection. Price can potentially go to the 1st resistance of 1.13854 which is also 100% Fibonacci projection and 38.2% Fibonacci retracement. Our bullish bias is supported by the stochastic indicator as it is near support level.
Areas of consideration :
- H4 1st support at 1.12783
- H4 1st resistance at 1.13854
USD/JPY
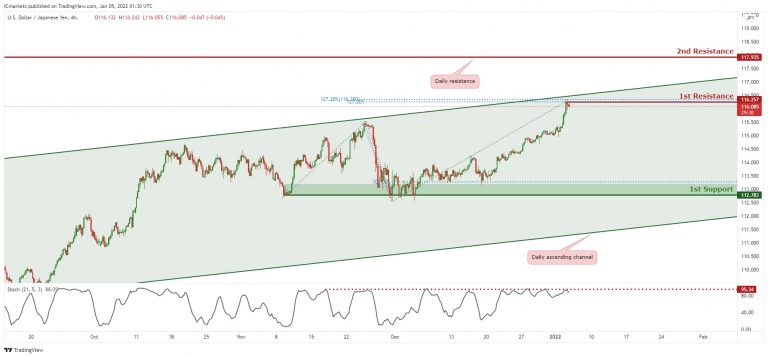
On the H4 timeframe, price is abiding to the ascending channel, showing an overall bullish momentum. However, we can expect a short term bearish momentum and drop from 1st resistance in line with horizontal swing high, 127.2% Fibonacci projection and 127.2% Fibonacci retracement towards 1st Support in line with graphical overlap support and 100% Fibonacci projection. Our bearish bias is further supported by stochastic where the %K line dropped from the resistance.
Areas of consideration:
- H4 1st resistance level 116.257
- H4 1st support level 112.783
AUD/USD:
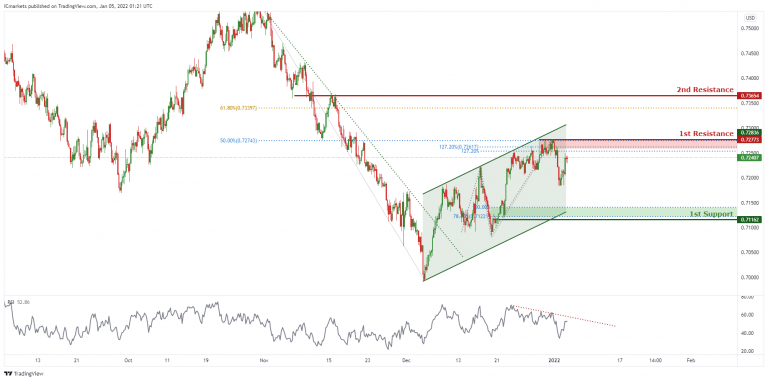
In reference to yesterday’s analysis, price is falling nicely towards 1st Support. On the H4, price is reacting in an ascending channel, signifying bullish momentum. However, price is currently at a resistance, we can expect price to drop from 1st Resistance in line with 127.2% Fibonacci projection ,127.2% Fibonacci Extension and 50% Fibonacci retracement towards 1st Support in line with 100% Fibonacci projection and 78.6% Fibonacci retracement. Our short-term bearish bias is further supported by the RSI indicator where it is abiding to the descending trendline resistance. Traders should wait for prices to swing higher or lower before entering.
Areas of consideration:
- H4 1st Support level 0.71203
- H4 1st resistance level 0.72773
NZD/USD:
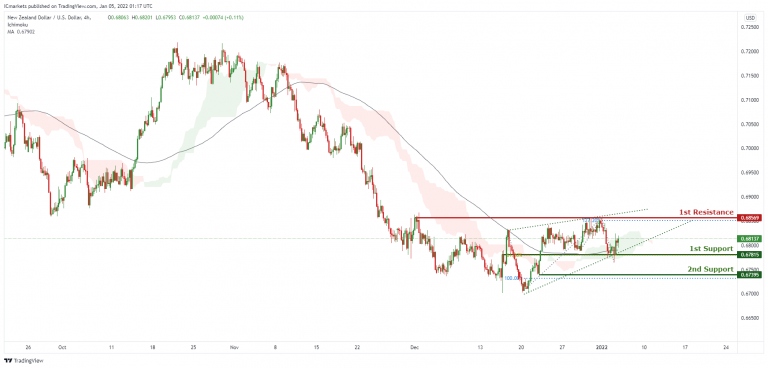
On the H4, prices are on bullish momentum and consolidating in a wedge pattern. We see the potential for further bullish movement from our 1st support at 0.67815 in line with 61.8% Fibonacci extension towards our 1st resistance at 0.68569 in line with 127.2% Fibonacci extension. Prices are trading above our MA and also ichimoku clouds further supporting our bullish bias. Alternatively, our stop loss will be placed at 2nd support at 0.67395 in line with 100% Fibonacci extension.
Areas of consideration:
- H4 time frame, 1st resistance at 0.68569
- H4 time frame, 1st support at 0.67815
USD/CAD:
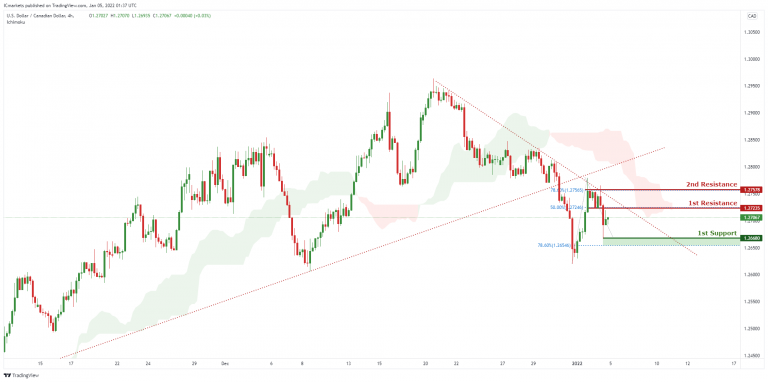
On the H4, with price moving below the ichimoku indicator and in view of the recent triangle breakout pullback, we have a bearish bias that price will drop from our 1st resistance at 1.27235 which is in line with horizontal overlap resistance and 50% Fibonacci retracement level to 1st support at 1.26680, which is in line with horizontal swing low support and 78.6% Fibonacci retracement. Alternatively, price may rise up to our 2nd resistance at 1.27578, which coincides with horizontal swing high resistance and 78.6% Fibonacci retracement level .
Areas of consideration:
- H4 time frame, 1st support at 26680
- H4 time frame, 1st resistance at 27235
OIL:
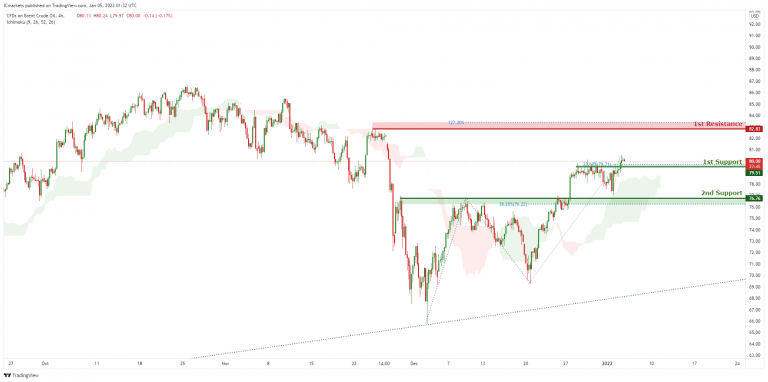
On the H4, with price moving above the ichimoku cloud, we have a bullish bias that price will rise to our 1st resistance at 82.83 which is in line with horizontal swing high resistance and 127.2% Fibonacci extension from 1st support at 79.51, which is in line with horizontal overlap support and 23.6% Fibonacci retracement level. Alternatively, price may break 1st support structure and head for 2nd support at 76.76, which coincides with horizontal overlap support and 38.2% Fibonacci retracement level .
Areas of consideration:
- H4 time frame, 1st resistance of 83
- H4 time frame, 1st support of 51
Dow Jones Industrial Average:
On the H4, with price moving above the ichimoku cloud, we have a bullish bias that price will rise to our 1st resistance at 37124 which is in line with horizontal swing high resistance and 161.8% Fibonacci extension from 1st support at 36555, which is in line with horizontal overlap support and 23.6% Fibonacci retracement level. Alternatively, price may break 1st support structure and head for 2nd support at 36258, which coincides with horizontal overlap support and 38.2% Fibonacci retracement level .
Area of consideration:
- 4H resistance at 37124
- 4H support at 36555

EURGBP Wave Analysis
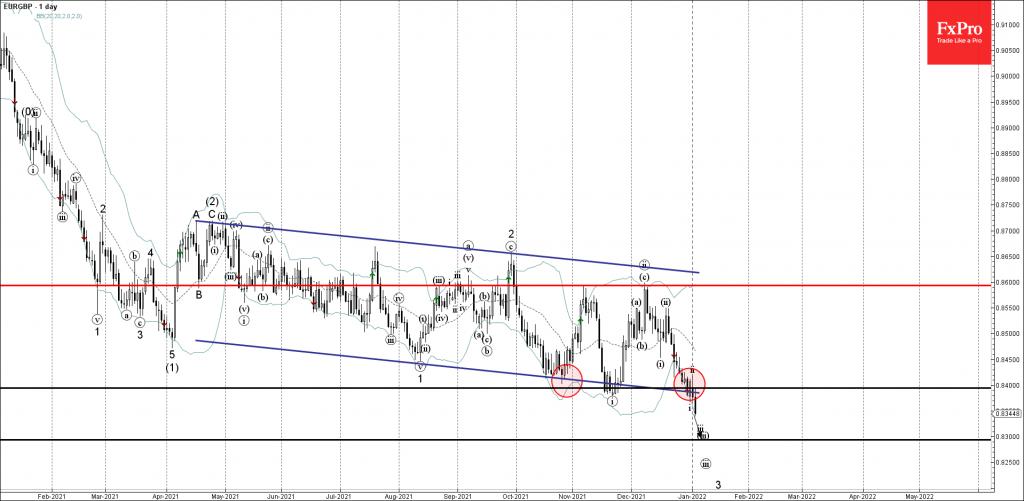
- EURGBP broke support zone
- Likely to fall to support level 0.8300
EURGBP currency pair recently broke the support zone lying at the intersection of the support level 0.8400 (previous monthly low from November) and the support trendline of the daily down channel from April.
The breakout of this support zone accelerated the active impulse waves 3 and (3).
Given the strong daily downtrend – EURGBP currency pair can be expected to fall further toward the next support level 0.8300 (target price for the completion of the active impulse wave (iii)).