
Sample Category Title
Loonie Rallies on Jobs Beat as Markets Sees Extended BoC Hold
Canadian Dollar climbed sharply after a blockbuster November jobs report, which easily surpassed expectations and reinforced the view that the BoC will leave policy unchanged next week. The strength of the data has effectively shut the door on the prospect of another near-term rate cut.
The BoC has already delivered 275bps of easing—one of the most aggressive responses in the G10—before signaling a pause in October. With growth likely to accelerate into year-end and the economy gradually shaking off the impact of US tariffs, markets now broadly expect the BoC to remain on hold through 2026, provided inflation remains contained.
While CAD strengthened, Dollar stayed sluggish. Although losses have moderated against European currencies and the Yen, Dollar continues to underperform as markets look past backward-looking data and focus on next week’s FOMC decision.
September PCE offered little fresh insight. The numbers came in largely as expected and did nothing to alter the dominant view that the Fed will deliver a 25bps cut in a risk-management move. The data simply confirmed the slow cooling pattern already well understood by policymakers.
The University of Michigan survey provided a clearer signal, with short- and long-term inflation expectations declining again. This four-month easing trend should help soften resistance from Fed hawks and further anchor expectations for imminent policy easing.
In currency markets, AUD leads the performance board, supported additionally by improved risk sentiment. Kiwi follows, while Sterling also trades firmer. Swiss Franc is the weakest, followed by Dollar and Euro. Yen and Loonie are positioned mid-table.
In Europe, at the time of writing, FTSE is down -0.03%. DAX is up 0.95%. CAC is up 0.11%. UK 10-year yield is up 0.12 at 4.453. Germany 10-year yield is up 0.017 at 2.793. Earlier in Asia, Nikkei fell -1.05%. Hong Kong HSI rose 0.58%. China Shanghai SSE rose 0.70%. Singapore Strait Times feel -0.08%. Japan 10-year JGB yield rose 0.011 to 1.952.
US UoM consumer sentiment jumps to 53.3, inflation expectations ease further
US consumer sentiment improved in December, with the University of Michigan headline index rising to 53.3 from 51.0, beating expectations of 52.0. The gain was driven by a sharp rise in Expectations Index, which climbed to 55.0 from 51.0. However, views on current conditions deteriorated slightly from 51.1 to 50.7.
A key development came from inflation expectations. Year-ahead inflation expectations fell for a fourth consecutive month, dropping from 4.5% to 4.1%, the lowest since January 2025—though still above the 3.3% level seen at the start of the year. Long-run inflation expectations edged down from 3.4% to 3.2%, matching the January reading.
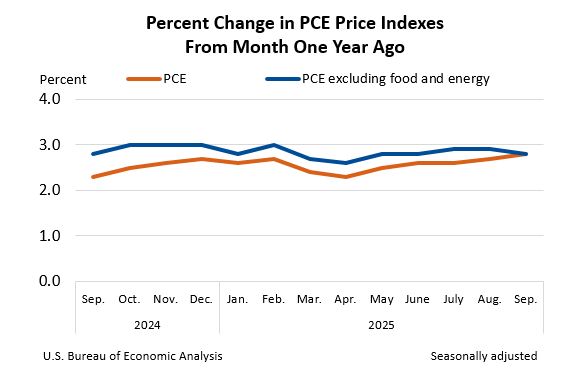
US PCE mixed, spending softens slightly as core inflation eases
US personal income rose 0.4% mom in September, in line with expectations, while personal spending increased 0.3%, a touch below the 0.4% consensus. The combination suggests consumer demand remains resilient but is moderating gradually.
Inflation readings were broadly stable. Headline PCE rose 0.3% mom, keeping the annual rate at 2.8% yoy, slightly above August’s 2.7% but exactly matching forecasts.
Core PCE increased 0.2% mom, while the annual measure eased from 2.9% yoy to 2.8%, undershooting expectations for no change. The drop in core PCE is a mild but welcome sign for policymakers looking for continued disinflation.
Overall, the data reinforce expectations for a Fed rate cut next week, as consumption growth cools and inflation edges lower.
Canada employment jumps 53.6k in October, unemployment rate falls sharply to 6.5%
Canada’s labor market delivered a major upside surprise in November, adding 53.6k jobs versus expectations of a small -1.5k decline. The strength came almost entirely from part-time positions, which rose by 63k, offsetting a modest dip in full-time work. The gain pushed the employment rate up 0.1% to 60.9%, marking a notable stabilization after a year of softening labour momentum.
The unemployment rate dropped sharply from 6.9% to 6.5%, defying expectations for a rise to 7.0%. This reverses part of the labor market deterioration seen through most of 2025, when unemployment climbed to 7.1% in September—its highest level since 2016. The improvement suggests that labor demand remains healthier than previously believed, even in a slowing economic environment.
Wage data also supported the stronger labor picture. Average hourly earnings rose 3.6% yoy in November, up slightly from October’s 3.5% yoy, reaching CAD 37.00.
Japan household spending slumps -3.0% yoy in October, casting doubt over strength of recovery
Japan’s household spending fell sharply by -3.0% yoy in October, far below expectations for 1.1% yoy increase, and marking the steepest decline since January 2024. It was also the first annual drop in six months.
On a monthly, seasonally adjusted basis, spending plunged -3.5% mom, defying forecasts of a 0.7% mom growth. Lower outlays on food, leisure and automobile-related expenses drove the weakness, though officials said it remains unclear whether the decline represents a one-off setback, noting consumption is still perceived to be in a recovery phase.
The data arrive at a delicate moment for the BoJ. Markets have ramped up bets on a rate hike this month following recent comments from Governor Kazuo Ueda that the Bank would weigh the “pros and cons” of further tightening. The slump in spending, however, introduces fresh uncertainty around the durability of domestic demand—one of the BoJ’s key criteria for normalizing policy continuously.
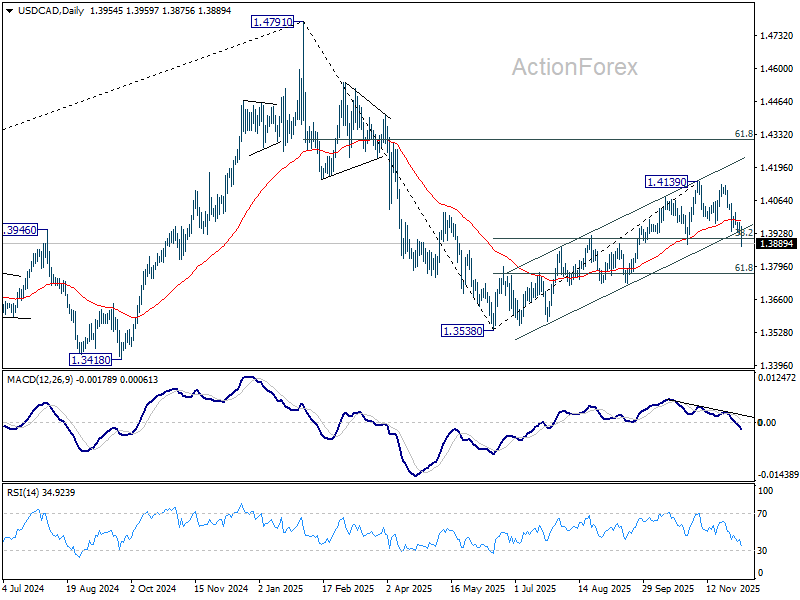
USD/CAD Mid-Day Outlook
Daily Pivots: (S1) 1.3931; (P) 1.3954; (R1) 1.3982; More...
USD/CAD's fall accelerate lower today and intraday bias stays on the downside. Current development argues that rise from 1.3538 has completed at 1.4139, on bearish divergence condition in D MACD. Deeper fall should be seen to 61.8% retracement of 1.3538 to 1.4139 at 1.3768. Firm break there will argue that whole decline form 1.4791 might be ready to resume through 1.3538 low. For now, risk will stay on the downside as long as 1.3970 support turned resistance holds, in case of recovery.
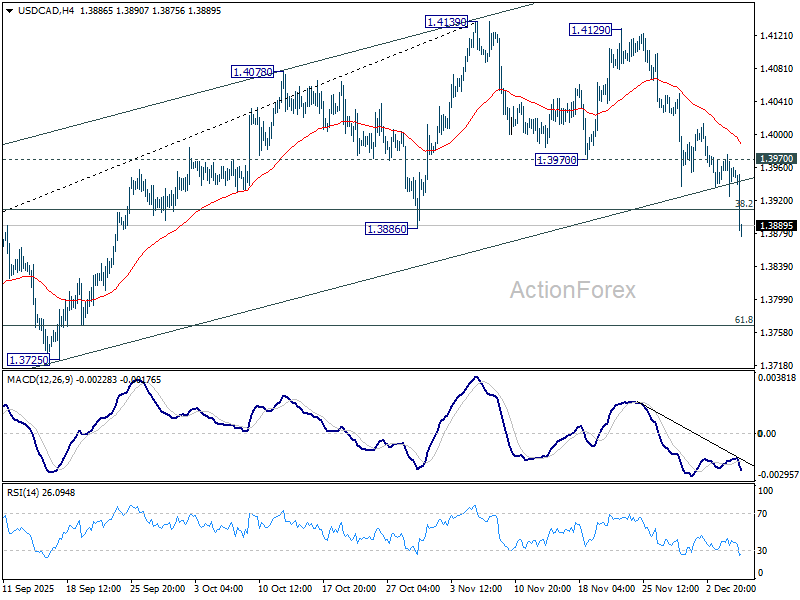
In the bigger picture, price actions from 1.4791 medium term top is likely just unfolding as a correction to up trend from 1.2005 (2021 low), with rise from 1.3538 as the second leg. A third leg should follow before up trend resumption. That is, range trading is set to extend for the medium term. For now, this will remain the favored case as long as 1.3886 support holds. However, firm break of 1.3886 will revive the case that fall from 1.4791 is indeed a larger scale correction.
US UoM consumer sentiment jumps to 53.3, inflation expectations ease further
US consumer sentiment improved in December, with the University of Michigan headline index rising to 53.3 from 51.0, beating expectations of 52.0. The gain was driven by a sharp rise in Expectations Index, which climbed to 55.0 from 51.0. However, views on current conditions deteriorated slightly from 51.1 to 50.7.
A key development came from inflation expectations. Year-ahead inflation expectations fell for a fourth consecutive month, dropping from 4.5% to 4.1%, the lowest since January 2025—though still above the 3.3% level seen at the start of the year. Long-run inflation expectations edged down from 3.4% to 3.2%, matching the January reading.
US PCE mixed, spending softens slightly as core inflation eases
US personal income rose 0.4% mom in September, in line with expectations, while personal spending increased 0.3%, a touch below the 0.4% consensus. The combination suggests consumer demand remains resilient but is moderating gradually.
Inflation readings were broadly stable. Headline PCE rose 0.3% mom, keeping the annual rate at 2.8% yoy, slightly above August’s 2.7% but exactly matching forecasts.
Core PCE increased 0.2% mom, while the annual measure eased from 2.9% yoy to 2.8%, undershooting expectations for no change. The drop in core PCE is a mild but welcome sign for policymakers looking for continued disinflation.
Overall, the data reinforce expectations for a Fed rate cut next week, as consumption growth cools and inflation edges lower.
Sunset Market Commentary
Markets
A flurry on smaller items had the potential to revive the single currency, but the European currency lacks the power and the heart to make any significant headway. Positive risk sentiment is the obvious first one with the EuroStoxx 50 currently rising 0.3%, visiting unchartered territory with the exception of a brief spell on November 12-13. Positive surprises in eco data counted as a second factor. October German factory orders increased by 1.5% M/M, beating 0.3% consensus. The second reading of EMU Q3 GDP showed an ever more resilient economy with the growth pace upwardly revised from 0.2% Q/Q to 0.3% Q/Q on the back of stronger household consumption (+0.2%), government spending (+0.7%) and investments (gross fixed capital formation +0.9%). Finally, the German government avoided a humiliating defeat with the approval of the pension bill. In the run-up to the vote, 18 CDU members threatened to vote against the bill, stripping the coalition of its majority. Eventually, the CDU/SPD mustered 318 votes in 630-parliament with 7 ruling lawmakers voting against, two abstaining and one not casting a vote. European yields trade around 1 bp higher across the curve today with EUR/USD going nowhere at 1.1650. On the US side of the story, there’s even less to talk about with markets counting down to Wednesday’s FOMC meeting.
The Belgian debt agency today published its Borrowing Requirements & Funding Plan for 2026. The BDA expects the 2026 gross borrowing requirements of the federal government to amount to €59.55bn, up from €53.65bn this year. Next year’s net financing requirement would amount to €26.37bn, taking into account the recent budgetary decision of the federal government for 2026-2029. OLO redemptions stand at €28bn. To finance these needs, the BDA mainly relies on long term funding. They look to issue €51.6bn of OLO’s, representing a €5.9bn increase compared to this year’s €45.7bn. Three new syndicated fixed rate deals are planned. The BDA has the intention to issue a new 10-yr benchmark, a new 5-yr benchmark, and one new OLO in a long maturity (obviously depending on market conditions). It does not anticipate launching a new Green OLO in 2026. The EMTN/Schuldscheine programmes, state notes and an increase in short term debt (Treasury Certificates) will complement the OLO funding. The average life of the Belgian debt portfolio reached 10.00 years as per 30 November 2025 (from 10.50 years at the start of the year), and the duration amounted to 7.44 years (from 8.44 years). The implicit cost of the portfolio was 2.01% in November (from 1.94%). In 2026, the average life of the debt portfolio will again be required to exceed 9.25 years.
News & Views
The FAO world food price index dropped for the third consecutive month in November (-1.2% M/M & -2.1% Y/Y), with all subindices except cereal declining. The cereal subindex rose 1.8% M/M (-5.3% Y/Y). Despite a generally comfortable supply outlook and reports of good harvests in Argentina and Australia, global wheat prices rose by 2.5 M/M in November, albeit from levels last seen in the first half of 2020. The Vegetable Oil Price Index dropped 2.6% M/M, reaching a five-month low, reflecting lower prices of palm, rapeseed and sunflower oils, more than offsetting a slight increase in soy oil. The picture in the meat price index was mixed (-1% M/M but up 4.9% Y/Y). Diary prices (-3.1% M/M and -2.4% Y/Y) recorded declines across all major dairy commodities, stemming from rising milk production and abundant export supplies in key producing regions. The Sugar Price Index declined 5.9% M/M and 29.9 Y/Y, reaching the lowest level since December 2020. Expectations of ample global sugar supplies in the current season continued to exert downward pressure on prices.
The Canadian economy added 53.6k jobs in November. After strong gains (>60k) in September and October, the market expected a slight drop. November gains were driven by part-time employment (63k). Full-time employment eased slightly (-9.5k). Job gains were mostly registered in the services sector (42.8K). Still goods-producing activities also contributed positively (11k). The unemployment rate dropped from 6.9% to 6.5%, but this was partially due to a decline in the labour force and the participation rate. Hourly wage growth was unchanged at 4%. The 2-y Canadian government bond yield jumps 14 bps to 2.6% after the release, strengthening believe that the Bank of Canada has ended its easing cycle (at 2.25%).The loonie strengthens from USD/CAD 1.395 to 1.389.
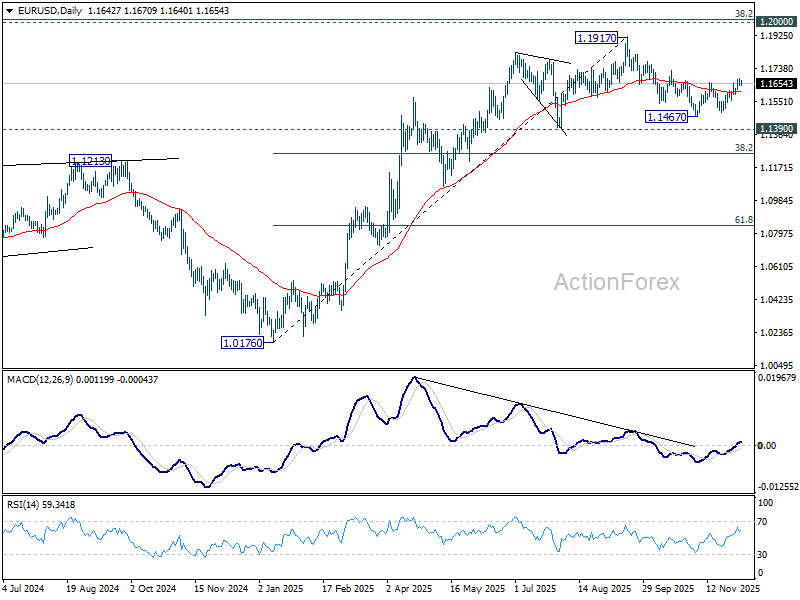
EUR/USD Mid-Day Outlook
Daily Pivots: (S1) 1.1629; (P) 1.1656; (R1) 1.1670; More….
No change in EUR/USD's outlook and intraday bias stays mildly on the upside. Fall from 1.1917 should have completed at 1.1467. Further rise should be seen to 1.1727 resistance first. Firm break there will bring retest of 1.1917 high. Nevertheless, below 1.1590 minor support will mix up the outlook and turn bias neutral again.
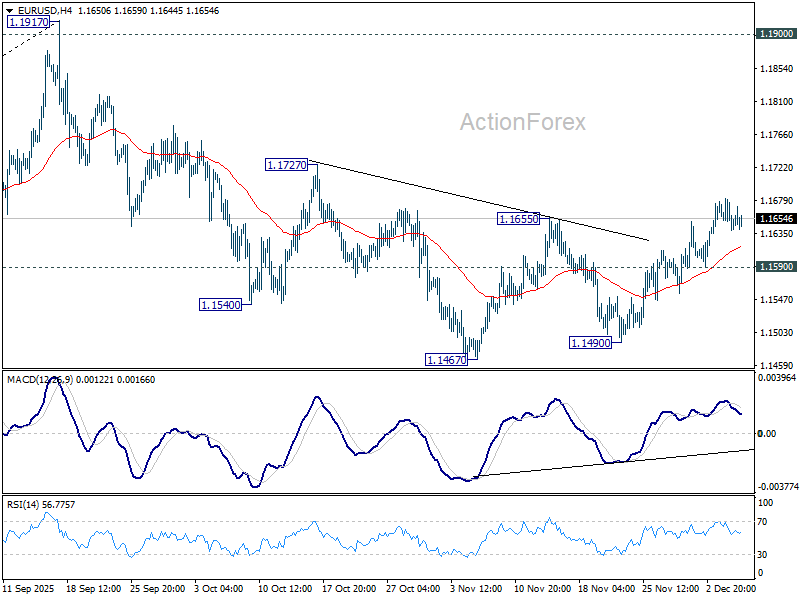
In the bigger picture, considering bearish divergence condition in D MACD, a medium term top is likely in place at 1.1917, just ahead of 1.2 key psychological level. As long as 55 W EMA (now at 1.1345) holds, the up trend from 0.9534 (2022 low) is still in favor to continue. Decisive break of 1.2000 will carry larger bullish implications. However, sustained trading below 55 W EMA will argue that rise from 0.9534 has completed as a three wave corrective bounce, and keep long term outlook bearish.
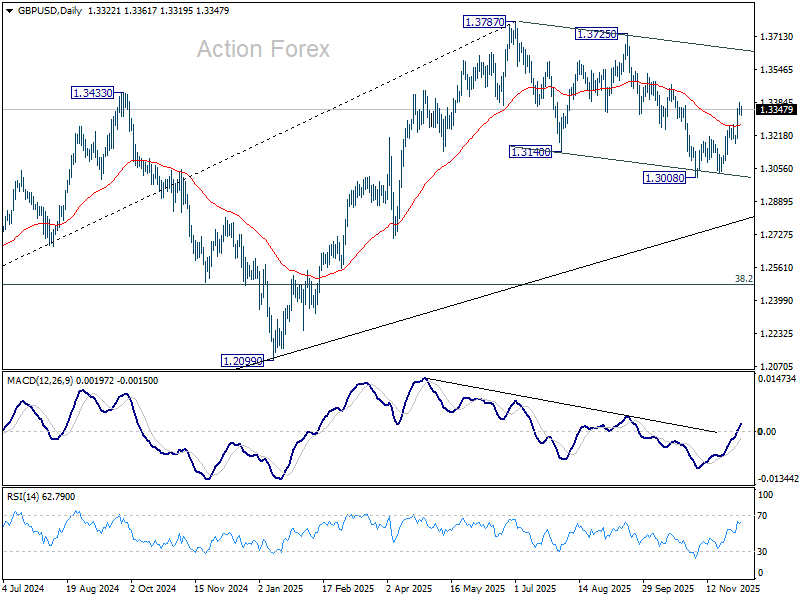
GBP/USD Mid-Day Outlook
Daily Pivots: (S1) 1.3303; (P) 1.3344; (R1) 1.3369; More...
Intraday bias in GBP/USD stays on the upside for the moment. Rise from 1.3008 is in progress for 1.3470 resistance first. Decisive break there will pave the way to retest 1.3725/3787 resistance zone. On the downside, below 1.3274 resistance turned support will turn intraday bias neutral first. But risk will stay on the upside as long as 1.3718 support holds, in case of retreat.
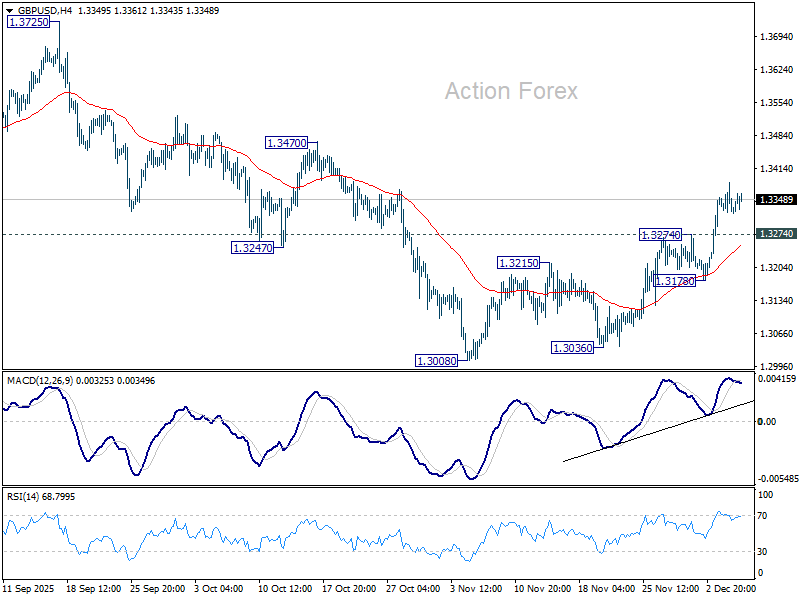
In the bigger picture, the break of 55 W EMA (now at 1.3184) is taken as the first sign that corrective rise from 1.0351 (2022 low) has completed. Decisive break of trend line support (now at 1.2760) will solidify this case and target 38.2% retracement of 1.0351 to 1.3787 at 1.2474 next. Meanwhile, in case of another rise, strong resistance should emerge below 1.4248 (2021 high) to cap upside to preserve the long term down trend.
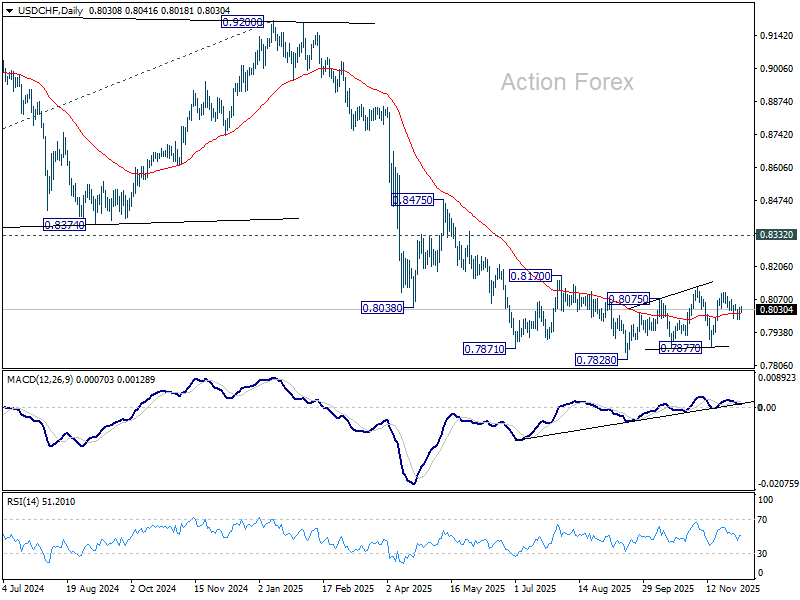
USD/CHF Mid-Day Outlook
Daily Pivots: (S1) 0.8006; (P) 0.8023; (R1) 0.8055; More…
No change in USD/CHF's outlook and intraday bias stays neutral at this point. Price actions from 0.7828 low is seen are a corrective pattern. On the upside, above 0.8052 resistance will indicate that pattern is still extending, and turn bias back to the upside for 0.8123 and above. On the downside, below 0.7990 will bring deeper fall back towards 0.7877 support.
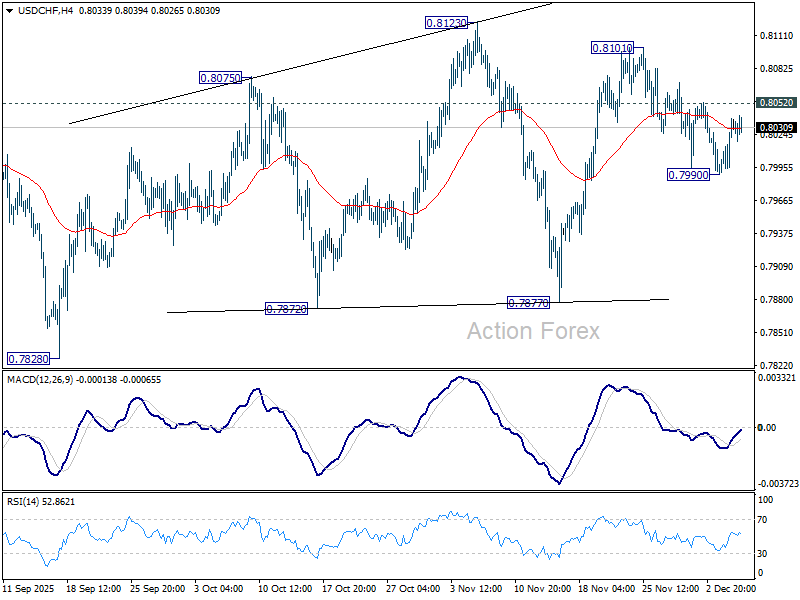
In the bigger picture, long term down trend from 1.0342 (2017 high) is still in progress. Next target is 100% projection of 1.0146 (2022 high) to 0.8332 from 0.9200 at 0.7382. In any case, outlook will stay bearish as long as 0.8332 support turned resistance holds (2023 low).
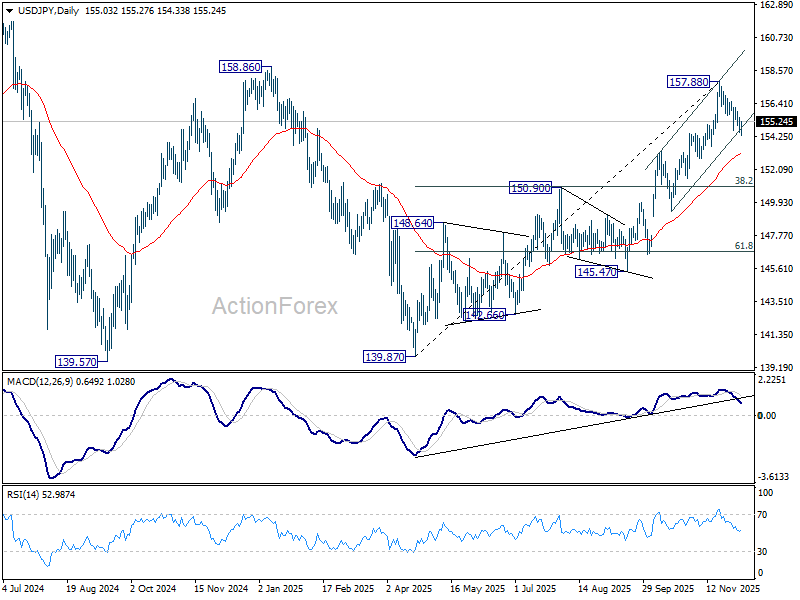
USD/JPY Mid-Day Outlook
Daily Pivots: (S1) 154.57; (P) 155.05; (R1) 155.60; More...
Intraday bias in USD/JPY stays on the downside for the moment. Sustained trading below channel support should bring deeper correction to 55 D EMA (now at 153.11). Firm break there will bring deeper fall to 150.90 cluster (38.2% retracement of 139.87 to 157.88 at 151.00). For now, risk will stay on the downside as long as 156.17 resistance holds, in case of recovery.
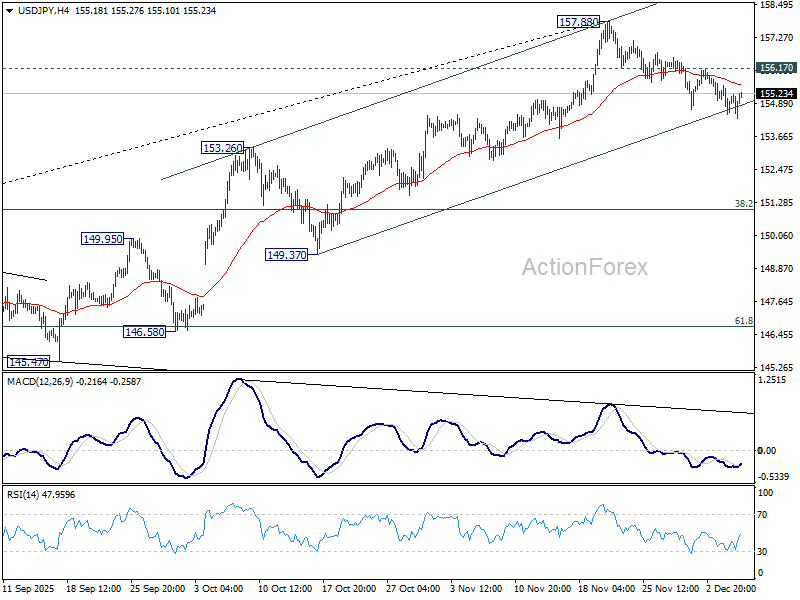
In the bigger picture, current development suggests that corrective pattern from 161.94 (2024 high) has completed with three waves at 139.87. Larger up trend from 102.58 (2021 low) could be ready to resume through 161.94 high. Decisive break of 158.85 structural resistance will solidify this bullish case and target 161.94 for confirmation. On the downside, break of 150.90 resistance turned support will dampen this bullish view and extend the corrective range pattern with another falling leg.
USD/CAD Mid-Day Outlook
Daily Pivots: (S1) 1.3931; (P) 1.3954; (R1) 1.3982; More...
USD/CAD's fall accelerate lower today and intraday bias stays on the downside. Current development argues that rise from 1.3538 has completed at 1.4139, on bearish divergence condition in D MACD. Deeper fall should be seen to 61.8% retracement of 1.3538 to 1.4139 at 1.3768. Firm break there will argue that whole decline form 1.4791 might be ready to resume through 1.3538 low. For now, risk will stay on the downside as long as 1.3970 support turned resistance holds, in case of recovery.
In the bigger picture, price actions from 1.4791 medium term top is likely just unfolding as a correction to up trend from 1.2005 (2021 low), with rise from 1.3538 as the second leg. A third leg should follow before up trend resumption. That is, range trading is set to extend for the medium term. For now, this will remain the favored case as long as 1.3886 support holds. However, firm break of 1.3886 will revive the case that fall from 1.4791 is indeed a larger scale correction.
Rising Expectations for Another Rate Hike in Japan
- Markets now treat a December rate hike to 0.75% as the base case.
- Inflation remains above target, with limited improvement in core measures.
- Rising rate expectations are strengthening the yen, supported by a narrowing US - Japan rate spread.
- Higher yields may constrain the BoJ’s pace of tightening next year.
Growing likelihood of a December rate increase
Expectations for another interest rate hike in Japan are clearly strengthening. Although initial hints appeared as early as September, they have intensified markedly in recent days. According to the latest reports, Bank of Japan policymakers are prepared to raise the policy rate to 0.75% at the December meeting - provided no significant disruptions emerge. Markets are now almost fully pricing in such a move, making it the baseline scenario.
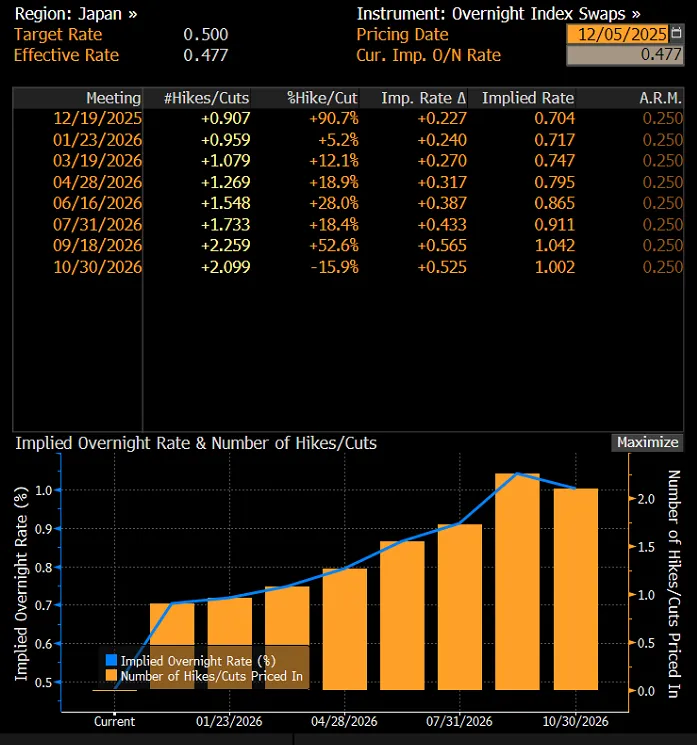
Valuation of futures contracts for the future path of interest rates in Japan, source: Bloomberg
Inflation pressures persist despite partial stabilisation
After a period of uncertainty linked to trade tensions, conditions have stabilised somewhat, while inflation remains above the central bank’s target and continues to strain households. Although much of the price growth stems from volatile food costs - an area monetary policy should not overreact to - the core inflation index in Japan excludes only fresh food and energy. Within this measure, improvement has been limited despite some stabilisation in individual categories.
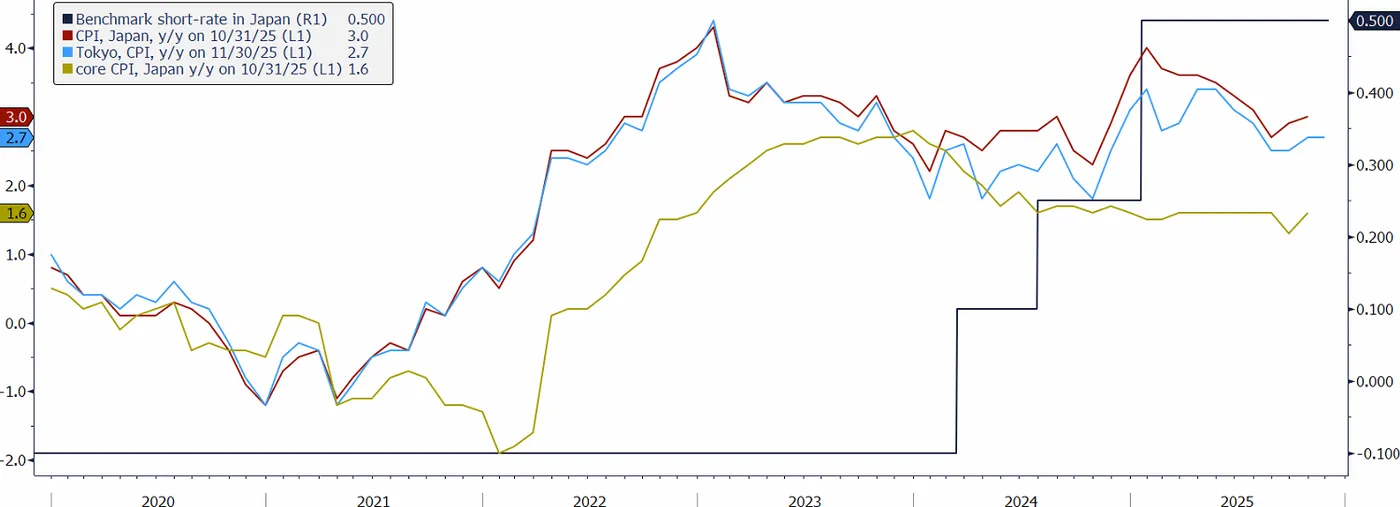
Inflation measures in Japan and the level of the main interest rate, source: Bloomberg
The risk of credibility loss for the Bank of Japan
A prolonged period of above-target inflation threatens to undermine the central bank’s credibility. For decades, Japan grappled with very low inflation, and markets grew accustomed to price growth below target. Today’s environment is different. Ignoring persistently elevated inflation - even if partly driven by unstable factors - is becoming increasingly difficult to justify.
Yen strengthens as rate expectations rise
Rising expectations for further rate hikes are supporting the yen, which has begun to appreciate against the dollar after weeks of weakness. The USD/JPY pair is trending lower, and the prospect of additional moves suggests further strengthening of the Japanese currency. The Bank of Japan will likely raise rates again in the spring - to around 1% - while the Federal Reserve is expected to continue its easing cycle. As a result, the interest-rate differential between the US and Japan should narrow to roughly 150 basis points by the end of next year, creating further room for yen appreciation.
Higher rates push bond yields up
Higher interest rates come with side effects, especially the rise in Japanese government bond yields. Recent increases have been substantial. While this is unlikely to stop the BoJ from delivering a December hike, it may slow the pace of future actions - the central bank is keen to avoid triggering a sharp sell-off in the debt market, especially as the government’s fiscal package is also exerting upward pressure on yields.
Technical picture of USD/JPY
In the second half of November, the USD/JPY currency pair reached levels corresponding to the peak recorded at the beginning of this year. The exchange rate has ‘returned’ to the upward trend channel, which it broke above last month. Signals coming from the BoJ, together with the technical setup, indicate that the strengthening of the JPY may continue, pushing the pair’s quotations toward even 150.00.
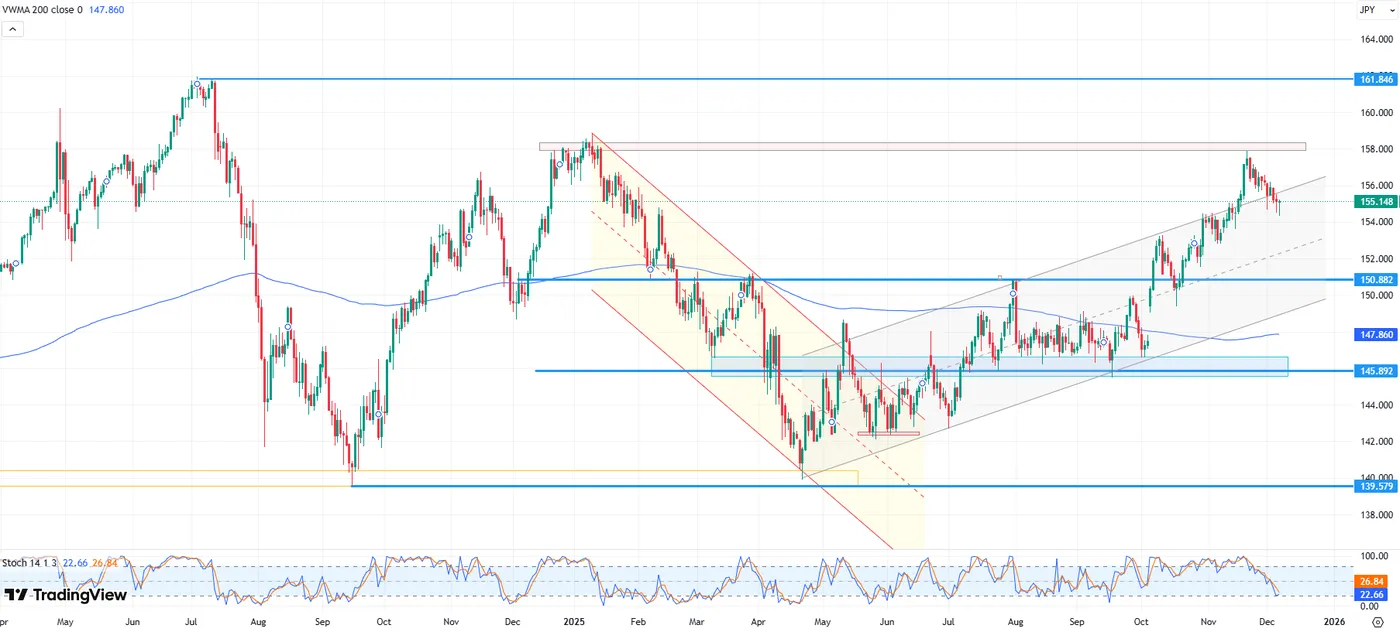
USD/JPY currency pair chart, daily data, source: Tradingview