
Sample Category Title
AUD/USD Daily Report
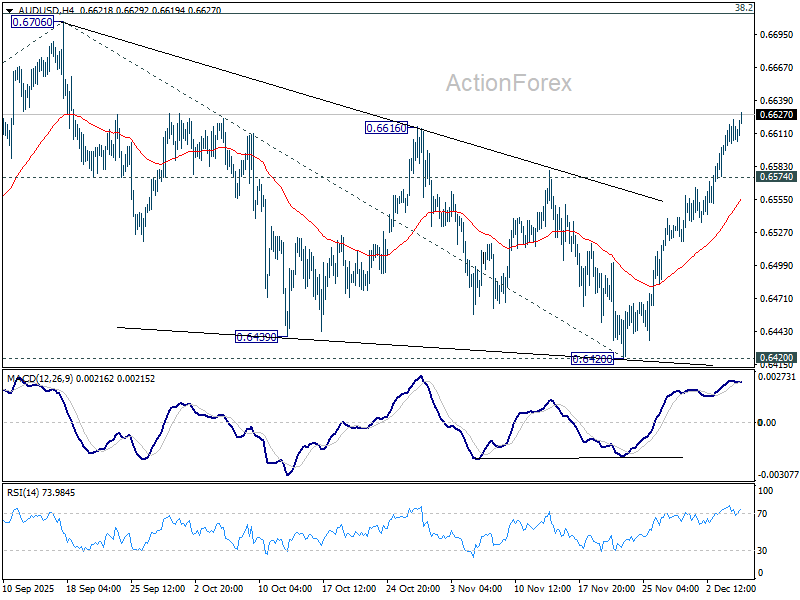
Daily Pivots: (S1) 0.6597; (P) 0.6611; (R1) 0.6624; More...
Intraday bias in AUD/USD remains on the upside at this point as rise from 0.6420 is in progress. Further rally should be seen to retest 0.6709 resistance next. Decisive break there will resume whole rally from 0.8913. Next target is 61.8% projection of 0.5913 to 0.6706 from 0.6420 at 0.6910. On the downside, below 0.6574 minor support will turn intraday bias neutral first.
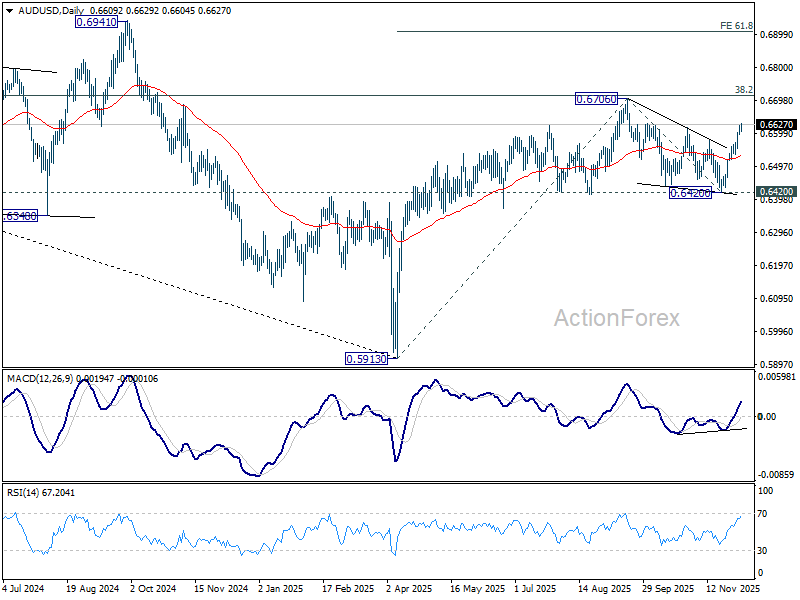
In the bigger picture, as long as 38.2% retracement of 0.8006 to 0.5913 at 0.6713 holds, outlook stay bearish and rebound from 0.5913 is treated as a correction to down trend from 0.8006 (2021 high). Break of 0.6420 support will suggest rejection by 0.6713 and solidify this bearish case. Nevertheless, considering bullish convergence condition in W MACD, sustained break of 0.6713 will be a strong sign of bullish trend reversal, and pave the way to 0.6941 structural resistance for confirmation.
USD/CAD Daily Outlook
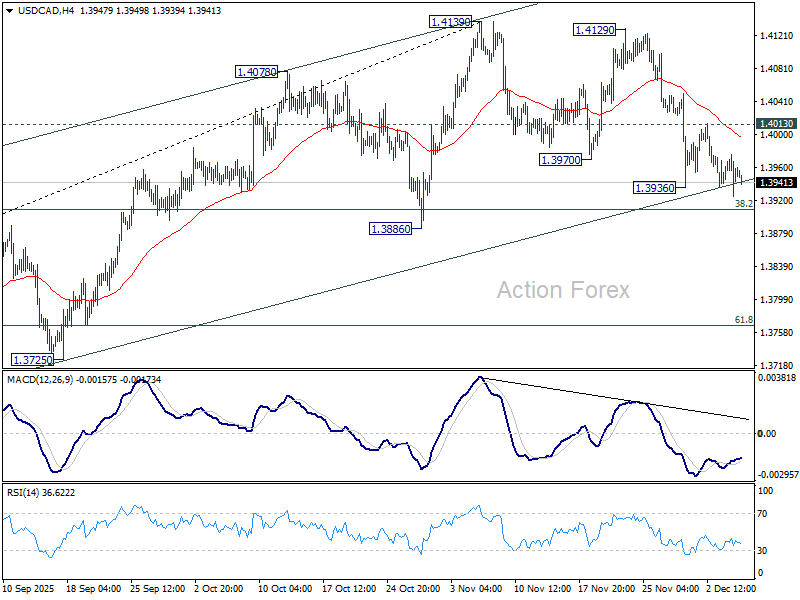
Daily Pivots: (S1) 1.3931; (P) 1.3954; (R1) 1.3982; More...
USD/CAD's fall from 1.4139 is resuming by breaking 1.3936 and intraday bias is back on the downside. Sustained trading below 38.2% retracement of 1.3538 to 1.4139 at 1.3909. Sustained break there will indicate that whole rise from 1.3538 has completed. Deeper fall should then be seen to 61.8% retracement at 1.3768 next. Risk will stay on the downside as long as 1.4013 resistance holds, in case of recovery.
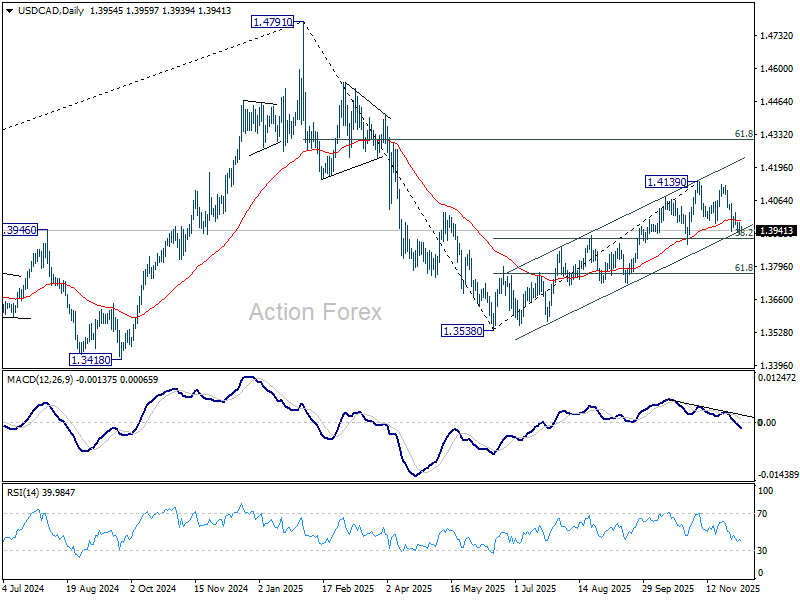
In the bigger picture, price actions from 1.4791 medium term top is likely just unfolding as a correction to up trend from 1.2005 (2021 low), with rise from 1.3538 as the second leg. A third leg should follow before up trend resumption. That is, range trading is set to extend for the medium term. For now, this will remain the favored case as long as 1.3886 support holds. However, firm break of 1.3886 will revive the case that fall from 1.4791 is indeed a larger scale correction.
Moore Thread’s 500% Surge
Looking at the S&P 500 flirting with all-time highs, and with US Q3 growth hugging the 4% mark, you’d barely think the US economy is slowing, jobs are being lost, and the Federal Reserve (Fed) is about to cut rates for a third time in a row. That’s how much the US tech sector and AI investments mask the ugly reality beneath the surface of the “Big, Beautiful” US economy — not even mentioning the ballooning US debt, racing toward the $40 trillion mark.
The US dollar is losing some of its global shine. The Chinese are trying to slow the yuan’s appreciation, while the Japanese are preparing for a rate hike this month despite the relentless rise in Japanese yields — now around 1.95% — which keeps threatening to pull Japanese capital back home.
The US 10-year yield is pushed higher by that repatriation risk even as Fed expectations soften. And if markets increasingly price in that the Bank of Japan’s (BoJ) December hike won’t be its last, the Fed’s December cut could land lightly, especially if paired with cautious guidance. Doves are counting on Trump and his future Fed picks to push rates lower come hell or high water, but if markets don’t buy the cuts, yields won’t fall far. And if investors conclude the US 10-year’s long-term “seat” is nearer 3% than 2%, the valuation impact could be meaningful. Tech stocks, for instance, could easily shed 20–30% on that single shift.
So, the hope is that the miserable labour data has a disinflationary impact on US consumer prices — despite tariffs — giving the Fed room to cut, and perhaps even revive QE next year. The US dollar this morning is testing a critical Fibonacci support; if it breaks, the dollar may roll back into this year’s weakening trend. A softer dollar lifts equity valuations because foreign revenues translate into more dollars. But that’s just an ephemeral layer of make-up for an economy that today relies less on consumer spending — once two-thirds of GDP — and more on AI investment, which is estimated to account for nearly half of this year’s GDP growth. And that’s not brilliant news.
Today’s PCE data will have little impact on expectations for next week’s Fed meeting. Both headline and core are expected to stick near 3%, but steady. Absent a shock, US equities likely finish the week on an upbeat note.
Tech appetite is running hot this morning after Moore Threads Technology surged near 500% on its Shanghai debut. Moore Threads is a young, ambitious company founded in 2020 by a former Nvidia executive, aiming to build a full-stack AI and graphics ecosystem from scratch: chips, cards, software, data-center hardware — everything. Its MUSA architecture targets workloads from gaming graphics to AI training and high-performance computing, with the goal of becoming China’s Nvidia. It has government backing and, judging from the IPO, plenty of investor enthusiasm as well. The rally could lift the Shanghai Composite today. As for Nvidia, will it react negatively — fearing another hit to its already shrinking China business — or positively, as a sign of red-hot AI appetite? We’ll see.
Elsewhere, crude oil is set to finish the week flat — curious, given there were several reasons to expect a rally. One: OPEC confirmed last Sunday it will pause its supply-restoration strategy for the first three months of next year to put a floor under prices. Two: the Trump administration softened its climate stance this week and approved the import of fuel-powered mini Japanese cars — apparently because Trump liked them — making them “safe enough” for US roads overnight. Three: US-Russia talks yielded no progress. But none of these policy or geopolitical factors managed to lure buyers back in. Other typically supportive drivers — a weaker dollar and softer Fed expectations that should boost growth bets — also failed to spark a rebound. WTI remains stuck below the 50-day moving average near $60pb, hugging the top of the August–November downtrend channel. The medium-term outlook remains timidly bearish.
Conversely, natural gas prices are rising on the back of broad global demand, on news that Europeans aim to reduce dependence on Russian gas sooner than planned amid dimming hopes for peace, and on the longer-term view that gas remains a politically and commercially viable “bridge fuel.” Even with Washington’s U-turn on renewables, LNG exports, domestic gas-to-power projects, and petrochemicals remain growth areas. Gas allows traditional energy companies to run a dual strategy: maintain cash flow from oil and gas while positioning — even modestly — for the energy transition. Rising gas prices are, in my view, what keep energy companies well-bid despite subdued oil prices. And while they may be “boring” compared with Big Tech, they will be providing the power needed to run an AI-driven world — and they offer dividends and buybacks that matter if inflation heats up.
Eyes on Final Q3 Euro Area GDP Data
In focus today
In the euro area, focus turns to wage growth and the final estimate of Q3 GDP. The data will give us the first full picture of wage developments in the third quarter, which are very important for the ECB outlook since services inflation, which is mainly determined by wages, is what currently keeps inflation from falling below target. The data on negotiated wages showed a very sharp decline in Q3 signaling that the compensation per employee, which in addition to negotiated wages includes wage drift, is also going to fall in Q3. The ECB staff projections estimated that compensation per employee would decline from 3.8% y/y in Q2 to 3.2% y/y in Q3. The final GDP data for Q3 is expected to confirm the two previous estimates of 0.2% q/q, so focus will instead be on the details, particularly private consumption and the savings ratio.
In the US, the September PCE data on both real private consumption and inflation is finally due for release after a lengthy shutdown-driven delay. December's flash consumer confidence index from the University of Michigan will also be released. Note that the November Jobs Report originally scheduled for today has been delayed until 16 December
In Sweden, Budget numbers for November are due at 08:00 CET. The Debt Office has pencilled in a SEK 12.1bn surplus (revised down from 18.1bn in the previous report).
Over the weekend, Japan publishes October wage data. Wages struggle to compensate for price increases with real wage growth still in negative territory. Real wage growth is the key remaining piece of the puzzle for Bank of Japan to confidently raise rates further. Largely all other factors are in place, though, and a December hike is also close to priced- in, in alignment with our expectations. Further hikes will largely hinge on improvement in wage data and the outlook for solid wage growth in 2026. We will also look for the revised national accounts for Q3.
Economic and market news
What happened overnight
In the US, senators introduced the SAFE CHIPS Act to block the Trump administration from relaxing restrictions on sales of advanced Nvidia and AMD AI chips to China, Russia, Iran, and North Korea for 2.5 years. The bipartisan bill, aimed at protecting national security, seeks to limit Beijing's access to cutting-edge AI technology and requires a congressional briefing before any changes to export controls can take effect.
What happened yesterday
In the US, the November Challenger report showed a sharp decline in layoff announcements to 71k (prev: 153k), with AI-related cuts accounting for 6.2k. Despite growing attention on AI, it has explained less than 5% of layoffs this year, with most linked to traditional factors. Hiring announcements dropped significantly to 9k (prev: 283k), partly due to seasonal effects, though the figure remains low even for November. Meanwhile, initial jobless claims fell to 191k, and continuing claims dropped to 1.94 million, which is very close to the average level seen since June, suggesting that actual layoffs remain low despite slowing headline job growth.
Meta plans to cut up to 30% of its metaverse budget as part of 2026 planning, which could involve layoffs starting next month. The decision follows over USD 60bn in costs since 2020 and reflects Meta's focus on artificial intelligence after recent setbacks in its AI initiatives.
In Sweden, November inflation surprised to the downside, with underlying inflation at 2.4% y/y and CPIF at 2.3% y/y. The decline was likely driven by larger-than-expected Black Friday price reductions, as the monthly drop was unusually large compared to the past decade. Details on inflation components, expected next week, will be key for assessing whether the decline is seasonal and temporary or more persistent.
In China, French President Emmanuel Macron met Xi Jinping to discuss trade, geopolitics, and the environment, while urging Beijing to help end the war in Ukraine. Despite signing cooperation agreements in areas like nuclear energy and population ageing, no major deals were sealed, including the expected Airbus order. Macron also raised concerns over rare-earth export restrictions and China's subsidised goods impacting European industry.
In India, Russian President Vladimir Putin began his first visit in four years, aiming to boost and diversify trade with Indian Prime Minister Narendra Modi. Both countries seek to raise bilateral trade to USD 100bn by 2030, with Russia looking to increase imports of Indian goods and India expanding exports of industrial goods, shrimp, tropical fruits, and machinery. The visit comes amidst US pressure on India to distance itself from Moscow due to the ongoing war in Ukraine.
Furthermore, the Reserve Bank of India cut its repo rate by 25 basis points to 5.25% and announced measures to boost liquidity by USD 16bn to support growth during a "goldilocks economy". The central bank raised its GDP forecast to 7.3% for 2025 while lowering its inflation projection to 2%, citing strong growth and rapid disinflation.
Equities: Equities extended gains yesterday in what can only be described as a classic, old-fashioned cyclical risk-on rotation. Defensives, min-vol, quality and large-cap all underperformed, with healthcare, consumer staples and utilities closing lower. On the other side of the ledger, industrials led the advance, yields moved higher across the curve, and value outperformed growth. While none of these correlations are unusual, in fact, they are textbook, but it has been a while since we have seen such a clean cross-asset rotation into cyclical risk. In the US yesterday, Dow -0.1%, S&P 500 +0.1%, Nasdaq +0.2% and Russell 2000 +0.8%. Asian trading is a mixed bag this morning: South Korea trades more than 1% higher, while Japan is down by more than 1%. Futures in both the US and Europe are higher this morning.
FI and FX: Global yields moved higher during yesterday's session with US yields rising 3-4bp in Treasury and swap space across the curve. European yields mirrored the move, but it was of less magnitude. EUR/USD took a breather during yesterday's session and edged closer to the 1.16 mark. Lower than expected inflation in Sweden provided support for EUR/SEK, which moved up towards the 11.00 mark.
EUR/CHF Daily Outlook
Daily Pivots: (S1) 0.9332; (P) 0.9347; (R1) 0.9373; More....
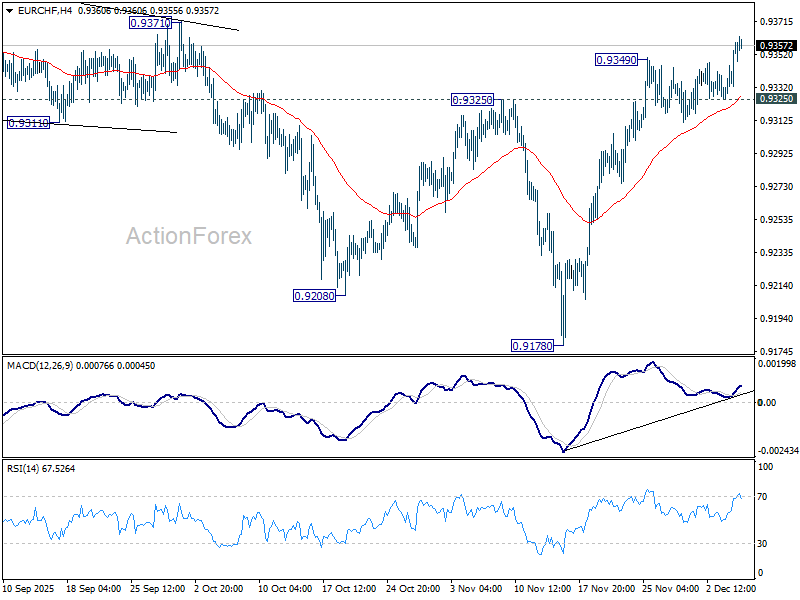
EUR/CHF's rise from 0.9178 resumed by breaking through 0.9349, and intraday bias is back on the upside. As noted before, fall from 0.9660 could have completed at 0.9178, on bullish convergence condition in D MACD. Further rise should be seen to 0.9452 resistance next. On the downside, below 0.9325 support will turn intraday bias neutral again first.
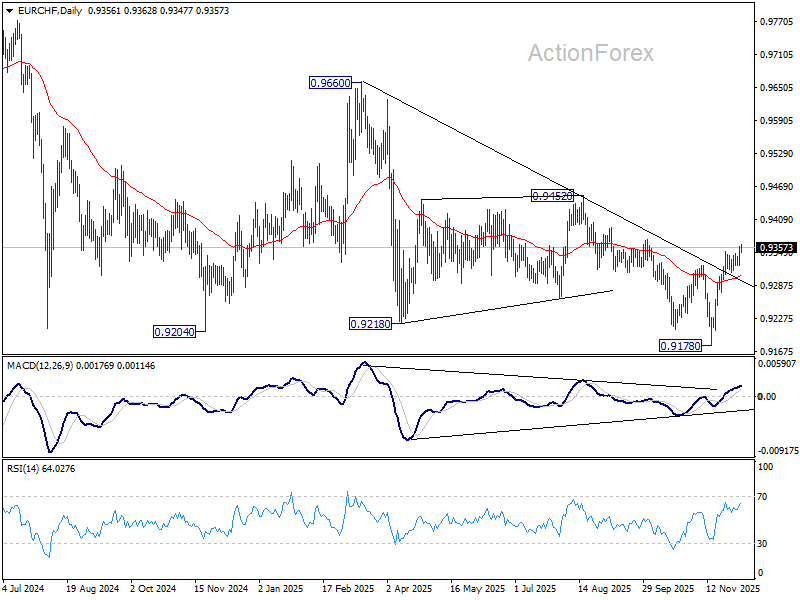
In the bigger picture, outlook remains bearish with EUR/CHF staying well inside long term falling channel after multiple rejection by 55 W EMA (now at 0.9371). Next target is 61.8% projection of 1.1149 to 0.9407 from 0.9928 at 0.8851. Break of 0.9452 resistance is needed to be the first sign of medium term bottoming. Otherwise, outlook will stay bearish in case of strong rebound.
EUR/GBP Daily Outlook
Daily Pivots: (S1) 0.8721; (P) 0.8738; (R1) 0.8753; More…
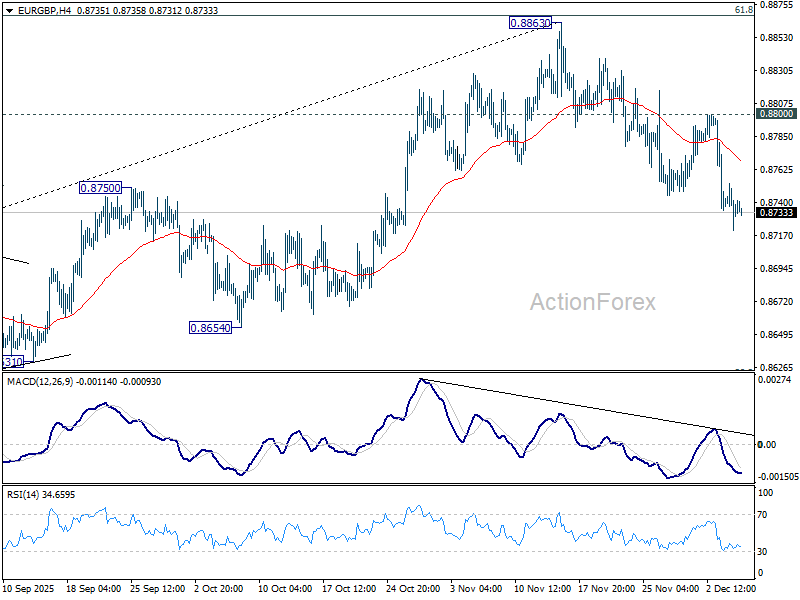
Intraday bias in EUR/GBP remains on the downside at this point. Break of 55 D EMA (now at 0.8745) indicates rejection by 0.8867 fibonacci level. Further fall should be seen to 0.8631 cluster (38.2% retracement of 0.8221 to 0.8663 at 0.8618). For now, risk will stay on the downside as long as 0.8800 resistance holds, in case of recovery.
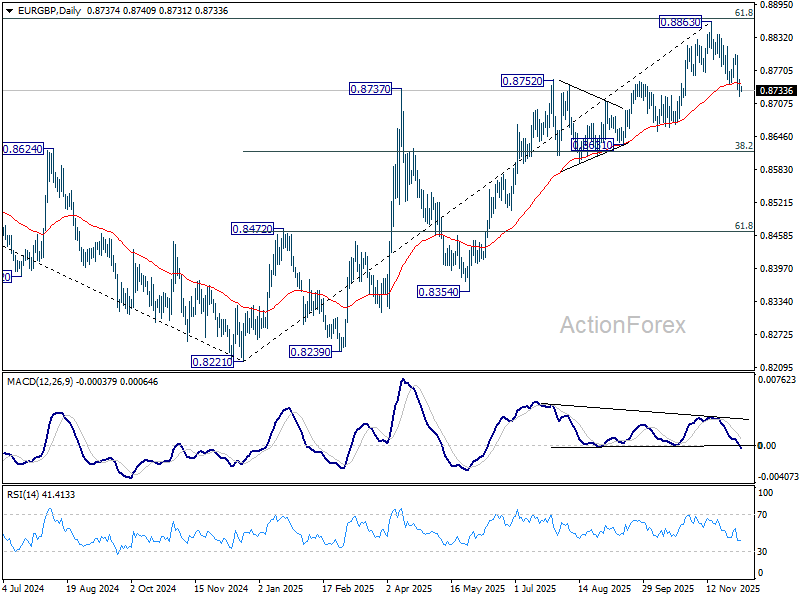
In the bigger picture, rise from 0.8221 medium term bottom is still seen as a corrective move. Upside should be limited by 61.8% retracement of 0.9267 to 0.8221 at 0.8867. Sustained trading below 55 W EMA (now at 0.8600) should confirm that this corrective bounce has completed. However, decisive break of 0.8867 will suggest that EUR/GBP is already reversing whole decline from 0.9267 (2022 high). That should pave the way back to 0.9267.
EUR/AUD Daily Outlook
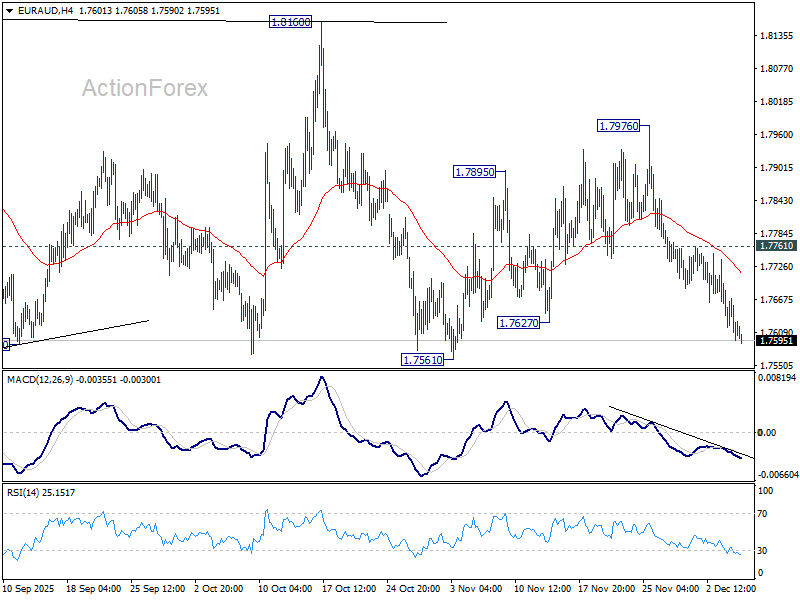
Daily Pivots: (S1) 1.7577; (P) 1.7643; (R1) 1.7681; More...
Intraday bias in EUR/AUD remains on the downside for 1.7561 support. Firm break there should confirm that larger corrective pattern from 1.8554 is already in the third leg. Deeper decline should then be seen to 1.7245 support next. For now, risk will stay on the downside as long as 1.7761 resistance holds, in case of recovery.
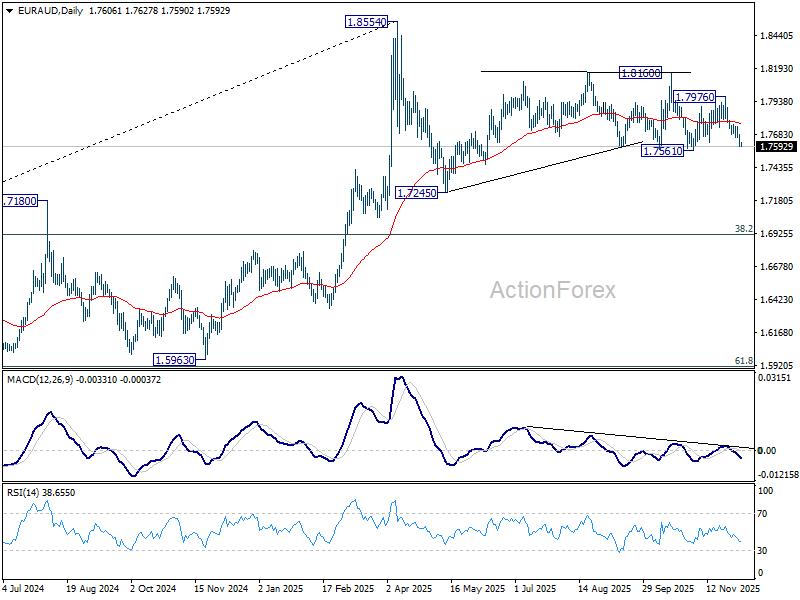
In the bigger picture, price actions from 1.8554 medium term top are seen as a corrective pattern. Sustained break of 55 W EMA (now at 1.7426) will suggest that it's correcting the whole rally from 1.4281 (2022 low). In this case, deeper decline would be seen to 38.2% retracement of 1.4281 to 1.8554 at 1.6922. Nevertheless, strong rebound from 55 W EMA will likely bring resumption of the up trend sooner.
GBP/JPY Daily Outlook
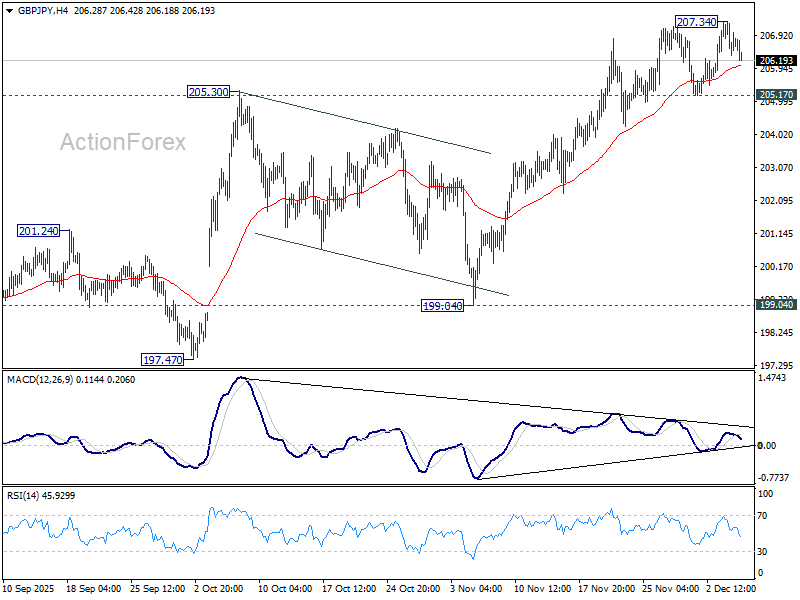
Daily Pivots: (S1) 206.26; (P) 206.81; (R1) 207.27; More...
GBP/JPY retreated after edging higher to 207.34 briefly, and intraday bias is turned neutral gain. Further rise is expected as long as 205.17 support holds. Above 207.34 will resume the rise from 184.35 to retest 208.09 high. However, break of 205.17 support will turn bias to the downside for deeper pullback, possibly to 55 D EMA (now at 203.22).
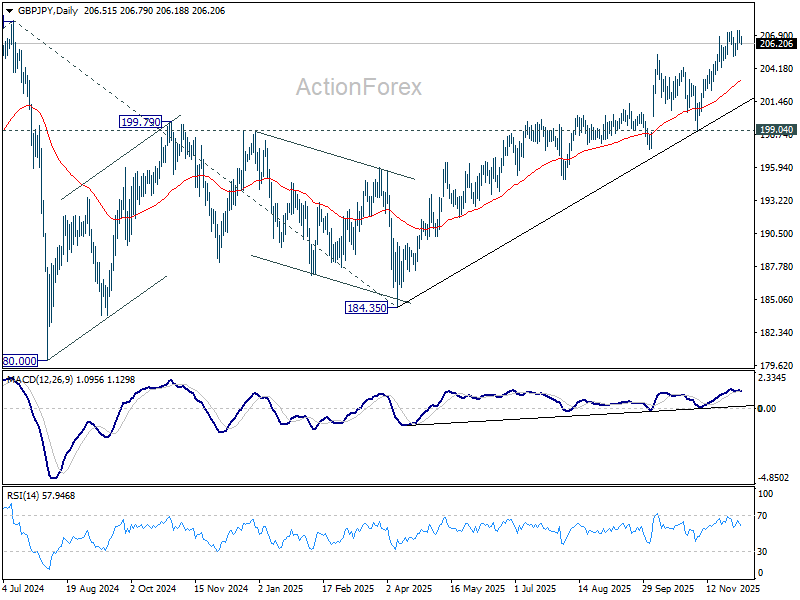
In the bigger picture, price actions from 208.09 (2024 high) are seen as a corrective pattern which might have completed at 184.35. Firm break of 208.09 high will resume the up trend from 123.94 (2020 low). Next target is 61.8% projection of 148.93 to 208.09 from 184.35 at 220.90. However, decisive break of 199.04 support will dampen this view and extend the corrective pattern with another fall.
EUR/JPY Daily Outlook
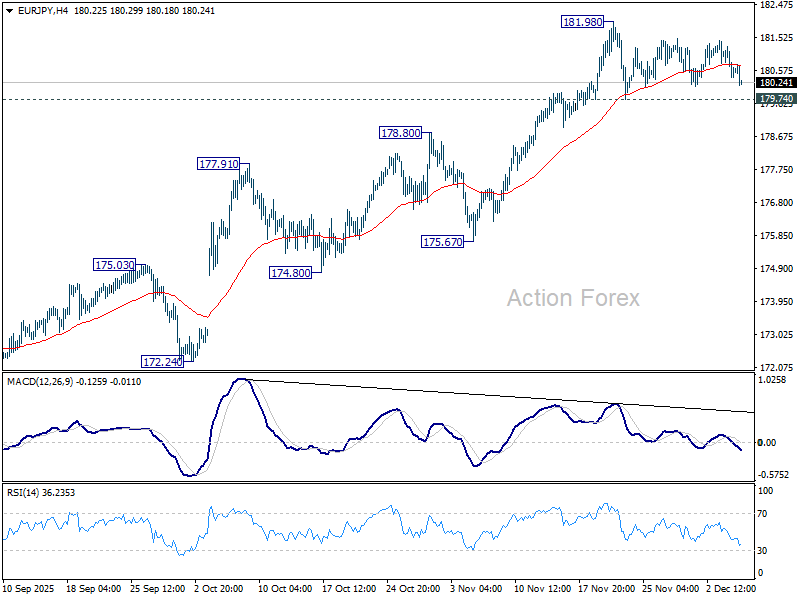
Daily Pivots: (S1) 180.24; (P) 180.77; (R1) 181.14; More...
EUR/JPY dips again today but stays above 179.74 support. Intraday bias remains neutral and another rally is still in favor. On the upside, break of 181.98 will target 100% projection of 161.06 to 173.87 from 171.09 at 183.90 next. However, firm break of 178.80 will argue that deeper correction is already underway towards 55 D EMA (now at 177.81).
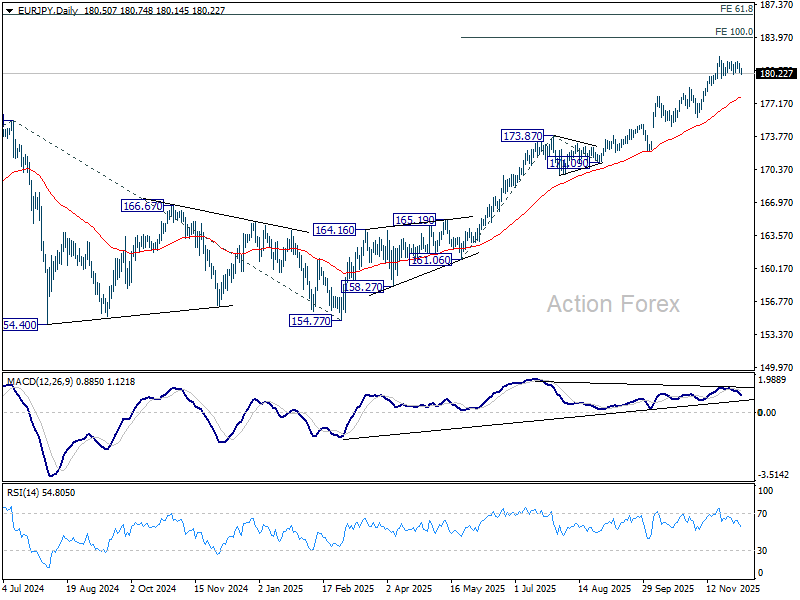
In the bigger picture, up trend from 114.42 (2020 low) is in progress and should target 61.8% projection of 124.37 to 175.41 from 154.77 at 186.31. However, considering bearish divergence condition in D MACD, upside should be capped by 186.31 on first attempt. Outlook will continue to stay bullish as long as 55 W EMA (now at 169.87) holds, even in case of deep pullback.
JGB Yields Climb, BoJ Hike Bets Rise, and Yen Risks Triggering Carry Unwind
Japan remains the center of attention in an otherwise quiet Asian session, with traders focused on the relentless climb in JGB yields. The 10-year benchmark surged to a fresh 18-year high today and appears poised to challenge the psychological 2% handle soon, an escalation that is increasingly difficult for global markets to ignore.
Much of the pressure stems from Prime Minister Sanae Takaichi’s JPY 18.3 trillion stimulus package, which has put the government on a collision course with investors concerned about fiscal sustainability. The scale of the planned spending, combined with a softening stance on fiscal consolidation, has amplified expectations for higher long-term borrowing costs.
Earlier this week, Japan’s Fiscal System Council retreated from its previous call for a rapid return to surplus, instead advising only an annual review of the primary balance. Markets interpreted the shift as clearing the runway for Takaichi to pursue more aggressive stimulus—reinforcing fears that Japan’s debt could steepen further.
Finance Minister Satsuki Katayama pushed back today, stressing that the supplementary budget was crafted with sustainability in mind and that fiscal responsibility will guide the FY2026 budget. But these assurances have done little to ease investor unease.
In parallel, markets have intensified bets on a December 19 BoJ rate hike to 0.75%, fuelled by recent comments from Governor Kazuo Ueda and signs of improved communication between the new cabinet and the central bank. Katayama noted positive engagement with Ueda since taking office, while emphasizing the BoJ’s operational independence—remarks seen as a subtle green light for further tightening.
The key question for traders now is whether soaring JGB yields and rising BoJ expectations will translate into a durable rebound in Yen. A meaningful JPY rally raises the risk of triggering the kind of carry-trade unwind seen last year, an unwind that briefly shook global risk assets and exposed vulnerabilities in leveraged positioning.
In the currency markets, Dollar remains pinned at the bottom of the weekly performance chart, with today’s US personal income, spending, PCE inflation, and consumer sentiment data unlikely to spark a sustained recovery. Swiss Franc and Loonie follow as the next weakest performers.
At the strong end, Aussie continues to lead as markets doubt whether the RBA has room to cut rates again next year. Yen follows in second place, while Sterling also benefits from improved domestic sentiment. Kiwi and Euro sit in the middle of the pack.
In Asia, Nikkei fell -1.22%. Hong Kong HSI is up 0.31% at the time of writing. China Shanghai SSE is up 0.71%. Singapore Strait Times is down -0.24%. Japan 10-year JGB yield rose 0.01 to 1.951. Overnight, DOW fell -0.07%. S&P 500 rose 0.11%. NASDAQ rose 0.22%. 10-year yield rose 0.051 to 4.108.
Japan household spending slumps -3.0% yoy in October, casting doubt over strength of recovery
Japan’s household spending fell sharply by -3.0% yoy in October, far below expectations for 1.1% yoy increase, and marking the steepest decline since January 2024. It was also the first annual drop in six months.
On a monthly, seasonally adjusted basis, spending plunged -3.5% mom, defying forecasts of a 0.7% mom growth. Lower outlays on food, leisure and automobile-related expenses drove the weakness, though officials said it remains unclear whether the decline represents a one-off setback, noting consumption is still perceived to be in a recovery phase.
The data arrive at a delicate moment for the BoJ. Markets have ramped up bets on a rate hike this month following recent comments from Governor Kazuo Ueda that the Bank would weigh the “pros and cons” of further tightening. The slump in spending, however, introduces fresh uncertainty around the durability of domestic demand—one of the BoJ’s key criteria for normalizing policy continuously.
EUR/JPY Daily Outlook
Daily Pivots: (S1) 180.24; (P) 180.77; (R1) 181.14; More...
EUR/JPY dips again today but stays above 179.74 support. Intraday bias remains neutral and another rally is still in favor. On the upside, break of 181.98 will target 100% projection of 161.06 to 173.87 from 171.09 at 183.90 next. However, firm break of 178.80 will argue that deeper correction is already underway towards 55 D EMA (now at 177.81).
In the bigger picture, up trend from 114.42 (2020 low) is in progress and should target 61.8% projection of 124.37 to 175.41 from 154.77 at 186.31. However, considering bearish divergence condition in D MACD, upside should be capped by 186.31 on first attempt. Outlook will continue to stay bullish as long as 55 W EMA (now at 169.87) holds, even in case of deep pullback.