Sample Category Title
US jobless claims fall sharply to 191k, lowest since 2022
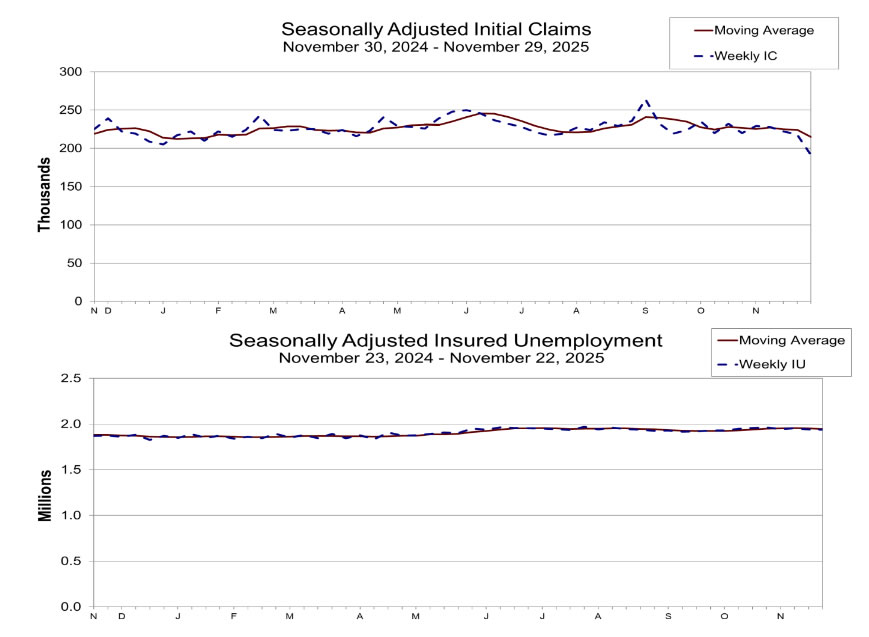
US initial jobless claims fell sharply by -27k to 191k in the week ending November 29, far below expectations of 220k, and marking the lowest level since September 2022. The four-week moving average also by -9k eased to 215k.
Continuing claims slipped modestly by -4k to 1.939 million in the week ending November 22. Their four-week average edging down by -6k to 1.945 million, indicating some stabilization after earlier signs of softening.
The data stand in contrast to the recent deterioration seen in other labor indicators, including the weak ADP report, and highlight ongoing tightness in the job market despite clear signs of cooling elsewhere.
EUR/USD Pair Reaches 1.5-Month High
This morning, the EUR/USD rate moved above 1.1680 during early trading — its highest level since mid-October. The main driver behind the rise is traders’ assessment of the diverging policies of central banks. Based on the fundamental outlook ahead of the December meetings:
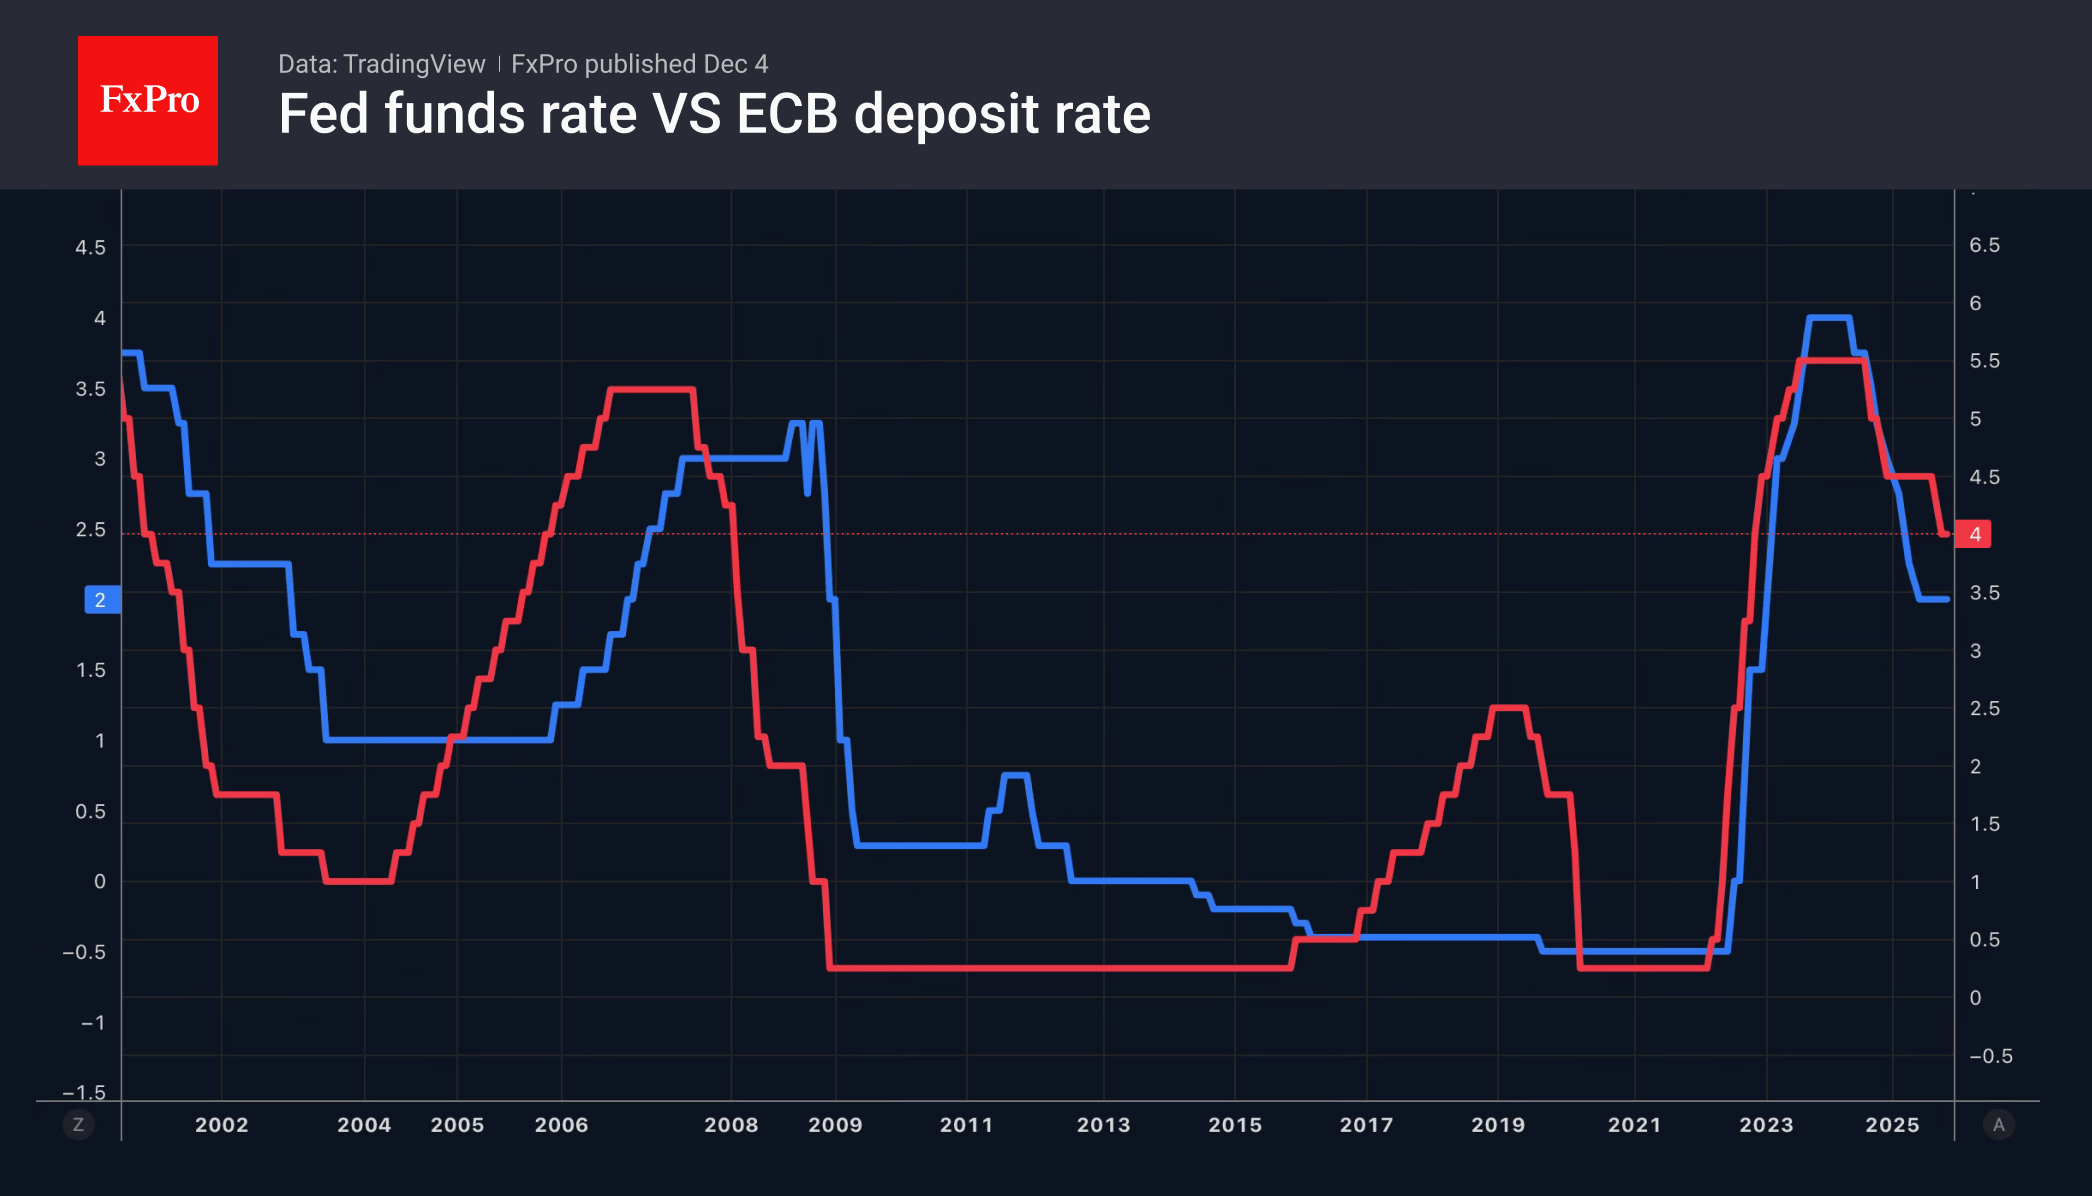
→ The market is almost certain that the Federal Reserve will cut rates in December under pressure from the Trump administration, making the dollar appear less profitable and less attractive.
→ The ECB, by contrast, has adopted a wait-and-see stance. Inflation in the Eurozone is close to target, and there seems to be no intention to cut rates aggressively for now.
Technical Analysis of the EUR/USD Chart
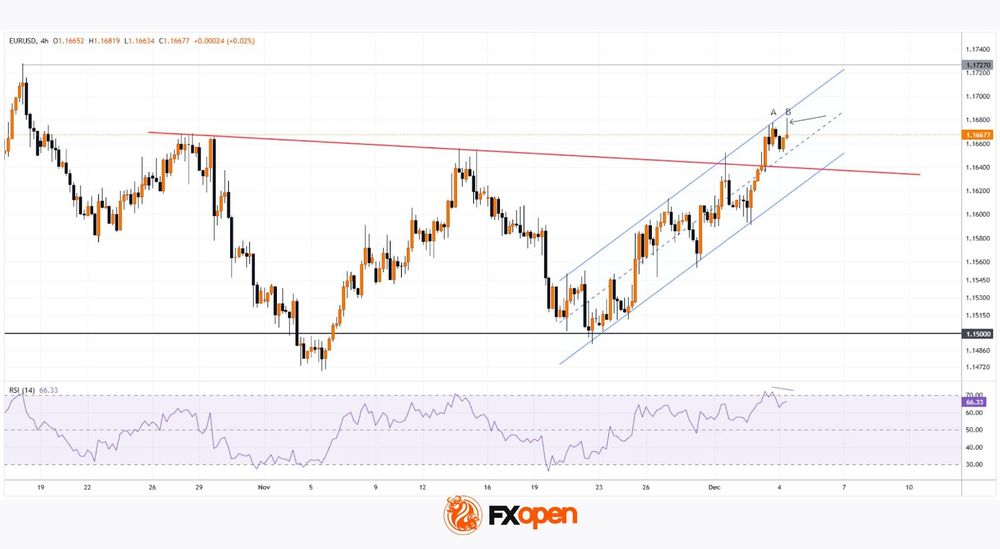
In November, the pair formed a broad balance zone:
→ The 1.1500 level acted as support — the price dipped below it twice, but failed to hold beneath this psychological mark.
→ A downward sloping trendline (shown in red) served as resistance.
At the start of December, we see that price growth within the blue ascending channel has led to a bullish breakout above the red resistance line.
However, the chart suggests that the rally may now be losing momentum, because:
→ As the arrow indicates, this morning’s attempt to surpass yesterday’s high may result in a candle with a long upper wick.
→ RSI conditions point to a possible bearish divergence between price highs A and B.
It is possible that the EUR/USD rise to a 1.5-month high could attract sellers — therefore, forex traders should not rule out a pullback towards the lower boundary of the blue channel. A retest from above of the red line is also possible.
Trade over 50 forex markets 24 hours a day with FXOpen. Take advantage of low commissions, deep liquidity, and spreads from 0.0 pips. Open your FXOpen account now or learn more about trading forex with FXOpen.
This article represents the opinion of the Companies operating under the FXOpen brand only. It is not to be construed as an offer, solicitation, or recommendation with respect to products and services provided by the Companies operating under the FXOpen brand, nor is it to be considered financial advice.
Euro Gaining Momentum
- Inflation and the US labour market are slowing down, while the chances of a rate cut are increasing.
- The US dollar is vulnerable, while the euro is being helped by business activity.
The US dollar had its worst series of daily declines since 2020, mainly due to the increased likelihood of an interest rate cut by the Fed and the improved positions of its main competitors. The pound is rising as fears about the budget have been allayed. The yen and the Australian dollar are awaiting interest rate hikes by their respective central banks. The euro is rising due to improved trade conditions, falling energy prices and hopes for peace in Eastern Europe. The USD index is further weakened by demand for hedging in anticipation of the Christmas rally in US stock indices.
A decline in private sector employment by 32K in November, according to ADP, and a fall in the price component of the PMI in the services sector to a 7-month low have strengthened the position of speculators betting on a decline in December. Doves at the Fed believe it is better to play it safe and ease policy to prevent an uncontrolled surge in unemployment. Hawks complain that lowering rates will accelerate inflation, which is already gaining momentum.
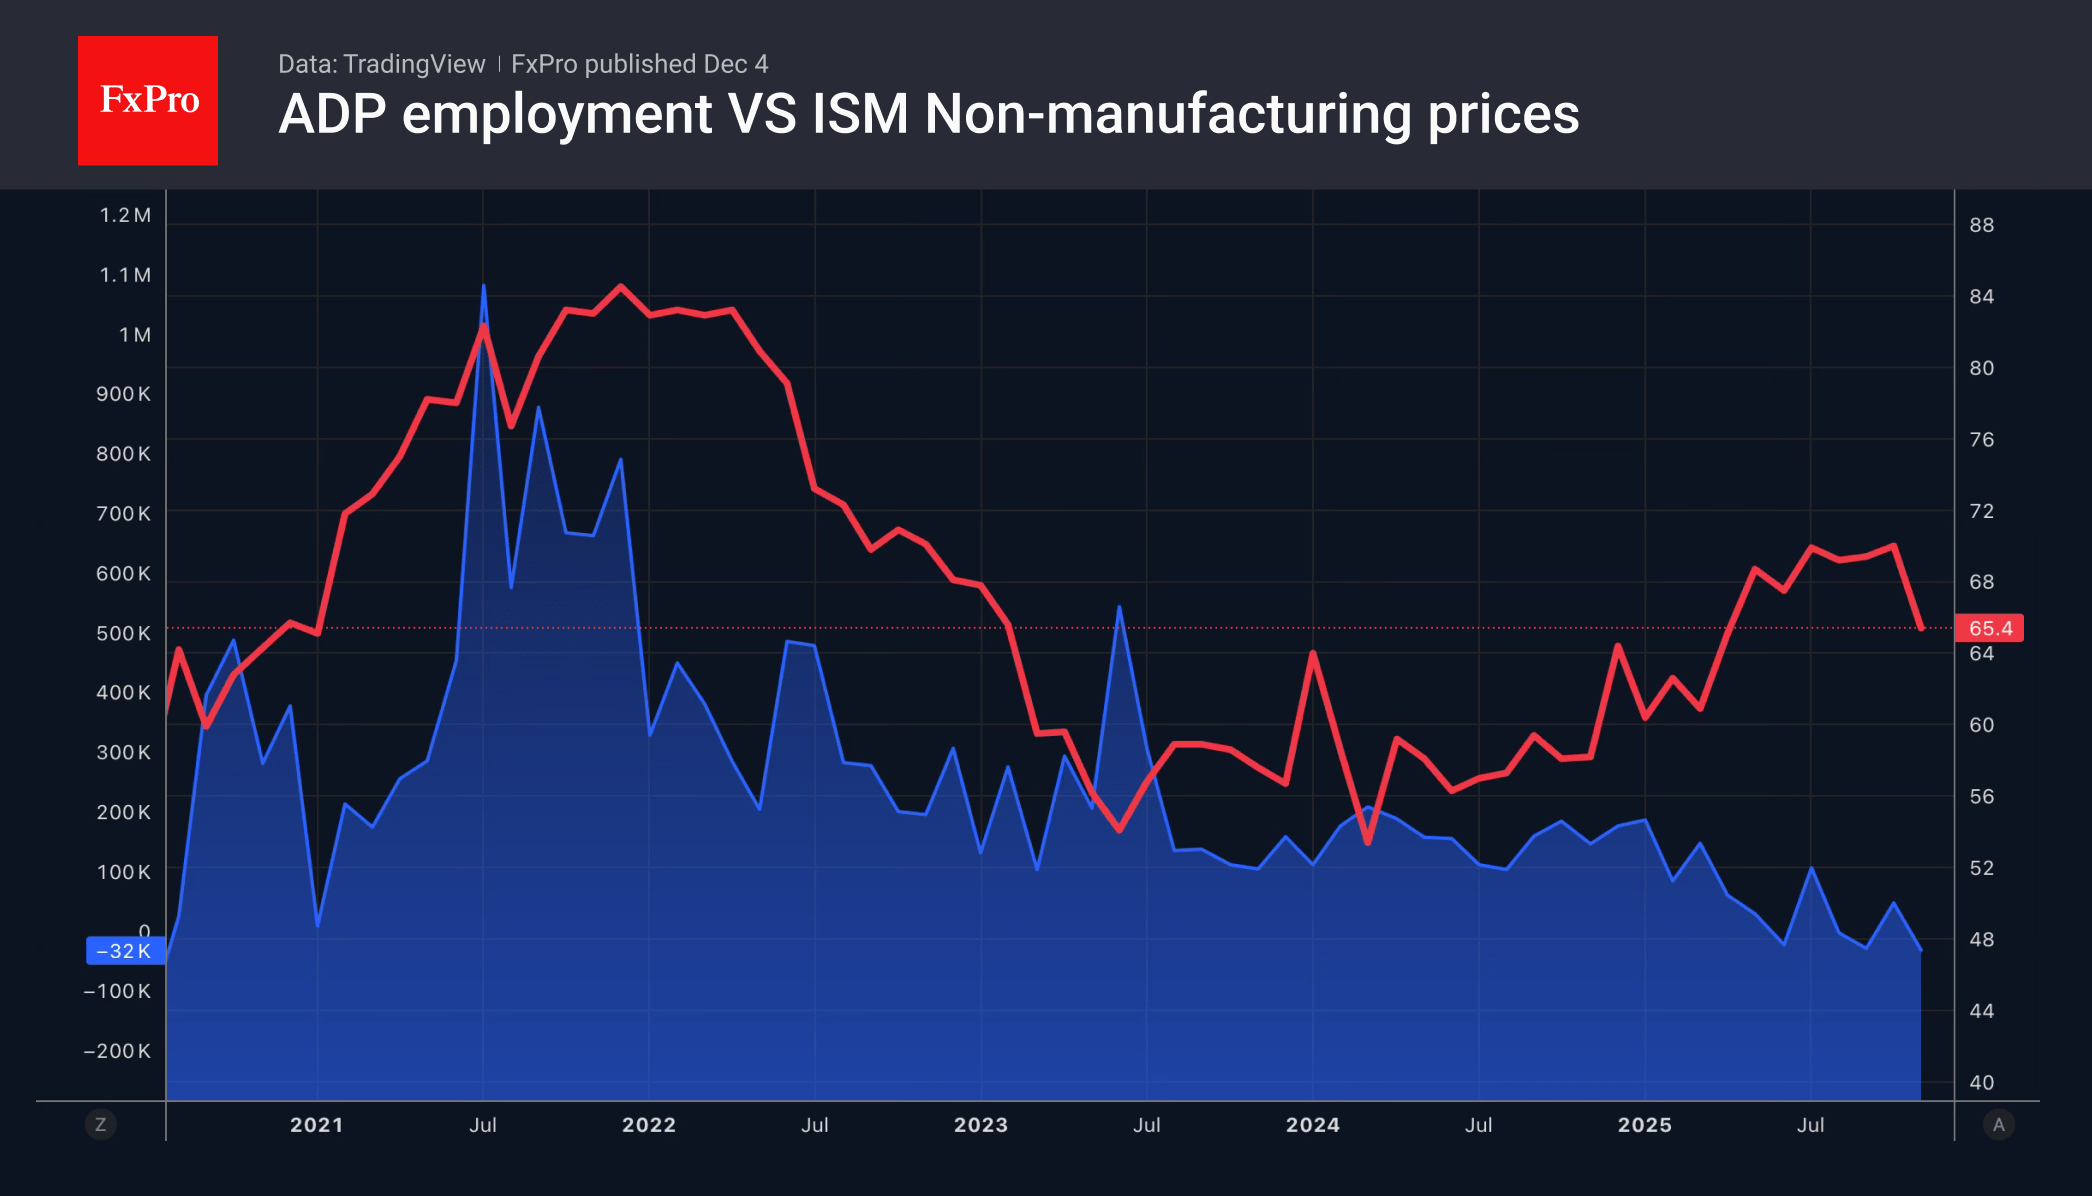
The arguments of the first group of FOMC officials seem more convincing, which is why the futures market assigns a 89% probability of a 25-point cut on December 10th and approximately a 50% chance of a 100-point cut within a year. Since no further reductions are expected from the ECB in the coming year, the market is re-evaluating in favour of EURUSD growth.
Moreover, even without divergence in monetary policy, the US dollar has many vulnerabilities. The potential repeal of tariffs by the Supreme Court, the twin deficits in the budget and trade balance, and faster economic growth outside the US are all factors in favour of a further decline in the USD index.
The euro, on the contrary, draws strength from the remarkable stability of the eurozone. In November, the composite business activity index rose to its highest level in 2.5 years, adding to its sixth consecutive month of growth. Its positive dynamics give hope for a reduction in the economic growth divergence with the US. Along with the divergence in monetary policy between the ECB and the Fed, the economy is driving the upward trend in EURUSD.
Crypto Market Regained Another 1% Without Much Resistance
Market Overview
Over the past 24 hours, the crypto market regained another 1% of its cap, rising to an estimated $3.2 trillion and continuing the recovery trend that began almost two weeks ago after seven weeks of selloffs. Among the key altcoins, Ethereum stands out with a 4% growth rate, while Zcash experiences twice as strong growth. XRP is among the laggards at the top, with a 1% loss, and Sui has a 5% drop.
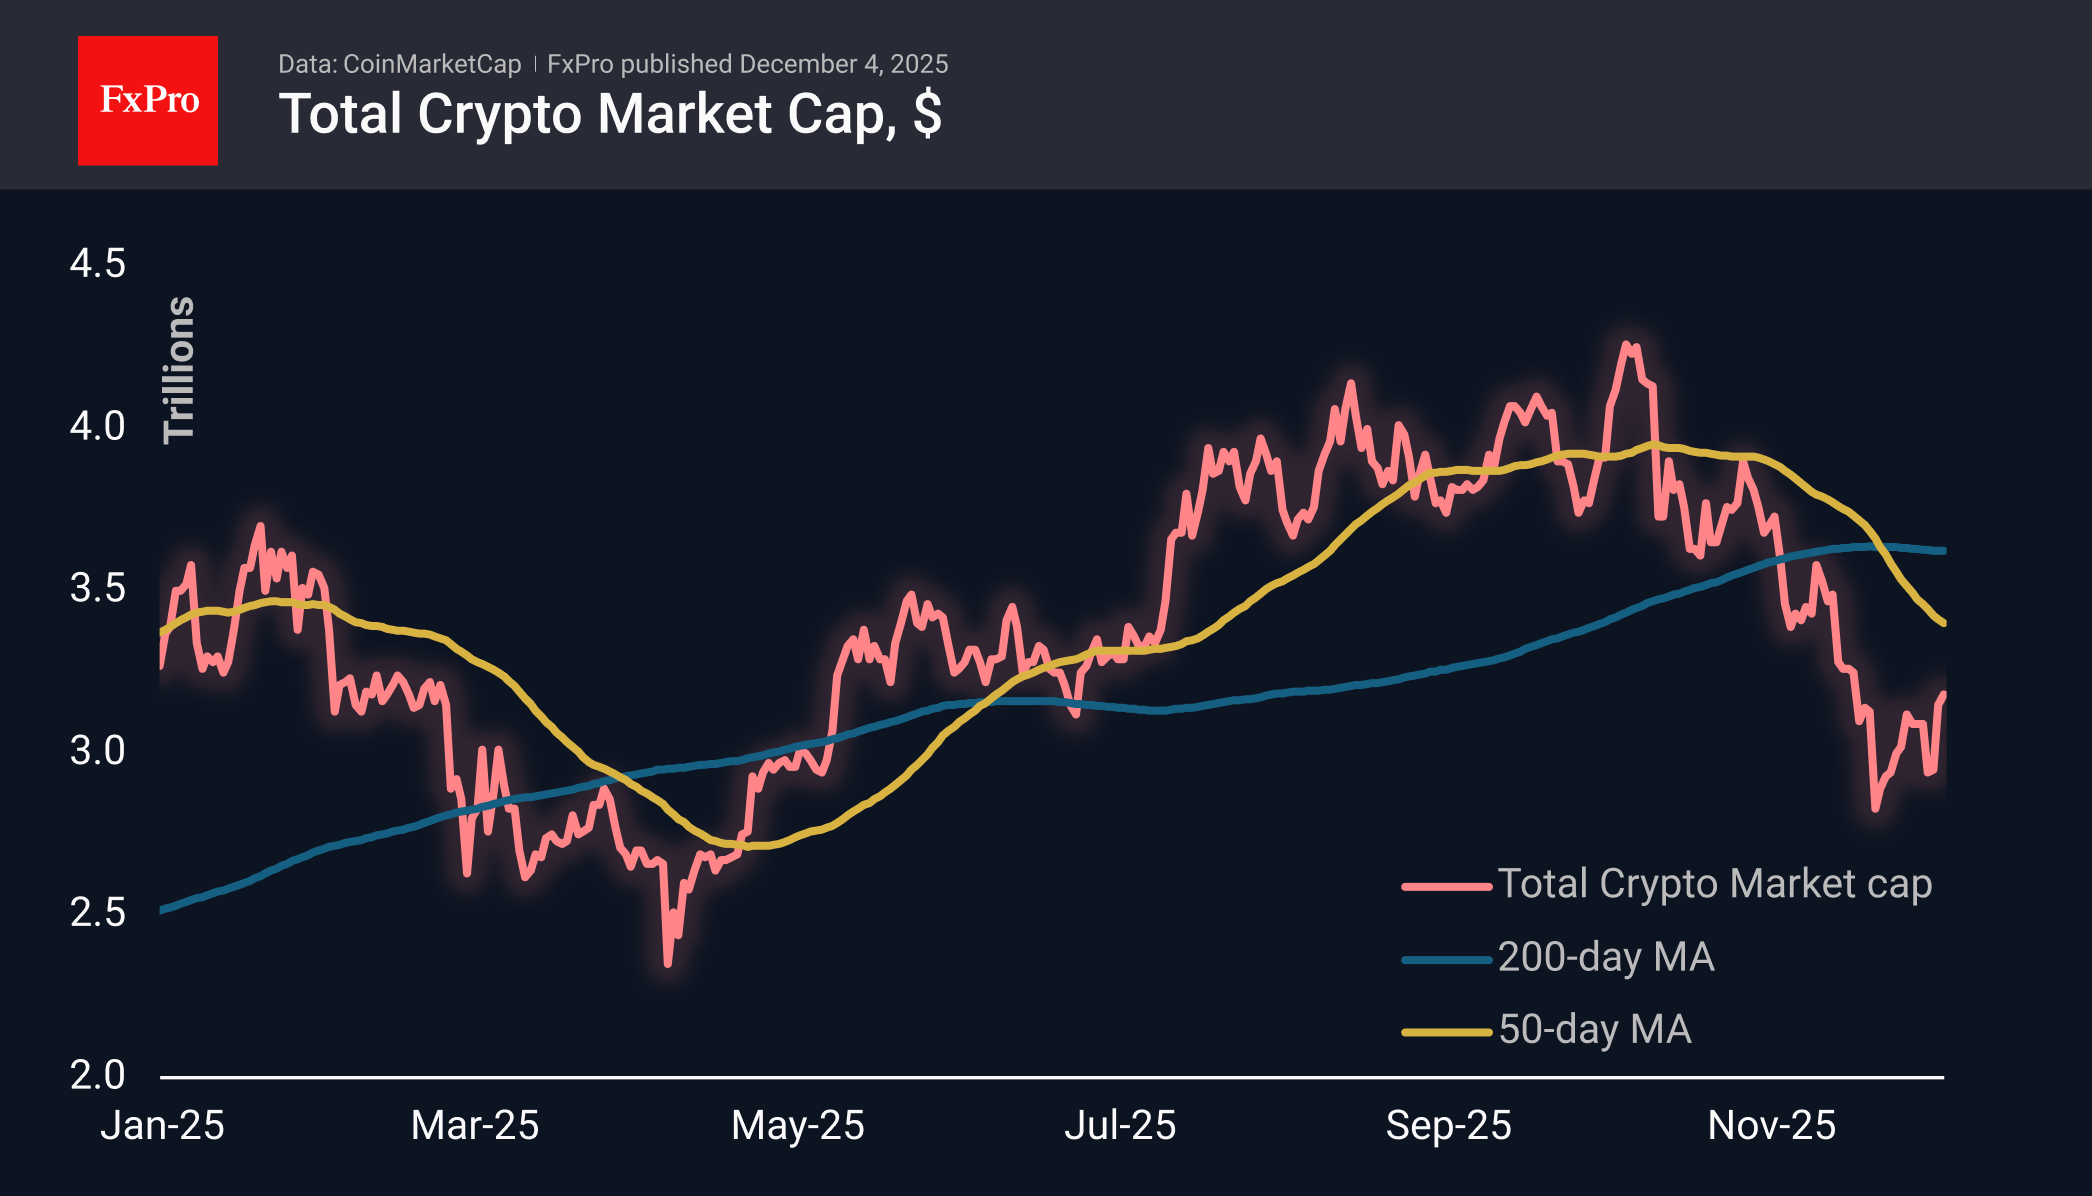
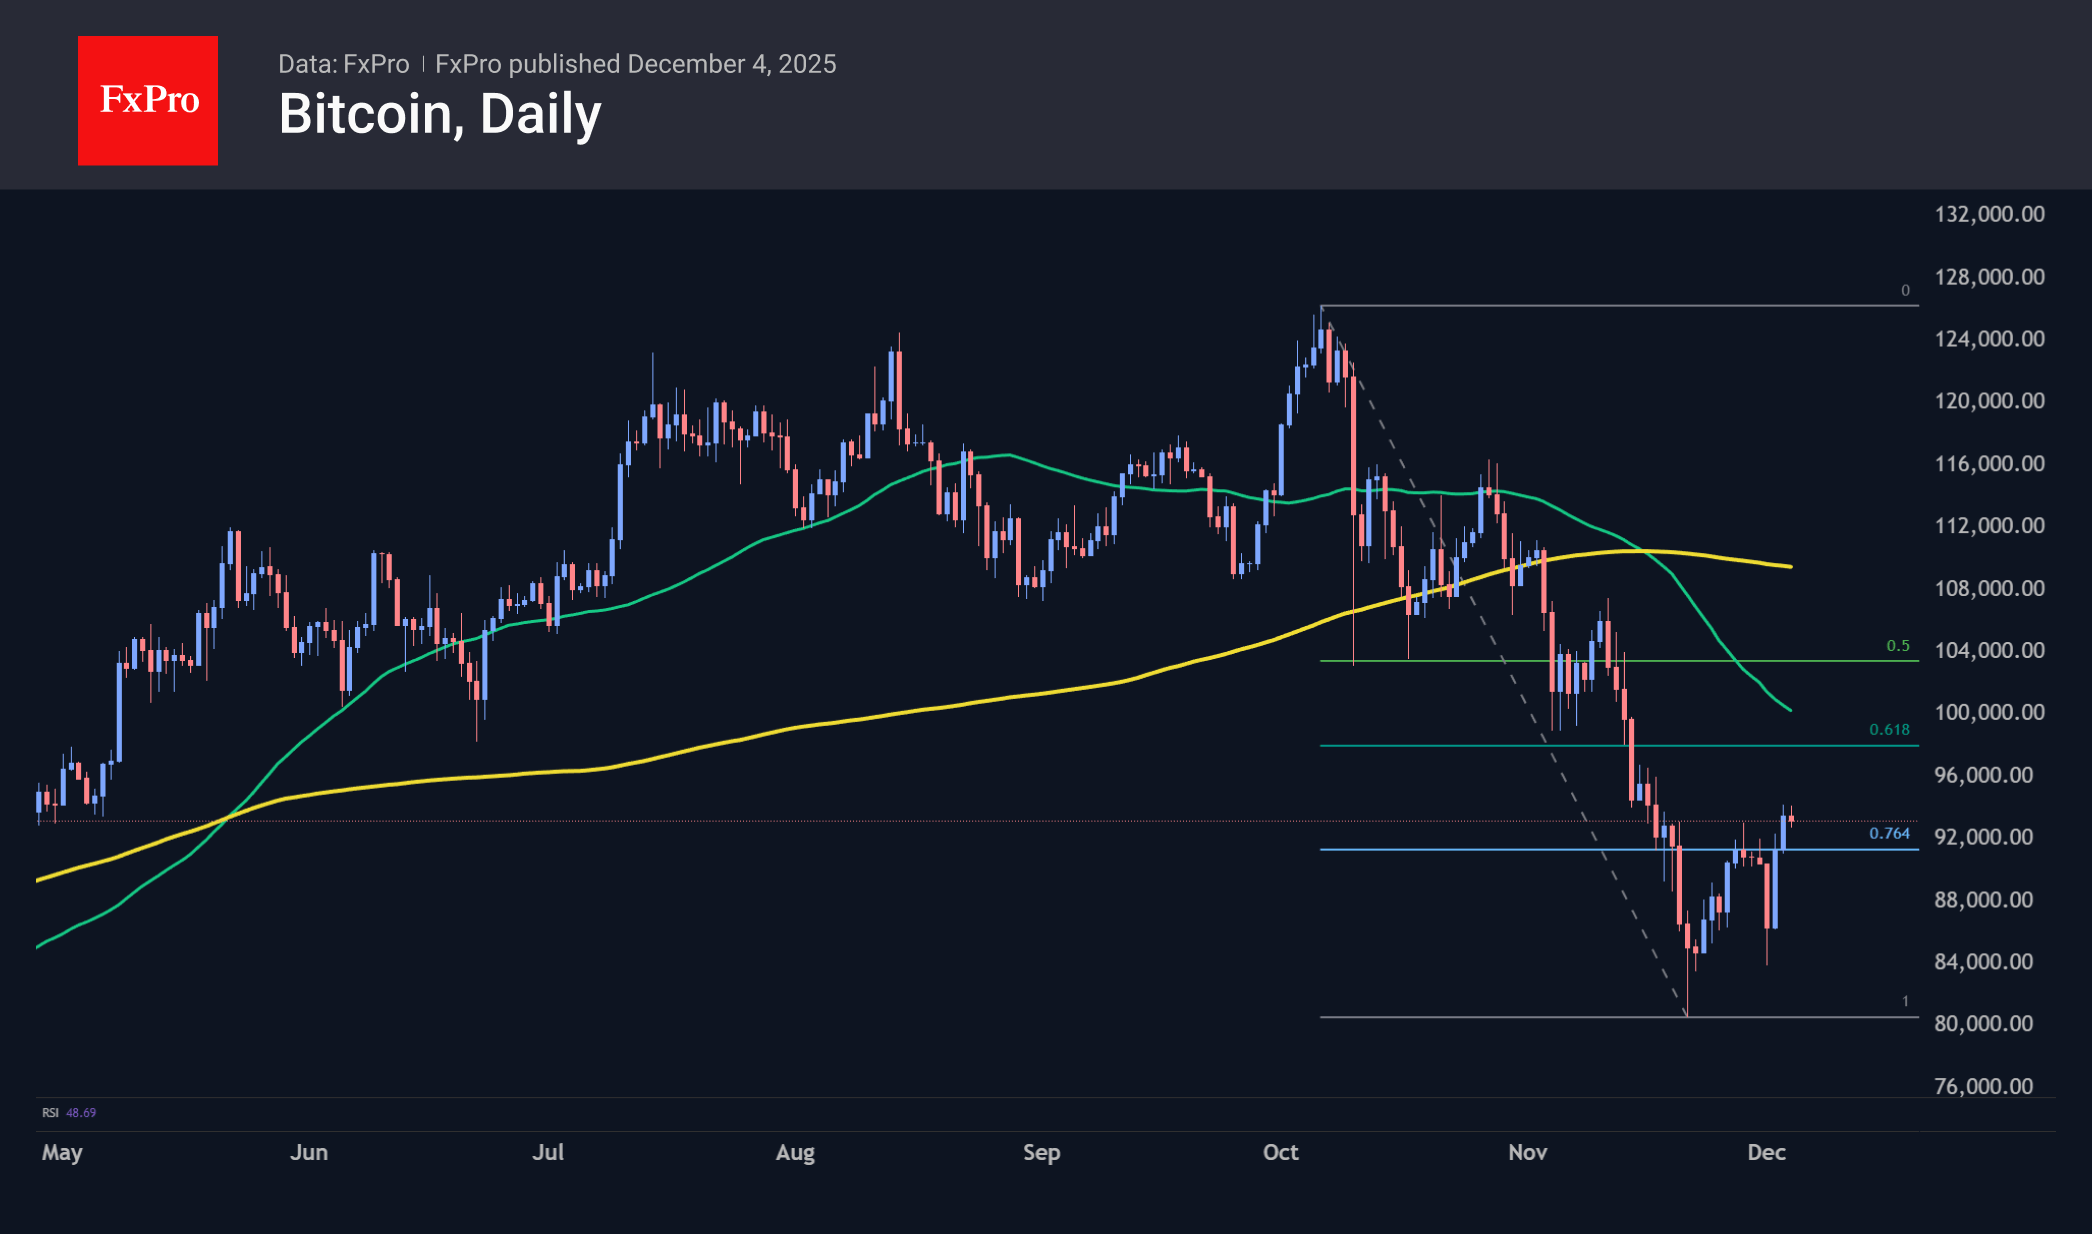
Bitcoin tested the $94K mark at the start of the day. It remains below this figure for now, but the resistance from bears is not yet too aggressive. It is likely that even for bears, the current levels are not attractive for a new downward move. We expect rather sluggish resistance up to the $98-100K area. However, the outcome of the further struggle will be indicative, answering the question of whether crypto winter has arrived or not.
News Background
The ratio of market purchases and sales of the first cryptocurrency on exchanges has risen to 1.17, the highest level since January 2023, according to CoinCare analyst. The indicator tracks the balance of aggressive orders in the perpetual futures market.
The boom in companies with digital assets on their balance sheets (DAT) has come to an end, according to Bitwise. The demand for Ethereum from corporate treasuries declined by 81% between August and November.
Community members estimate the probability of a ‘crypto winter’ at only 7%, according to data from the Myriad prediction platform. Until recently, the indicator reached 30%.
The Chicago Mercantile Exchange (CME) has launched an analogue of the VIX volatility index for Bitcoin. The tool will track the implied volatility of bitcoin futures options, showing traders’ expectations for price fluctuations over the next 30 days. Benchmarks for Ethereum, Solana and XRP will also be launched.
According to Arkham Intelligence, the Ethereum blockchain set a record by processing 32,950 transactions per second (TPS). The figure broke last week’s record of 31,000 TPS, achieved through the integration of the second-layer solution Lighter.
Eurozone retail sales stall in October as non-food demand softens
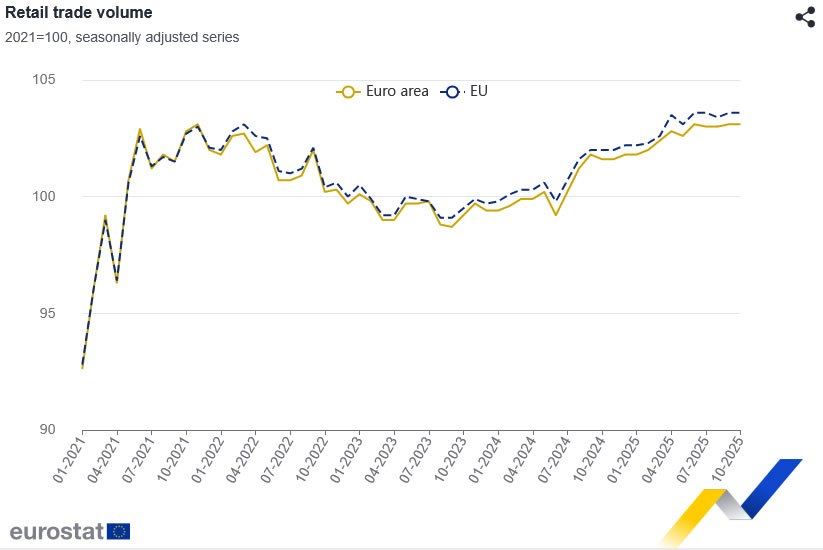
Eurozone retail sales were unchanged on the month in October, matching expectations and highlighting a subdued consumer environment heading into year-end. Category-level data showed mixed trends: spending on food, drinks and tobacco rose 0.3% mom, while non-food products (excluding fuel) fell -0.2% mom. Automotive fuel sales increased 0.3% mom, helping offset weakness elsewhere but not enough to lift the overall index.
Retail activity across the wider EU was also flat on the month, reinforcing the picture of stagnation in household consumption. The divergence among member states remained notable. Luxembourg posted the strongest monthly gain at 3.6% mom, followed by Estonia (1.7%) and Croatia (1.4). In contrast, Belgium saw a sharp -1.3% drop, with Austria (-0.6%), Ireland (-0.4%) and Sweden (-0.4%) also reporting declines.
Natural Gas Price Nears Three-Year High in Early December
In mid-November, analysing the XNG/USD chart, we noted a rise in natural gas prices, outlined a system of trend channels, and suggested a possible pullback scenario.
Indeed, since then (as indicated by the arrow), U.S. gas prices retreated to the lower boundary of the orange ascending channel, forming a low at point B. From late November, renewed buying activity has been observed, driven by:
→ Seasonal factor: U.S. forecasts for December indicate below-average temperatures, sharply increasing demand for heating and electricity.
→ Export and geopolitics: The U.S. is exporting record volumes of liquefied natural gas (LNG). Europe continues to purchase U.S. gas to replace Russian supplies, while demand in Asia is also rising.
→ Anticipation of shortages: Due to high exports and early cold weather, traders are factoring in the risk that storage levels may deplete faster than usual.
Technical Analysis of XNG/USD
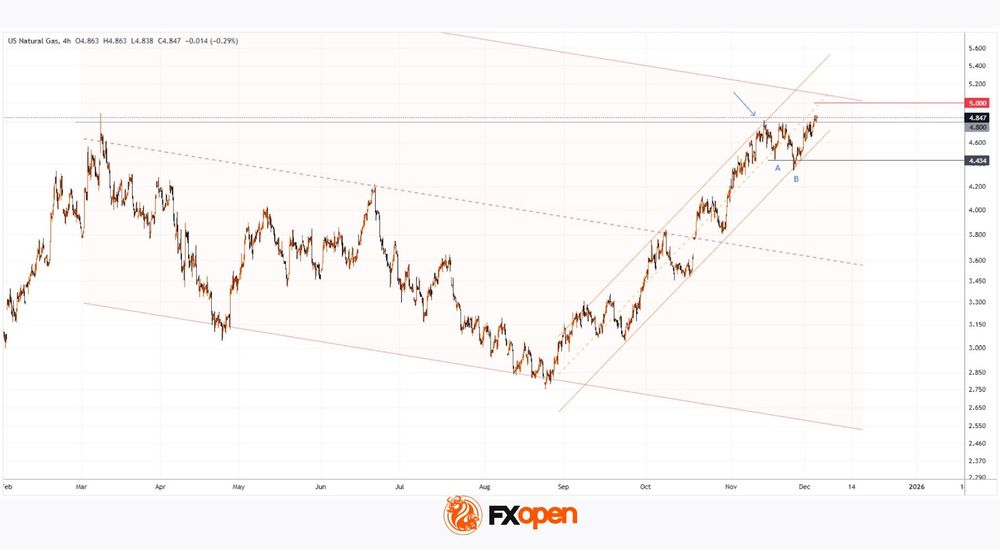
Price is currently near a resistance zone formed by:
→ The upper boundary of a broad descending channel, extended following a bullish breakout in late October.
→ The $4.800/MMBtu level, near which a peak formed in March.
→ The psychological $5.000/MMBtu mark.
At the same time, price action indicates bulls remain in control:
→ The lower boundary of the orange channel acts as support.
→ Low B resembles a false bearish breakout of low A, trapping short sellers who expected a breakdown.
→ Long lower wicks at low B indicate strong buying pressure.
Given this, it is reasonable to suggest that if U.S. gas prices failed to hold above $4.800/MMBtu in mid-November, December could prove more favourable for bulls, potentially establishing a three-year high.
Start trading commodity CFDs with tight spreads. Open your trading account now or learn more about trading commodity CFDs with FXOpen.
This article represents the opinion of the Companies operating under the FXOpen brand only. It is not to be construed as an offer, solicitation, or recommendation with respect to products and services provided by the Companies operating under the FXOpen brand, nor is it to be considered financial advice.
GBP/USD Extends Gains as Interest Rate Divergence Captures Focus
The GBP/USD pair advanced decisively to 1.3338, marking its highest level since late October. Sterling found support from an upward revision of the UK's November Services PMI, while the US dollar remained under broad pressure ahead of an anticipated Federal Reserve rate cut next week.
The UK Services PMI rose to 51.3 from a preliminary 50.5, remaining firmly in expansionary territory above the 50.0 threshold. The Composite PMI followed suit, climbing to 51.2.
Despite this improvement, S&P Global noted underlying softness, with business activity growth slowing and employment declining at the fastest pace since February. Furthermore, output price inflation fell to its lowest level since January 2021.
Markets continue to price in a 25-basis-point rate cut from the Bank of England in December. However, expectations are that the central bank will then enter a prolonged pause, wary of the persistent risk of renewed inflation.
Conversely, the US dollar remains on the back foot. Markets have fully priced in a third consecutive Fed rate cut for December, with at least two additional cuts anticipated in 2026. This widening interest rate differential is enhancing the pound's relative appeal.
Technical Analysis: GBP/USD
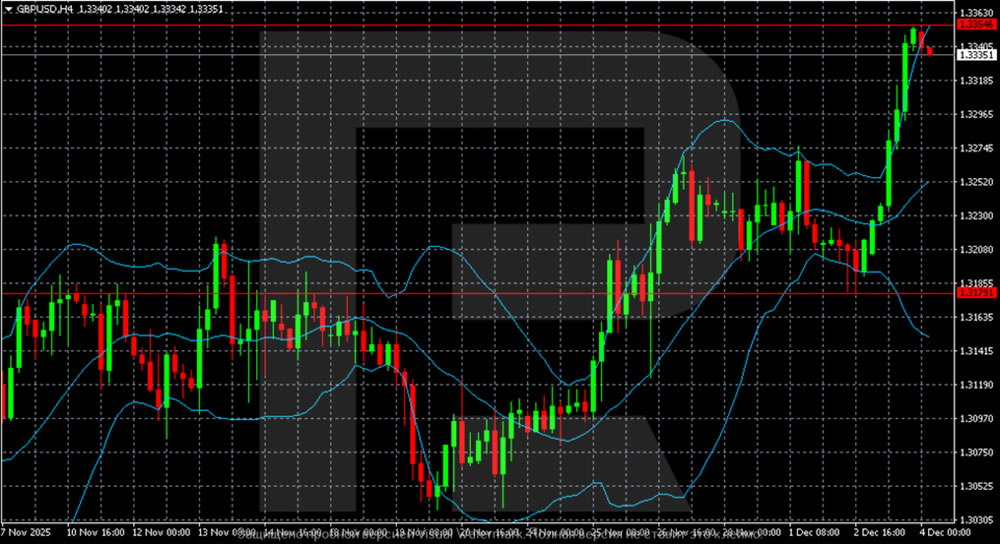
H4 Chart:
On the H4 chart, GBP/USD continues its confident upward trajectory, approaching a key technical resistance level at 1.3354. The price is holding well above the middle Bollinger Band, confirming the dominance of the bullish trend. The expansion of the upper band signals rising volatility and sustained buying interest.
A decisive breakout and close above 1.3354 would open the path for an extension of the rally towards the next resistance zone around 1.3363–1.3380. Should a pullback occur, the nearest significant support is situated at 1.3280. A breach of this level would suggest a deeper correction, potentially targeting the lower Bollinger Band.
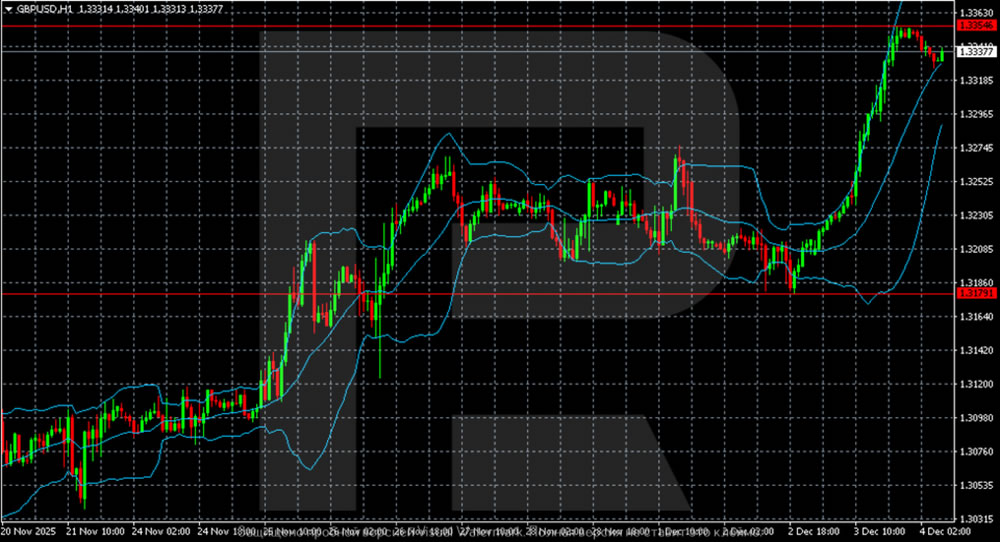
H1 Chart:
On the H1 chart, GBPUSD maintains an upward bias following a powerful impulse that pushed the price to the 1.3350–1.3360 resistance zone. The pair is now correcting, remaining above the local support of 1.3179, from which the growth began earlier. The upper Bollinger Band has turned down after a sharp expansion, indicating short-term market overheating and increasing the likelihood of a pullback. Nevertheless, the structure remains bullish: holding the price above the middle Bollinger Band supports a retest of 1.3350.
A breakout of the 1.3350–1.3360 resistance will open the way to the next target in the 1.3400 area. A consolidation below 1.3179 will be the first signal for a deeper correction, with targets in the 1.3120-1.3140 demand area.
Conclusion
GBP/USD strength is driven by a clear divergence in central bank policy expectations, favouring sterling in the near term. Technically, the pair is in a firm uptrend but is testing a critical resistance level at 1.3354. A successful breakout here could accelerate gains, while a rejection may trigger a consolidation or correction towards 1.3280. The upcoming Fed and BoE meetings will be pivotal in determining whether this momentum can be sustained.
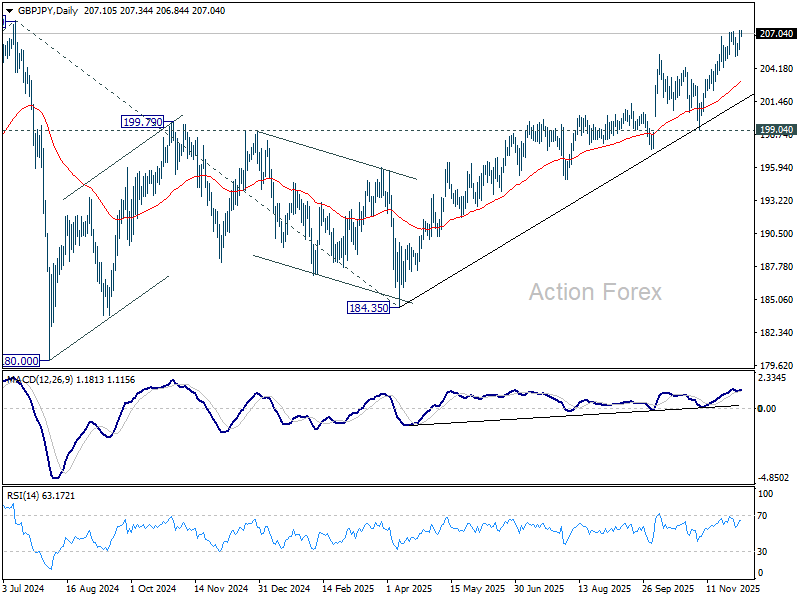
GBP/JPY Daily Outlook
Daily Pivots: (S1) 206.16; (P) 206.75; (R1) 207.86; More...
Intraday bias in GBP/JPY is back on the upside with breach of 207.18. Rise from 184.35 is resuming for retesting 208.09 high. Firm break there will confirm long term up trend resumption. However, break of 205.17 support will turn bias to the downside for deeper pullback, possibly to 55 D EMA (now at 203.12).
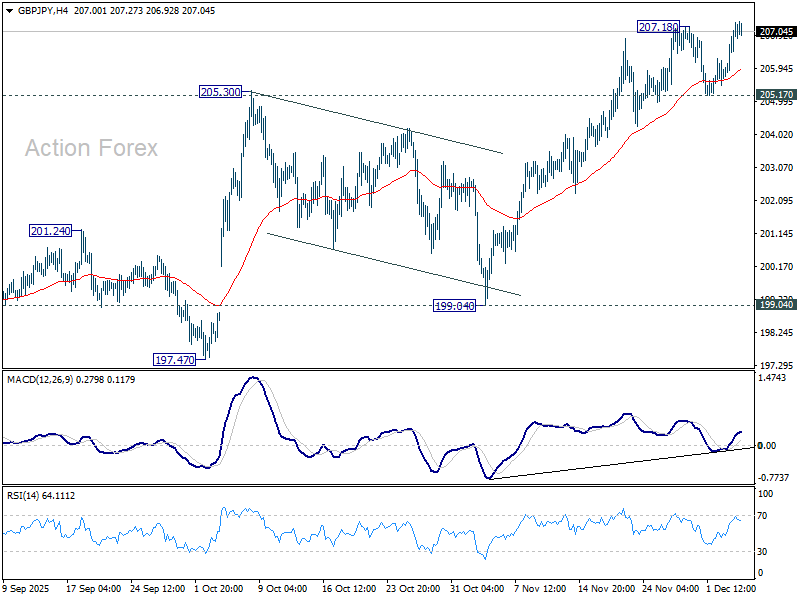
In the bigger picture, price actions from 208.09 (2024 high) are seen as a corrective pattern which might have completed at 184.35. Firm break of 208.09 high will resume the up trend from 123.94 (2020 low). Next target is 61.8% projection of 148.93 to 208.09 from 184.35 at 220.90. However, decisive break of 199.04 support will dampen this view and extend the corrective pattern with another fall.
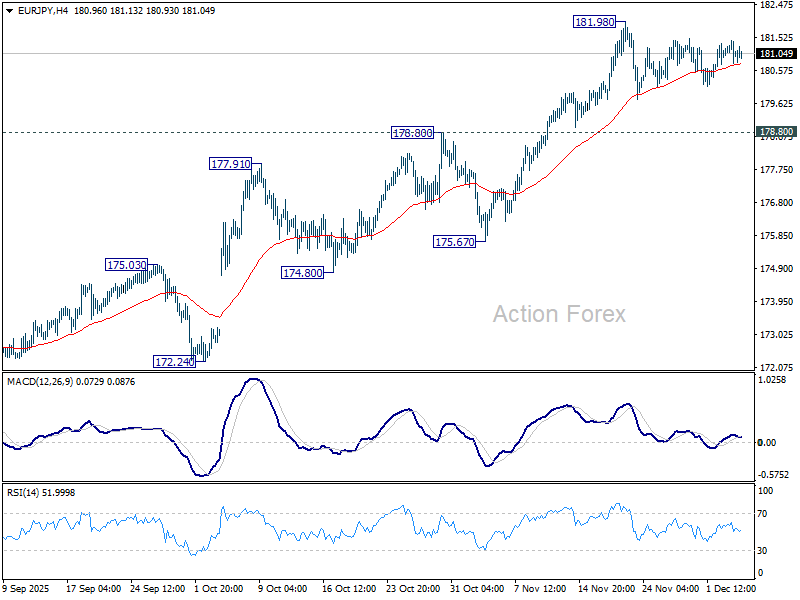
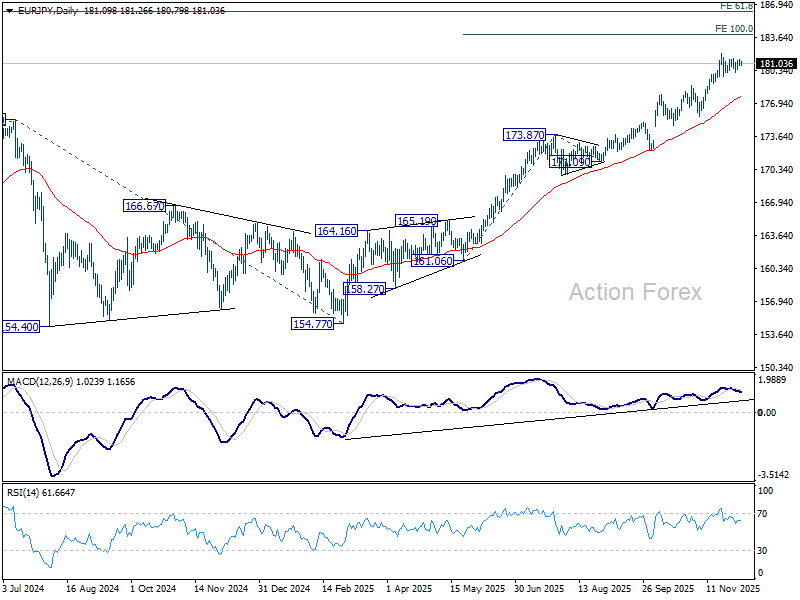
EUR/JPY Daily Outlook
Daily Pivots: (S1) 180.82; (P) 181.14; (R1) 181.48; More...
Intraday bias in EUR/JPY remains neutral as consolidations continues below 181.98. While deeper retreat cannot be ruled out, downside should be contained by 178.80 resistance turned support to bring another rally. On the upside, break of 181.98 will target 100% projection of 161.06 to 173.87 from 171.09 at 183.90 next. However, firm break of 178.80 will argue that deeper correction is already underway towards 55 D EMA (now at 177.74).
In the bigger picture, up trend from 114.42 (2020 low) is in progress and should target 61.8% projection of 124.37 to 175.41 from 154.77 at 186.31. Outlook will continue to stay bullish as long as 55 W EMA (now at 169.87) holds, even in case of deep pullback.
EUR/GBP Daily Outlook
Daily Pivots: (S1) 0.8717; (P) 0.8760; (R1) 0.8784; More…
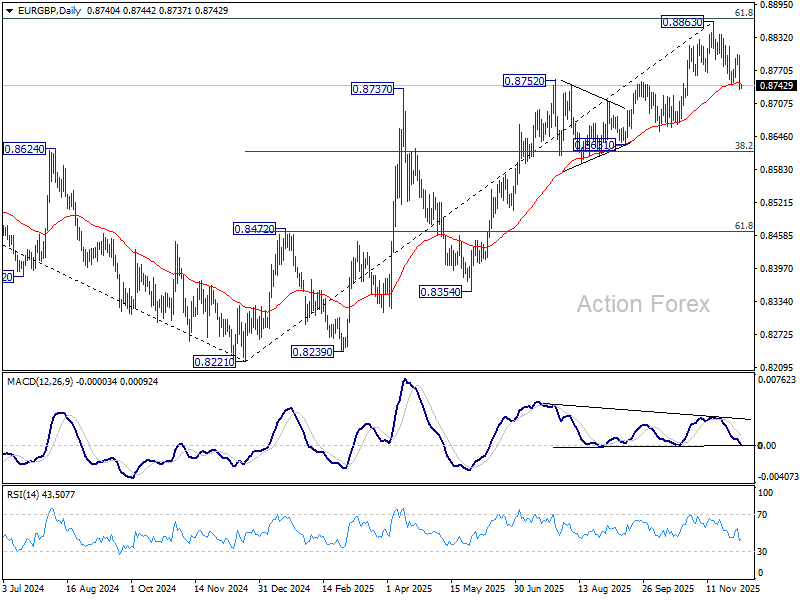
EUR/GBP's fall from 0.8863 resumed by breaking through 0.8745 and intraday bias is back on the downside. Considering bearish divergence condition in D MACD, sustained trading below 55 D EMA (now at 0.745) will solidify the case of bearish reversal. Deeper fall should then be seen to 0.8631 cluster (38.2% retracement of 0.8221 to 0.8663 at 0.8618). For now, risk will stay on the downside as long as 0.8800 resistance holds, in case of recovery.
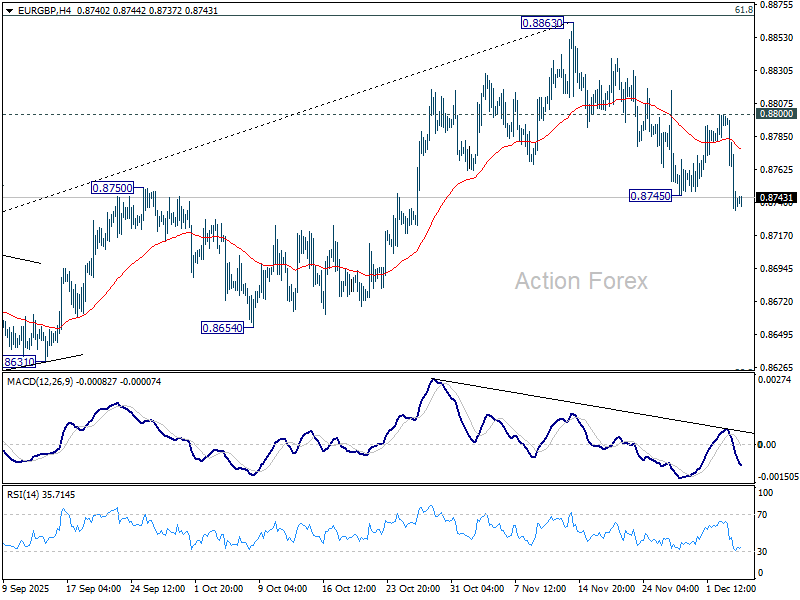
In the bigger picture, rise from 0.8221 medium term bottom is still seen as a corrective move. Upside should be limited by 61.8% retracement of 0.9267 to 0.8221 at 0.8867. Sustained trading below 55 W EMA (now at 0.8600) should confirm that this corrective bounce has completed. However, decisive break of 0.8867 will suggest that EUR/GBP is already reversing whole decline from 0.9267 (2022 high). That should pave the way back to 0.9267.