Sample Category Title
Japan’s wage picture improves but real incomes growth stays negative at -0.7%
Japan’s economic data delivered a familiar combination of improving nominal pay but still-depressed real incomes. Real wages fell -0.7% yoy in October, the 10th consecutive decline, though the rate of contraction moderated for the second month. Officials highlighted that fewer part-time roles and a higher share of full-time employees—who earn more—helped support headline income levels. Yet inflation of 3.4% yoy, driven mainly by food prices, continued to outpace wage gains.
Nominal earnings were considerably stronger, rising 2.6% yoy and beating forecasts for 2.2%. That marks a three-month high and extends the run of increases to 46 straight months, giving policymakers some evidence that wage momentum is holding up. Regular pay also expanded a robust 2.6% yoy, while bonus-driven special payments surged 6.7% yoy, providing a further boost. strain, limiting the lift to consumption.
The bigger disappointment came from growth data. Japan’s Q3 GDP was revised down to -2.3% annualized, from the initial -1.8%, making it the weakest quarter since 2023.
Research China – A Two-Speed Economy
The latest data in China has changed little to the overall picture of a two-speed economy with domestic demand looking weak while exports and tech continue to power ahead.
Growth is set to be close to the government's 5% target again this year but finishes the year on a weak note. We look for new stimulus to lift growth in the first half of 2026 and that the target will again be set around 5%.
We stick to our growth forecast of 4.9% in 2025 followed by 4.8% in 2026. In 2027 we project 4.7% growth.
More important will be the composition of growth and we expect to see more of the same with domestic demand still not strong enough to match supply keeping overcapacity and deflationary pressures as lingering problems.
In the new Five-Year Plan, China doubles down on tech and puts more weight on boosting consumer demand. It will require new and more forceful measures to stabilize housing, though, which may take some time still.
US-China tensions have eased again but we expect a continued bumpy road ahead. Tensions with EU have intensified this year and we see little respite in 2026.
The question of reunification with Taiwan still lingers but we see limited risk of military conflict during Trump's Presidency.
EUR/USD Holds Firm at Support, Raising Odds of Additional Gains
Key Highlights
- EUR/USD gained pace for a move above the 1.1620 resistance.
- A key bullish trend line is forming with support at 1.1630 on the 4-hour chart.
- GBP/USD started consolidating gains above 1.3300.
- USD/JPY might start a fresh increase if it clears the 156.00 resistance.
EUR/USD Technical Analysis
The Euro started a decent increase above 1.1550 against the US Dollar. EUR/USD cleared the key barrier at 1.1600 to enter a positive zone.
Looking at the 4-hour chart, the pair gained pace for a move above 1.1620. It traded as high as 1.1681 and settled above the 100 simple moving average (red, 4-hour) and the 200 simple moving average (green, 4-hour).
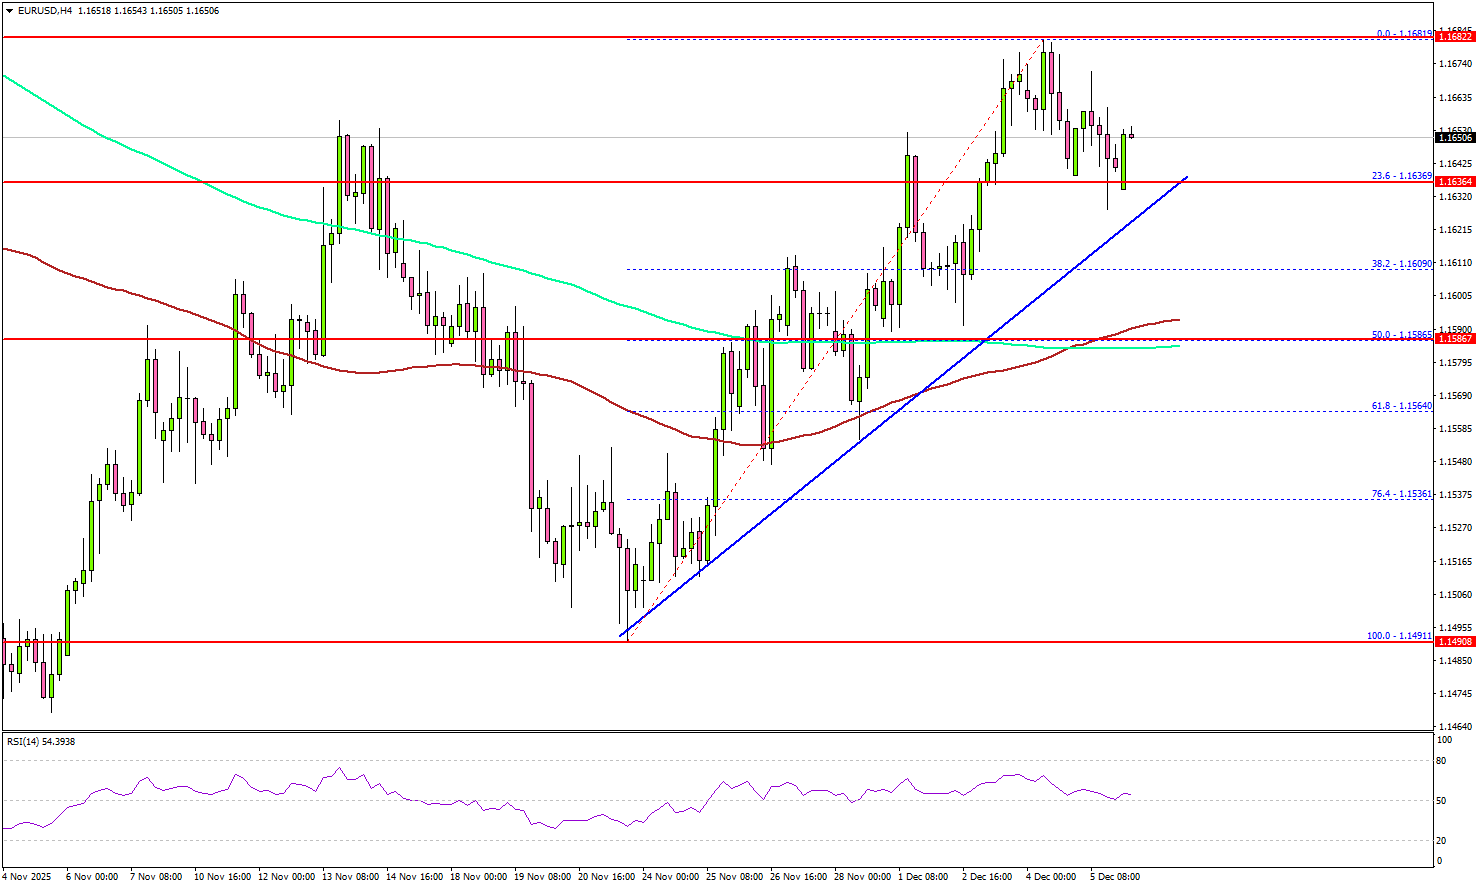
It is now consolidating gains above 1.1620. There is also a key bullish trend line forming with support at 1.1630. Immediate resistance sits near 1.1660. The first key hurdle is seen near 1.1680.
A close above 1.1680 could open the doors for a move toward 1.1725. Any more gains could set the pace for a steady increase toward 1.1780.
On the downside, there is key support at 1.1630 and the trend line at 1.1620. The next support is 1.1580 and the 100 simple moving average (red, 4-hour). A close below the 100 simple moving average (red, 4-hour) could spark a bearish move and send the pair to 1.1510. Any more losses might call for a test of 1.1465.
Looking at GBP/USD, the pair rallied above 1.3300 and recently started a consolidation phase. The main support sits at 1.3260.
Upcoming Key Economic Events:
- Euro Zone Sentix Investor Confidence for Dec 2025 - Forecast -7.4, versus -7.4 previous.
Global Markets Hold Firm with Focus on Upcoming Fed Meeting
Markets were calm last week with no major surprises. Fed Chair Powell did not discuss the economy or monetary policy, so traders didn’t get any new signals on inflation or interest rates. Even so, equities continued their recovery as risk appetite improved, although trading volumes stayed light.
U.S. data was slightly positive. The ISM Manufacturing PMI beat expectations, consumer sentiment improved, and the Core PCE Price Index was close to forecasts, showing inflation is easing. Talks to end the war in Ukraine continued but had little effect on markets.
The U.S. dollar weakened as investors expect the Federal Reserve to cut interest rates this week. In Japan, the 10-year bond yield continued to rise, which the market is watching carefully, though it has not caused major issues yet. Bitcoin stayed under pressure, and gold remained quiet.
Markets This Week
U.S. Stocks
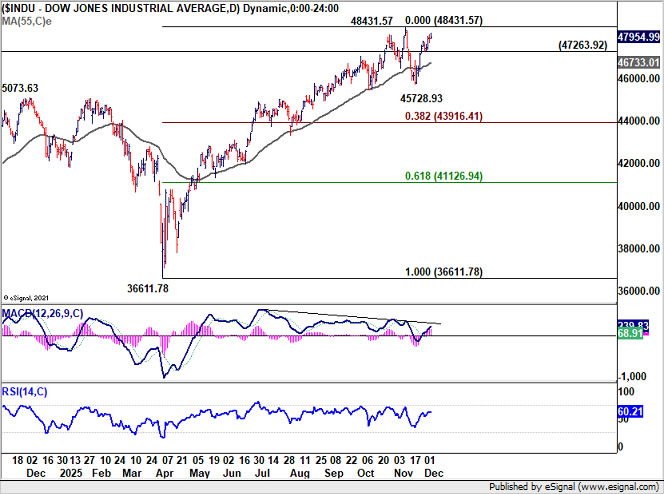
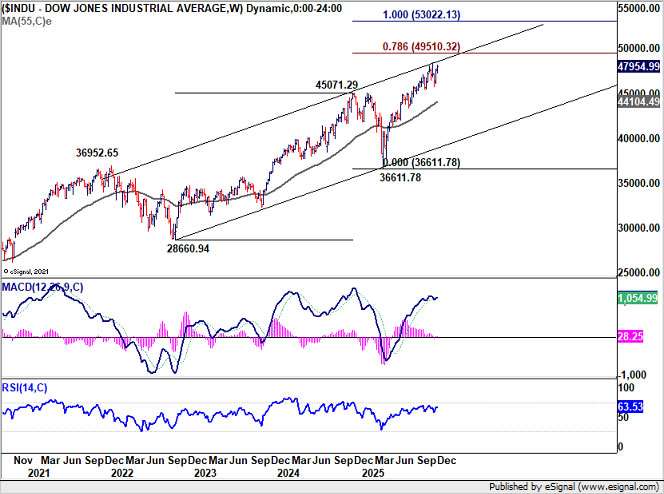
The recovery in the Dow continued last week, with no negative news to disrupt the recent buying ahead of this week’s Federal Reserve meeting. The 10-day moving average is pointing higher, and the uptrend is expected to continue unless the Fed surprises the market with a statement that lowers expectations for interest rate cuts in 2026. Resistance levels are at 48,000, 48,500, and 49,000, while support is seen at 47,000, 46,500, 46,000, and 45,000.
Japanese Stocks
Japanese stocks rose marginally last week, following the gains in U.S. markets. However, the advance was limited as expectations for a Bank of Japan interest rate hike increased after comments from Governor Kazuo Ueda. The Nikkei is likely to continue trading sideways around the 50,000円 level, offering range-trading opportunities, with slightly more downside risk if the yen continues to strengthen. Resistance is at 51,000円, 51,500円, and 52,000円, while support is at 49,000円, 48,000円, and 47,000円.
USD/JPY
The yen strengthened last week, continuing to reverse some of the gains seen since Takaichi became Prime Minister, as expectations for a Japanese interest rate hike next week increased. The market is finding support ahead of 154, so some buying may return this week, though there is downside risk if the Federal Reserve surprises markets by signaling faster-than-expected interest rate cuts for 2026. Resistance is at 156, 157, and 158, while support is at 154, 153, and 152.
Gold
Gold remained strong, supported by expectations of lower U.S. interest rates and continued safe-haven demand. Resistance at the upper Bollinger Band limited gains as traders waited for the Federal Reserve meeting. The metal is finding support at the 10-day moving average and looks likely to continue higher in the current environment. Resistance is at $4,250, $4,350, and $4,380, while support is at $4,150, $4,100, and $4,050.
Crude Oil
Hopes that lower U.S. interest rates will support demand, along with uncertainty around the Ukraine–Russia conflict, helped WTI move higher and push back above $60. The recent downward trend has now been broken, so a range-trading approach between $58 and $62 looks more suitable this week. Resistance remains at $65, $66.50, $70, and $75, while support is at $55 and $50.
Bitcoin
Bitcoin traded sideways last week as the market showed diverging views on its long-term outlook after the drop from record highs back below $100,000. The 10-day moving average is now pointing sideways, so a range-trading strategy remains the best approach in the short term. Resistance is at $95,000 and $100,000, while support is at $85,000, $80,000, and $75,000.
This Week’s Focus
- Monday: Japan GDP, China Trade Balance, U.S Factory Orders
- Tuesday: Australia RBA Interest Rate Decision, Japan BOJ Gov Ueda Speaks
- Wednesday: U.S. Fed Interest Rate Decision
- Thursday: Australia Unemployment Rate, U.S. Trade Balance
- Friday: U.K. GDP
The focus this week will be the U.S. Federal Reserve’s interest rate decision, where the market expects a 0.25% rate cut. The statement that follows will be especially important, as traders look for clues on the timing of further cuts in 2026 and how the Fed views the economy and inflation trends. Apart from the Fed meeting, there are few major data releases, and the market is gradually shifting its attention toward the start of the holiday season.
AUDJPY Wave Analysis
AUDJPY: ⬆️ Buy
- AUDJPY broke long-term resistance level 102.30
- Likely to rise to resistance level 105.20
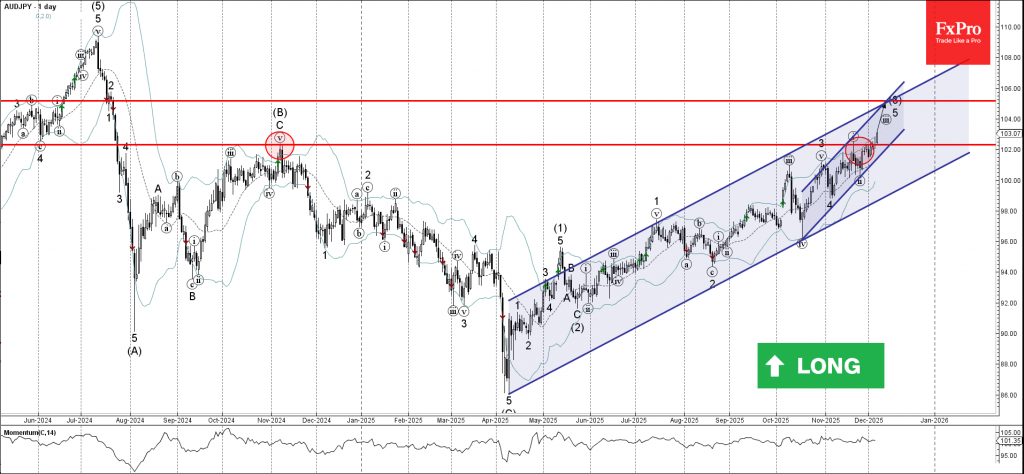
AUDJPY currency pair recently broke above the long-term resistance level 102.30 (former multi-month high from November).
The breakout of the resistance level 102.30 accelerated the active impulse waves iii and 5 – which belong to the intermediate impulse wave (3) from May.
Given the overriding daily uptrend and the strongly bullish Australian dollar sentiment, AUDJPY currency pair can be expected to rise to the next resistance level 105.20.
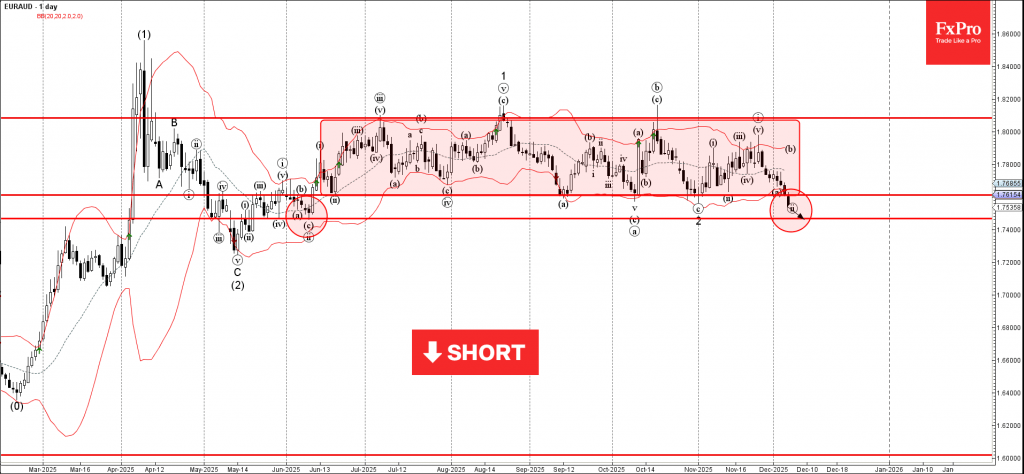
EURAUD Wave Analysis
EURAUD : ⬇️ Sell
- EURAUD broke the support level 1.7600
- Likely to fall to support level 1.7465
EURAUD currency pair recently broke the support level 1.7600 (which is the lower boundary of the sideways price range inside which the pair has been trading from June).
The breakout of the support level 1.7600 accelerated the active short-term correction ii from the end of November.
Given the strongly bullish Australian dollar sentiment seen today, EURAUD currency pair can be expected to fall to the next support level 1.7465 (former monthly low from June).
Santa Rally on Standby with Markets Split on 2026 Fed Cuts
Dollar spent most of the week pinned to the bottom of the performance board, as a steady flow of data reinforced expectations for a Fed rate cut in December. Even though selling pressure eased slightly into Friday—thanks in part to a surprisingly firm rebound in longer-dated Treasury yields—the greenback still struggled to find a foothold.
Risk sentiment improved across major markets, and that shift alone did much of the heavy lifting. The notable underperformance of the Swiss Franc highlighted the change in tone, with safe-haven demand fading while yields elsewhere climbed. Euro was also heavy.
Against that backdrop, the outperformers told their own story. Aussie surged to the top of the weekly rankings as traders began to position for the possibility of an RBA hike in 2026. Governor Michele Bullock’s message to the parliament—signaling that policymakers may need to pivot back toward tightening if inflation re-accelerates—gave markets a narrative they were quick to embrace.
Canada’s Dollar was not far behind, propelled by another impressive labor-market beat that further cemented expectations for the BoC to hold rates unchanged through 2026. Sterling also benefited from persistent optimism following the well-received Autumn Budget, helping it round out the top three.
Yen and Kiwi held the middle ground but for very different reasons. In Japan, rising expectations for a December BoJ rate hike were tempered by stronger global risk appetite. For Kiwi, the tone was firm but restrained, with investors largely respecting the RBNZ’s hawkish hold last month, without chasing the move.
US Stocks Hold Their Nerve, but Santa Needs More Data
Whether US equities are entering a genuine Santa Claus rally remains an open question, but last week’s performance at least showed that dip buyers are still very much alive. The brief pullback in mid-November was swiftly absorbed, with major indexes defending near-term technical supports and re-establishing upward momentum. That resilience alone keeps the year-end rally narrative on the table.
Still, the conviction behind the move is less than overwhelming. Many investors are reluctant to chase the highs given the sheer volume of event risk ahead. Markets have already fully priced in a Fed rate cut this month, and incoming data last week largely validated that view. What remains uncertain is the path beyond December, and that lack of clarity is holding sentiment in check.
The next two weeks could change that. The December 10 FOMC meeting is clearly a consequential one—not because of the cut itself, which markets assume—but because of the updated economic projections and the new dot plot. These will effectively set the tone for how aggressively the Fed expects to—or is willing to—ease through early 2026.
In parallel, the following week’s heavy-weight data—NFP and CPI—will give markets a more concrete read on whether pricing pressures are merely stabilizing at a still-elevated level, and whether the deterioration of job market is already in the rear mirror. For equities, “bad news is good news” still applies, but only up to a point. Softer data would strengthen the case for earlier or deeper Fed cuts, thereby supporting valuations.
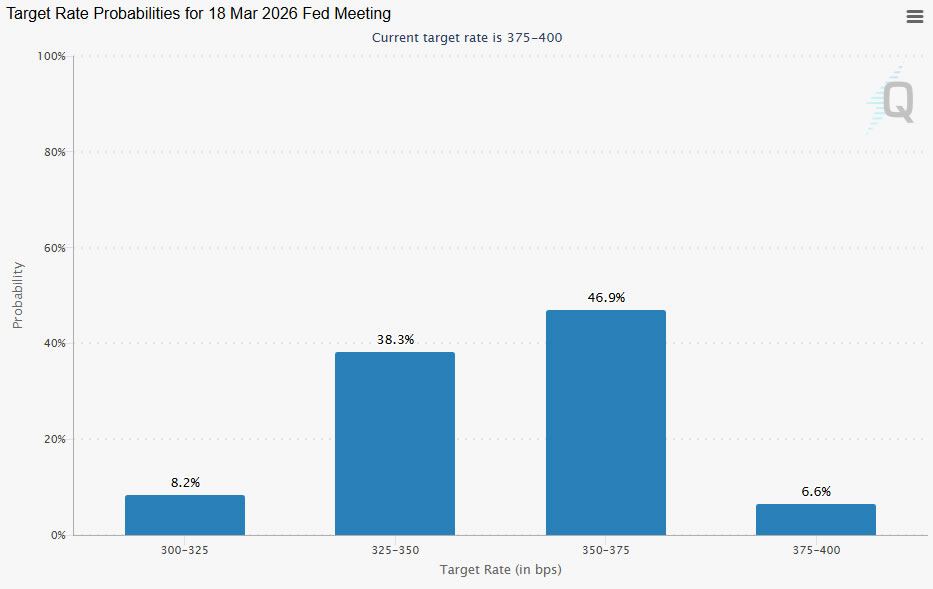
Fed fund futures, meanwhile, reflects a lot of uncertainty. The odds of another 25bps cut by March sit just under 50%, essentially a coin toss. That pricing highlights how divided the market is on whether the Fed pauses in Q1 or continues easing. Until that gap closes one way or the other, equities could remain reactive rather than directional.
Technically, for DOW, break of 48,431.57 will resume the long term up trend to 78.6% projection of 28,660.94 to 45,701.29 from 36,611.78 at 49,510.32, or even further to 50k psychological level in the near term. However, on the downside, break of 47,263.92 support will suggest that corrective pattern from 48,431.57 has started a third leg, and would target 47,528.93 support again.
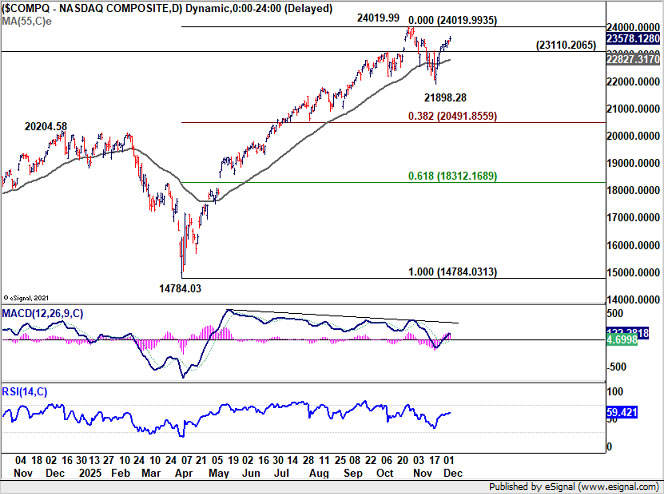
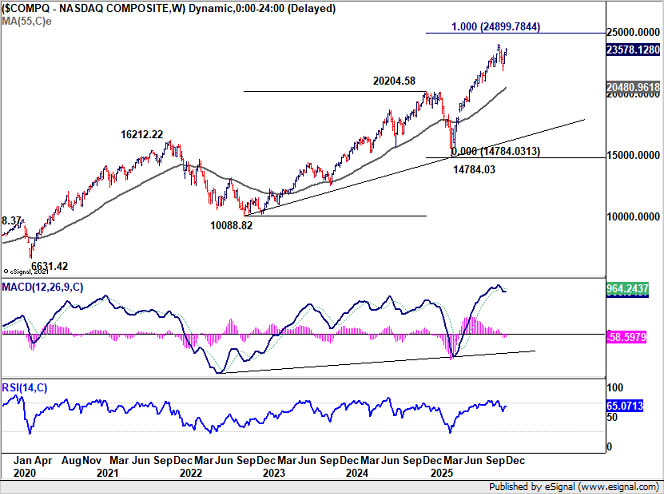
Similarly, break of 24,019.99 will resume NASDAQ's up trend to 100% projection of 10,088.82 to 20,204.58 from 14,784.03 at 24,899.78. However, on the downside, break of 23,110.20 support will extend the corrective pattern from 24,019.99 with another falling leg to 21,898.28 support again.
So the question remains: will Santa deliver? The answer hinges on whether next week’s Fed projections and the following week’s CPI/NFP releases provide markets with the confidence they currently lack. Until then, optimism is warranted—but caution still rules the edges of the rally.
Yields Surge on Fears of a Politicized Fed; Dollar Struggles to Keep Up
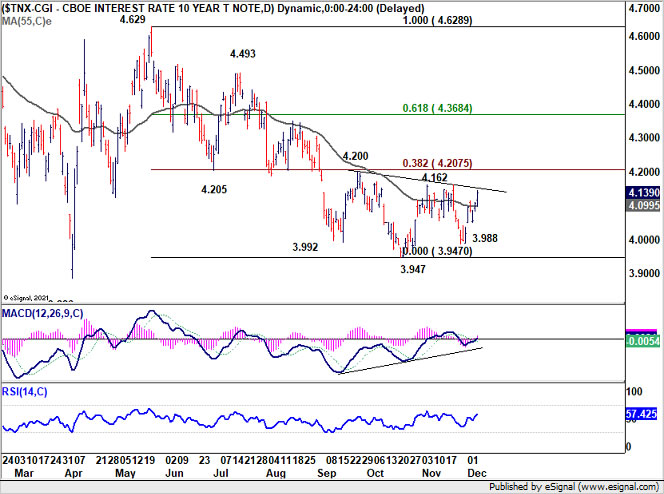
US Treasury yields displayed far more resilience last week than many had expected. Instead of extending the slide toward October low of 3.947, the 10-year yield reversed and closed firmly at 4.139. Part of that rebound reflects improved risk appetite globally, as investors rotated out of safety and back into equities. But that alone does not fully explain the recovery, given the market’s growing conviction that the Fed will cut rates next week.
A deeper driver may be emerging: the market is beginning to price in a wider range of political and policy outcomes for 2026. The looming transition at the Fed has injected some unmistakable uncertainty that extends beyond the typical macro data cycle. Chair Jerome Powell’s term ends next year, and reports increasingly suggest that President Donald Trump intends to appoint his top economic adviser Kevin Hassett as the next Fed chief.
Hassett is widely perceived as a strong monetary dove, and the prospect of a Fed leadership more aligned with the White House introduces non-trivial risks for bond markets. Investors fear that a politically influenced Fed could lean too heavily into easing—even in an environment where inflation remains above target—potentially setting the stage for a renewed inflation cycle.
That anxiety may explain why longer-dated yields are refusing to break lower despite softer labor market signals. The bond market is effectively hedging against the possibility that the Fed’s medium-term reaction function becomes less restrictive and less focused on price stability. In other words, yields are reacting not just to economic data, but to institutional risk.
A further wrinkle is the idea that Hassett could operate as a “shadow Fed chair” in the months before formally taking office. Markets fear that his comments—rather than Powell’s—may become the unofficial guide for rate-expectation pricing. That would add volatility to an already delicate policy transition.
Against this backdrop, Dollar remains soft but not outright collapsing. Most of the weakness last week stemmed from improving global risk sentiment rather than any direct Fed repricing. Dollar selloff against European majors has slowed towards the end of the week, while yield support offers a partial offset. Still, the greenback retains a heavy tone as long as political uncertainty lingers.
Technically, 10-year yield may be completing a head-and-shoulders bottoming formation (ls 3.992; h: 3.947; rs: 3.988). Break of 4.162 will complete the pattern and be the first important sign of bullish trend reversal.
Nevertheless, the much more important hurdle lies in 4.2 cluster resistance level, with 4.200 resistance as well as 38.2% retracement of 4.629 to 3.947 at 4.207. As long as this level holds, outlook for 10-year yield will stay neutral at best.
However, firm break of 4.2 could easily push 10-year yield to 61.8% retracement at 4.368 and above. And that could be a strong indication of some serious underlying repricing.
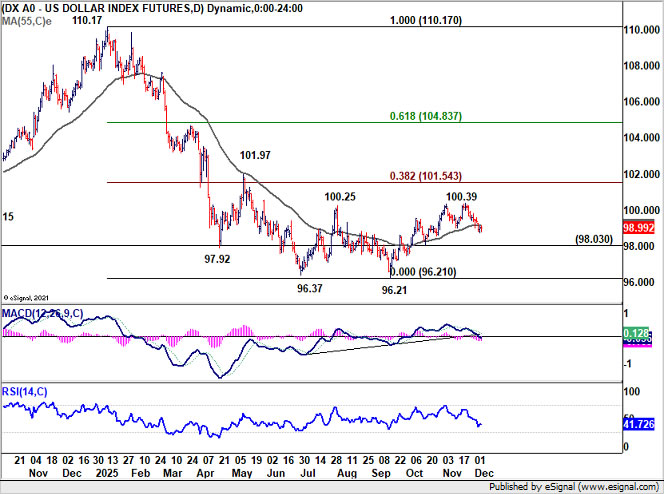
Dollar Index gyrated lower last week to close at 98.99. The break of 55 D EMA (now at 99.13) argues that rebound from 96.21 might have completed at 100.39 already.
Deeper fall is now in favor to 98.03 support. Decisive break there will confirm this bearish case, and bring retest of 96.21 low.
In case of another rise, strong resistance is still expected from 38.2% retracement of 110.17 to 96.21 at 101.54 to limit upside.
Markets Flip Toward RBA Tightening—Aussie Extends Gains, Loonie Strengthens Too
Commodity currencies finished last week as clear outperformers, buoyed by firmer risk sentiment and strong domestic catalysts. Aussie led the major currencies, reflecting a dramatic shift in how markets now view next year’s RBA policy path. What only recently looked like a debate between “cut or hold” has quickly evolved into early pricing of outright tightening.
The turnaround in expectations has been striking. Just two weeks ago, traders were split on whether the RBA might cut rates by May. But with inflation showing signs of re-accelerating, and national accounts revealing an economy gaining momentum into year-end despite the headline miss. Markets have swung decisively toward the view that the RBA will need to tighten, not ease, in 2026.
Household spending and private demand were firmer than anticipated, reinforcing concerns that underlying inflation pressure may not fade as quickly as policymakers hoped, or even re-emerge. That was enough for investors to conclude that rate cuts are effectively off the table, while the risk of multiple hikes is now starting to be priced in from February onward.
Loonie also impressed, albeit through a very different catalyst. The late-week surge stemmed from another strong jobs report, marking the third consecutive upside surprise. November’s employment gains and the sharp drop in unemployment signal that the economy is finally moving past the drag created by earlier US tariff distortions.
For the BoC, the message is now crystal clear: the easing cycle is over. After delivering 275bps of cuts—one of the largest cycles among major central banks—the BoC signaled in October that policy was already near the lower bound of neutral. The latest labor-market data cement expectations that rates will remain on hold until at least 2027 unless growth deteriorates sharply.
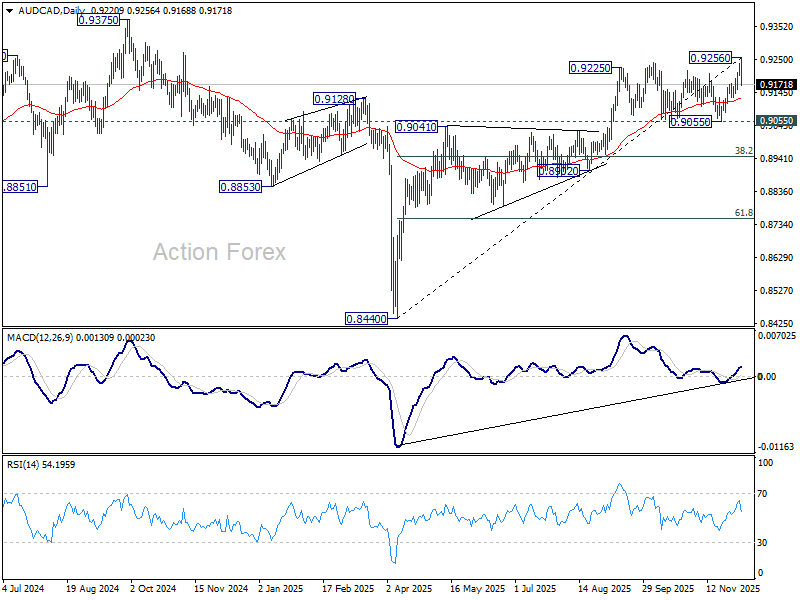
Despite the solid macro backdrop for both currencies, AUD/CAD price action reflects a market pausing for breath. The cross briefly edged to 0.9256 before reversing sharply, hinting that a short-term top is already in place. Profit-taking near major resistance added to the pullback.
In the near term, consolidation looks more likely than continuation. A deeper dip toward the 55-day EMA at 0.9127 is possible, particularly if risk appetite wobbles or if investors reassess the pace of RBA tightening. A break of the EMA would not alter the broader trend but would reinforce the view that the pair needs more time to establish a base.
Bigger-picture momentum, however, remains constructive. As long as 0.9055 support holds, the rise from the 2025 low at 0.8440 remains intact, and another leg higher is favoured at a later stage. The timing—and strength—of that move will depend on how aggressively markets lean into RBA hike expectations in early 2026.
Only a firm break of 0.9055 would suggest that AUD/CAD is no longer trending, opening a deeper pullback toward the 38.2% retracement of 0.8440 to 0.9256 at 0.8944. Until then, dips remain part of a broader bullish structure anchored by relative central-bank divergence.
USD/CAD Weekly Outlook
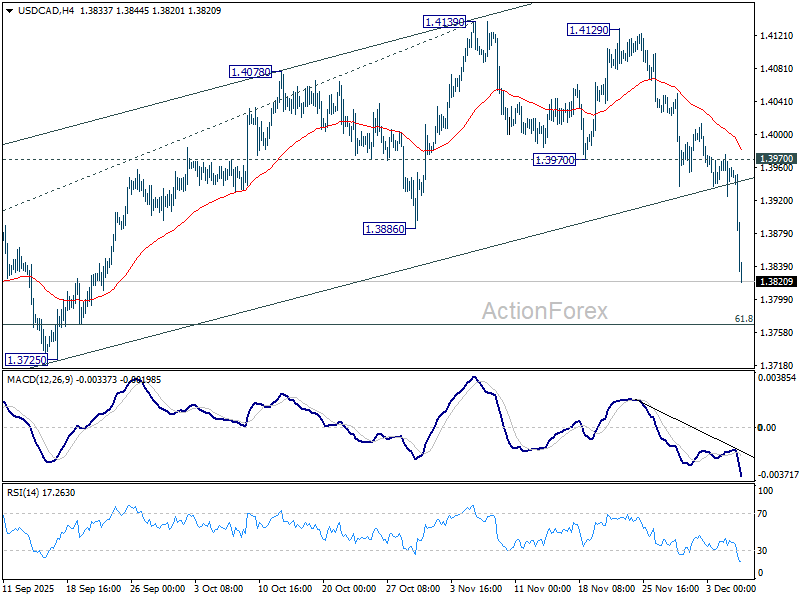
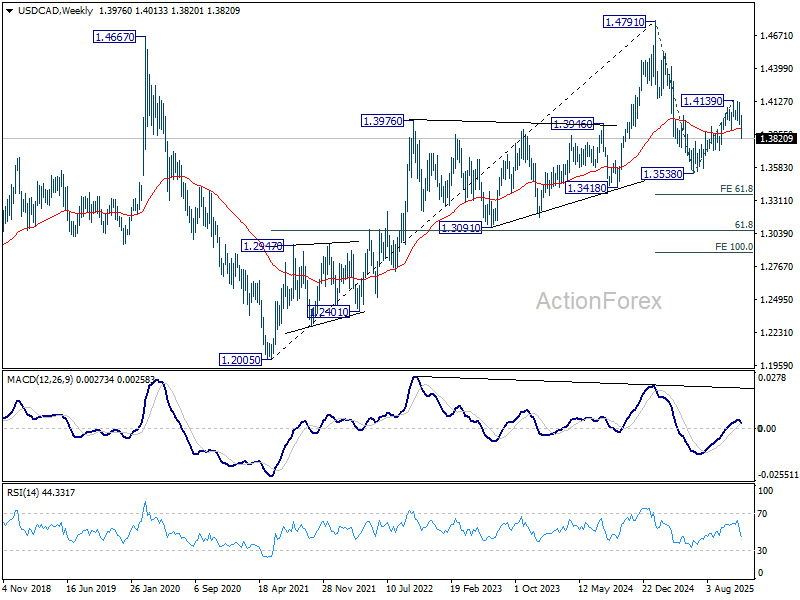
USD/CAD's steep decline last week suggests that rise from 1.3538 has already completed at 1.4139. Initial bias remains on the downside this week for 61.8% retracement of 1.3538 to 1.4139 at 1.3768. Firm break there will argue that whole decline form 1.4791 might be ready to resume through 1.3538 low. For now, risk will stay on the downside as long as 1.3970 support turned resistance holds, in case of recovery.
In the bigger picture, current development suggests that price actions from 1.4791 is developing into a deeper, larger scale correction. In the less bearish case, it's just correcting the rise from 1.2005 (2021 low). But even so, break of 1.3538 will pave the way to 61.8% projection of 1.4791 to 1.3538 from 1.4139 at 1.3365. This will remain the favored case as long as 1.4139 resistance holds, in case of rebound.
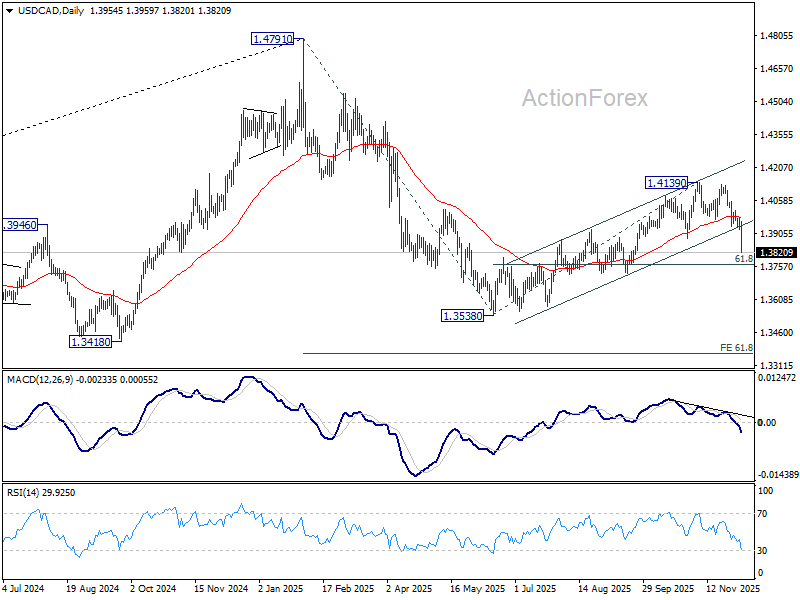
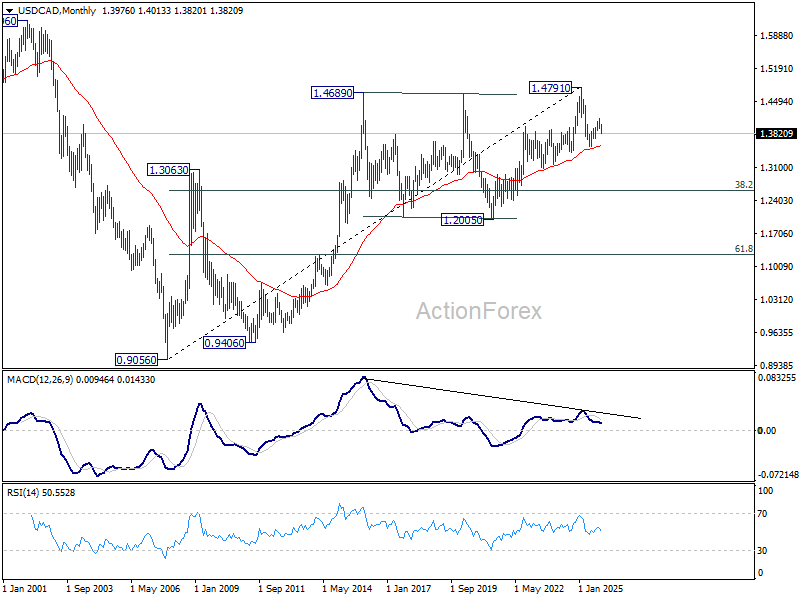
In the long term picture, rising 55 M EMA (now at 1.3567) remains intact. Thus, up trend from 0.9056 (2007 low) should still be in progress. However, considering bearish divergence condition M MACD, sustained trading below 55 M EMA will argue that the up trend has completed with five waves up to 1.4791, and turn medium term outlook bearish for correction. to 38.2% retracement of 0.9056 to 1.4791 at 1.2600.
EUR/USD Weekly Outlook
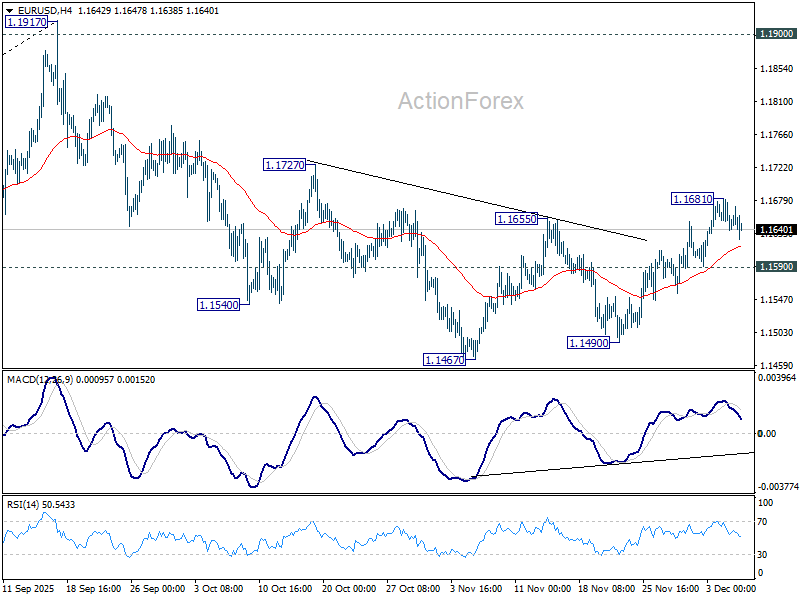
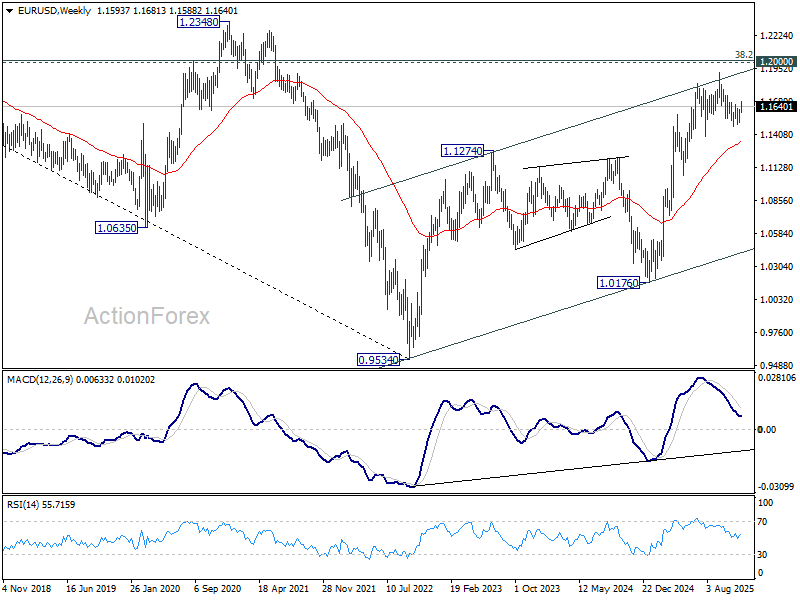
EUR/USD rebounded to as high as 1.1681 last week but retreated since then. Initial bias is turned neutral this week first. Corrective fall from 1.1917 could have completed at 1.1467. Above 1.1681 will target 1.1727 resistance first. Firm break there will solidify this case and bring retest of 1.1917 high. However, break of 1.1590 will revive near term bearishness, and bring retest of 1.1467 low.
In the bigger picture, as long as 55 W EMA (now at 1.1346) holds, up trend from 0.9534 (2022 low) is still in favor to continue. Decisive break of 1.2 key psychological level will carry larger bullish implication. However, sustained trading below 55 W EMA will argue that rise from 0.9534 has completed as a three wave corrective bounce, and keep long term outlook bearish.
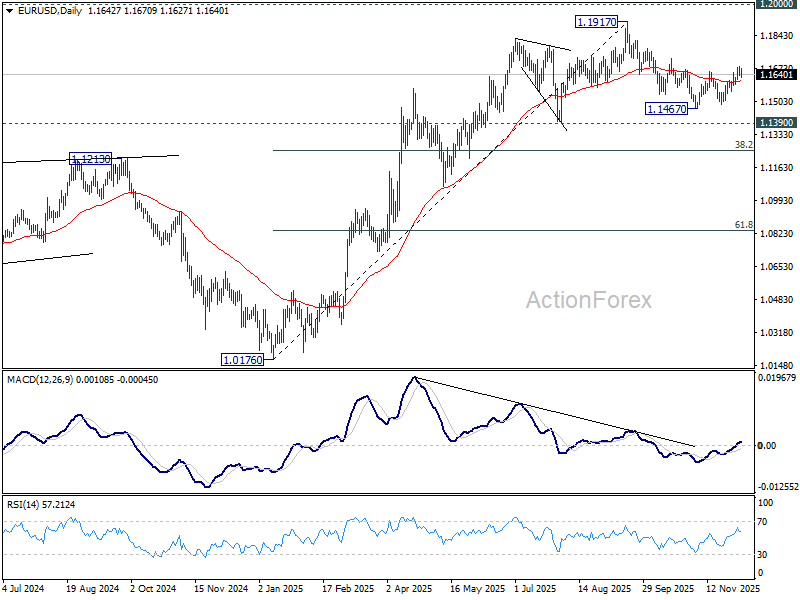
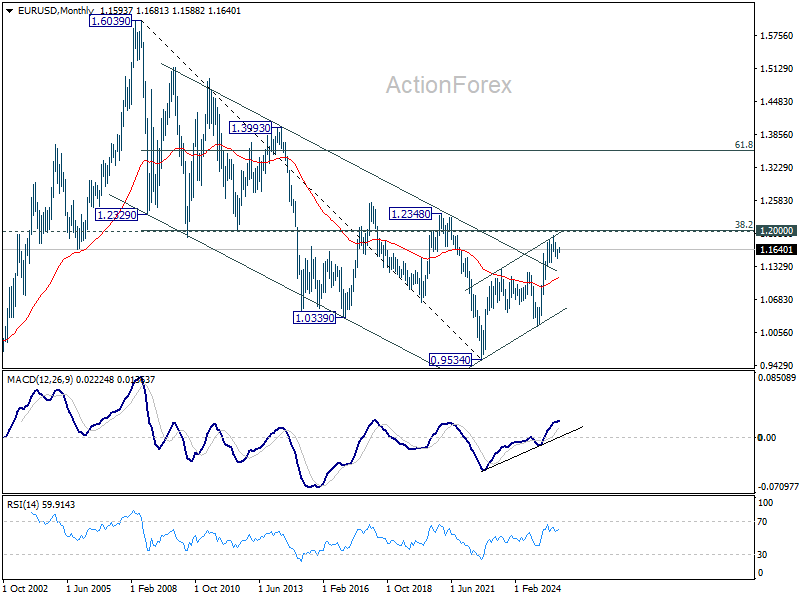
In the long term picture, 38.2% retracement of 1.6039 to 0.9534 at 1.2019, which is close to 1.2000 psychological level is the key for the outlook. Rejection by this level will keep the multi decade down trend from 1.6039 (2008 high) intact, and keep outlook neutral at best. However, decisive break of 1.2000/19, will suggest long term bullish trend reversal, and target 61.8% retracement at 1.3554.
USD/JPY Weekly Outlook
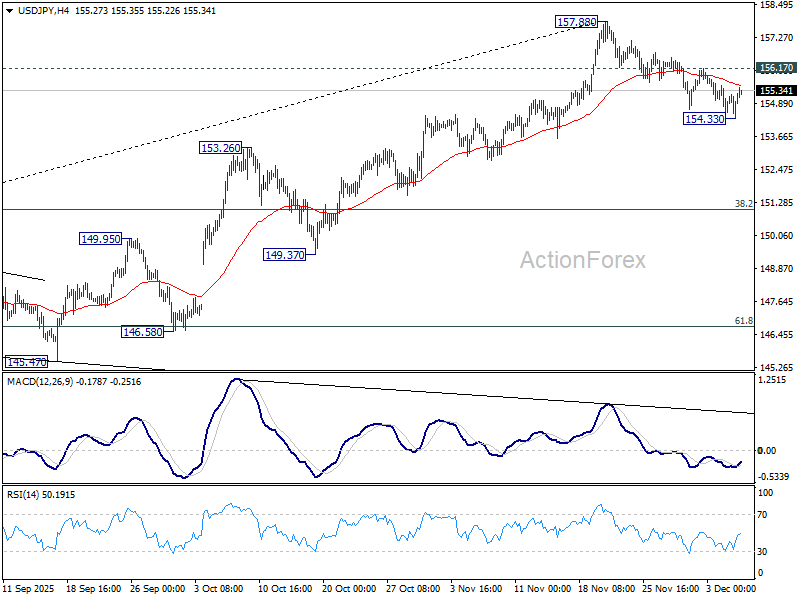
USD/JPY's fall from 157.88 short term top extended lower last week, but lost momentum after hitting 154.33. Initial bias is turned neutral this week first. On the downside, below 154.33 will target 55 D EMA (now at 153.11). Firm break there will bring deeper fall to 150.90 cluster (38.2% retracement of 139.87 to 157.88 at 151.00). On the upside, though, break of 156.17 resistance will indicate that the pullback has completed and bring retest of 157.88 high.
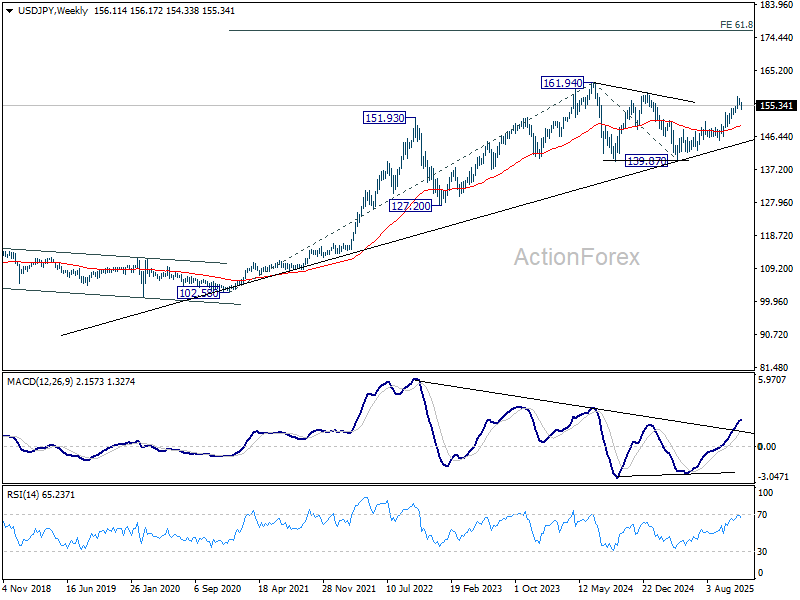
In the bigger picture, corrective pattern from 161.94 (2024 high) could have completed with three waves at 139.87. Larger up trend from 102.58 (2021 low) could be ready to resume through 161.94 high. Decisive break of 158.85 structural resistance will solidify this bullish case and target 161.94 for confirmation. On the downside, break of 150.90 resistance turned support will dampen this bullish view and extend the corrective range pattern with another falling leg.
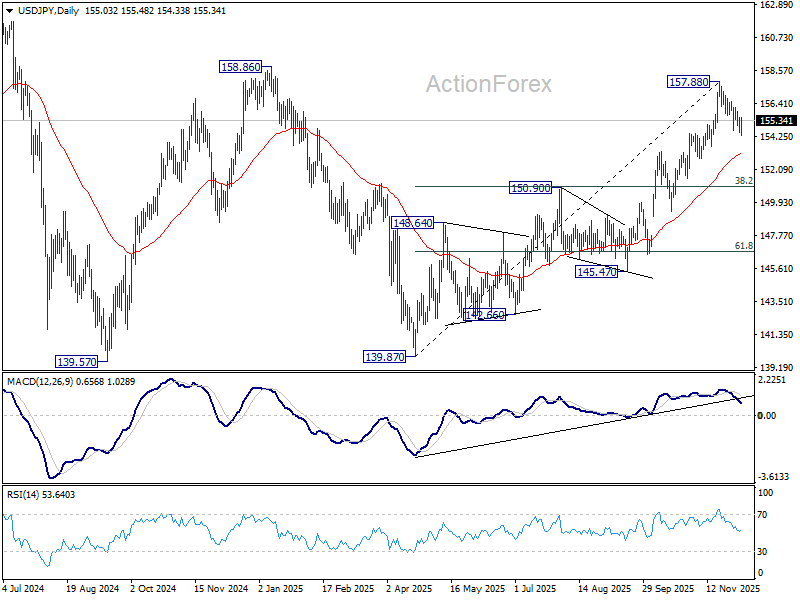
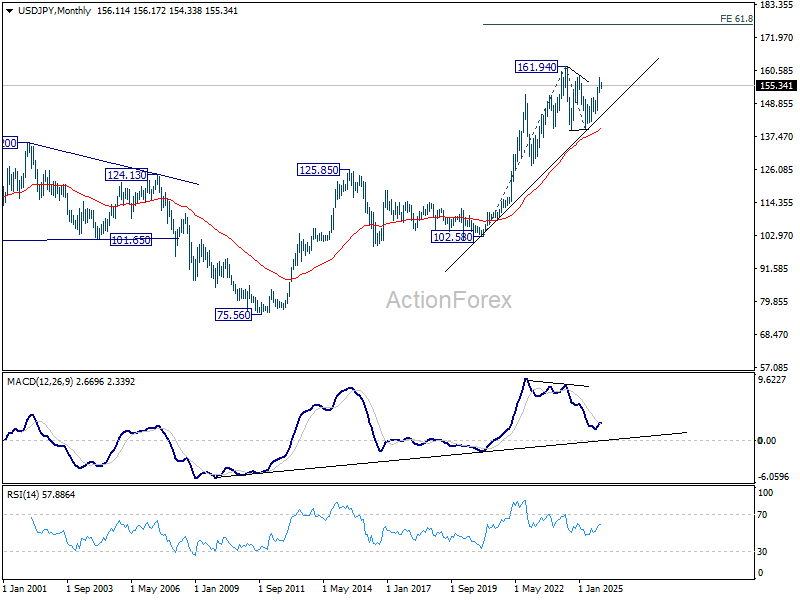
In the long term picture, up trend from 75.56 (2011 low) is still in progress and might be ready to resumption. Firm break of 161.94 will target 61.8% projection of 102.58 (2020 low) to 161.94 (2024 high) from 139.87 at 176.55 in the medium term.