Sample Category Title
Dollar Index Has Fallen to Its Lowest Level in Almost 1.5 Months
The key event of the week will take place on 10 December – at 22:00 GMT+3 the FOMC will publish its interest rate decision, followed half an hour later by a press conference with Jerome Powell.
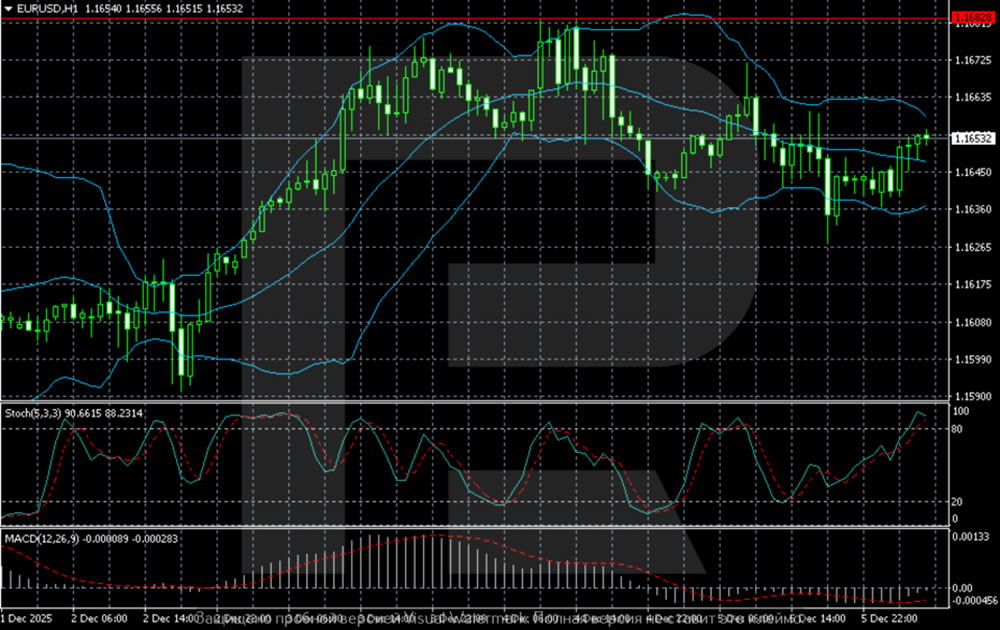
As the chart of the dollar index (DXY) shows, the US dollar is weakening as the event approaches, reflecting market sentiment – the rate is expected to be cut by 25 basis points due to pressure from Trump and a cooling labour market. This underpins the bearish trend that has been in place since late November.
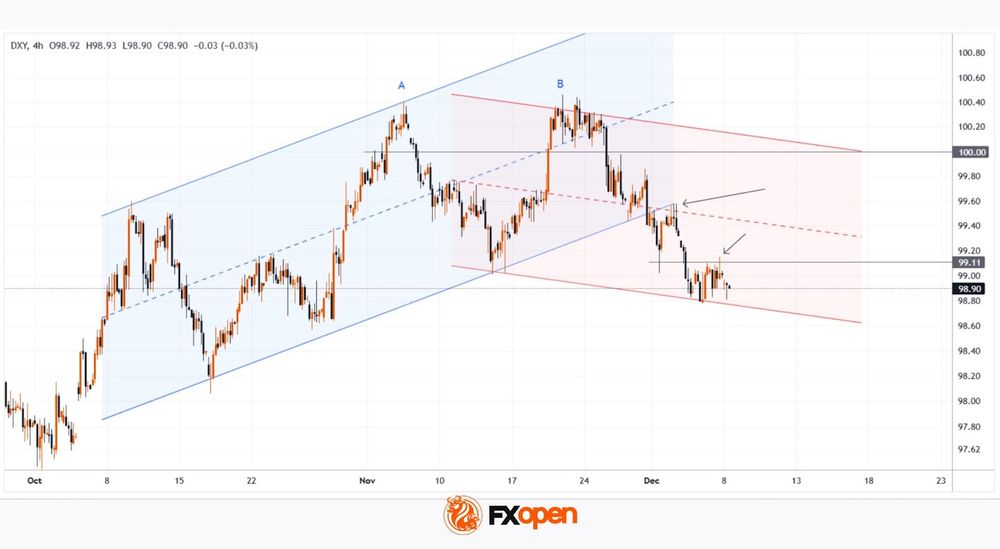
A reminder that on 24 November we:
→ highlighted the importance of resistance around 100.20 points;
→ and constructed a system of two trend channels.
Since then, the price has moved lower within the descending channel, and:
→ new swing points have allowed us to refine the channel boundaries;
→ a large bearish double-top pattern (A–B) has formed on the chart above the psychological level of 100 points.
The dollar index chart indicates that selling pressure is dominant (as shown by the arrows):
→ the lower boundary of the ascending channel has switched its role from support to resistance;
→ a similar role reversal has occurred at the 99.11 level.
Today, the DXY index is near the lower boundary of the descending channel. It is reasonable to assume that in the short term:
→ the market will enter a wait-and-see mode ahead of the news;
→ a consolidation zone may form on the chart, supported by the lower boundary of the red channel.
Be prepared for surges in volatility on the currency markets on Wednesday evening.
Trade global index CFDs with zero commission and tight spreads. Open your FXOpen account now or learn more about trading index CFDs with FXOpen.
This article represents the opinion of the Companies operating under the FXOpen brand only. It is not to be construed as an offer, solicitation, or recommendation with respect to products and services provided by the Companies operating under the FXOpen brand, nor is it to be considered financial advice.
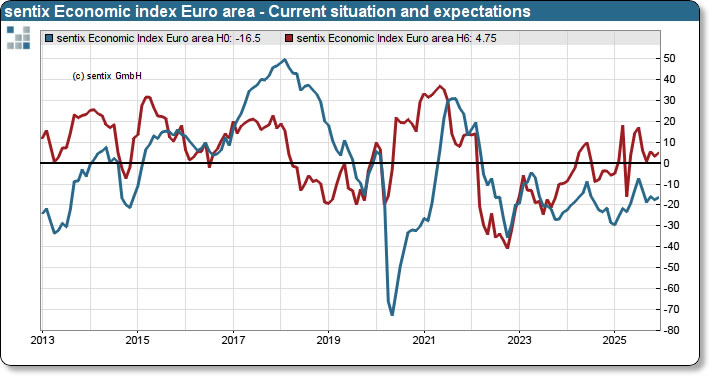
Eurozone Sentix confidence edges higher to -6.2 but recovery still elusive
Eurozone Sentix Investor Confidence improved slightly in December, rising from -7.4 to -6.2, a touch better than expectations of -6.3. Both components strengthened, with Current Situation Index climbing from -17.5 to -16.5 and Expectations rising from 3.3 to 4.8. The figures reinforce a theme that has persisted through the past quarter: sentiment is no longer deteriorating, but neither is it showing convincing signs of a rebound.
Sentix noted that the Eurozone economy is “at best” stabilizing, even as global momentum improves across most other major regions. That divergence reflects the bloc’s inability to translate external tailwinds into domestic gains, with survey participants continuing to flag sluggish internal dynamics and weak demand conditions.
Germany remains the key drag heading into year-end. According to Sentix, recessionary forces in the Eurozone’s largest economy are still “having an impact,” and those pressures are filtering through to the wider region. Until German activity finds a firmer footing, the broader recovery narrative will remain tentative at best.
ECB’s Schnabel signals rates to stay put but next move likely a hike
ECB Executive Board member Isabel Schnabel struck a subtly hawkish tone in a Bloomberg interview, saying she is “rather comfortable” with market expectations that the ECB’s next move will be a rate hike. Still, she stressed that such expectations remain uncertain and that policymakers are “not currently” focused on when the next move might occur.
Schnabel reiterated that interest rates are “in a good place” and likely to remain there absent a major shock. What has changed, however, is the balance of inflation risks—which she said has “shifted to the upside”—a shift that naturally tilts the bias toward future tightening rather than easing.
Also, Schnabel flagged the possibility that the Eurozone’s natural rate of interest may be rising. Structural forces such as AI-driven investment and stepped-up public spending could lift the equilibrium rate over time, meaning the current stance may become increasingly accommodative if not adjusted. If policy drifts into a zone that is “too accommodative,” she said, that would be the moment to consider a further rate move.
EUR/USD Gains as Market Focus Fixes on the Fed
The EUR/USD pair opened the week on a positive note, rising to 1.1653. The move was fuelled by mounting expectations for a Federal Reserve rate cut this Wednesday, which continues to weigh on the US dollar. Markets are currently pricing in an 88% probability of a 25-basis-point reduction, a significant increase from the 67% odds seen just one month ago.
However, uncertainty clouds the policy path beyond this week. A "hawkish cut" scenario also remains plausible, where Chair Jerome Powell could deliver the expected easing while simultaneously signalling a more cautious, data-dependent approach for 2026.
The data calendar will add to the volatility, starting with the delayed JOLTS job openings report for October, due Tuesday. This release will provide a crucial update on labour market tightness, including hiring, layoffs, and quit rates.
Globally, monetary policy decisions from the central banks of Australia, Brazil, Canada, and Switzerland will also be in focus this week, with all four expected to hold their benchmark rates steady.
Technical Analysis: EUR/USD
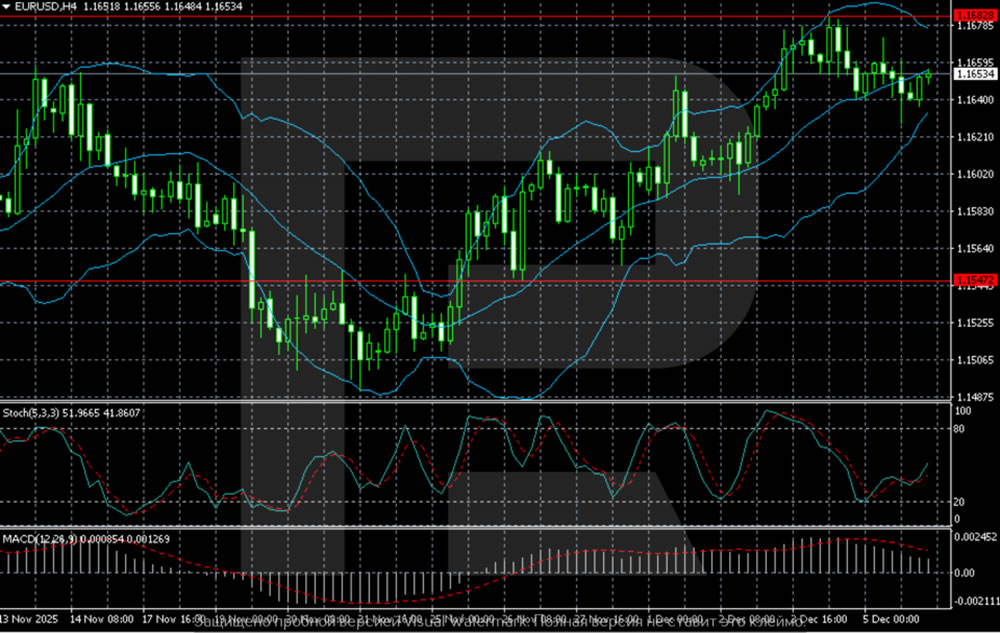
H4 Chart:
On the H4 chart, EUR/USD maintains a clear upward bias, trading just below a key resistance level at 1.1682. The pair's position above the middle Bollinger Band confirms the dominance of buyers. The gradual expansion of the upper band indicates rising volatility and suggests the market is preparing for a potential breakout attempt.
A decisive close above 1.1682 would be a significant bullish signal, opening the path towards the next major resistance zone of 1.1770–1.1780. Conversely, should a pullback occur, the nearest notable support is at 1.1547. A break below this level would signal a deeper corrective move towards the lower Bollinger Band.
H1 Chart:
On the H1 chart, the pair is consolidating after a strong impulse that tested the 1.1680 resistance. It is currently holding above a key local support level at 1.1635, from which the most recent recovery originated.
The Stochastic oscillator is in overbought territory, increasing the likelihood of a near-term pause or shallow pullback. Despite this, the broader H1 structure remains moderately bullish, with the price trading above the middle Bollinger Band and its lower band providing dynamic support.
A sustained breakout above 1.1680 would confirm a continuation of the uptrend, targeting 1.1720 and potentially 1.1750. On the downside, a failure to hold 1.1635 would be the first sign of weakening momentum, potentially triggering a correction towards the next demand zone at 1.1600–1.1580.
Conclusion
EUR/USD is trading with a firm bid ahead of a pivotal Fed meeting. While the expectation of a rate cut is providing near-term support, the central bank's forward guidance will be critical in determining the sustainability of the rally. Technically, the pair is at an inflection point, with a break above 1.1680/82 needed to unlock the next leg higher, while a hold below 1.1635 would suggest a period of consolidation or correction is due.
GBP/JPY Daily Outlook
Daily Pivots: (S1) 206.47; (P) 206.89; (R1) 207.58; More...
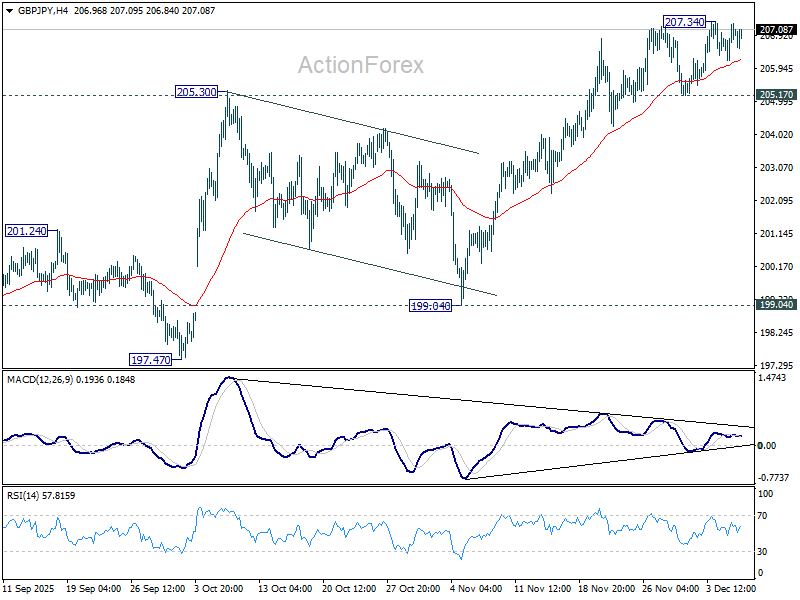
Intraday bias in GBP/JPY remains neutral for the moment, as range trading continues. Further rise is expected as long as 205.17 support holds. Break of 207.34 will resume the rally from 184.35 and target 208.09 high. However, break of 205.17 support will turn bias to the downside for deeper pullback, possibly to 55 D EMA (now at 203.38) and below.
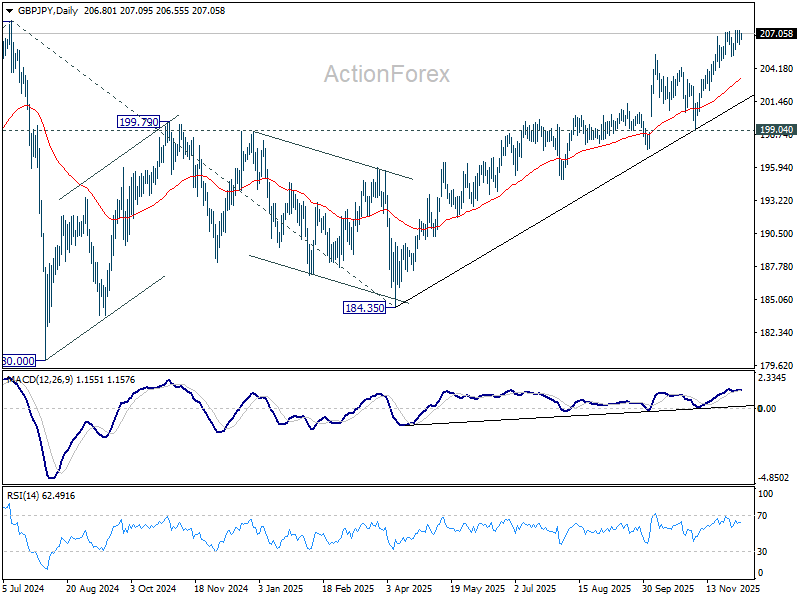
In the bigger picture, price actions from 208.09 (2024 high) are seen as a corrective pattern which might have completed at 184.35. Firm break of 208.09 high will resume the up trend from 123.94 (2020 low). Next target is 61.8% projection of 148.93 to 208.09 from 184.35 at 220.90. However, decisive break of 199.04 support will dampen this view and extend the corrective pattern with another fall.
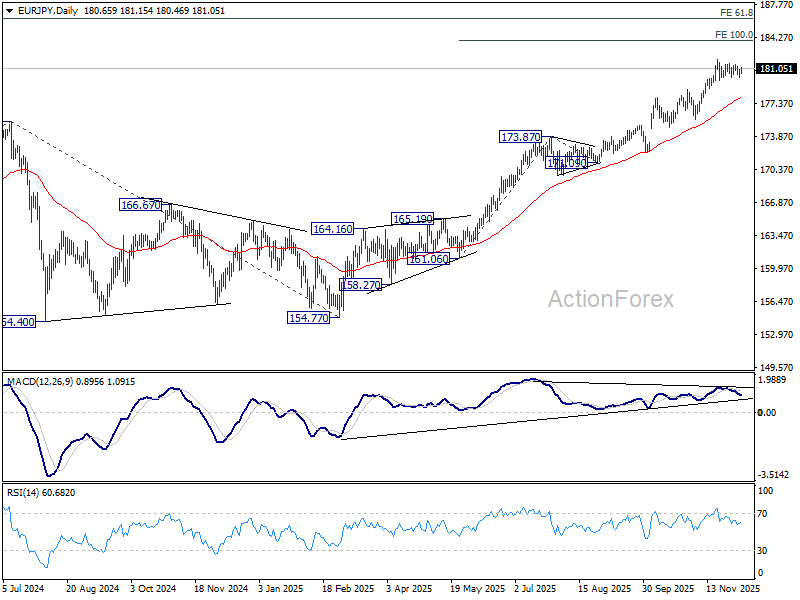
EUR/JPY Daily Outlook
Daily Pivots: (S1) 180.24; (P) 180.77; (R1) 181.14; More...
Range trading continues in EUR/JPY and intraday bias stays neutral. Further rally is expected with 179.74 support intact. On the upside, break of 181.98 will resume larger up trend to 100% projection of 161.06 to 173.87 from 171.09 at 183.90 next. However, firm break of 178.80 will argue that deeper correction is already underway towards 55 D EMA (now at 177.84).
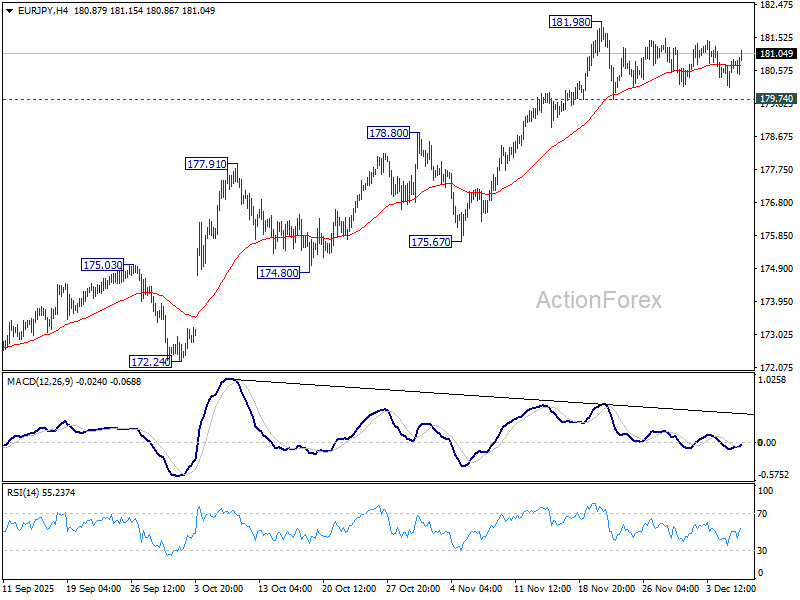
In the bigger picture, up trend from 114.42 (2020 low) is in progress and should target 61.8% projection of 124.37 to 175.41 from 154.77 at 186.31. However, considering bearish divergence condition in D MACD, upside should be capped by 186.31 on first attempt. Outlook will continue to stay bullish as long as 55 W EMA (now at 170.25) holds, even in case of deep pullback.
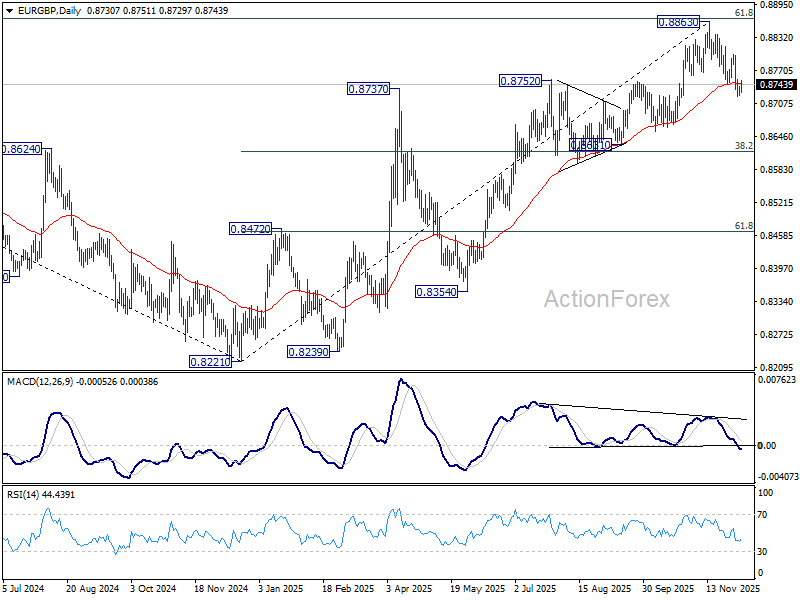
EUR/GBP Daily Outlook
Daily Pivots: (S1) 0.8725; (P) 0.8734; (R1) 0.8743; More…
Intraday bias in EUR/GBP is turned neutral with current recovery. But further decline is expected with 0.8800 resistance intact. Fall from 0.8863 should at least be a correction to the up trend from 0.8221, with risk of bearish reversal. Below 0.8270 will target 0.8631 cluster (38.2% retracement of 0.8221 to 0.8663 at 0.8618).
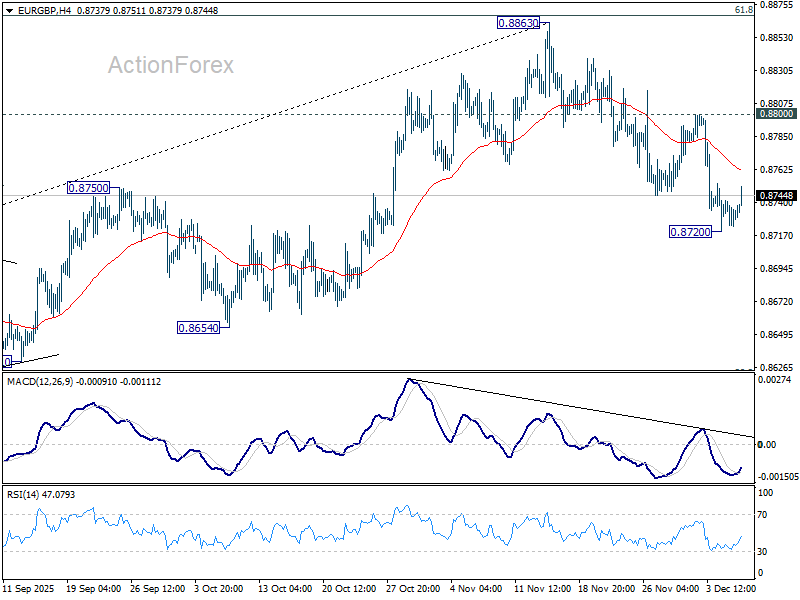
In the bigger picture, rise from 0.8221 medium term bottom is still seen as a corrective move. Upside should be limited by 61.8% retracement of 0.9267 to 0.8221 at 0.8867. Sustained trading below 55 W EMA (now at 0.8600) should confirm that this corrective bounce has completed. However, decisive break of 0.8867 will suggest that EUR/GBP is already reversing whole decline from 0.9267 (2022 high). That should pave the way back to 0.9267.
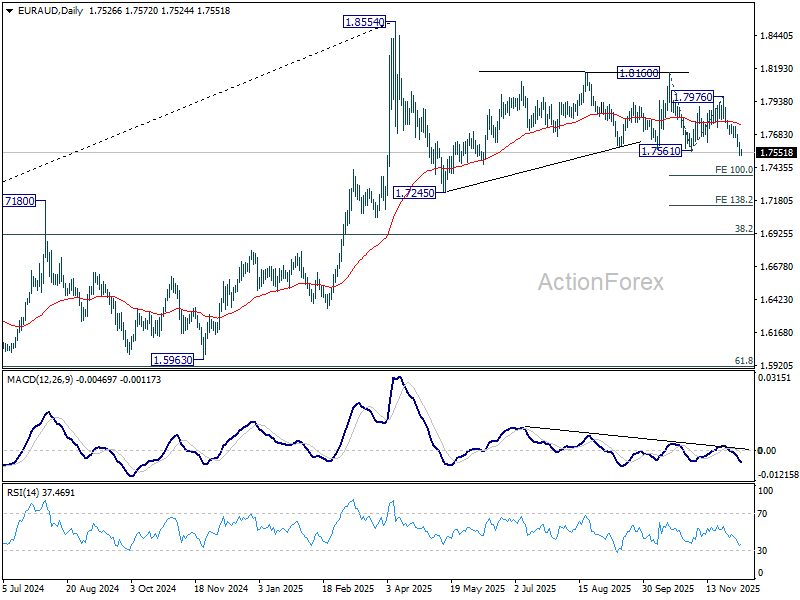
EUR/AUD Daily Outlook
Daily Pivots: (S1) 1.7499; (P) 1.7565; (R1) 1.7599; More...
Intraday bias in EUR/AUD remains on the downside at this point. Fall from 1.8160 is seen as the third leg of the pattern from 1.8554. Deeper decline should be seen to 100% projection of 1.8160 to 1.7561 from 1.7976 at 1.7377. Firm break there will pave the way to 138.2% projection at 17148. On the upside, above 1.7627 minor resistance will turn intraday bias neutral and bring consolidations first, before staging another fall.
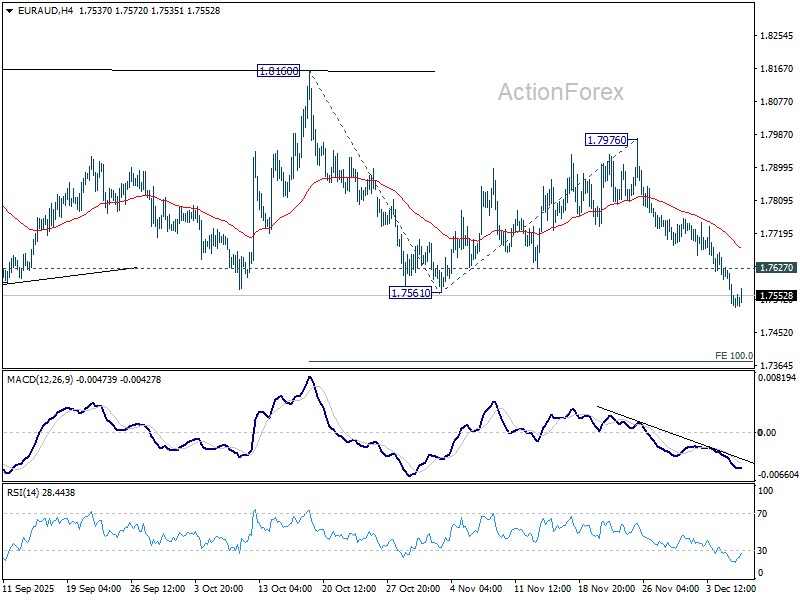
In the bigger picture, as long as 55 W EMA (now at 1.7456) holds, price actions from 1.8554 could still be a correction to rise from 1.5963 only. However, sustained break of the EMA will argue that it's already correcting the whole up trend from 1.4281 (2022 low). In this case, deeper decline would be seen to 38.2% retracement of 1.4281 to 1.8554 at 1.6922.
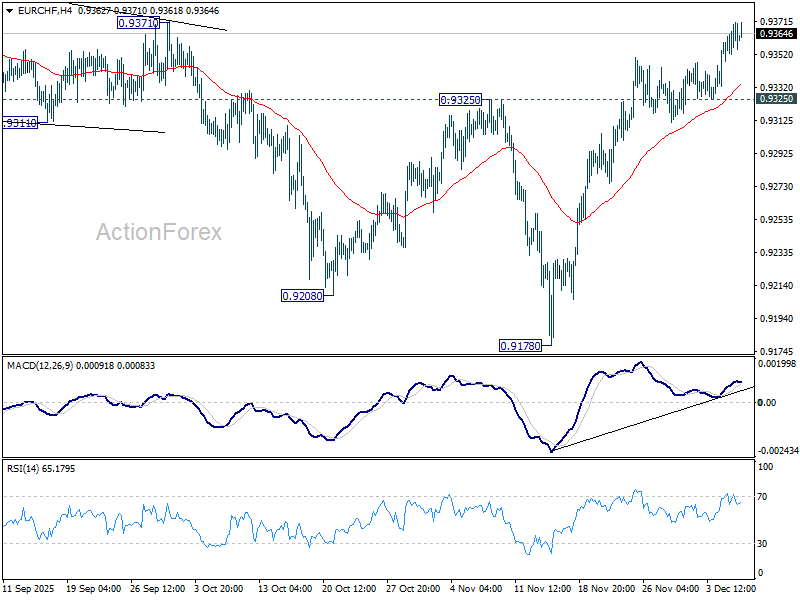
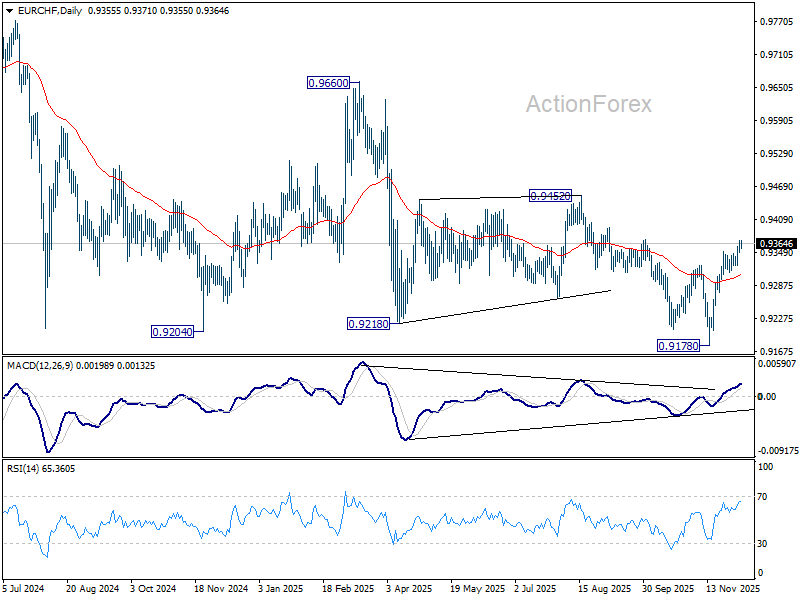
EUR/CHF Daily Outlook
Daily Pivots: (S1) 0.9354; (P) 0.9363; (R1) 0.9378; More....
Intraday bias in EUR/CHF stays on the upside, as rise from 0.9178 is in progress for 0.9452 key structural resistance. Decisive break there will carry larger bullish implications. For now, risk will stay on the upside as long as 0.9325 support holds, in case of retreat.
In the bigger picture, EUR/CHF has breached long term falling channel resistance as the rebound from 0.9278 extends. Considering bullish convergence condition in W MACD, sustained trading above 55 W EMA (now at 0.9372) will indicate medium term bottoming, and suggests that it's already in larger scale rebound. Further break of 0.9452 resistance will bring stronger medium term rally towards 0.9228 resistance next. Nevertheless, rejection by 55 W EMA will retain bearishness for another fall through 0.9278 at a later stage.
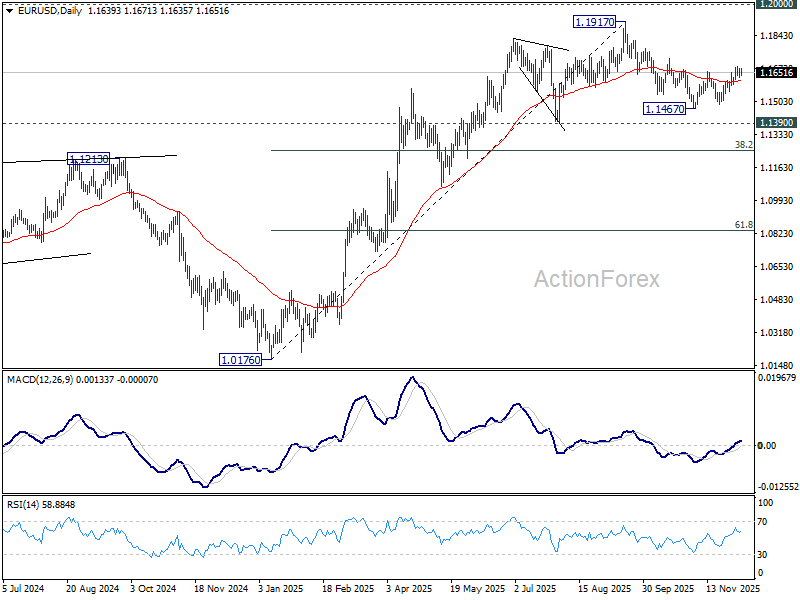
EUR/USD Daily Outlook
Daily Pivots: (S1) 1.1624; (P) 1.1648; (R1) 1.1668; More….
Intraday bias in EUR/USD stays neutral, and further rally is in favor with 1.1590 minor support intact. Corrective fall from 1.1917 could have completed at 1.1467. Above 1.1681 will target 1.1727 resistance first. Firm break there will solidify this case and bring retest of 1.1917 high. However, break of 1.1590 will revive near term bearishness, and bring retest of 1.1467 low.
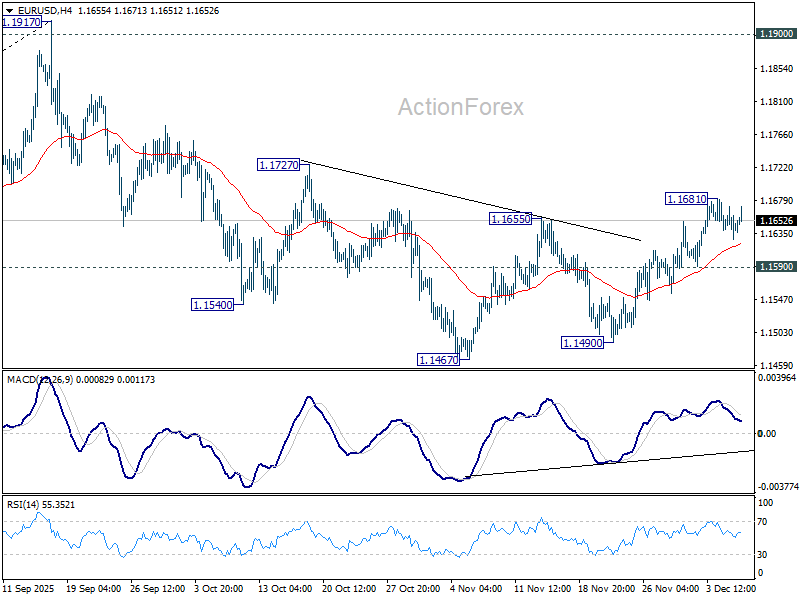
In the bigger picture, as long as 55 W EMA (now at 1.1346) holds, up trend from 0.9534 (2022 low) is still in favor to continue. Decisive break of 1.2 key psychological level will carry larger bullish implication. However, sustained trading below 55 W EMA will argue that rise from 0.9534 has completed as a three wave corrective bounce, and keep long term outlook bearish.