
Sample Category Title
AUD/USD Daily Report
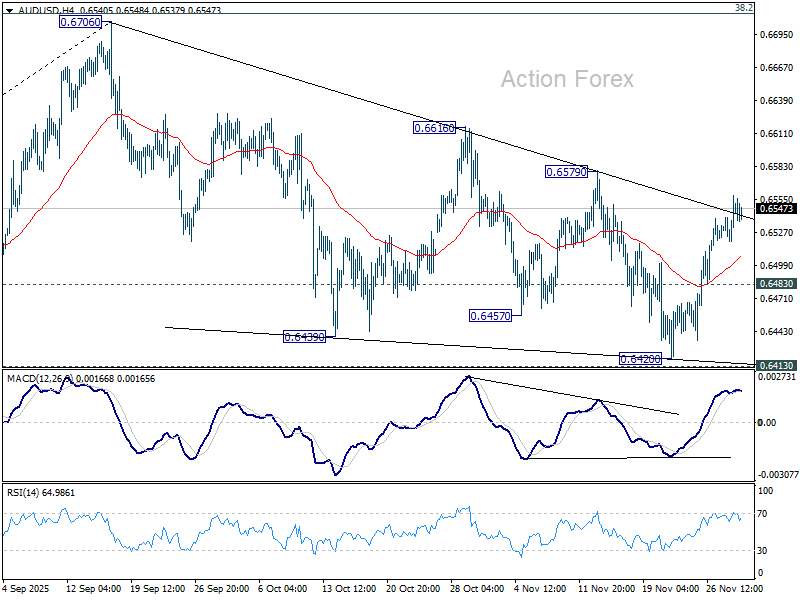
Daily Pivots: (S1) 0.6530; (P) 0.6545; (R1) 0.6568; More...
No change in AUD/USD's outlook. Intraday bias remains on the upside for 0.6579 resistance. Decisive break there should confirm that whole fall from 0.6706 has completed as a three wave correction. Stronger rally should then be seen back to retest 0.6706. On the downside, however, below 0.6483 minor support will turn intraday bias back to the downside for 0.6413 key support.
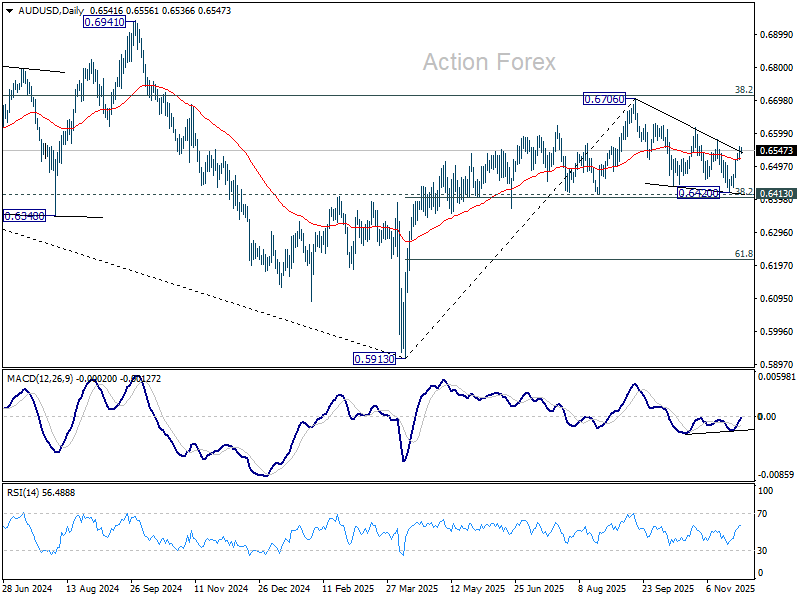
In the bigger picture, there is no clear sign that down trend from 0.8006 (2021 high) has completed. Rebound from 0.5913 is seen as a corrective move. Outlook will remain bearish as long as 38.2% retracement of 0.8006 to 0.5913 at 0.6713 holds. Break of 0.6413 support will suggest rejection by 0.6713 and solidify this bearish case. Nevertheless, considering bullish convergence condition in W MACD, sustained break of 0.6713 will be a strong sign of bullish trend reversal, and pave the way to 0.6941 structural resistance for confirmation.
EUR/USD Daily Outlook
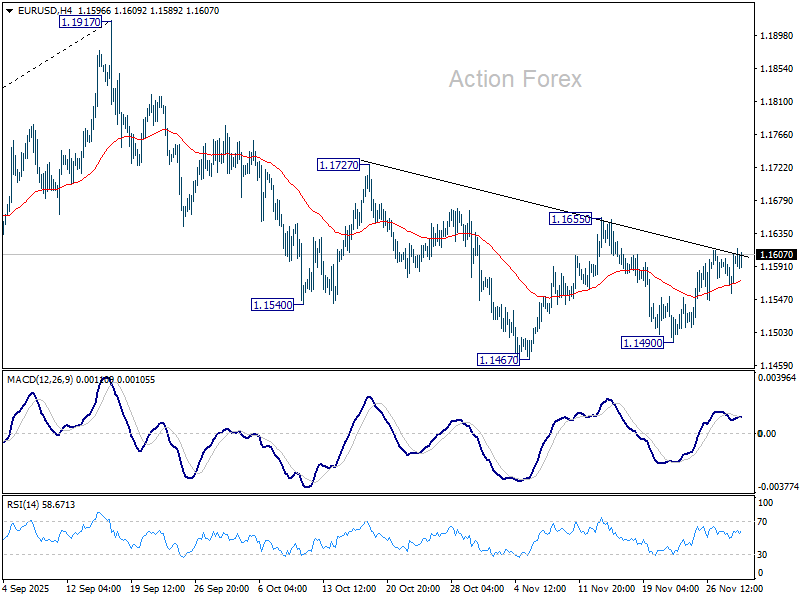
Daily Pivots: (S1) 1.1568; (P) 1.1587; (R1) 1.1619; More…
Range trading continues in EUR/USD and intraday bias stays neutral. With 1.1655 resistance intact, further decline is still expected. On the downside, below 1.1490 and 1.1467 will resume the whole decline from 1.1917 high. Next targets are 1.1390, and then 38.2% retracement of 1.0176 to 1.1917 at 1.1252. However, decisive break of 1.1655 will argue that fall from 1.1917 has completed, and turn bias back to the upside for 1.1727 resistance and above.
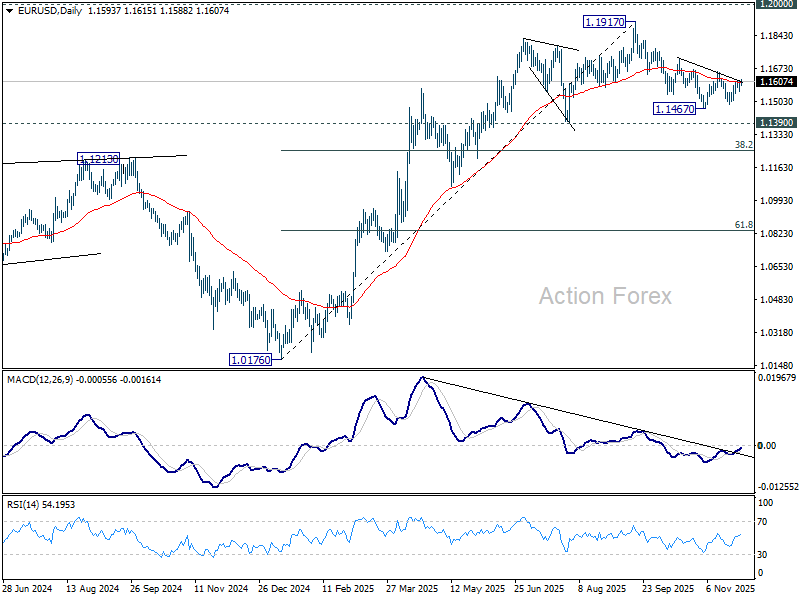
In the bigger picture, considering bearish divergence condition in D MACD, a medium term top is likely in place at 1.1917, just ahead of 1.2 key psychological level. As long as 55 W EMA (now at 1.1345) holds, the up trend from 0.9534 (2022 low) is still in favor to continue. Decisive break of 1.2000 will carry larger bullish implications. However, sustained trading below 55 W EMA will argue that rise from 0.9534 has completed as a three wave corrective bounce, and keep long term outlook bearish.
GBP/USD Daily Outlook
Daily Pivots: (S1) 1.3204; (P) 1.3229; (R1) 1.3258; More...
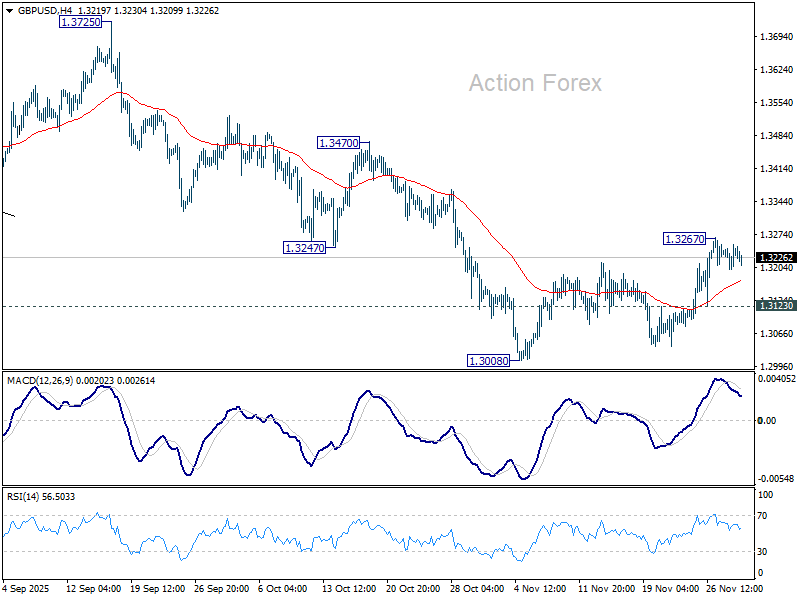
Intraday bias in GBP/USD remains neutral first. On the upside, break of 1.3267 will resume the rebound from 1.3308. Sustained trading above 55 D EMA (now at 1.3265) should confirm that fall from 1.3787 has completed as a correction. Further rise should then be seen to 1.3725/3787 resistance zone. Nevertheless, break of 1.3123 minor support will revive near term bearishness, and bring retest of 1.3008.
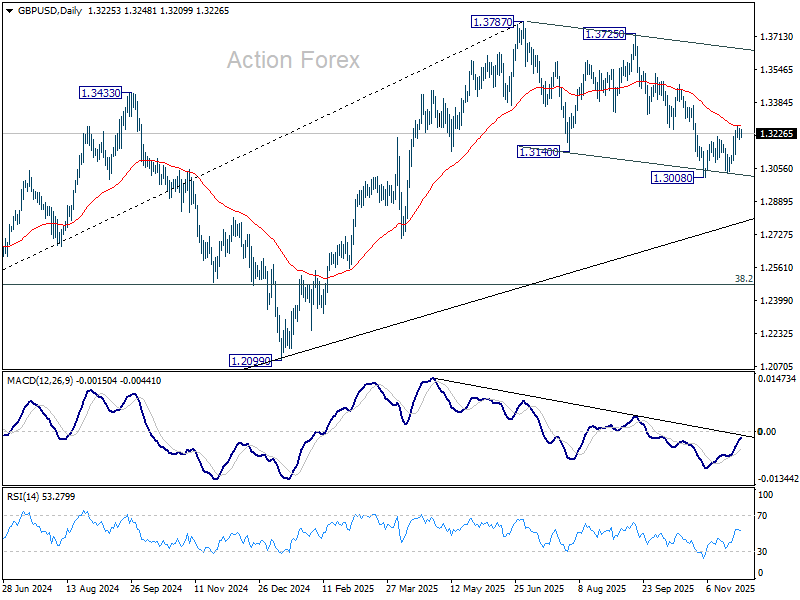
In the bigger picture, the break of 55 W EMA (now at 1.3184) is taken as the first sign that corrective rise from 1.0351 (2022 low) has completed. Decisive break of trend line support (now at 1.2760) will solidify this case and target 38.2% retracement of 1.0351 to 1.3787 at 1.2474 next. Meanwhile, in case of another rise, strong resistance should emerge below 1.4248 (2021 high) to cap upside to preserve the long term down trend.
USD/CHF Daily Outlook
Daily Pivots: (S1) 0.8019; (P) 0.8046; (R1) 0.8064; More…
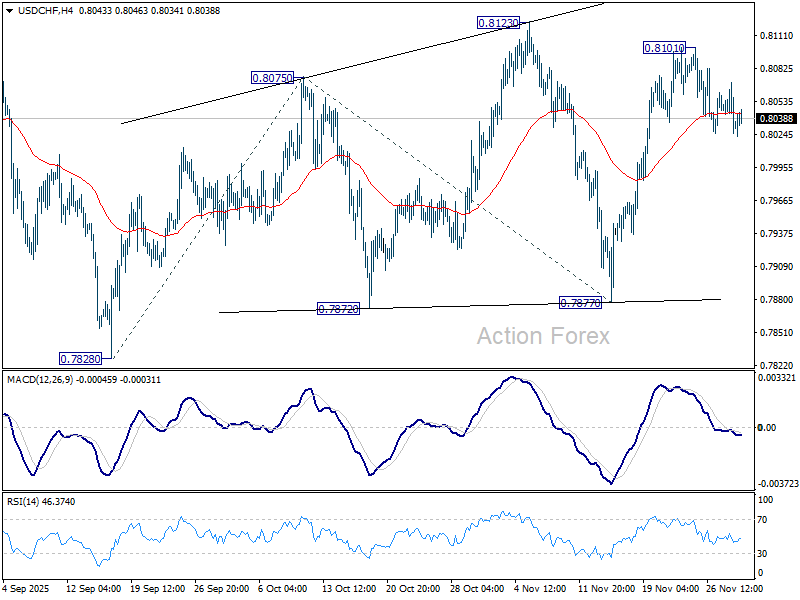
USD/CHF is staying in consolidations below 0.8101 and intraday bias stays neutral. Rise from 0.7877 is still seen as the third leg of the corrective pattern from 0.7828 low. Above 0.8101 will target 0.8123 resistance, and then 138.2% projection of 0.7828 to 0.8075 from 0.7877 at 0.8218. However, sustained break of 55 D EMA (now at 0.8015) will bring deeper fall back to 0.7877 support instead.
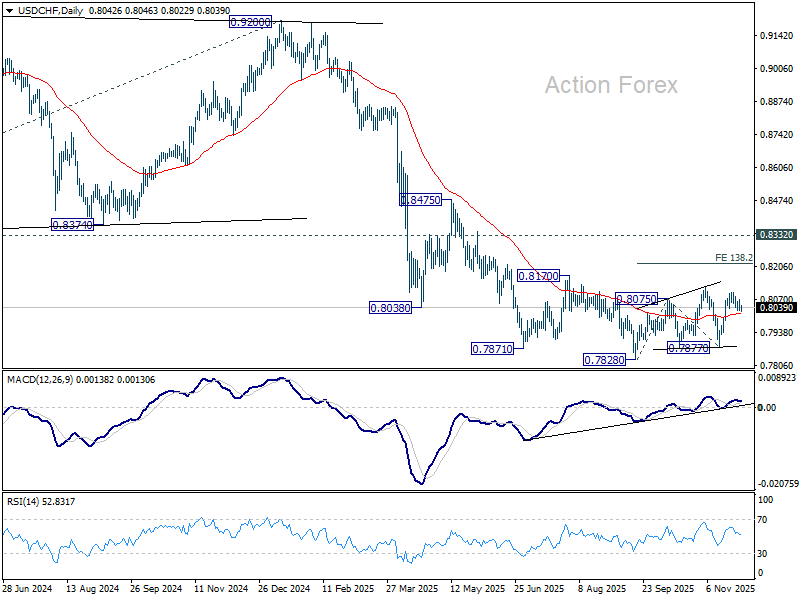
In the bigger picture, long term down trend from 1.0342 (2017 high) is still in progress. Next target is 100% projection of 1.0146 (2022 high) to 0.8332 from 0.9200 at 0.7382. In any case, outlook will stay bearish as long as 0.8332 support turned resistance holds (2023 low).
Japanese Yen Performing Strongly
Markets
US stock markets ended a low-volume, shortened after-Thanksgiving-trading session in the green with gains between 0.54-0.65% for the main indices. European equities overcame early weakness to finish 0.3% higher (EuroStoxx50). Last week’s moves, particularly in the US, called off the threat of equity markets turning into a sell-on-upticks pattern. US yields rose up to 2.8 bps with the belly of the curve underperforming the wings. The 10-yr tenor struggled around but eventually closed north of the 4% barrier. European rates traded listless. A mixed bag of national inflation numbers failed to inspire bond markets: the French and Italian November edition fell short of bar while Spain and Germany slightly topped it. It means tomorrow’s European figure (-0.3% m/m, 2.1% y/y) should come in close to expectations. Not that it matters for ECB policy. President Lagarde last Friday noted that interest rates at 2% are at the correct level. Her comments follow similar remarks coming from VP de Guindos earlier in the week. Lagarde struck a positive tone on the economy and won’t be surprised if growth, which already exceeded expectations, would “end up even higher by the end of the year”. A UK gilts (short-term, in our view) relief rally brought the likes of the 30-yr towards their end-October/November lows which, in turn, are the lowest levels since June of this year. UK Chancellor Reeves’ budget eased concerns for long-term bonds somewhat, mainly by installing a much bigger fiscal buffer and by a planned shift towards more short-dated debt, including a potential expansion to UK Treasury bills. But the “spend now, pay later” attitude will be coming back to haunt public finances. Sterling’s recovery seems to run into resistance around EUR/GBP 0.875 already with the pair this morning moving back north of the July high (0.8769). Cable (GBP/USD) trades above 1.32. Along with local stock markets, the euro gradually recovered against the USD on Friday. EUR/USD rebounded from intraday lows around 1.156 back to 1.16. The pair remains technically trapped though with little on the agenda today able to break the deadlock. The US manufacturing ISM is on tap. The services print is due Wednesday, along with the ADP job report. PCE deflators are up on Friday but the payrolls report remains missing as a consequence of the previous shutdown. The Japanese yen is performing strongly, pushing USD/JPY towards 155.6 and EUR/JPY to 180.45 following Ueda. The Bank of Japan governor in a speech seen as an advance notice for a rate hike said they’ll be considering all pro’s and cons for such a move in December, bombarding it to a live meeting. Ueda also warned about the risks of delaying a hike for too long. Short-term Japanese yields rise 4-5 bps with the 2-yr yield hitting 1% for the first time since 2008.
News & Views
Rating agency Moody’s confirmed the Hungarian credit rating at Baa2 with a negative outlook. Moody’s lowered its real GDP growth forecasts for this year and next from 1% and 2.8% to 0.5% and 2.3%. High dependence on the automotive sector and the German economy is negatively affecting exports, while the reduction in public investment spending against the backdrop of blocked EU funds is also weighing on growth. Because of wider deficits (5% of GDP in 2025 & 2026) and slower growth, Moody’s now projects a slight increase in the debt burden to around 74% of GDP in 2025 and 2026, from 73.5% in 2024. The negative outlook reflects downside risks related to the quality of Hungary's institutions and governance, which could lead to a substantial loss of committed EU funds, weakening the economy's growth prospects beyond what Moody’s currently expects. In turn, this could further weaken fiscal and debt metrics. In addition, given the still high reliance of Hungary on energy imports from Russia, a prolonged energy supply disruption would also be credit negative, although this risk has recently been mitigated by the one-year exemption on sanctions on Russian energy agreed with the US administration. The Hungarian forint is unmoved by the expected decision with EUR/HUF (382) holding near lowest levels since early 2024.
The Organization of the Petroleum Exporting Countries and its allies (OPEC+) confirmed at the 40th OPEC and non-OPEC Ministerial Meeting to pause production increases in Q1 2026 as stability primes regaining market share for the moment in a market leaning towards a global surplus. They also approved a mechanism to assess participating countries’ maximum sustainable production capacity to be used as reference for the 2027 production baselines for all countries. The next official OPEC meeting is scheduled for June 7, 2026. A Joint Ministerial Monitoring Committee meeting to closely review global oil market conditions, oil production levels and the level of conformity of countries will continue to be held every two months. Brent crude prices rise this morning on the decision, trading currently around $63.5/b from a $62/b closing level last week.
The Day Ueda Ruined the Mood
December is finally here. Last month ended on a positive note – with a solid reversal of the early-November losses on one single bet: that the Federal Reserve (Fed) would cut interest rates in December. US traders came back from their Thanksgiving break to a market paralysed by a tech issue on Friday, but the problem was quickly resolved, trading resumed and the S&P 500 closed both the week – and the month – just a few points below an ATH. The November dip only shaved about 5% off the index, and those losses have almost been fully recovered. European stocks outperformed thanks to their lower exposure to tech – the major driver of the recent rallies, but also a potential major driver of any future meltdown. Gold, Bitcoin, US Treasuries – everything rallied last week.
But worries persist that the Fed may be rushing toward a rate cut without solid data in hand, and that valuations have run ahead of themselves. Those concerns will only grow if the Fed cuts and the rally continues into year-end. The Q ratio, which measures the market value of a company or the overall stock market relative to the replacement cost of its assets, hit an ATH last month, as well. In plain English: we are living incredibly exciting times with AI – but also facing very expensive stock prices compared with the real, physical value of companies’ assets.
This week starts on a rather miserable note – perhaps the return from Thanksgiving is less cheerful than expected. Shoppers in the US spent almost $12bn during the shopping festival, up around 4%, but once you strip out the roughly 3% inflation rate, the real growth is modest – which is actually good news. It suggests that consumers are spending more carefully, price pressures may ease and the Fed could cut rates more confidently.
But risk appetite – judging from the price action in the Nikkei and Bitcoin – doesn’t look great. And one man is largely responsible for that: Kazuo Ueda, the head of the Bank of Japan (BoJ), who said today that the bank “will consider the pros and cons of raising the policy interest rate and make decisions as appropriate” and that “any hike would merely be an adjustment in the degree of easing.” In other words, they remain far behind the curve, and normalization is calling – even more loudly as Takaichi’s policy measures risk pushing Japan’s inflation even higher.
The result is a bloodbath in Japanese assets. The Nikkei is down nearly 2% this morning on rising bets that the BoJ will hike at the next meeting – despite soft PMI data. The Japanese 10-year yield is at a fresh multi-decade high near 1.87% this morning, which is very high relative to the 1.71% level often referenced as the point at which Japan’s era of “free liquidity” effectively ends. Around $3.4 trillion circulates in global markets from Japanese investors seeking higher returns abroad – capital that could simply be repatriated as domestic yields rise.
From an economist’s perspective, hiking interest rates – and counterbalancing Takaichi’s fiscal push – is exactly what the BoJ should be doing. This is why central banks exist: to offset politically motivated, growth-at-all-costs fiscal impulses. BUT if the BoJ hikes, Japanese yields will rise, and Japanese capital could leave a significant hole in the global financial system at a time when everyone is wondering whether we haven’t pushed the AI-driven rally too far.
This is why US 10-year yields jumped at the weekly open – that, and of course the ballooning US debt, which should theoretically push the Fed toward the same kind of thinking as their Japanese counterparts.
So, December could prove more challenging than many expected – especially for those who thought last month’s 5% dip was the long-awaited correction. With Fed funds futures pricing nearly a 90% chance of a 25bp cut, there isn’t much room left for additional dovish fuel.
On the contrary, incoming data could warn that a premature Fed rate cut that ignores inflation risks won’t be the answer. So pray: pray for this week’s PCE and inflation-expectations data to look soft enough to keep dovish expectations alive. Traders are also watching gold and the Swiss franc – both potential beneficiaries if the selloff deepens.
Potentially not helping sentiment: US crude is up more than 2% this morning as OPEC reiterated yesterday that they want to stabilise oil prices into next year, implying tighter control of output to address the supply glut that has weighed on prices – except during brief periods of geopolitical tension. And even those tensions haven’t been enough lately to bring buyers back, which shows how much oil is currently sloshing around the planet. As discussed in previous reports, OPEC alone can’t reverse the broader negative price dynamic, but it can help put a floor under the latest selloff. WTI is testing $60pb this morning, but prices need to climb above $65pb for the technicals to confirm an end to the bearish trend.
PMIs Underscore Persistent Headwinds in Chinese Manufacturing
In focus today
In the US, the November ISM Manufacturing index is due for release today. Leading manufacturing indicators have sent mixed signals so far, with the flash PMI declining slightly and regional Fed indices improving modestly. Even though the most important US labour market and inflation data points have been postponed beyond the Fed's next meeting on 10 December, markets will keep a close eye on this week's releases in light of the still uncertain rate decision. Market pricing is clearly leaning towards another rate cut next week, but the decision is not yet set in stone with around 80% probability priced in.
In Sweden, the November manufacturing PMIs are released today. Sweden has managed to deviate on the upside compared to European outcomes for the last two years. The October levels of 55.1 were driven mainly by strong domestic activity, whereas foreign orders showed somewhat benign levels. Sweden is therefore dependent on improved foreign activity to see a further rise in the manufacturing PMIs, whereas a cool-down of domestic activity could result in a risk for a drop in the aggregated levels.
In Norway, focus also turns to the release of November PMIs. Both the PMI and the actual production figures have pointed to a slowdown in manufacturing. We believe the underlying trend is pointing downward, driven by gradually lower activity in the oil-related industry.
The rest of the week, focus turns to the US ADP employment for November as well as the September PCE inflation. In the euro area, we receive the aggregate inflation print, and the ECB's preferred measure of wage growth for the third quarter. Especially the wage growth will be interesting for the ECB as it is what keeps inflation from falling below target currently.
Economic and market news
What happened over the weekend
In China, official manufacturing PMI rose slightly to 49.2 in November (cons: 49.2, prev: 49.0), but remained in contraction for the eighth consecutive month, while the private RatingDog manufacturing PMI surprised to the downside, falling back below 50 to 49.9 (cons: 50.5, prev: 50.6). Despite a trade truce with the US from October boosting export orders to an eight-month high, sluggish domestic demand weighed on overall activity. Policymakers are expected to delay major stimulus measures until 2026, with markets now focused on policy signals from December's Central Economic Work Conference.
In the US, Trump noted over the weekend that he has decided on this nominee for Federal Reserve Chair, who he expects to deliver rate cuts. His chief economic advisor Kevin Hasset is seen as the most likely choice.
In Japan, BoJ Governor Ueda signalled the possibility of a rate hike at the December policy meeting, citing improving economic conditions and sustained wage growth as key factors. Ueda emphasised that a rate hike would represent "easing off the accelerator" rather than "applying the brakes," but left room to delay the decision. We expect the BoJ to deliver its next hike in December. His remarks pushed the yen higher and Japanese government bond yields to a 17-year high, while the Nikkei fell more than 1.5%, reflecting concerns over tighter monetary policy and fiscal uncertainties under Prime Minister Takaichi.
In the euro area, inflation data for November was mixed on Friday. German HICP inflation rose to 2.6% y/y (cons: 2.4%), but we expect euro area inflation released on Tuesday to stay flat at 2.1% y/y (cons: 2.1%) due to lower-than-expected prints in France and Italy. Despite the mixed signals, inflation remains above the ECB's Q4 forecast, and with growth holding up and a strong labour market, we see the ECB maintaining its policy stance in December.
In Norway, retail sales increased by 0.1% m/m in October, falling short of our expectation of 0.5% m/m. The three-month moving average rose by 0.5%, but the data remains somewhat disappointing, with no clear signs of any positive impact from the rate cuts earlier this year in June and September. Meanwhile, the labour market showed slight signs of weakening, as the seasonally adjusted unemployment rate remained unchanged at 2.2% in November, but the number of unemployed persons increased by 350.
In Sweden, GDP grew by 1.1% q/q and 2.6% y/y in Q3, exceeding our expectations of 0.9% q/q and 1.7% y/y. The strong performance was primarily driven by household consumption, with additional support from growth in exports and gross fixed capital formation.
On geopolitics, President Trump declared the airspace above and around Venezuela "closed in its entirety," raising geopolitical tensions in the region. The announcement, which follows months of US military activity near Venezuela, was condemned by Maduro's government and criticised by international partners such as Iran. While the move reflects heightened pressure on Maduro, its lack of clarity has created uncertainty, with markets likely to monitor developments closely.
Furthermore, US Secretary of State Marco Rubio expressed optimism for progress during weekend talks with Ukrainian officials in Florida, emphasising the importance of securing Ukraine's sovereignty and future prosperity. Ukraine's delegation was led by new negotiator Rustem Umerov, who replaced Andriy Yermak following his resignation amid a corruption scandal. Umerov described the discussions as productive and praised the US for its continued support. The talks follow previous negotiations in Geneva, with Special Envoy Steve Witkoff now set to travel to Moscow for further discussions with Russian counterparts later this week.
Equities: Equities extended their gains on Friday, giving us five consecutive up-days and leaving the week more than 3% higher. Once again, the pattern is clear: in an environment with broadly supportive macro fundamentals, it rarely pays to chase weakness, and equity drawdowns tend to stall around the 5% mark. As expected, cyclicals outperformed defensives last week by around 2%, although on a 1- and 3-month horizon defensives are still ahead thanks to the exceptionally strong run in healthcare. Investor sentiment also turned quickly last week, with the VIX dropping from 20 to 16, pushing us into the "complacency zone." Given the macro backdrop, low implied vol is not unusual. In the US on Friday Dow +0.6%, S&P 500 +0.5%, Nasdaq +0.7%, Russell 2000 +0.6%. Asian trading is mixed this morning, with the Nikkei down just over 2%, while Chinese equities trade higher. European and US futures point lower.
FI and FX: Yields climbed across regions at the end of last week in a bearish steepening across curves. European yields were relatively unscathed by regional inflation data for November out Friday with the final euro area inflation print set to remain flat on Tuesday, in line with expectations. EUR/USD ended the week breaching the 1.16 level with a string of data releases in focus from both the euro area and the US the coming week. Markets will be especially attentive to any news of Trump's nominee for Fed Chair, which he has stated that he has decided on, and that he expects to deliver rate cuts. 10Y Gilts yields ended the week roughly 10bp lower and EUR/GBP slightly lower as the Autumn Budget failed to spur a sell-off in UK markets. OPEC confirmed its intention to keep oil output steady in Q1 next year, leaving oil to trade around the 60 USD/bbl mark.
USD/JPY Daily Outlook
Daily Pivots: (S1) 155.91; (P) 156.25; (R1) 156.52; More...
USD/JPY dips low today as corrective pullback from 157.88 extends. While further fall cannot be ruled out, downside should be contained by near term channel support (now at 154.12) to bring rebound. Above 156.71 minor resistance will turn bias back to the upside. Further break of 157.88 will resume the whole rally from 139.87. Next target is 158.86 structural resistance, and then 161.94 high. However, firm break of the channel support will bring deeper correction to 55 D EMA (now at 152.86).
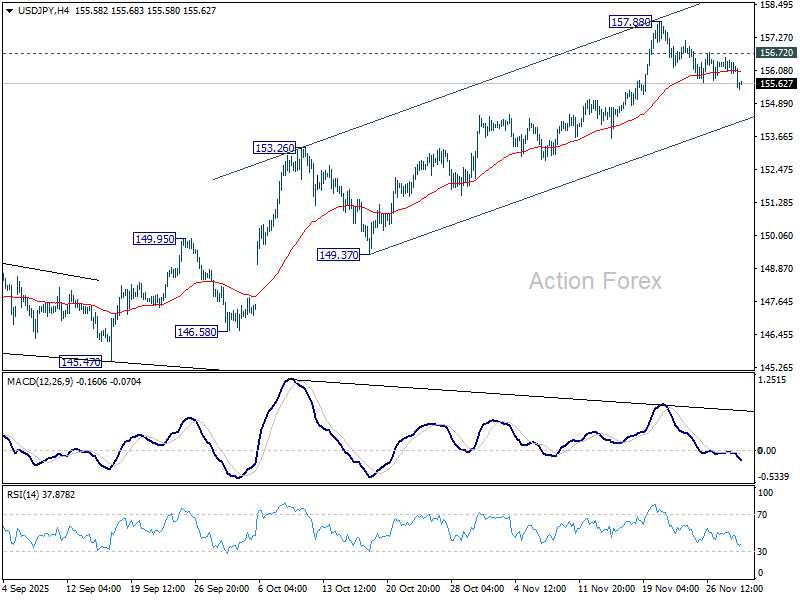
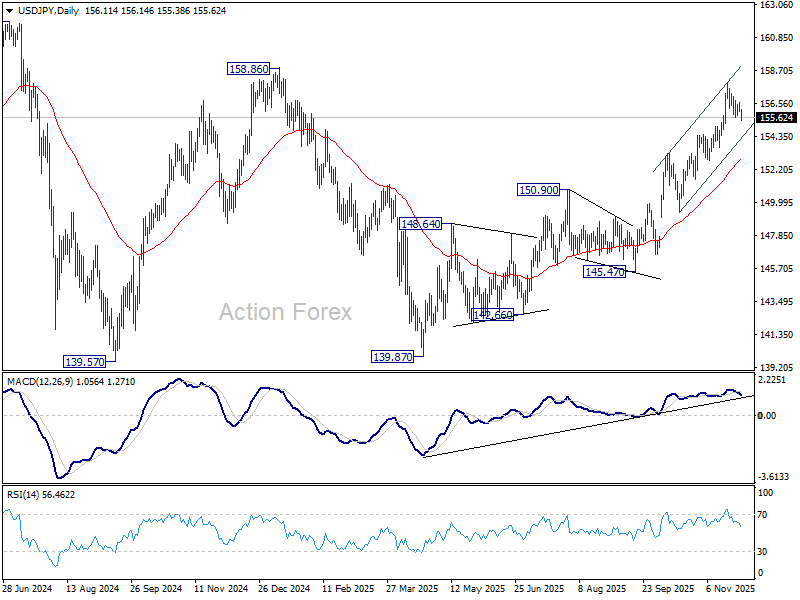
In the bigger picture, current development suggests that corrective pattern from 161.94 (2024 high) has completed with three waves at 139.87. Larger up trend from 102.58 (2021 low) could be ready to resume through 161.94 high. Decisive break of 158.85 structural resistance will solidify this bullish case and target 161.94 for confirmation. On the downside, break of 150.90 resistance turned support will dampen this bullish view and extend the corrective range pattern with another falling leg.
BoJ Hike Back in Play After Ueda Comments; Yen Surge and 10Y JGB Yield Breakout
Risk aversion returned to Asia at the start of December, lifting Yen sharply across the board. The shift in sentiment coincided with a notable surge in Japanese government bond yields, with the 10-year jumping nearly 0.07 and breaking above 1.87%, its highest level in more than 15 years. .
A key catalyst was Governor Kazuo Ueda’s comments that the BoJ will weigh the “pros and cons” of raising interest rates at the December 18–19 meeting. While not definitive, the remark reintroduced the possibility of a near-term hike after weeks of speculation that political pressure might push the BoJ toward postponement.
Ueda’s position appears to have held firm following his meeting with Prime Minister Sanae Takaichi and senior economic officials last month, calming speculation that political considerations would force a delay. His tone today aligned with increasingly hawkish views emerging within the board, further reinforcing expectations that normalization remains a live discussion.
Even so, a December move is far from assured. The BoJ continues to emphasize wage trends, underlying inflation, and the durability of Japan’s recovery. But today’s developments likely nudge expectations toward either a December or, more plausibly, a January hike rather than a later timeline. Markets have quickly repriced that risk.
In currency markets, Yen is the clear outperformer today so far, followed by Dollar and then Euro. At the opposite end, Aussie is the weakest performer, with Swiss Franc and Kiwi also under some pressure. Sterling and Loonie are trading in the middle of the pack as cross-flows remain largely driven by Japan’s moves.
Whether these rankings hold through the session will depend on how long Japan-led risk aversion persists once Europe and the US open. Equity futures and broader risk assets will likely determine whether today's defensive positioning extends into the next trading window or moderates as global liquidity increases.
Looking ahead, US data will dominate the week. A busy slate—ISM Manufacturing and Services, ADP employment, and personal income and spending with PCE inflation—will help refine expectations for early-2026 Fed policy. Additional releases, including Eurozone and Swiss CPI, Australia Q3 GDP, and Canada employment, round out the week.
In Asia, at the time of writing, Nikkei is down -1.96%. Hong Kong HSI is up 0.72%. China Shanghai SSE is up 0.50%. Singapore Strait Times is up 0.22%. Japan 10-year JGB yield is up 0.069 at 1.876.
Ueda signals December hike debate as BoJ reviews wage momentum
BoJ Governor Kazuo Ueda said the board will actively debate the “pros and cons” of raising interest rates at its December 18–19 meeting. He emphasized that the bank is now focused on whether firms’ "active wage-setting behavior" will persist, calling it a key determinant of the timing of the next hike.
Ueda noted that even with an increase, real interest rates would remain deeply negative, meaning policy would still be accommodative—more akin to “easing off the accelerator” than “applying the brakes.”
On the Yen, Ueda said Monday that further weakness is likely to push consumer inflation higher, a development that requires close monitoring when setting policy.
Japan's PMI manufacturing finalized at 48.7, contraction eases and confidence hits year high
Japan’s Manufacturing PMI was finalized at 48.7 in November, slightly above October’s 48.2, but still pointing to contraction. S&P Global’s Annabel Fiddes noted that conditions remained challenging, with firms reporting “another solid decline” in new business as demand stayed weak across both domestic and external markets..
Despite the soft order flow, sentiment improved meaningfully. Business confidence rose to the strongest level since the start of the year, supported by expectations that market conditions will begin stabilizing in 2026. That optimism translated into a further rise in employment, with firms hiring in anticipation of a longer-term recovery in activity.
A key focus now shifts to the government’s newly announced stimulus package—the largest since the pandemic—which aims to accelerate investment in strategic sectors such as AI. Its success in lifting demand will be critical in determining whether the manufacturing sector can move out of contraction after a long period of subdued momentum.
China RatingDog PMI slips into contraction at 49.9 as production, demand stall
China’s RatingDog PMI Manufacturing fell back into contraction in November, dropping from 50.6 to 49.9 and missing expectations of 50.5. Founder Yao Yu said both production and demand slowed to levels near stagnation. While new export orders improved, the pickup was not enough to offset sluggish domestic demand, leaving overall new orders almost flat.
The loss of momentum weighed on hiring, purchasing activity, and inventory decisions. Manufacturers scaled back their workforce and procurement while adopting more cautious stock management. Inventories of raw materials and finished goods both declined, with the average inventory level hitting its lowest point in nearly three years. Also, raw material inventories fell for the first time in seven months. Pricing indicators also highlighted pressure on margins, with input prices rising while output prices continued to fall.
Official data released over the weekend offered mixed signals. NBS PMI Manufacturing edged up from 49.0 to 49.2, in line with expectations, hinting at modest stabilization. However, Non-Manufacturing PMI slipped from 50.1 to 49.5—the sector’s first contraction since December 2022—showing that weakness is now spreading beyond factories and reinforcing concerns about China’s softer near-term growth path.
Silver extends record run and targets 60, leaving Gold lagging in range
Silver’s outperformance against Gold continued into December, with the metal surging to another record high late last week and extending gains in Asian trading today. The rally highlights a stark divergence within precious metals: while Silver pushes into uncharted territory, Gold remains trapped in its near-term range and capped well below its own record.
The strength in Silver reflects a powerful intersection of tight supply, firm physical demand, and intensifying industrial needs. Over the past year, the market’s underlying surplus has flipped into deficit, driven partly by the electrification of the vehicle fleet, rapid growth in artificial intelligence infrastructure, and continued expansion in photovoltaic applications. Together, these structural forces have pushed consumption higher while supply has struggled to keep pace.
Silver’s inherent material advantages—high thermal and electrical conductivity—make it difficult to substitute in EVs, advanced semiconductors, AI cooling systems, and solar technologies. With demand from these sectors accelerating and tariff-related distortions supporting domestic sourcing, investors have increasingly viewed Silver as a standout industrial-precious hybrid with strong forward momentum.
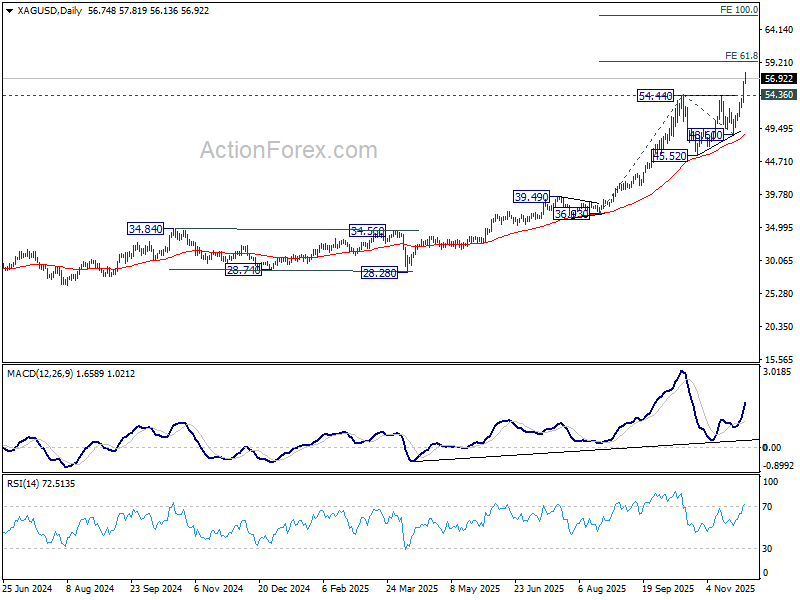
Technically, the breakout is equally convincing. Spot silver resumed its powerful uptrend by clearing the 54.44 resistance level and has now printed a fresh all-time high at 57.81. The next major upside zone sits at 61.8% projection of 36.93 to 54.44 from 48.60 at 59.4. The psychological 60 handle may cap the advance temporarily, but the broader trend remains decisively bullish as long as 54.36—now key support—holds. Sustained trading above 60 would open the door toward the 100% projection at 66.11.
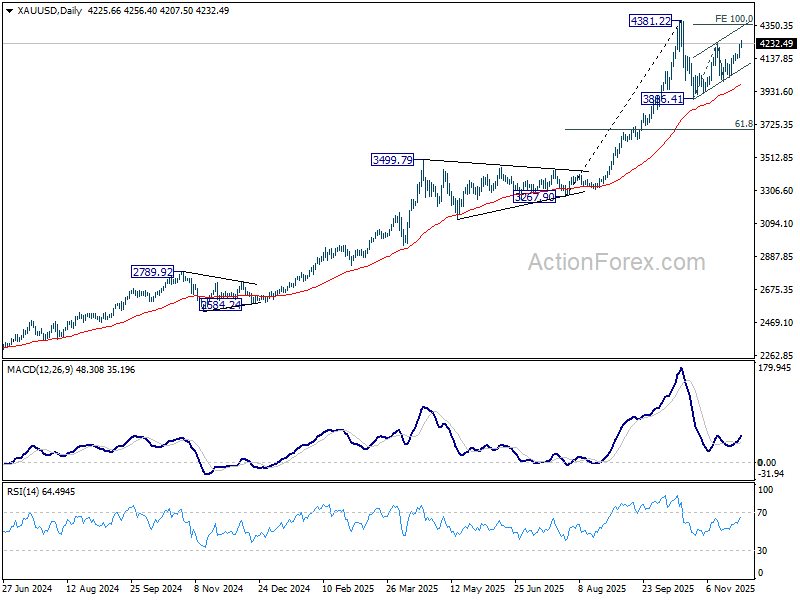
Gold, by contrast, remains in consolidation. The rebound off 3,886.41 is developing as the second leg of the corrective pattern from 4,381.22 high. While further gains are possible near term, strong resistance is expected around the 100% projection of 3886.41 to 4344.86 from 3997.73 at 4356.18—close to the previous peak. Another pullback is still favored to complete the consolidation phase before the broader long-term uptrend reasserts itself.
US Data Deluge to Shape Fed’s Early-2026 Path
US data will set the tone this week, with markets preparing for a dense run of releases that could refine expectations for early-2026 policy. ISM Manufacturing and Services, ADP employment, and the latest personal income and spending numbers—including the Fed’s preferred PCE inflation gauge—form the core of the calendar. Together, these indicators will offer an updated read on demand momentum and how businesses are responding to a calmer tariff backdrop.
Despite the volume of data, none of the prints are likely to prevent the Fed from delivering another risk-management cut this month. Policymakers have signaled comfort in taking one more step to insure the economy against residual trade-related volatility and soft patches in hiring. The focus instead is shifting toward whether incoming numbers justify extending the easing cycle or pausing in Q1.
A rebound on the business side is increasingly plausible. With tariff risks easing after the extension of the US–China truce, firms appear better positioned to restore orders and investment decisions that were delayed earlier in the year. Any improvement in ISM new orders or employment components would support the argument that business confidence is stabilizing.
Consumer demand may also surprise on the upside. Two Fed rate cuts in September and October have already filtered into lower borrowing costs, providing marginal support to household spending. Strong personal consumption would suggest that the economy remains resilient even as labor-market gains moderate.
In Canada, the labor market takes center stage. At its October meeting, the BoC signaled that rates have now settled around the lower end of the neutral range, and further easing would require clear downside surprises in growth or inflation. A steady—or stronger-than-expected—jobs report would reinforce the BoC’s message that the bar for additional cuts is high.
Australia’s Q3 GDP is another important release, expected to show robust growth. Following last month’s upside inflation surprise, more strong data would underpin the case for the RBA to maintain its pause through Q1. Whether a full easing case still exists for 2026 is unclear, and policymakers are watching every incoming data point carefully.
Inflation figures from the Eurozone and Switzerland round out the global picture. But neither set of numbers is likely to shift the ECB or SNB from their current holding posture.
Here are some highlights for the week
- Monday: Japan PMI manufacturing final, capital spending; China RatingDog PMI manufacturing; Swiss retail sales, PMI manufacturing; Eurozone PMI manufacturing final; UK PMI manufacturing final; Canada PMI manufacturing; US ISM manufacturing.
- Tuesday: New Zealand terms of trade; Japan monetary base; Australian building approvals; Eurozone CPI flash, unemployment.
- Wednesday: Australia GDP; China RatingDog PMI services; Swiss CPI; Eurozone PMI services final, PPI; UK PMI services final; US ADP employment, industrial production, ISM PMI services.
- Thursday: Australia trade balance; Swiss unemployment rate; UK PMI construction; Eurozone retail sales; US jobless claims; Canada Ivey PMI.
- Friday: Japan household spending, leading indicators; Germany factory orders; Swiss foreign currency reserves; Eurozone GDP revision; Canada employment; US personal income and spending, PCE inflation, University of Michigan consumer sentiment.
USD/JPY Daily Outlook
Daily Pivots: (S1) 155.91; (P) 156.25; (R1) 156.52; More...
USD/JPY dips low today as corrective pullback from 157.88 extends. While further fall cannot be ruled out, downside should be contained by near term channel support (now at 154.12) to bring rebound. Above 156.71 minor resistance will turn bias back to the upside. Further break of 157.88 will resume the whole rally from 139.87. Next target is 158.86 structural resistance, and then 161.94 high. However, firm break of the channel support will bring deeper correction to 55 D EMA (now at 152.86).
In the bigger picture, current development suggests that corrective pattern from 161.94 (2024 high) has completed with three waves at 139.87. Larger up trend from 102.58 (2021 low) could be ready to resume through 161.94 high. Decisive break of 158.85 structural resistance will solidify this bullish case and target 161.94 for confirmation. On the downside, break of 150.90 resistance turned support will dampen this bullish view and extend the corrective range pattern with another falling leg.
Silver extends record run and targets 60, leaving Gold lagging in range
Silver’s outperformance against Gold continued into December, with the metal surging to another record high late last week and extending gains in Asian trading today. The rally highlights a stark divergence within precious metals: while Silver pushes into uncharted territory, Gold remains trapped in its near-term range and capped well below its own record.
The strength in Silver reflects a powerful intersection of tight supply, firm physical demand, and intensifying industrial needs. Over the past year, the market’s underlying surplus has flipped into deficit, driven partly by the electrification of the vehicle fleet, rapid growth in artificial intelligence infrastructure, and continued expansion in photovoltaic applications. Together, these structural forces have pushed consumption higher while supply has struggled to keep pace.
Silver’s inherent material advantages—high thermal and electrical conductivity—make it difficult to substitute in EVs, advanced semiconductors, AI cooling systems, and solar technologies. With demand from these sectors accelerating and tariff-related distortions supporting domestic sourcing, investors have increasingly viewed Silver as a standout industrial-precious hybrid with strong forward momentum.
Technically, the breakout is equally convincing. Spot silver resumed its powerful uptrend by clearing the 54.44 resistance level and has now printed a fresh all-time high at 57.81. The next major upside zone sits at 61.8% projection of 36.93 to 54.44 from 48.60 at 59.4. The psychological 60 handle may cap the advance temporarily, but the broader trend remains decisively bullish as long as 54.36—now key support—holds. Sustained trading above 60 would open the door toward the 100% projection at 66.11.
Gold, by contrast, remains in consolidation. The rebound off 3,886.41 is developing as the second leg of the corrective pattern from 4,381.22 high. While further gains are possible near term, strong resistance is expected around the 100% projection of 3886.41 to 4344.86 from 3997.73 at 4356.18—close to the previous peak. Another pullback is still favored to complete the consolidation phase before the broader long-term uptrend reasserts itself.