
Sample Category Title
GBP/USD Daily Outlook
Daily Pivots: (S1) 1.3188; (P) 1.3232; (R1) 1.3257; More...
GBP/USD retreated quickly after edging higher to 1.3274 and intraday bias is turned neutral again. On the upside, sustained trading above 55 D EMA (now at 1.3265) should confirm that fall from 1.3787 has completed as a correction. Further rise should then be seen to 1.3725/3787 resistance zone. On the downside, however, firm break of 1.3199 minor support will revive near term bearishness, and bring retest of 1.3008.
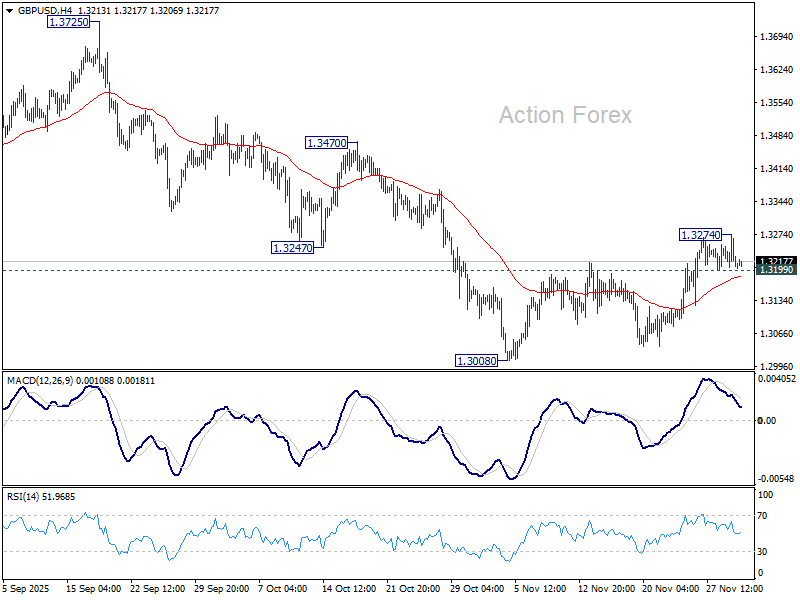
In the bigger picture, the break of 55 W EMA (now at 1.3184) is taken as the first sign that corrective rise from 1.0351 (2022 low) has completed. Decisive break of trend line support (now at 1.2760) will solidify this case and target 38.2% retracement of 1.0351 to 1.3787 at 1.2474 next. Meanwhile, in case of another rise, strong resistance should emerge below 1.4248 (2021 high) to cap upside to preserve the long term down trend.
USD/CHF Daily Outlook
Daily Pivots: (S1) 0.8013; (P) 0.8031; (R1) 0.8067; More…
Overall outlook is unchanged that price actions from 0.7828 low is seen as a corrective pattern. Intraday bias in USD/CHF is mildly on the downside for 0.7877 support. Firm break there will argue that larger down trend is resuming through 0.7828. Nevertheless, above 0.8070 minor resistance will suggest that the corrective pattern is still extending, and turn bias back to the upside for 0.8123 and above.
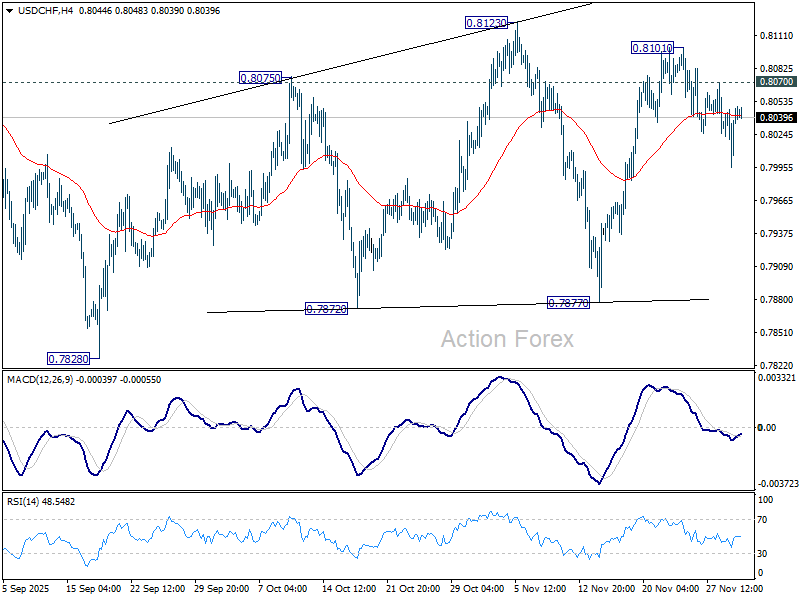
In the bigger picture, long term down trend from 1.0342 (2017 high) is still in progress. Next target is 100% projection of 1.0146 (2022 high) to 0.8332 from 0.9200 at 0.7382. In any case, outlook will stay bearish as long as 0.8332 support turned resistance holds (2023 low).
AUD/USD Daily Report
Daily Pivots: (S1) 0.6532; (P) 0.6549; (R1) 0.6562; More...
Intraday bias in AUD/USD stays mildly on the upside despite some loss of momentum. Decisive break of 0.6579 resistance should confirm that whole fall from 0.6706 has completed as a three wave correction. Stronger rally should then be seen back to retest 0.6706. However, below 0.6519 minor support will turn intraday bias back to the downside for 0.6413 key support.
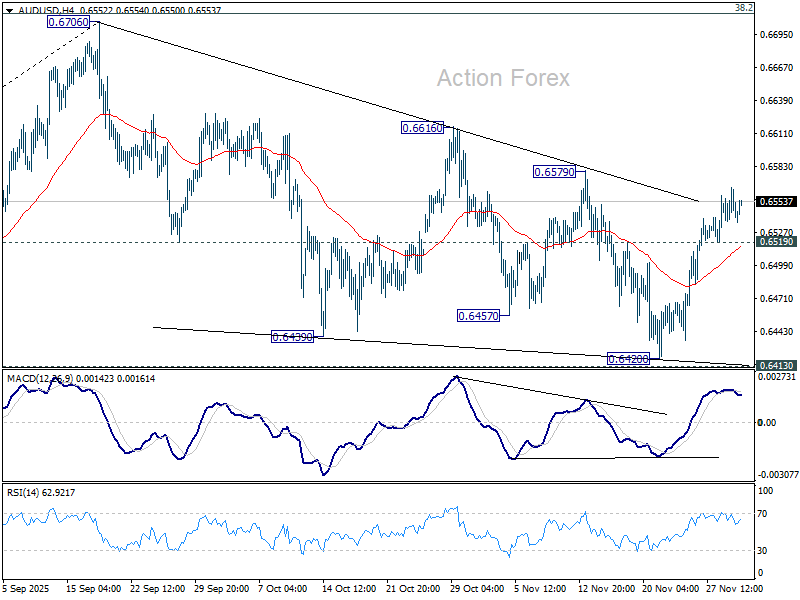
In the bigger picture, there is no clear sign that down trend from 0.8006 (2021 high) has completed. Rebound from 0.5913 is seen as a corrective move. Outlook will remain bearish as long as 38.2% retracement of 0.8006 to 0.5913 at 0.6713 holds. Break of 0.6413 support will suggest rejection by 0.6713 and solidify this bearish case. Nevertheless, considering bullish convergence condition in W MACD, sustained break of 0.6713 will be a strong sign of bullish trend reversal, and pave the way to 0.6941 structural resistance for confirmation.
A Fragile Rebound
Wow, the month started very strongly, with Bank of Japan (BoJ) head Ueda hinting yesterday that the BoJ could deliver a rate hike next month — and boom, all hell broke loose. Japanese yields spiked to fresh multi-decade highs, pulling other sovereign yields up, while equities and Bitcoin tanked and gold and silver spiked. Reports suggest around $1bn of leveraged crypto positions were wiped out yesterday. It was bad. Really bad.
Today, the mood is much better after the 10-year JGB auction went well and saw strong demand — helping to stabilize Japanese JGBs and other sovereigns. The US 10-year steadies near the 4% mark, and the USDJPY is recovering yesterday’s heavy slump.
Even though the Nikkei remains under pressure, Bitcoin and tech-heavy pockets of Asian markets have rebounded. The Kospi is up 1.61% at the time of writing, while Bitcoin is up less than 1% — very small by its standards. The coin tested a key support level yesterday: the 38.2% Fibonacci retracement around $83K. If broken, it could push Bitcoin into a medium-term bearish consolidation zone.
What’s the downside? Mining costs are said to be around $70K, which could act as a floor as commodities don’t trade below their production costs. But Bitcoin is not a typical commodity. You don’t use it to build houses, cars or solar panels. That supply-only perspective ignores demand. If investors fear a decline, will demand remain strong? Bitcoin has limited real-world usage and mostly serves as a store of value.
The recent wipeout could deepen, leaving less money for traditional investments, while rising Japanese yields and the potential repatriation of billions of dollars back to Japan add further risks for risk assets.
Let’s see if Federal Reserve (Fed) doves return to charge. Yesterday’s US data highlighted economic weakness beyond AI hype: factory activity contracted for the ninth straight month, orders fell at the steepest pace in four months and employment shrank. Judging by the data and Fed funds futures, a rate cut next week seems highly likely; otherwise, the market reaction would be severe.
The hope is that the slowing US economy also slows spending and tames inflation. Black Friday sales hit a record, and Cyber Monday was robust, but part of that was due to inflation — Americans bought 1% fewer goods but paid 7% more, according to Salesforce. Tariffs will likely continue adding pressure. Companies have weathered costs by liquidating pre-tariff stockpiles, while others absorbed temporary hits. But ultimately, someone pays. If demand weakens, tariff-led price increases could be neutralized.
So it comes down to this: will tariff-driven price pressure, combined with a softening jobs market, eventually force consumers to pull back? And could any slowdown offset the inflationary impact of tariffs? US inflation cannot rise materially above 3% without affecting Fed cut expectations. We are in a delicate place for policy: a rate cut next week may not bring relief if inflation data doesn’t improve.
The US dollar remains under pressure, below the 200-DMA. Other traditional currencies, like the euro and sterling, look unattractive amid high debt, budget issues and weak growth. Gold, silver and copper have spiked as investors seek hard commodities — seemingly a safer store of value than Bitcoin — which also hedge against inflation, unlike Bitcoin, which has too short a track record.
Meanwhile, in technology, it’s business as usual. Nvidia announced yesterday a $2bn investment in Synopsys, which makes the software and building blocks used to design computer chips — and incidentally, is also a Nvidia client. OpenAI is investing in the startup vehicle Thrive Holdings. Time will tell whether these companies are building a genuine AI ecosystem or a house of cards. Nvidia rose 1.65% in an otherwise ugly session, suggesting investors can digest anything — wars, exploding debt, tariffs — and circular AI deals.
US ISM Manufacturing Weakens, Reinforcing Fed Rate Cut Expectations
In focus today
In the euro area, focus turns to the flash inflation data for November. On Friday we received data from the biggest four countries, which came in lower than expected pointing to unchanged headline inflation at 2.1% y/y and core at 2.4% y/y in November in line with our initial forecast but below consensus expectations.
In Denmark, Danmarks Nationalbank's press release on November FX reserve will be published today, revealing whether the central bank intervened in the FX market in November. The EUR/DKK is at a high level, but we do not expect the release to show intervention in November.
Economic and market news
What happened yesterday
In the US, the ISM manufacturing index fell to 48.2 in November (cons: 49.0) from 48.7 in October, signalling continued contraction in the sector. While realised output improved, forward-looking order-inventory balances weakened significantly, pointing to negative growth momentum. Domestic demand showed further signs of softening, while export orders recovered slightly but remain at historically low levels. With key US labour market and inflation data postponed beyond the Fed's next meeting on 10 December, the weaker-than-expected ISM manufacturing release reinforces expectations for a dovish stance from the Fed, and markets are now pricing in a 86% probability for a December cut. We are also expecting a 25bp cut in December.
In Sweden, the manufacturing PMI fell to 54.6 in November (prior: 55.0) but is still above its historical average of 54.3 for the fifth consecutive month. The decline was mainly driven by a decline in production but also delivery times, while new orders and employment increased. We are not worried about the decline in November. The PMI is holding up well, and this view is also supported by the NIER survey from last week.
In Norway, the manufacturing PMI rose from 48.2 to 53.0 in November, breaking the downward trend we have seen since July. The recovery was broad-based, with gains in production, new orders and employment. As we have previously noted, the PMI has been significantly weaker than actual production figures for some time, and the lift in November just helps close this gap somewhat.
On tariffs, the US announced a zero-tariff pharmaceutical deal with the UK. The agreement will see UK pay 25% more for new US medicines and revise its drug valuation framework at NICE. In return, UK-made medicines and medical technology will be exempt from US tariffs. Bristol Myers Squibb plans USD 500m in UK investments, while the British Chambers of Commerce praised the deal.
Bitcoin dropped 5.2% on Monday, which dragged its price down to USD 87,000, marking a 30% drop since its October high.
In geopolitics, efforts to end the Ukraine war are gaining momentum as US Special Envoy Witkoff and Jared Kushner head to Moscow for talks with Russian President Putin. European leaders, including President Zelenskiy, have pushed back against initial US peace proposals seen as favouring Russia, advocating for a more balanced framework during recent discussions in Geneva and Paris.
Equities: The week opened with lower equity markets, but the tone was anything but classic risk-off. Cyclicals outperformed defensives, and low-vol stocks lagged the broader market. Sector-wise, Utilities were among the weakest performers, while Consumer Discretionary posted gains. The more telling price action unfolded in rates, where yields moved higher across the curve and across regions. It started with repricing at the front end in Japan yesterday morning and ended with a notable long-end increase in the US last night.
The equity moves should thus also be viewed through the lens of the global rates repricing and a market that is now entering a "wait-and-see" mode ahead of a heavy catch-up in delayed US macro data over the coming days. Asian markets are mostly higher this morning, led by strong gains in South Korea. Equity futures in Europe and the US trade broadly unchanged relative to yesterday's close.
FI and FX: Fixed income markets were off to a tough start to the week with a bearish steepening of the curve across regions. In the US, 10Y Treasuries rose close to 10bp while the 10Y swap rate climbed roughly 7bp during the day. JPY continued its performance during yesterday's session following BoJ Governor Ueda signalling a possibility of a rate hike at the December policy meeting, citing improving economic conditions and sustained wage growth as key factors. EUR/USD rose throughout yesterday's session, trading above the 1.16 mark aided by weak ISM data, cementing a rate cut from the Fed in December. The European natural gas price has dropped to the lowest level since early 2024 and the spread to US natural gas prices has narrowed to the tightest level since 2021.
USD/CAD Daily Outlook
Daily Pivots: (S1) 1.3968; (P) 1.3985; (R1) 1.4015; More...
USD/CAD recovered ahead of near term channel support and intraday bias is turned neutral first. Some consolidations could be seen above 1.3936 temporary low. But risk will stay mildly on the downside as long as 55 4H EMA(now at 1.4033) holds. Below 1.3936 will target 38.2% retracement of 1.3538 to 1.4139 at 1.3909. Sustained break there will indicate that whole rise from 1.3538 has completed. Deeper fall should then be seen to 61.8% retracement at 1.3768 next. However, fir break of 55 4H EMA will retain near term bullishness, and bring retest of 1.4139 high.
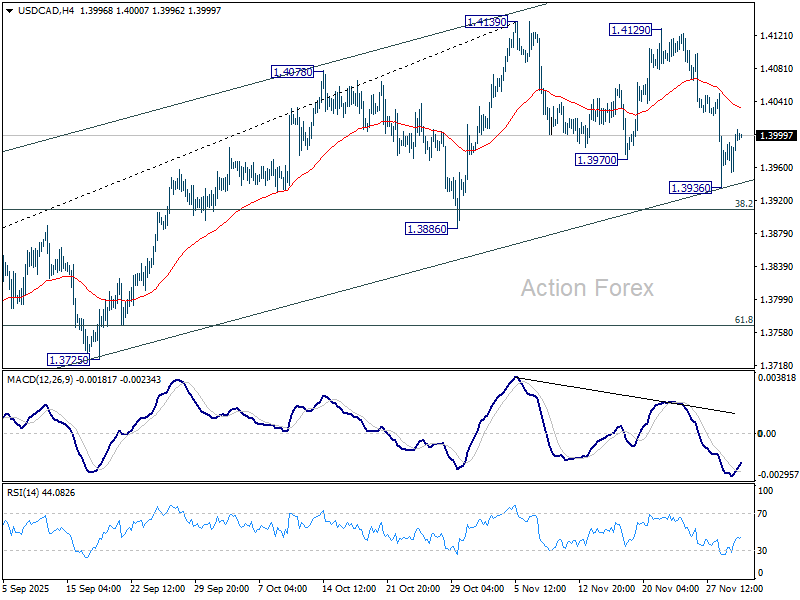
In the bigger picture, price actions from 1.4791 medium term top is likely just unfolding as a correction to up trend from 1.2005 (2021 low), with rise from 1.3538 as the second leg. A third leg should follow before up trend resumption. That is, range trading is set to extend for the medium term. For now, this will remain the favored case as long as 1.3886 support holds. However, firm break of 1.3886 will revive the case that fall from 1.4791 is indeed a larger scale correction.
Markets Stabilize After Robust JGB Auction, Retroactive US Tariff Relief for Korea
Market sentiment steadied across Asia today, with most assets drifting in tight ranges after Monday’s volatility. The overnight selloff in the US was modest, and fears that Japan-led risk aversion would spill aggressively into global markets did not materialize. While pockets of unease lingered—particularly in the tech space following Bitcoin’s slump—the broader tone has remained controlled.
Bitcoin extended its weak run from November and posted its worst day since March on Monday, weighing on tech-linked sentiment. Even so, the fallout has been mostly contained, with investors showing little sign of broad defensive repositioning. The stabilization in equity futures and credit markets helped underpin the more measured tone in Asian trading.
In Japan, super-long-dated yields eased after briefly touching fresh highs, providing relief after a turbulent start to the week. A successful 10-year JGB auction generated the strongest demand since September, offering reassurance to investors who had grown nervous about the pace of reflation in Japanese rates markets. The result helped reverse part of yesterday’s spike in yields.
The move comes as markets continue to digest rising expectations for a BoJ rate hike at the December meeting. Governor Kazuo Ueda’s comments earlier this week triggered a sharp repricing of rate expectations, but today’s pullback in yields and the solid auction helped calm nerves. Swaps still assign around a 70% probability to a 25bps move this month, keeping policy normalization firmly in focus.
Optimism from South Korea added to the region’s stability. Shares of major auto manufacturers rose after US Commerce Secretary Howard Lutnick confirmed that the newly negotiated 15% US auto tariff rate for South Korea would apply retroactively from November 1. The announcement boosted confidence that bilateral trade conditions are improving for Korean exporters.
In the currency markets, Yen remains the strongest performer of the week, supported by rising BoJ expectations, followed by Euro and Dollar. On the weaker side, Sterling leads the laggards, with Loonie and Swiss Franc also soft. Aussie and Kiwi sit in the middle of the pack as cross-flows dominate.
Most major pairs and crosses have drifted back inside last week’s ranges, reinforcing the view that markets have stabilized after Monday’s volatility. With no major catalysts in the Asian session, traders appear content to consolidate positions ahead of upcoming US data later in the week.
In Asia, Nikkei fell -0.05%. Hong Kong HSI is down -0.04%. China Shanghai SSE is down -0.45%. Japan 10-year JGB yield fell -0.019 to 1.860. Overnight, DOW fell -0.90%. S&P 500 fell -0.53%. NASDAQ fell -0.38%. 10-year yield rose 0.079 to 4.096. Overnight, DOW fell -0.90%. S&P 500 fell -0.53%. NASDAQ fell -0.38%. 10-year yield rose 0.079 to 4.096.
RBNZ's Breman sets tone for Leadership: Mandate discipline and public trust
New RBNZ Governor Anna Breman used her first appearance before a parliamentary committee to underline a back-to-basics approach for the central bank. She said her leadership will be “laser focused” on the core mandate of keeping inflation low and stable, ensuring financial system resilience, and maintaining a safe and efficient payments framework.
Her comments signal an intention to anchor policy discussions firmly around credibility and discipline after a period of volatility in inflation and rate expectations. By highlighting the fundamentals of price stability and financial stability, Breman appears set to build continuity with the bank’s existing stance while strengthening its emphasis on execution and institutional reliability.
Looking into 2026, Breman said "transparency, accountability, and clear communication" will be central pillars of her leadership. She noted that maintaining public trust is critical for the next phase of policy.
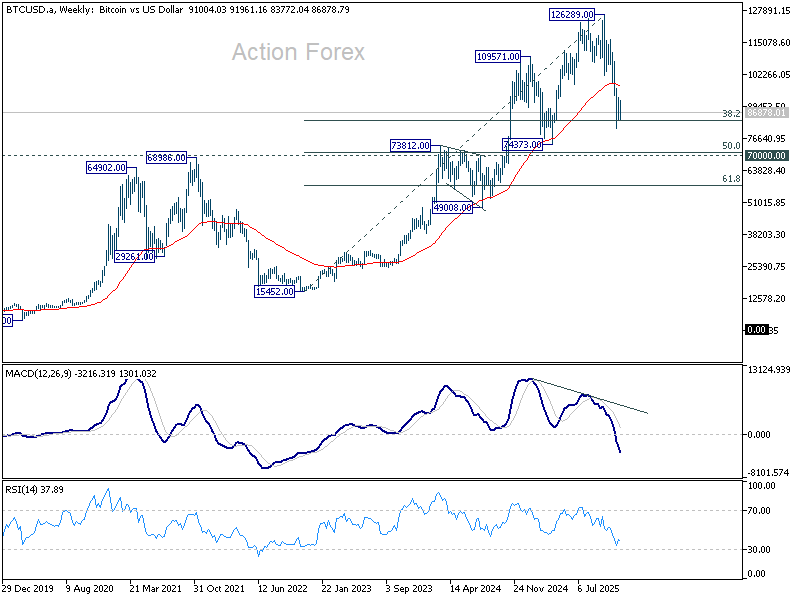
Bitcoin under pressure as rebound fades; correction targets 70k psychological level
Bitcoin’s sharp selloff this week indicates that the latest rebound has possibly already run its course, suggesting that medium-term correction is entering another downward phase. The move follows a difficult November, when Bitcoin posted its largest monthly decline since mid-2021 as a record volume of capital exited the market. Momentum remains soft, and technical structure points to further pressure ahead.
Sentiment deteriorated further on Monday after Strategy — the largest corporate holder of Bitcoin — cut its earnings outlook for 2025, citing Bitcoin’s weak performance. More broadly, Bitcoin appears to be suffering from fading enthusiasm within both the digital-asset community and the wider tech sector, where concerns about market concentration, infrastructure constraints, and slowing global cooperation are resurfacing.
Technically, the near-term rebound from 80,492 looks to have topped at 93,074. Retest of 80,492 is now the immediate focus, and firm break would resume the entire decline from 126,289. In any case, outlook will stays firmly bearish as long as 55 D EMA (now at 99,564) holds.
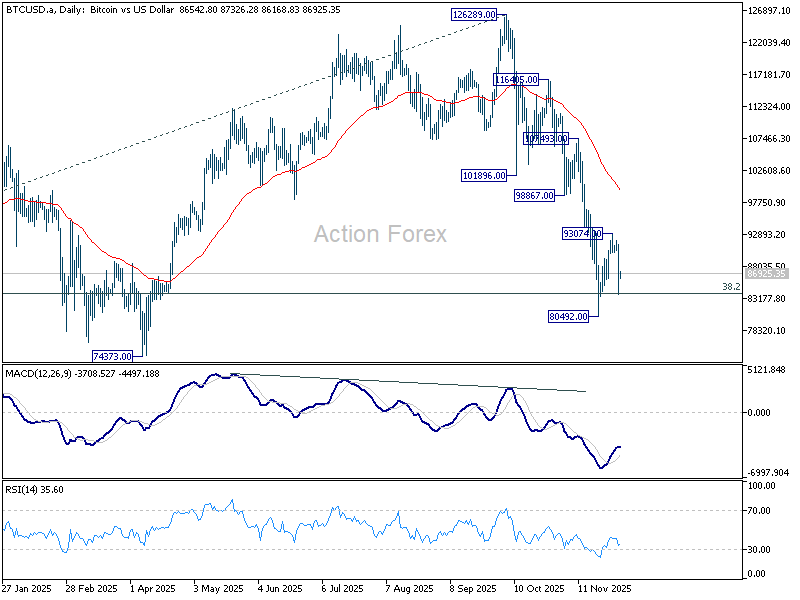
In the bigger picture, Bitcoin is clearly correcting the full five-wave uptrend from the 15,452 (2022 low). While further decline is expected, the 70,000 psychological region is expected to provide strong initial support for an interim base. That aligns with several structural levels: 74,373 support, 73,812 former resistance-turned-support, and 50% retracement of 15,452 to 126,289 at 70,870. This cluster reinforces the area’s importance in defining the medium-term floor.
Meanwhile sustained break back above the 55 W EMA (now at 97,447), would indicate that the medium-term correction from 126,289 has already shifted into a second leg, opening the door for a more sustained rebound. Until then, price risks remain skewed to the downside as the market digests weakening sentiment and tightening technical conditions.
USD/CAD Daily Outlook
Daily Pivots: (S1) 1.3968; (P) 1.3985; (R1) 1.4015; More...
USD/CAD recovered ahead of near term channel support and intraday bias is turned neutral first. Some consolidations could be seen above 1.3936 temporary low. But risk will stay mildly on the downside as long as 55 4H EMA(now at 1.4033) holds. Below 1.3936 will target 38.2% retracement of 1.3538 to 1.4139 at 1.3909. Sustained break there will indicate that whole rise from 1.3538 has completed. Deeper fall should then be seen to 61.8% retracement at 1.3768 next. However, fir break of 55 4H EMA will retain near term bullishness, and bring retest of 1.4139 high.
In the bigger picture, price actions from 1.4791 medium term top is likely just unfolding as a correction to up trend from 1.2005 (2021 low), with rise from 1.3538 as the second leg. A third leg should follow before up trend resumption. That is, range trading is set to extend for the medium term. For now, this will remain the favored case as long as 1.3886 support holds. However, firm break of 1.3886 will revive the case that fall from 1.4791 is indeed a larger scale correction.
Bitcoin under pressure as rebound fades; correction targets 70k psychological level
Bitcoin’s sharp selloff this week indicates that the latest rebound has possibly already run its course, suggesting that medium-term correction is entering another downward phase. The move follows a difficult November, when Bitcoin posted its largest monthly decline since mid-2021 as a record volume of capital exited the market. Momentum remains soft, and technical structure points to further pressure ahead.
Sentiment deteriorated further on Monday after Strategy — the largest corporate holder of Bitcoin — cut its earnings outlook for 2025, citing Bitcoin’s weak performance. More broadly, Bitcoin appears to be suffering from fading enthusiasm within both the digital-asset community and the wider tech sector, where concerns about market concentration, infrastructure constraints, and slowing global cooperation are resurfacing.
Technically, the near-term rebound from 80,492 looks to have topped at 93,074. Retest of 80,492 is now the immediate focus, and firm break would resume the entire decline from 126,289. In any case, outlook will stays firmly bearish as long as 55 D EMA (now at 99,564) holds.
In the bigger picture, Bitcoin is clearly correcting the full five-wave uptrend from the 15,452 (2022 low). While further decline is expected, the 70,000 psychological region is expected to provide strong initial support for an interim base. That aligns with several structural levels: 74,373 support, 73,812 former resistance-turned-support, and 50% retracement of 15,452 to 126,289 at 70,870. This cluster reinforces the area’s importance in defining the medium-term floor.
Meanwhile sustained break back above the 55 W EMA (now at 97,447), would indicate that the medium-term correction from 126,289 has already shifted into a second leg, opening the door for a more sustained rebound. Until then, price risks remain skewed to the downside as the market digests weakening sentiment and tightening technical conditions.
RBNZ’s Breman sets tone for Leadership: Mandate discipline and public trust
New RBNZ Governor Anna Breman used her first appearance before a parliamentary committee to underline a back-to-basics approach for the central bank. She said her leadership will be “laser focused” on the core mandate of keeping inflation low and stable, ensuring financial system resilience, and maintaining a safe and efficient payments framework.
Her comments signal an intention to anchor policy discussions firmly around credibility and discipline after a period of volatility in inflation and rate expectations. By highlighting the fundamentals of price stability and financial stability, Breman appears set to build continuity with the bank’s existing stance while strengthening its emphasis on execution and institutional reliability.
Looking into 2026, Breman said "transparency, accountability, and clear communication" will be central pillars of her leadership. She noted that maintaining public trust is critical for the next phase of policy.
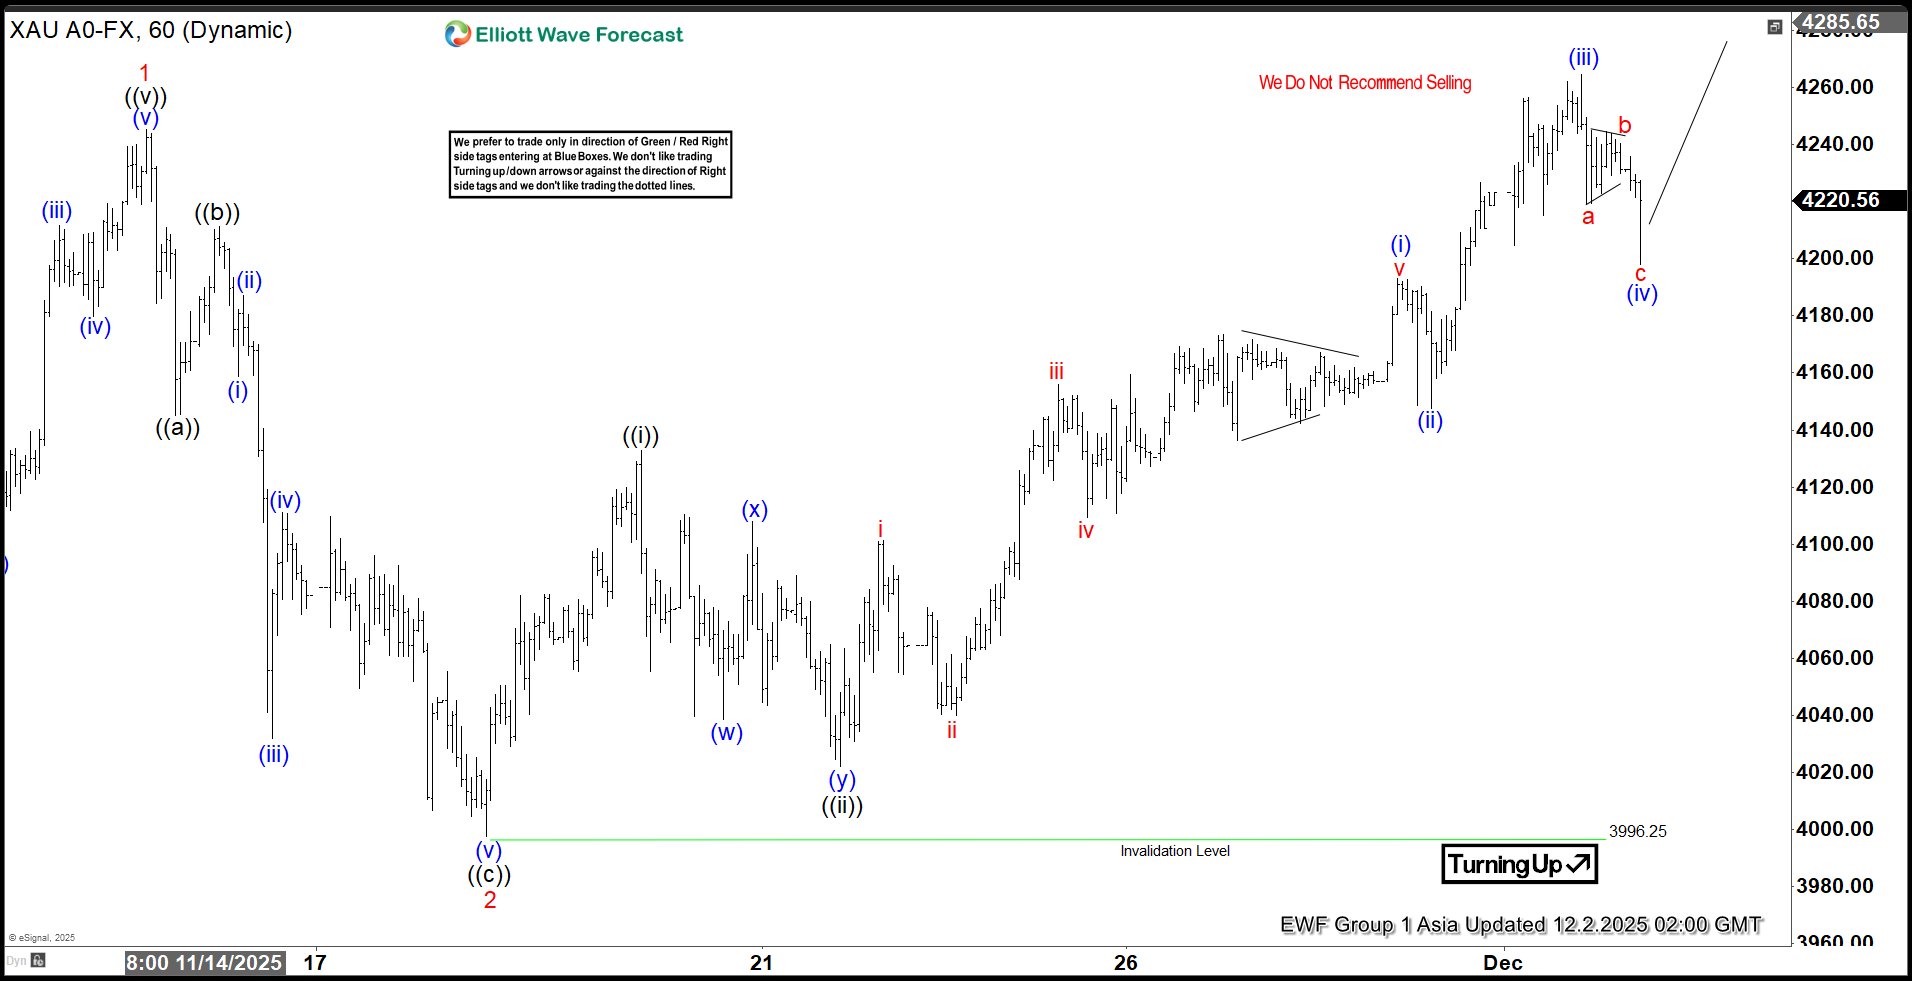
Gold (XAUUSD) Prices Poised to Break Higher, Targeting 4358
Gold (XAUUSD) continues to exhibit a bullish sequence from the 28 October low, suggesting further upside potential. The rally from that low is unfolding as a five‑wave impulse, with wave 1 concluding at 4245.22, as reflected in the one‑hour chart. Following this, wave 2 developed into a zigzag Elliott Wave structure. From the peak of wave 1, wave ((a)) ended at 4144.97, while the subsequent rally in wave ((b)) terminated at 4211.31. The decline in wave ((c)) reached 3996.25, thereby completing wave 2 at a higher degree.
The metal has since resumed its upward trajectory in wave 3, decisively breaking above the prior wave 1 peak. This confirms that the next leg higher has commenced. From the conclusion of wave 2, wave ((i)) ended at 4132.81. The corrective pullback in wave ((ii)) finished at 4022.07, forming a double three structure. One more leg higher is anticipated to complete wave ((iii)), after which a modest pullback in wave ((iv)) should occur. The market is then expected to advance again in wave ((v)), thereby concluding wave 3.
The potential target for this advance lies within the 100% to 161.8% Fibonacci extension of wave 1, calculated at 4358–4579. In the near term, as long as the pivot at 3996.25 remains intact, any pullback should find support within a sequence of 3, 7, or 11 swings, paving the way for continued strength. This structure reinforces the bullish outlook and highlights the importance of maintaining the key pivot level to sustain momentum.
Gold (XAUUSD) 60-Minute Elliott Wave Chart From 12.2.2025
XAUUSD Elliott Wave Video:
https://www.youtube.com/watch?v=pFFi74eIJ-M