Sample Category Title
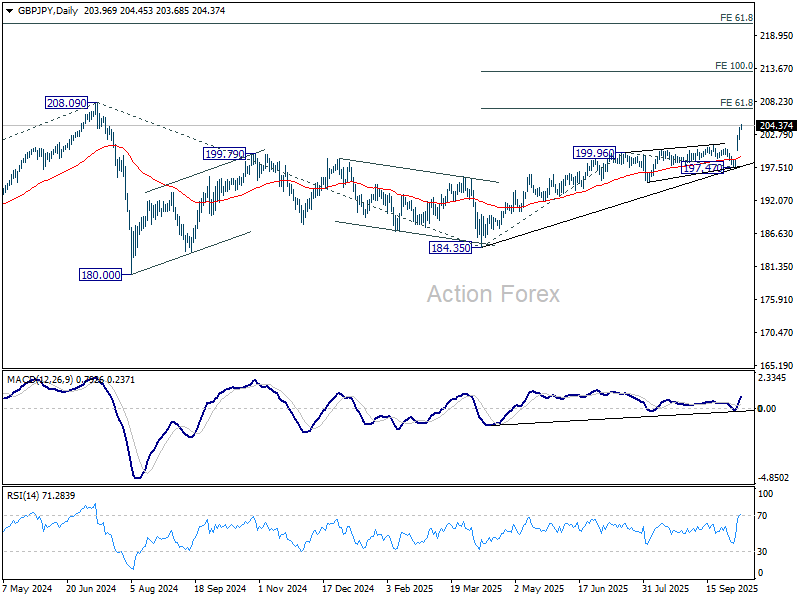
GBP/JPY Daily Outlook
Daily Pivots: (S1) 202.66; (P) 203.37; (R1) 204.61; More...
GBP/JPY's rally continues and intraday bias stays on the upside. Next target is 61.8% projection of 184.35 to 199.96 from 197.47 at 207.11. On the downside, below 202.10 minor support will turn intraday bias neutral and bring consolidations first, before staging another rise.
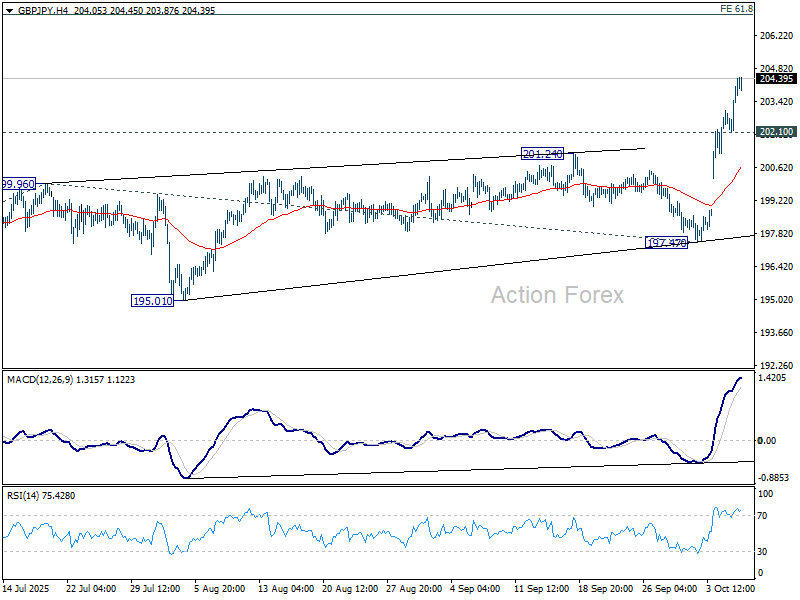
In the bigger picture, price actions from 208.09 (2024 high) are seen as a corrective pattern which might have completed at 184.35. Firm break of 208.09 high will resume the up trend from 123.94 (2020 low). Next target is 61.8% projection of 148.93 to 208.09 from 184.35 at 220.90. This will now remain the favored case long as 197.47 support holds.
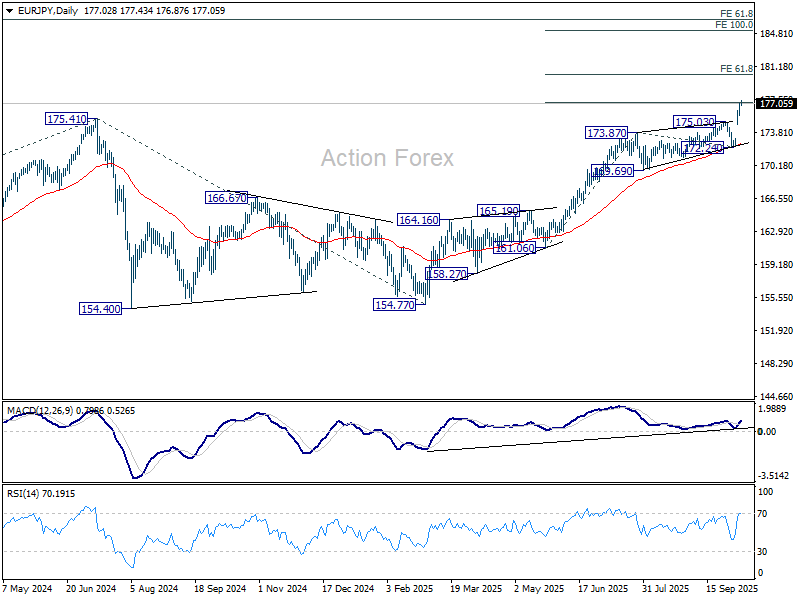
EUR/JPY Daily Outlook
Daily Pivots: (S1) 176.18; (P) 176.66; (R1) 177.54; More...
Intraday bias in EUR/JPY remains on the upside for the moment. Sustained break of 38.2% projection of 161.06 to 173.87 from 172.24 at 177.13 should further solidify momentum to 61.8% projection at 180.15 next. On the downside, below 175.76 minor support will turn intraday bias neutral again and bring consolidations, before staging another rise.
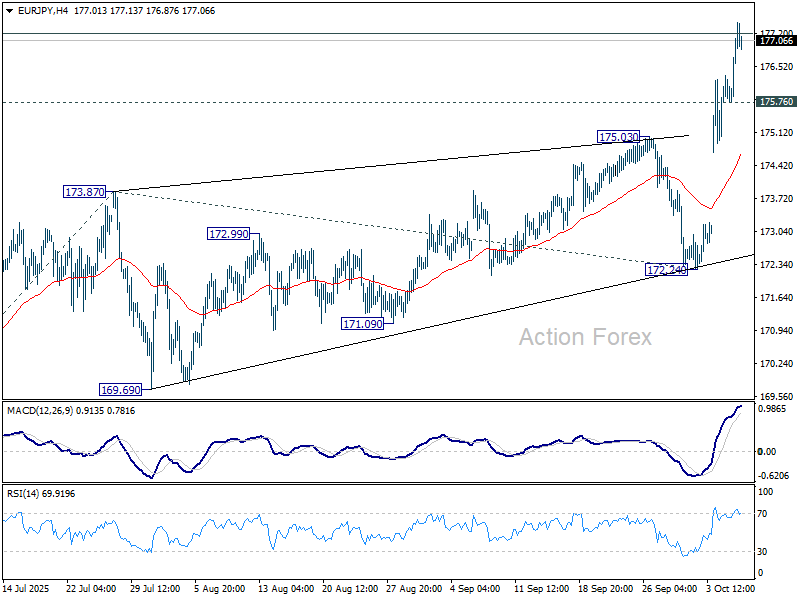
In the bigger picture, up trend from 114.42 (2020 low) is resuming with break of 175.41 (2024 high). Next target is 61.8% projection of 124.37 to 175.41 from 154.77 at 186.31. Outlook will continue to stay bullish as long as 55 W EMA (now at 166.82) holds, even in case of deep pullback.
EUR/GBP Daily Outlook
Daily Pivots: (S1) 0.8672; (P) 0.8689; (R1) 0.8700; More…
EUR/GBP's fall from 0.8750 is in progress and intraday bias stays on the downside for 0.8631 support. Decisive break there will indicate near term reversal and turn outlook bearish for 38.2% retracement of 0.8221 to 0.8750 at 0.8548. On the upside, above 0.8703 minor resistance will turn intraday bias neutral again first.
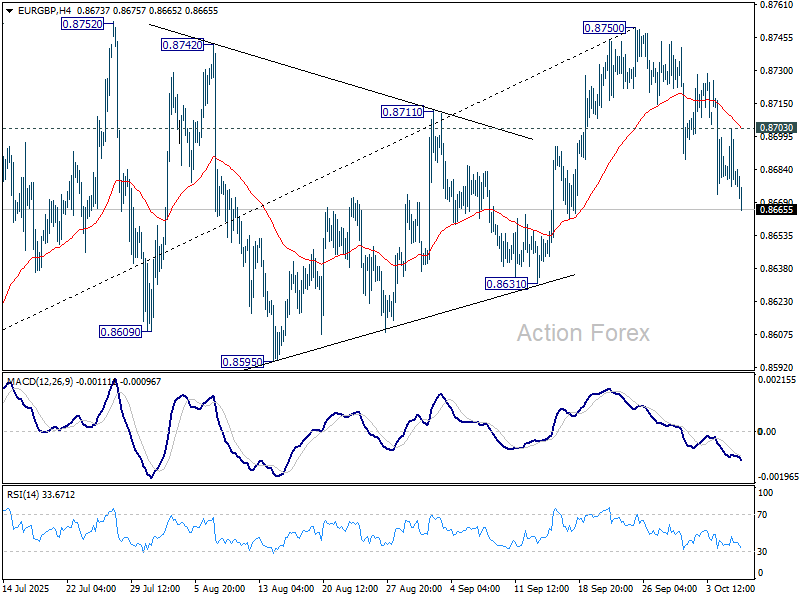
In the bigger picture, rise from 0.8221 medium term bottom is seen as a corrective move. While further rally cannot be ruled out, upside should be limited by 61.8% retracement of 0.9267 to 0.8221 at 0.8867. Considering bearish divergence condition in D MACD, firm break of 0.8631 support will be the first sign that this corrective bounce has completed. Sustained trading below 55 W EMA (now at 0.8539) will confirm, and bring retest of 0.8221 low.
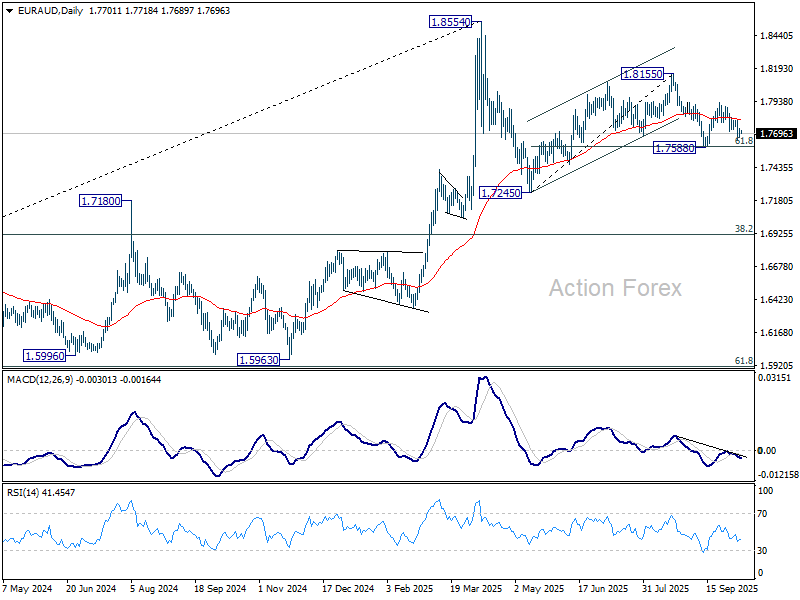
EUR/AUD Daily Outlook
Daily Pivots: (S1) 1.7675; (P) 1.7706; (R1) 1.7742; More...
No change in EUR/AUD's outlook and intraday bias stays neutral. On the upside, break of 1.7795 resistance will suggest that pullback from 1.7929 has completed. Bias will be back on the upside for this resistance first. On the downside, however, sustained break of 61.8% retracement of 1.7245 to 1.8155 at 1.7593 will bring deeper fall to 1.7245 resistance, as part of the corrective pattern from 1.8554 high.
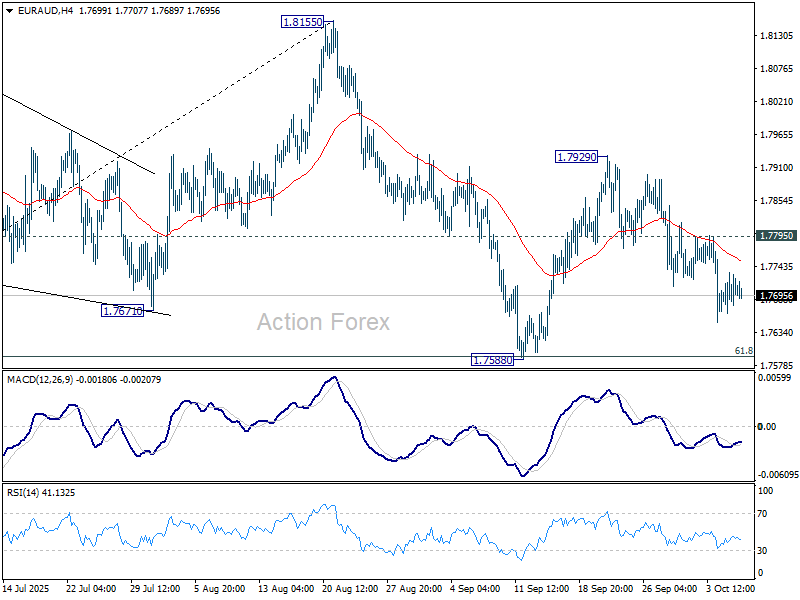
In the bigger picture, price actions from 1.8554 medium term top are seen as a corrective pattern. Deeper fall could be seen as the pattern extends, but downside should be contained by 38.2% retracement of 1.4281 (2022 low) to 1.8554 at 1.6922 to bring rebound. Uptrend from 1.4281 is expected to resume at a later stage.
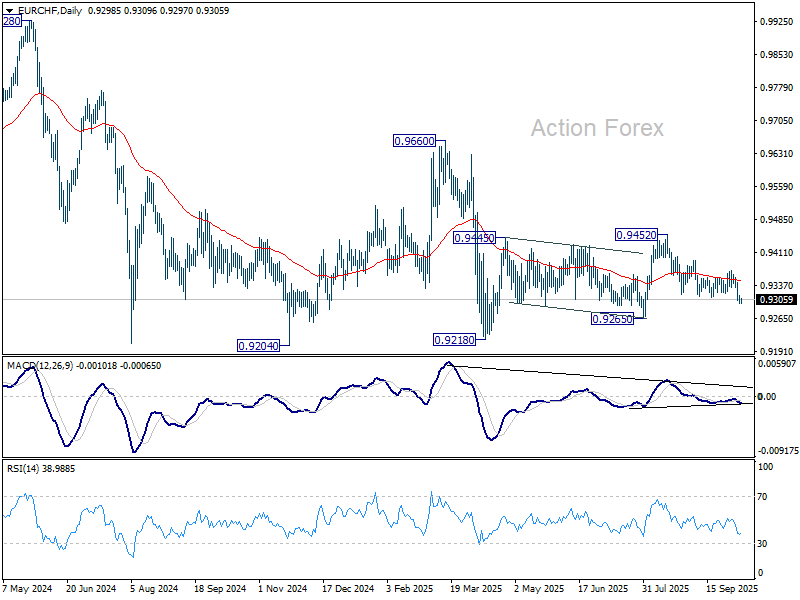
EUR/CHF Daily Outlook
Daily Pivots: (S1) 0.9295; (P) 0.9311; (R1) 0.9321; More...
Intraday bias in EUR/CHF remains on the downside for the moment. Fall from 0.9425 is in progress for 0.9265 support. Firm break there will bring deeper decline to 0.9218 low. For now, risk will stay on the downside as long as 0.9371 resistance holds, in case of recovery.
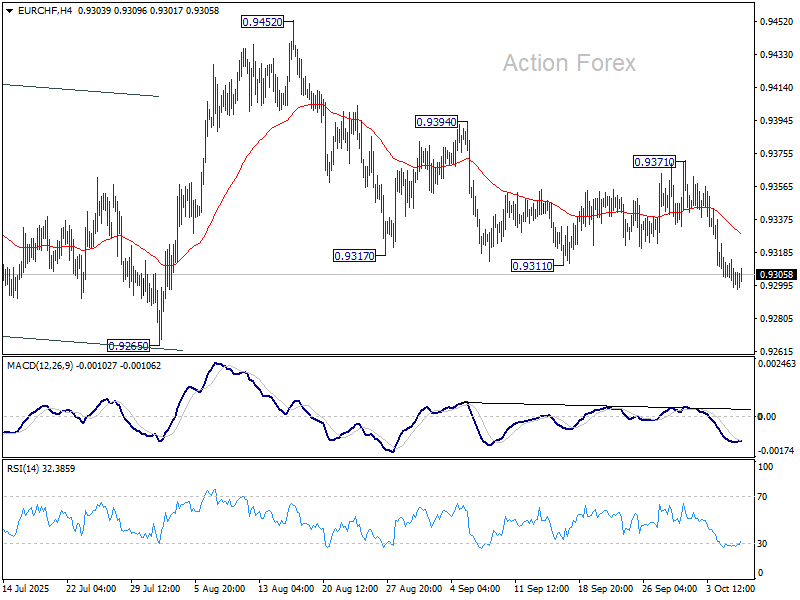
In the bigger picture, the down trend from 0.9204 (2018 high) might still be in progress considering that EUR/CHF is staying well inside the long term falling channel. However, with bullish convergence condition in W MACD, downside potential should be limited in case of another fall. Instead, firm break of 0.9660 resistance will be an important sign of medium term bullish trend reversal.
Gold Rockets Beyond $4,000, WTI Crude Oil Struggles
Gold price started a fresh surge above $4,000 and traded to a new all-time high. Crude oil is recovering and might rise toward the $63.20 resistance zone.
Important Takeaways for Gold and WTI Crude Oil Prices Analysis Today
- Gold price rallied to a new all-time high and traded above $4,000 against the US Dollar.
- A key bullish trend line is forming with support at $4,000 on the hourly chart of gold at FXOpen.
- WTI Crude oil is recovering losses and trading above $61.20.
- There is a short-term rising channel in place with support at $61.20 on the hourly chart of XTI/USD at FXOpen.
Gold Price Technical Analysis
On the hourly chart of Gold at FXOpen, the price formed support near $3,820. The price remained in a bullish zone and started a fresh increase above $3,900, as mentioned in the previous analysis.
The bulls pushed the price above $4,000 level and the 50-hour simple moving average. Finally, it traded to a new all-time high at $4,026. The price is still showing bullish signs above $4,020 and the RSI is above 70.
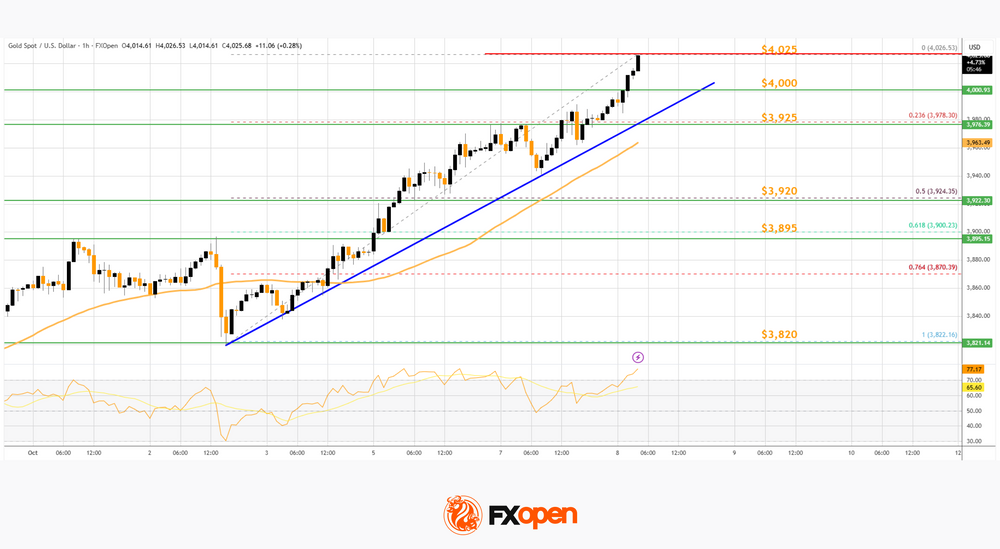
Initial support on the downside is near a key bullish trend line at $4,000. A downside break below the trend line might send the price to the 23.6% Fib retracement level of the upward move from the $3,822 swing low to the $4,026 high at $3,925.
If the bulls fail to protect $3,925, the price could start a larger downside correction. In the stated case, Gold could drop toward the 50% Fib retracement at $3,920. The next area of interest for the bulls might be $3,895. A daily close below $3,895 could spark bearish moves and send the price to $3,820.
If there is a fresh increase, the price could face resistance at $4,025. The next sell zone might be $4,050. An upside break above the $4,050 resistance could send Gold price toward $4,120. Any more gains may perhaps set the pace for an increase to $4,200.
WTI Crude Oil Price Technical Analysis
On the hourly chart of WTI Crude Oil at FXOpen, the price found support near $60.25 against the US Dollar. The price formed a base and started a recovery wave above $60.80 and the 50-hour simple moving average.
The bulls were able to push the price above the 23.6% Fib retracement level of the downward move from the $66.16 swing high to the $60.26 swing low. The hourly RSI is above the 60 level, but the price is struggling near $62.00.
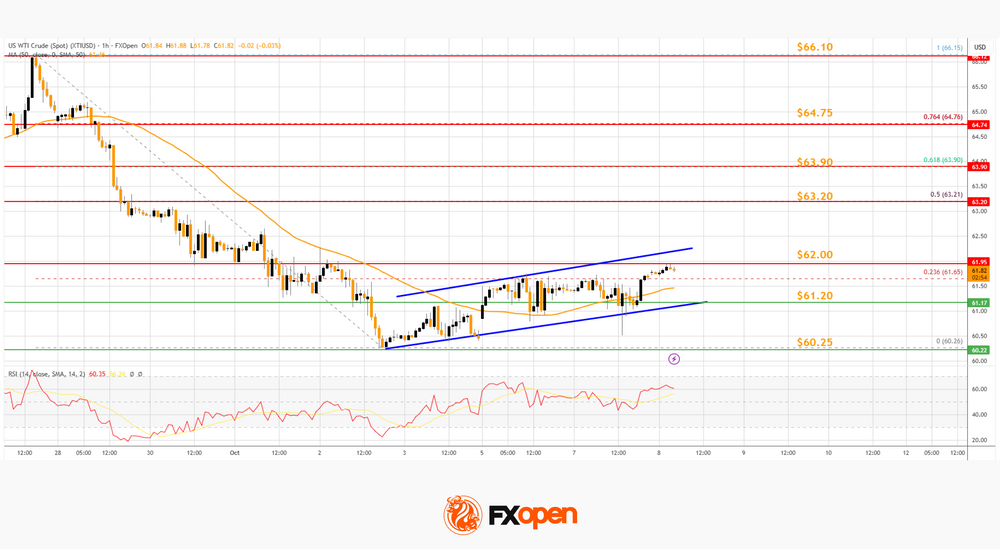
The next hurdle could be $63.20 and the 50% Fib retracement. A clear move above $63.20 could send the price toward $63.90. Any more gains might open the doors for a test of $64.75.
Conversely, the price might start a fresh decline from $62.00. Immediate support sits near $61.20 and the 50-hour simple moving average. There is also a short-term rising channel in place at $61.20. The key breakdown zone on the WTI crude oil chart might be $60.25.
If there is a downside break, the price might decline toward $58.40. Any more losses might encourage the bears for a push toward $55.00.
Start trading commodity CFDs with tight spreads. Open your trading account now or learn more about trading commodity CFDs with FXOpen.
This article represents the opinion of the Companies operating under the FXOpen brand only. It is not to be construed as an offer, solicitation, or recommendation with respect to products and services provided by the Companies operating under the FXOpen brand, nor is it to be considered financial advice.
AUD/NZD: On the Brink of Major Bullish Breakout Above 1.1470 as RBNZ Remains Dovish
Key takeaways
- AUD/NZD nears breakout: The pair rallied 1.10% since 6 October 2025, approaching the key long-term resistance at 1.1470.
- RBNZ turns more dovish: The central bank cut its cash rate by 50 bps to 2.5%, signaling openness to further easing to boost demand.
- Yield spread widens: The AU–NZ 10-year bond yield spread expanded to 0.16%, reinforcing bullish momentum for AUD/NZD.
- Technical setup remains strong: Uptrend within a medium-term ascending channel; breakout above 1.1470 could target 1.1510 next.
Since our last analysis, the price actions of the AUD/NZD cross pair have staged the expected up move and rallied by 1.10% from Monday, 6 October 2025 low of 1.1320 to print a current intraday high of 1.1446 on Wednesday, 8 October 2025, just a whisker below the key resistance of 1.1470.
RBNZ maintained dovish monetary policy guidance with a larger 50 bps rate cut
The bulk of the bullish movement seen in the AUD/NZD since the start of this week has come today, exuberated by a much more dovish New Zealand central bank.
The RNBZ cut its short-term official cash rate by 50 basis points, more than the median consensus forecast of a 25-bps cut to 2.5% from 3%. It is the eighth rate cut by the RBNZ since it kick-started its current interest rate-cutting cycle in August 2024 from 5.50%. Today’s rate cut brought the official cash rate to its lowest level since mid-2022.
The RBNZ’s latest monetary policy statement signalled its commitment to maintaining a dovish stance, expressing willingness to continue monetary easing and openness to further rate cuts aimed at stimulating demand, while placing less emphasis on immediate inflation risks.
A further steepening of the AU/NZ sovereign yield spread supports AUD/NZD bulls
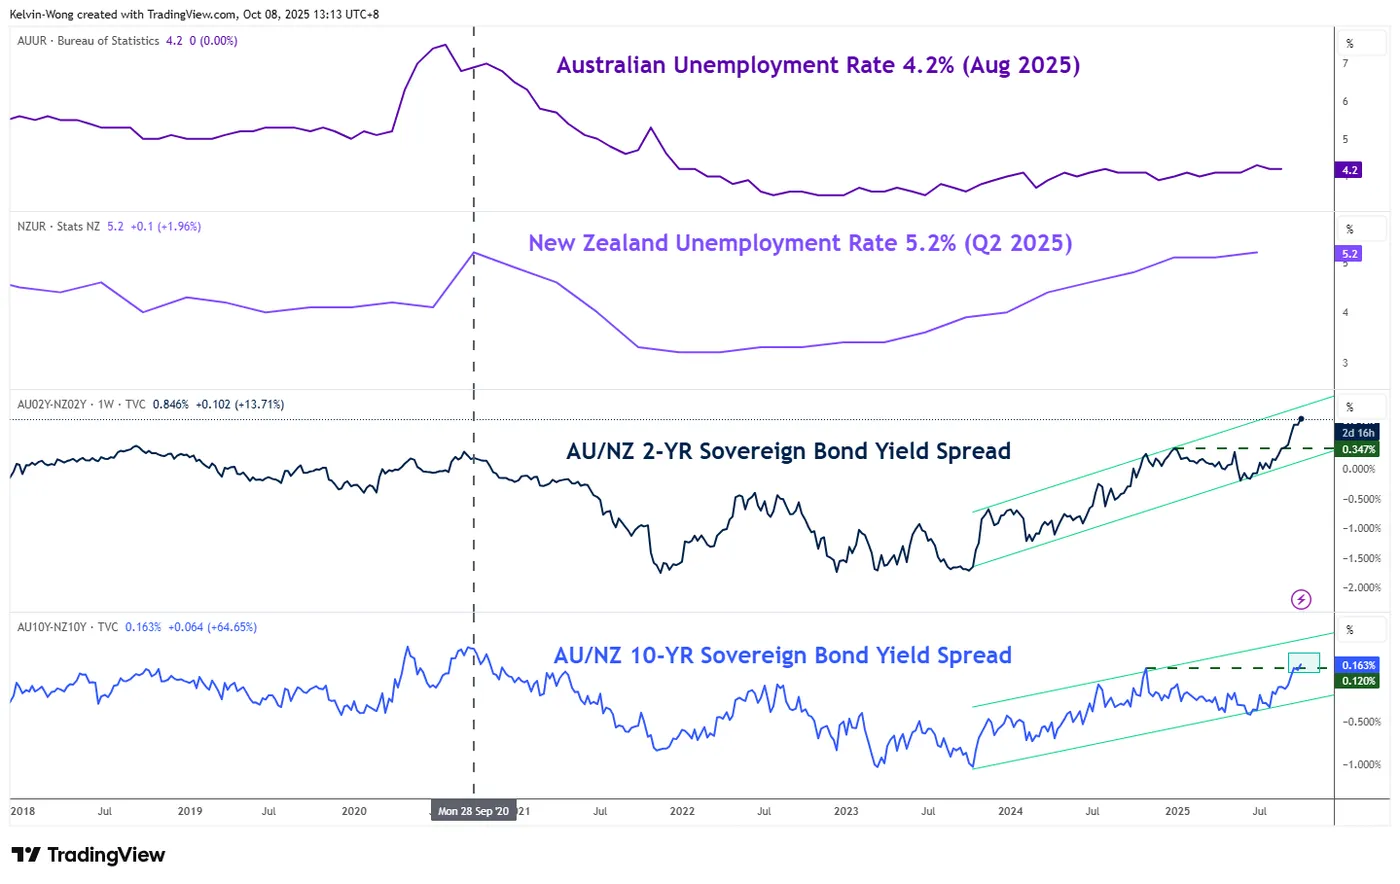
Fig. 1: AU & NZ unemployment rate with yield spreads of AU/NZ government bonds as of 8 Oct 2025 (Source: TradingView)
The more dovish monetary policy guidance from the RBNZ than its antipodean counterpart has triggered a further steepening of the 2-year and 10-year yield spreads between Australian and New Zealand sovereign bonds.
Currently, the 10-year spread with a longer tenure has just broken above its October 2024 peak of 0.12% and is trading at 0.16% at the time of writing.
Hence, the 2-year and 10-year yield spreads between Australian and New Zealand sovereign bonds are likely to widen further, which in turn could propel a further bullish movement in the AUD/NZD cross pair.
Let’s now focus on the short-term (1to 3 days) trajectory, key elements, and key levels to watch on the AUD/NZD from a technical analysis perspective.
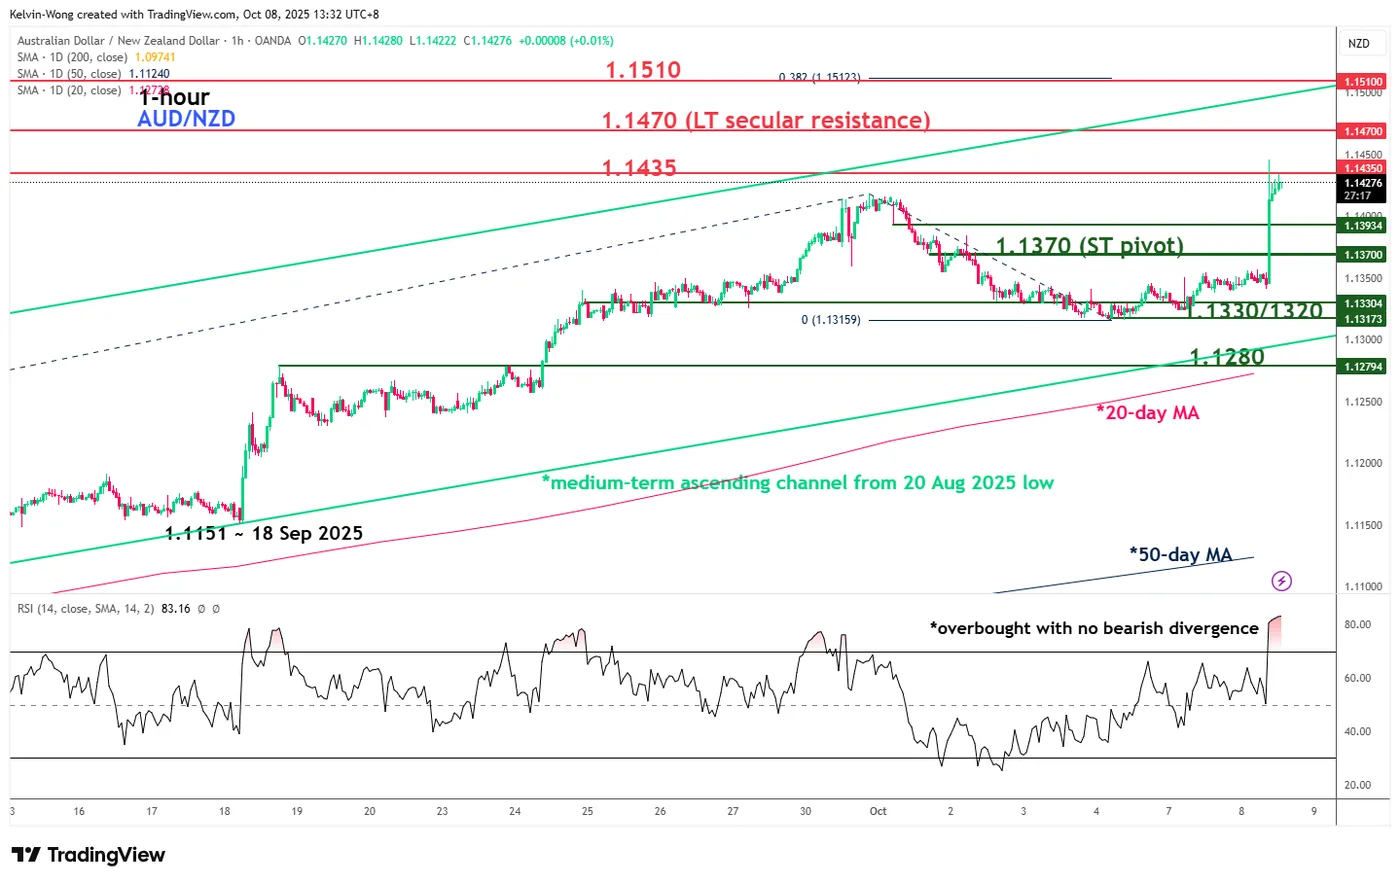
Fig. 2: AUD/NZD minor trend as of 8 Oct 2025 (Source: TradingView)
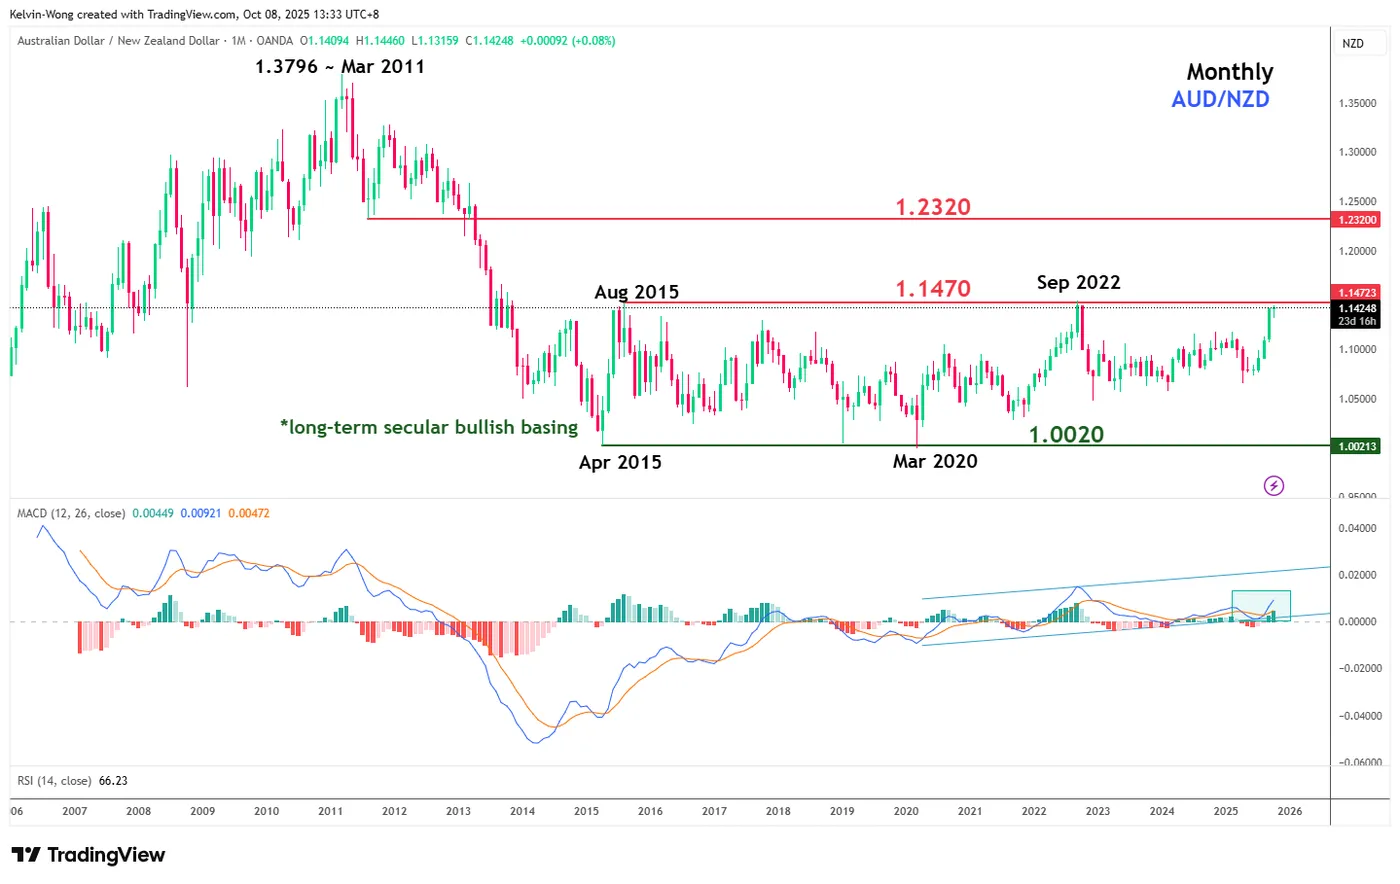
Fig. 3: AUD/NZD long-term secular trend as of 8 Oct 2025 (Source: TradingView)
Preferred trend bias (1-3 days)
Maintain bullish bias in any minor setbacks for the AUD/NZD with adjusted short-term pivotal support at 1.1370. A clearance above the key long-term secular resistance of 1.1470 may trigger a further bullish acceleration towards the next intermediate resistance at 1.1510 (also a Fibonacci extension) in the first step.
Key elements
- The price actions of the AUD/NZD have continued their upward movement within a medium-term ascending channel in place in place since the 20 August 2025 low (see Fig. 2).
- The upper boundary of the medium-term ascending channel will be projected as a resistance at 1.1510 for the AUD/NZD (see Fig. 2).
- The hourly RSI momentum indicator of the AUD/NZD has reached an extreme overbought level of 83 at the time of writing, but without any bearish divergence condition. These observations suggest that the AUD/NZD is likely to see a minor pull-back first below 1.1435 at this juncture before its next bullish impulsive up move sequence materialises (see Fig. 2).
- The 1.1470 long-term secular resistance of the AUD/NZD is defined as the upper limit of a 10-year-plus bullish basing configuration in place since April 2015 (see Fig. 3).
- In addition, the monthly MACD trend indicator of the AUD/NZD has continued to drift higher above its centreline after a retest of its ascending channel support. This observation suggests the potential start of a long-term secular bullish trend for the AUD/NZD, which increases the odds of a major bullish breakout above 1.1470 (see Fig. 3).
Alternative trend bias (1 to 3 days)
A break below the 1.1370 key short-term support for AUD/NZD negates the bullish scenario to expose the next intermediate support at 1.1330/1.1320 (also close to the lower boundary of the medium-term ascending channel).
USD/JPY Hits February High as Dovish Policy Expectations Weigh on Yen
The USD/JPY pair has rallied to its highest level since February, trading around 152.45. The Japanese yen has depreciated by over 3% this week, with selling pressure intensifying following the release of soft wage data. This has significantly dampened market expectations for further interest rate hikes from the Bank of Japan (BoJ).
The underlying driver is a persistent squeeze on household budgets: real incomes in Japan fell by 1.4% year-on-year in August, the eighth consecutive monthly decline. This confirms that price growth continues to outpace wage earnings.
While BoJ Governor Kazuo Ueda has previously signalled the regulator's readiness to resume hiking rates should the economy and inflation align with forecasts, he has also highlighted risks from potential US trade tariffs.
On the political front, investors are assessing the implications of Sanae Takaichi's victory in the leadership race. As a known supporter of the Abenomics stimulus programme, her election has bolstered expectations of large-scale budget injections and the continuation of an accommodative monetary policy stance.
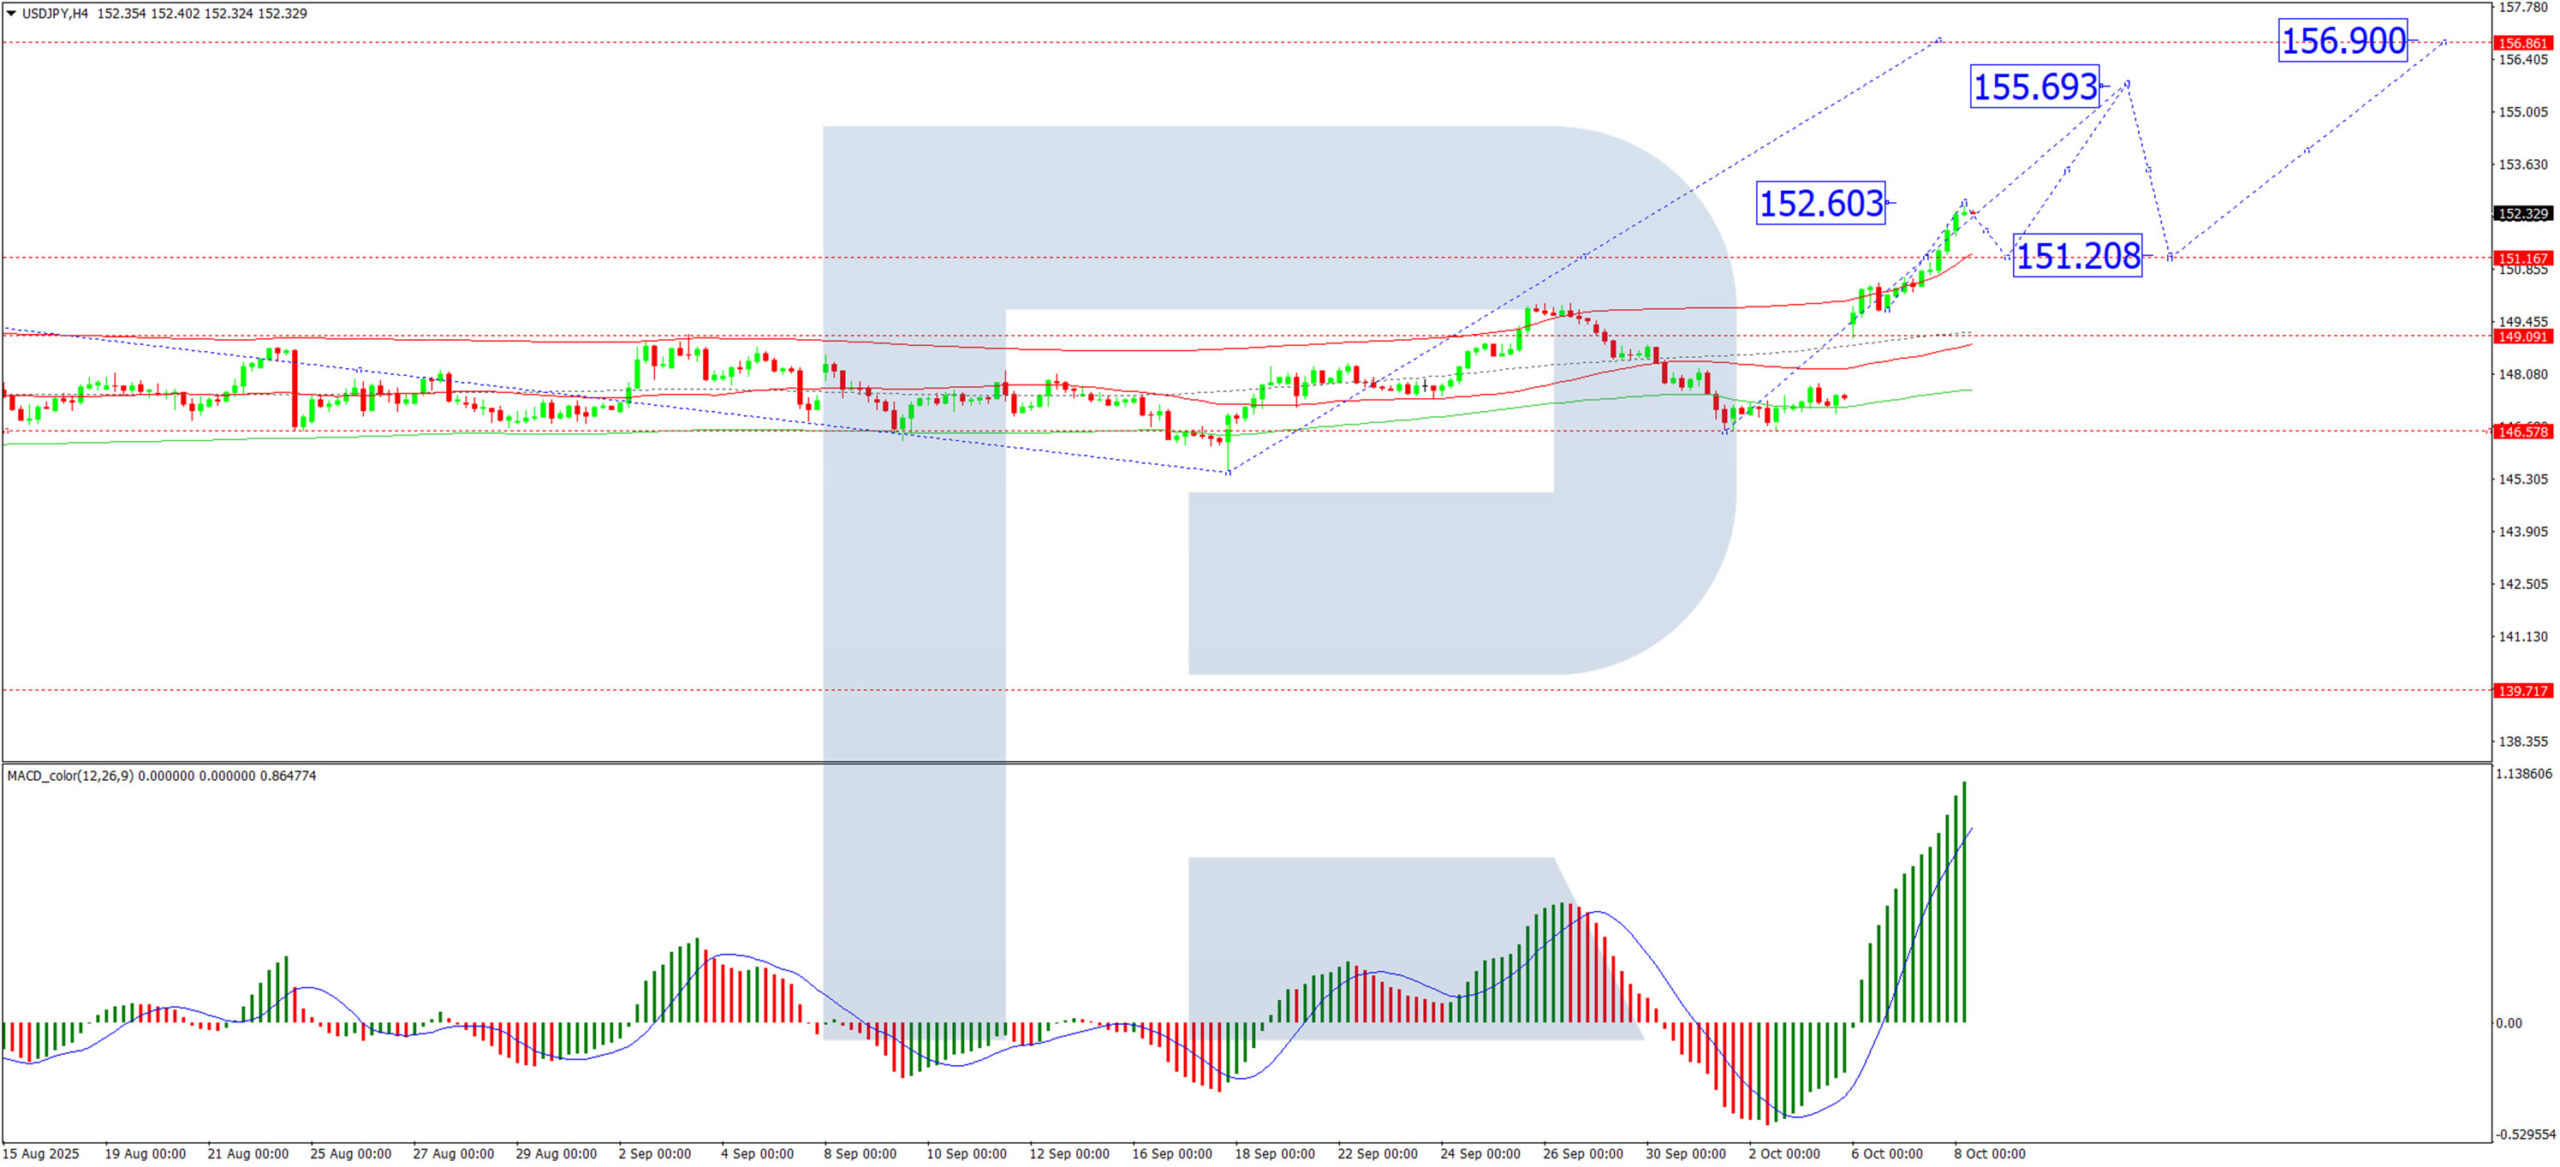
Technical Analysis: USD/JPY
H4 Chart:
On the H4 chart, USD/JPY is advancing towards the 153.00 resistance level. Upon testing this level, a corrective pullback towards 151.28 is a plausible scenario. Following such a correction, the potential for a further upward move to 155.69 would be in view, with a longer-term trend objective at 156.90. This bullish outlook is technically supported by the MACD indicator, whose signal line is positioned above zero and pointing sharply higher.
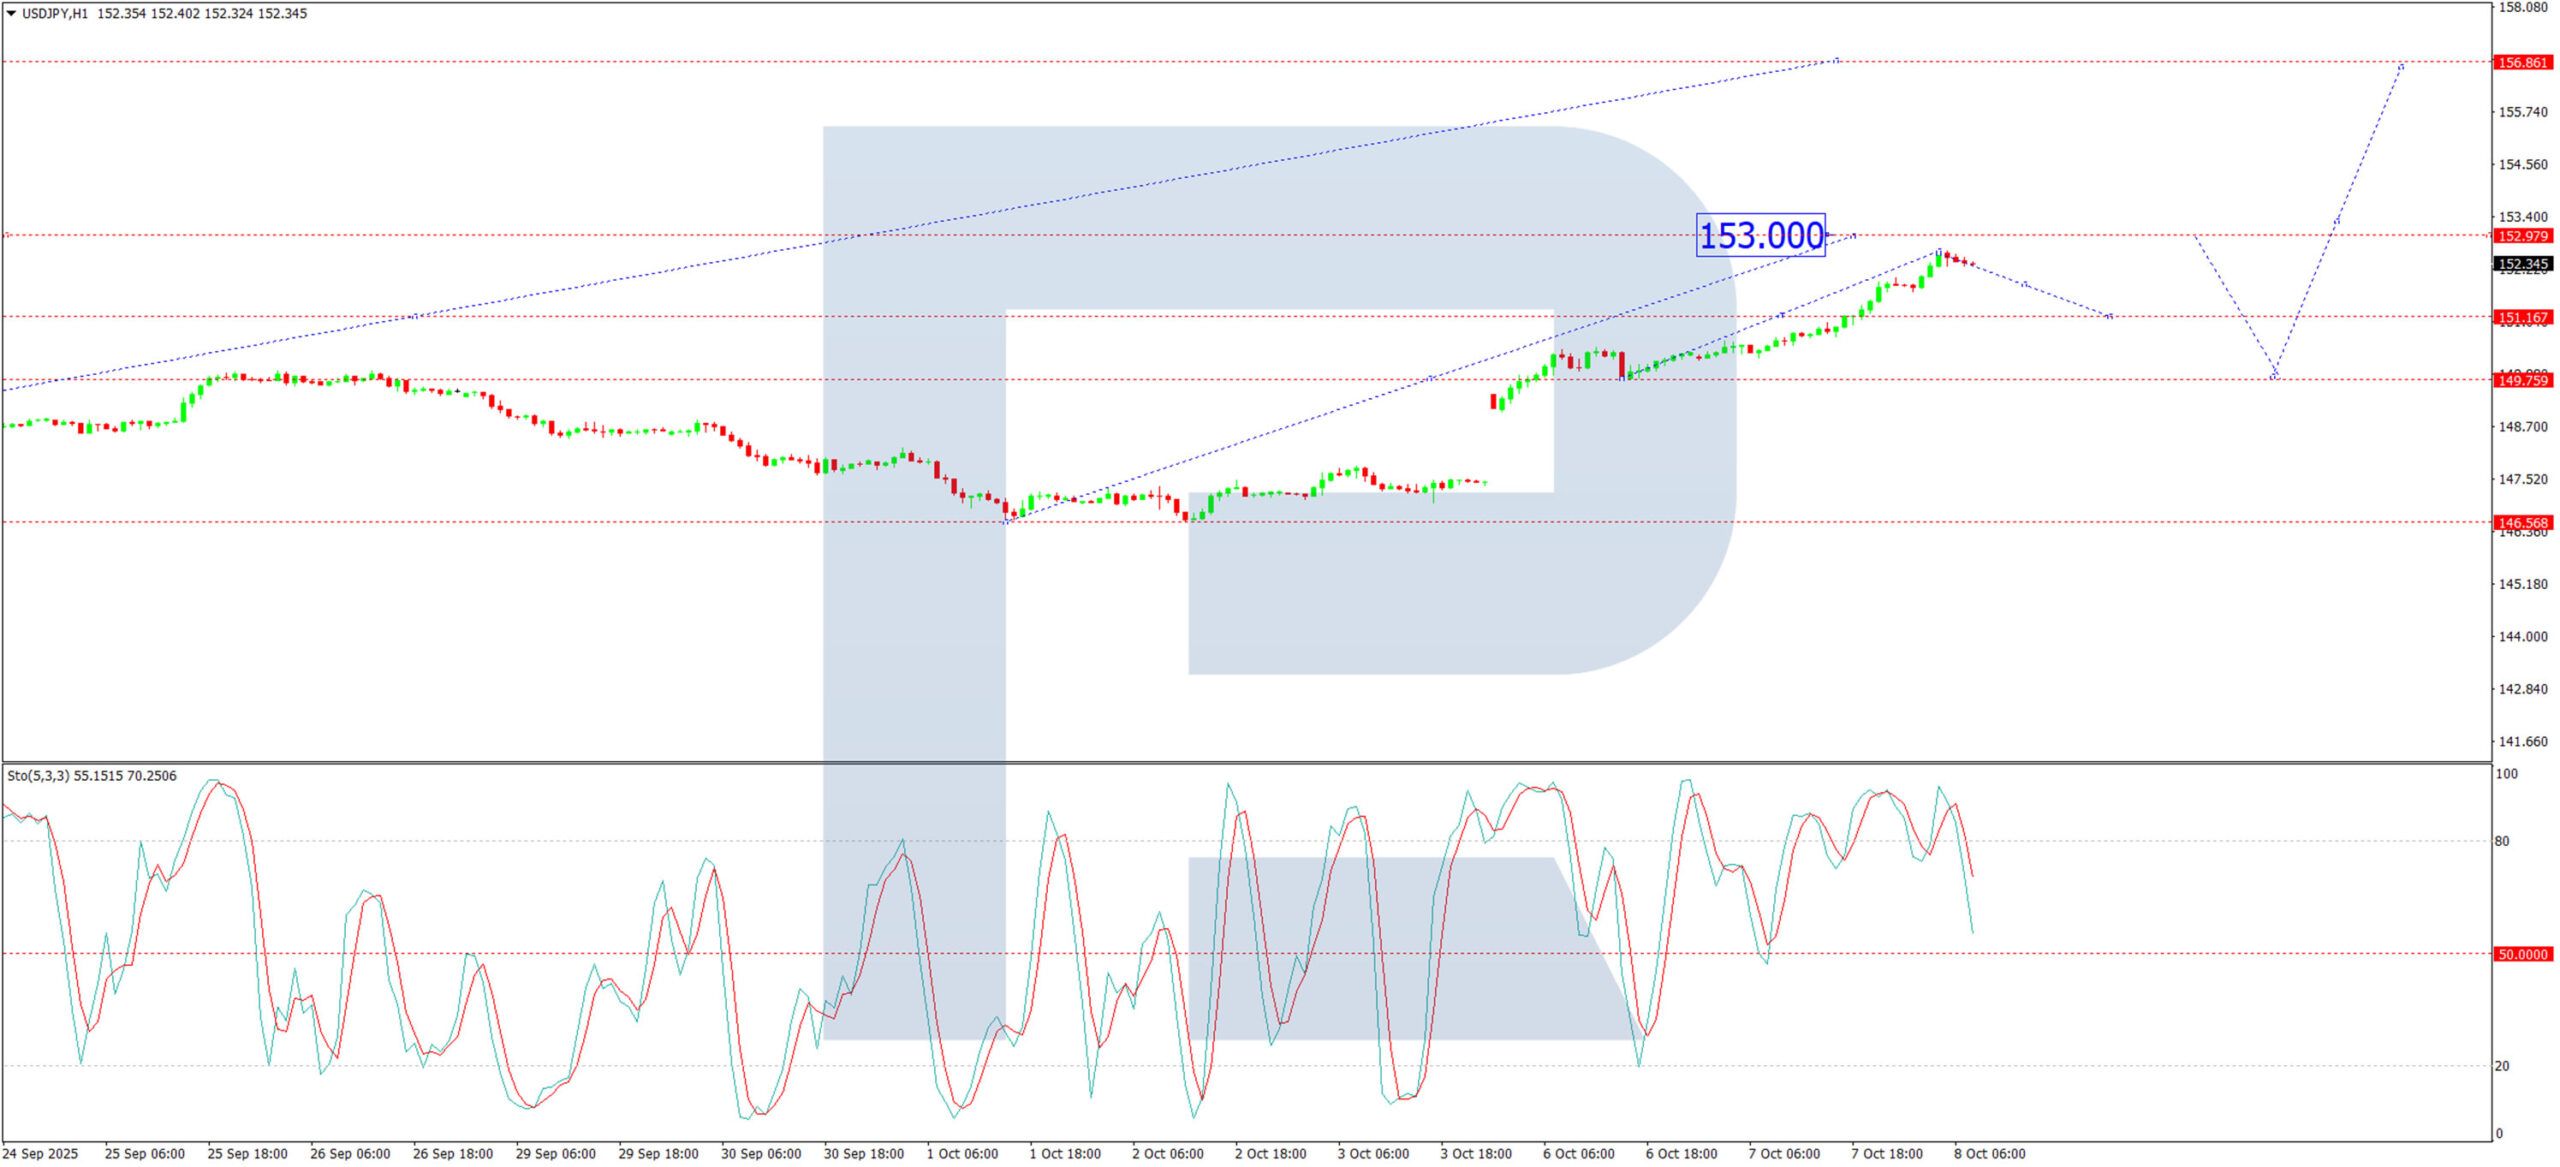
H1 Chart:
On the H1 chart, the market has fulfilled its short-term growth target at 152.62. For the current session, we anticipate a minor decline to the 151.61 support level, which may be followed by another attempt to rise towards 153.00. This intraday view is corroborated by the Stochastic oscillator. Its signal line is currently below the 80 mark and is turning downwards towards 20, suggesting a brief consolidation before the next potential leg higher.
Conclusion
Fundamentally, the yen remains under pressure from weak domestic data and political signals that favour continued stimulus, reducing the likelihood of a near-term policy shift from the BoJ. Technically, the path of least resistance remains upwards, with key resistance at 153.00. A successful break above this level could open the door for a further significant advance, though short-term corrections should be expected within the broader bullish trend.
Euro in Dire Straits as Clock Ticks Down to Tonight’s Deadline for French Caretaking PM
Markets
The euro is in dire straits as the clock ticks down to tonight’s deadline for French caretaking PM Lecornu to report to President Macron on a potential roadmap to install a government. Monday’s semi-optimism about a possible muddling-through scenario makes way for the harsh reality that the current political set-up reached a dead end. Socialists and Republicans have ruled out any accord that would unite them in government, the extreme-right RN smells electoral success and opposes any leftist set-up and even Macron’s close ally Edouard Philippe suggested that Macron should horse-trade his presidency via snap presidential elections (normally 2027) in exchange for a caretaker government pushing through next year’s budget. Macron himself said on Monday that he would take responsibility if Lecornu offers no way out of the political mess. We consider this as calling snap legislative elections, with the two voting rounds to take place in the first half of November (20-40 days after calling elections). This period of extended uncertainty risks hurting French assets and the single currency. The French 10-yr OAT/swap spread tested the YtD top just below 90 bps for a second session straight. The single currency tested, and this morning lost, support coming from the downside of an upward trend channel in the 1.1645-area. The pair changes hands at 1.1615 and is at risk of rapidly sliding towards the early August low at 1.1392. Especially as the USD-side of the equation doesn’t play any role of significance with the government shutdown delaying key data releases and money markets happy with the prospects of 25 bps Fed rate cuts in October and December. FOMC Minutes of the September meeting will be published tonight but they will represent the wide range of view as spelled out in the Summary of Economic Projections and as seen in speeches by Fed governors since that meeting. The US Treasury continues its mid-month refinancing operation with a closely-watched $39bn 10-yr Note auction followed by a 30-yr bond sale tomorrow. The French political/budgetary crisis brings back public finances on bond markets’ radar as a market theme. The euro loses against sterling as well with EUR/GBP (0.8676) drifting from the upper end of the sideways trend channel in place since the start of July (0.8750) towards the lower bound (0.86). A speech by Bank of England chief economist Pill is worth watching today with the outcome of the November BoE-meeting potentially a closer call than markets currently discount (<10% probability of a rate cut).
News & Views
The Reserve Bank of New Zealand cut its policy rate by a bold 50 bps. The decision at least surprised part of the market as a majority of analysts expected a more modest 25 bps step. The RBNZ assesses that annual consumer price inflation is currently around the top of the Monetary Policy Committee’s 1% to 3% target band. However, with spare capacity in the economy, inflation is expected to return to around the 2% mid-point over the first half of 2026. Economic activity through the middle of 2025 was weak, in part, due to domestic constraints on the supply of goods and services in some industries, and the impact of global economic policy uncertainty. Household consumption is recovering, partly because of lower interest rates, and elevated commodity prices continue to support the primary sector. Even as RBNZ both sees upside and downside risks to inflation it concluded that prolonged spare capacity and the associated downside risk to medium-term activity and inflation prevailed as a justification of a 50 bps step. The Committee even indicated that it remains open to further reductions as required. The 2-y NZ government bond yield declines 7 bps this morning (to 2.64%). The kiwi dollar lost about 1% and at USD/NZD 0.574 is trading at the weakest level since April.
Rating agency Fitch in a first assessment of after this week’s Czech elections, indicated yesterday that strong institutional checks will limit the scope for radical near term policy shifts by the next Czech government. It therefore expects the incoming administration led by the ANO-party to maintain a broadly prudent fiscal policy. At the same time, Andrej Babis, the leader of the ANO-party, yesterday indicated that the next government might need to increase the budget deficit for next year by CZK 60bn to provide funding for new spending priorities, including investment infrastructure. This additional deficit spending compares to a 2026 budget deficit proposal/draft of the current government of CZK 286bn, which was already higher than this year’s level due to higher defense spending.
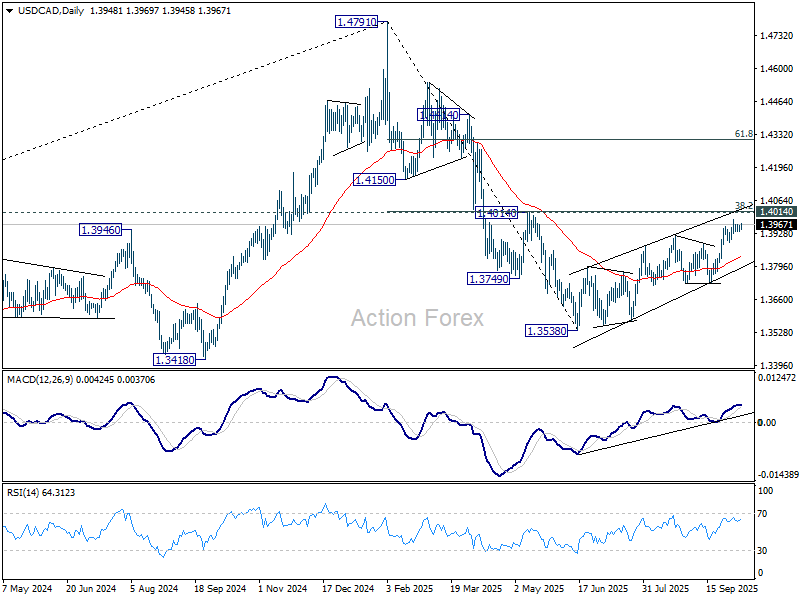
USD/CAD Daily Outlook
Daily Pivots: (S1) 1.3938; (P) 1.3951; (R1) 1.3962; More...
Intraday bias in USD/CAD remains neutral for the moment. While another rise cannot be ruled out, strong resistance is expected from 1.4014/7 cluster to complete the corrective rally from 1.3538. On the downside, below 1.3895 support will turn bias back to the downside for 1.3725. However, sustained break of 1.4014 will carry larger bullish implications.
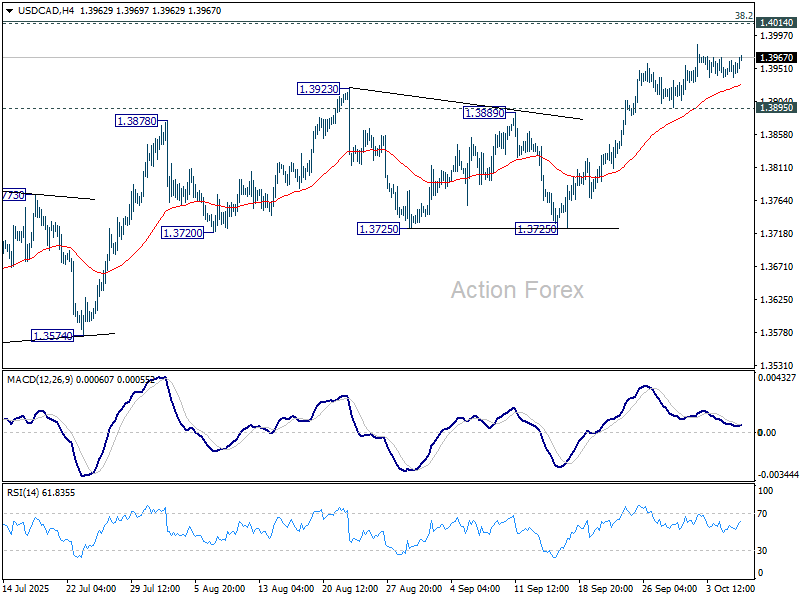
In the bigger picture, price actions from 1.4791 medium term top could either be a correction to rise from 1.2005 (2021 low), or trend reversal. In either case, further decline is expected as long as 1.4014 cluster resistance (38.2% retracement of 1.4791 to 1.3538 at 1.4017) holds. Next target is 61.8% retracement of 1.2005 (2021 low) to 1.4791 (2025 high) at 1.3069. However, sustained break of 1.4014 will argue that fall from 1.4791 has completed, and bring stronger rally to 61.8% retracement at 1.4312.