
Sample Category Title
GBP/USD Mid-Day Outlook
Daily Pivots: (S1) 1.3543; (P) 1.3562; (R1) 1.3581; More...
Intraday bias in GBP/USD is turned neutral first with current retreat, and some consolidations would be seen. Further rally is expected as long as 1.3379 support holds. On the upside, firm break of 61.8% retracement of 1.3867 to 1.3158 at 1.3596 will extend the rise from 1.3158 to retest 1.3867 high.
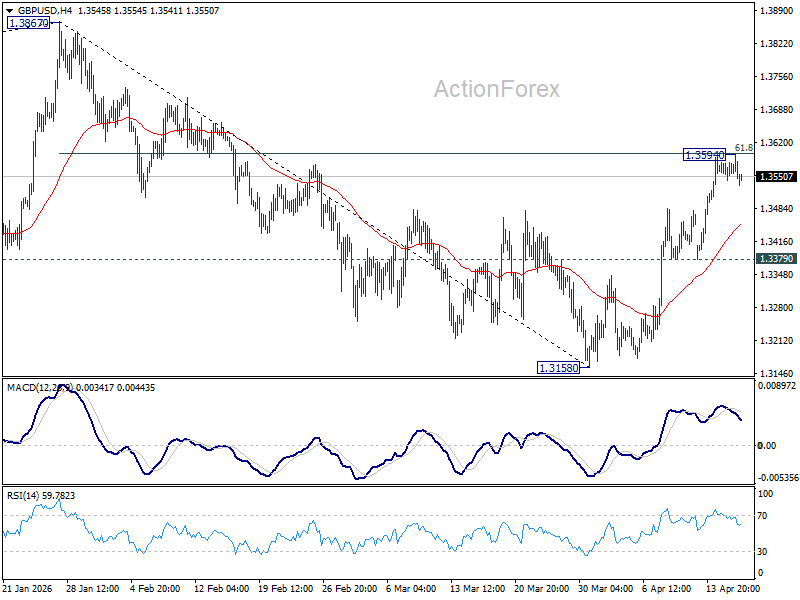
In the bigger picture, current development suggests that price actions from 1.3867 are merely a corrective pattern within the broader up trend from 1.0351 (2022 low). With 1.3008 support intact, medium term bullishness is maintained and break of 1.3867 is back in favor for a later stage, towards 1.4248 key resistance (2021 high).
USD/CHF Mid-Day Outlook
Daily Pivots: (S1) 0.7801; (P) 0.7816; (R1) 0.7835; More….
Intraday bias in USD/CHF is turned neutral first with current recovery. Some consolidations would be seen and further decline is expected as long as 0.7933 resistance holds. Below 0.7789 will resume the fall from 0.8041 to 61.8% retracement of 0.7603 to 0.8041 at 0.7770. Decisive break there will target a retest on 0.7603 low.
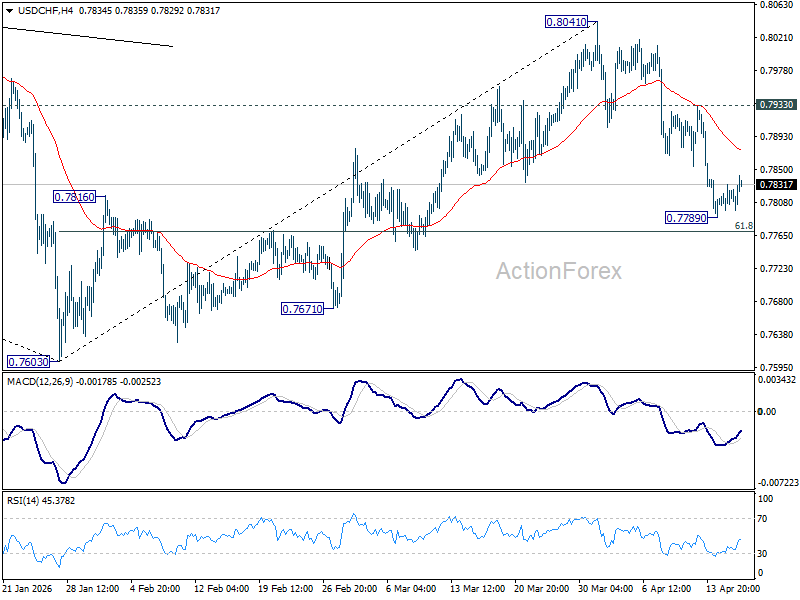
In the bigger picture, rebound from 0.7603 medium term bottom is seen as correcting the fall from 0.9200 only. Rejection by 55 W EMA (now at 0.8071) will affirm this bearish case, and setup down trend resumption to 100% projection of 1.0146 (2022 high) to 0.8332 from 0.9200 at 0.7382 at a later stage. Though, sustained break of 55 W EMA will suggest that it's probably correcting the larger scale down trend from 1.0146 (2022 high).
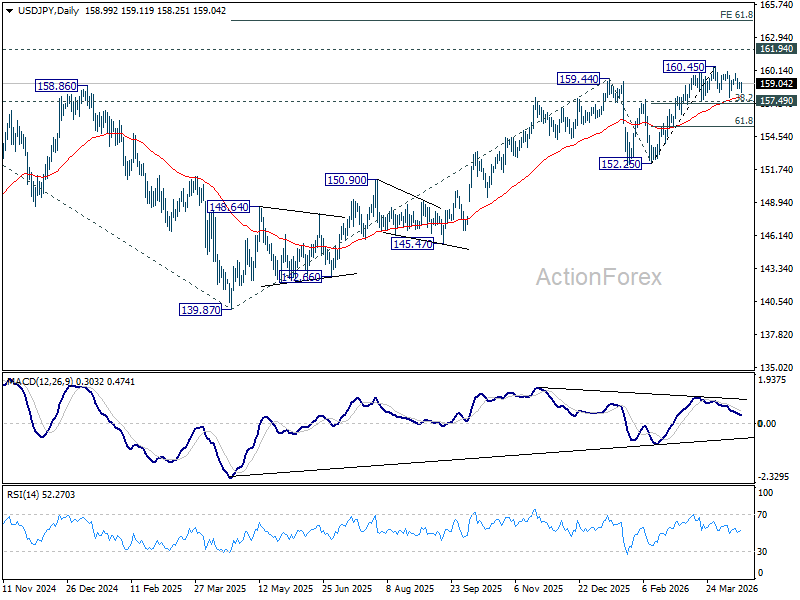
USD/JPY Mid-Day Outlook
Daily Pivots: (S1) 158.67; (P) 158.95; (R1) 159.26; More...
Range trading continues in USD/JPY below 160.45 and intraday bias stays neutral. Outlook will stay bullish as long as 157.49 cluster support (38.2% retracement of 152.25 to 160.45 at 157.31) holds. On the upside break of 160.45 will target a retest on 161.94 high. However, firm break of 157.31/49 will bring deeper fall back to 61.8% retracement at 155.38 next.
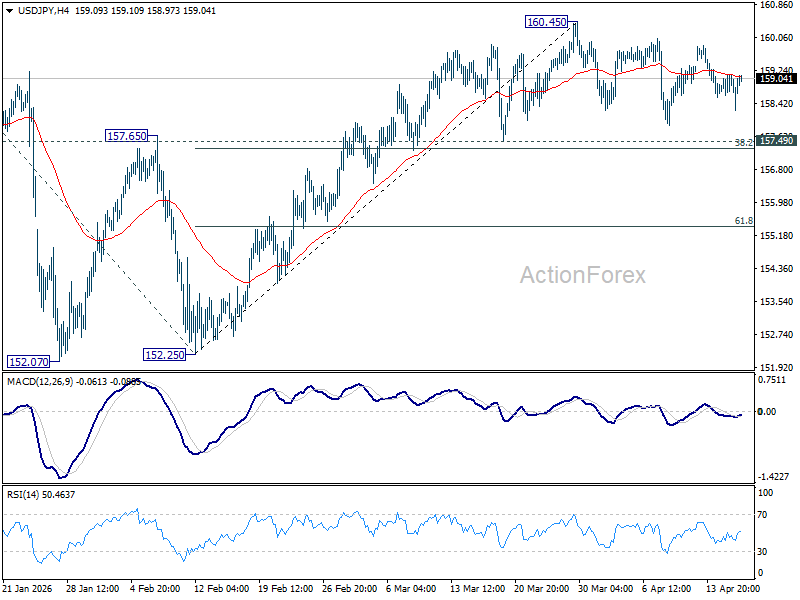
In the bigger picture, outlook is unchanged that corrective pattern from 161.94 (2024 high) should have completed with three waves at 139.87. Larger up trend from 102.58 (2021 low) could be ready to resume through 161.94. This will remain the favored case as long as 55 W EMA (now at 155.24) holds. Firm break of 161.94 will pave the way to 61.8% projection of 102.58 to 161.94 from 139.87 at 176.75.
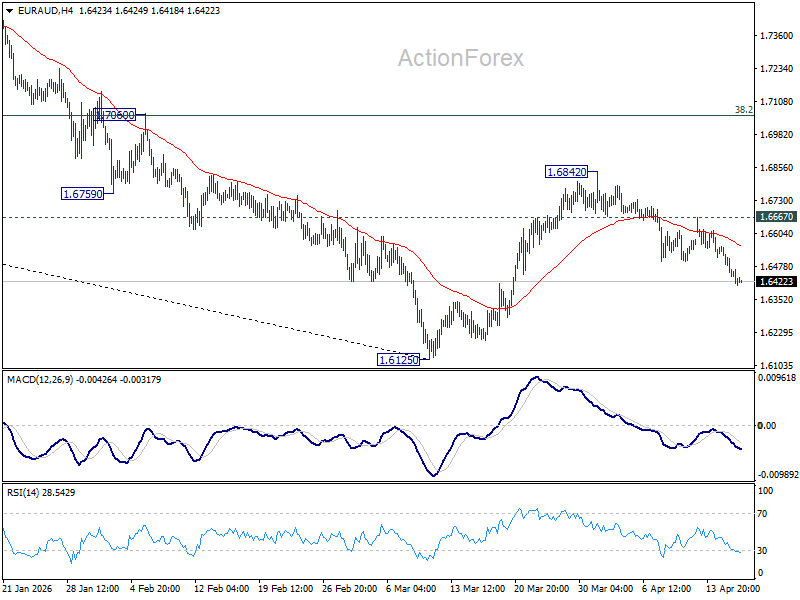
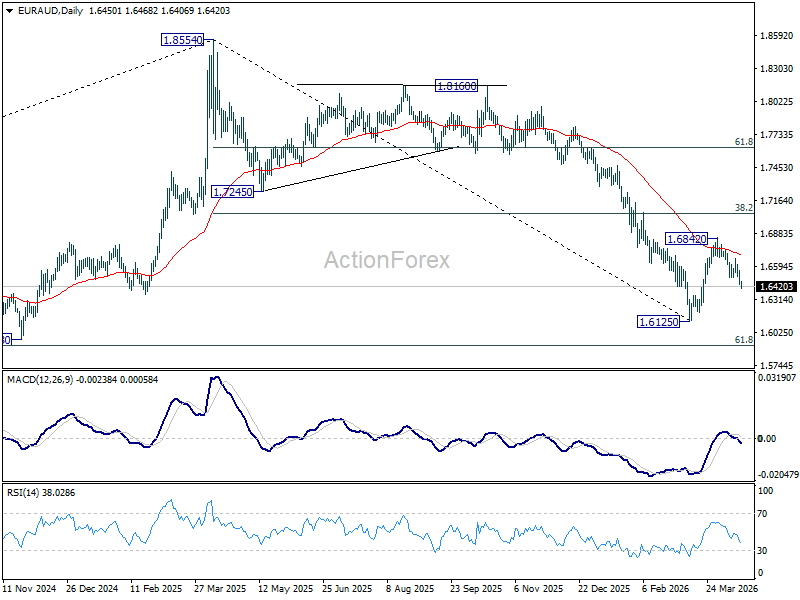
EUR/AUD Mid-Day Outlook
Daily Pivots: (S1) 1.6405; (P) 1.6493; (R1) 1.6544; More...
EUR/AUD's fall from 1.6842 continues today and intraday bias stays on the downside for retesting 1.6125 low. Firm break there will resume whole down trend from 1.8554 to 1.5913 fibonacci level next. For now, risk will stay on the downside as long as 1.6667 resistance holds, in case of recovery.
In the bigger picture, fall from 1.8554 (2025 high) is in progress and deeper decline should be seen to 61.8% retracement of 1.4281 to 1.8554 at 1.5913, which is slightly below 1.5963 structural support. Decisive break there will pave the way back to 1.4281 (2022 low). For now, risk will stay on the downside as long as 55 W EMA (now at 1.7163) holds, even in case of strong rebound.
Risk Appetite Holds Firm Near Highs as ECB Pushback Caps Euro, Aussie Outperforms
Risk sentiment remains firm, but momentum is no longer accelerating. Markets are holding near recent highs as optimism over Middle East de-escalation continues to underpin sentiment, with US futures pointing to another strong open and the potential for fresh record highs in the S&P 500. At the same time, the tone is measured rather than euphoric, suggesting that much of the positive news is already priced in.
Across asset classes, price action reflects this consolidation phase. Oil prices are trading in a tight range just above this week's spike lows, indicating that the war premium has largely stabilized rather than unwound further. Precious metals are also struggling to extend gains, with Gold struggling to build momentum above 4800, and Silver failing to sustain moves above 80. The lack of follow-through highlights a market that is comfortable, but not chasing risk aggressively.
In currency markets, Dollar has staged a modest recovery but remains the worst performer for the week, reflecting the broader unwind of safe-haven demand. Yen is not far behind, while Euro is also lagging. In contrast, Aussie continues to lead, followed by Kiwi and Loonie, reinforcing the view that risk-sensitive currencies remain favored in the current environment.
Euro’s underperformance is being driven by clear pushback from ECB officials against near-term tightening expectations. The March policy accounts emphasized that temporary deviations from the inflation target “could be tolerated” as long as they are “short-lived and limited in size” and do not risk de-anchoring expectations. This signals a willingness to look through the current energy-driven inflation spike.
That stance has been reinforced by recent comments from policymakers. Executive Board member Isabel Schnabel noted that the ECB is in a “relatively favorable” position and stressed that “we do not need to rush into action.” President Christine Lagarde echoed this cautious tone, emphasizing that the current uncertainty “does not determine a rate path,” effectively ruling out any pre-commitment to tightening.
Market pricing reflects this shift. Odds of a rate hike at the April meeting fell to around 20%, while expectations are increasingly shifting toward June, where probabilities rise to around 80%. Goldman Sachs has also pushed back its forecast for the start of the ECB’s tightening cycle to June.
In contrast, Australian Dollar continues to benefit from both global and domestic drivers. Strong employment data has reinforced the case for further tightening by the Reserve Bank of Australia, with the labor market showing little sign of loosening. The steady unemployment rate at 4.3% suggests the economy remains near full employment.
Markets have responded by increasing expectations for a May rate hike, with swaps now pricing around a 67% probability, up from about 60% a week ago. This repricing underscores the divergence in policy outlooks, with the RBA seen as moving closer to further tightening while the ECB remains cautious.
Overall, the current market environment is defined by stability rather than acceleration. Risk appetite is holding firm, but gains are consolidating as investors await the second round of US-Iran talks.
In Europe, at the time of writing, FTSE is up 0.72%. DAX is up 0.68%. CAC is up 0.54%. UK 10-year yield is down -0.018 at 4.740. Germany 10-year yield is down -0.039 at 3.008. Earlier in Asia, Nikkei rose 2.38%. Hong Kong HSI rose 1.72%. China Shanghai SSE rose 0.70%. Singapore Strait Times fell -0.27%. Japan 10-year JGB yield rose 0.002 to 2.406.
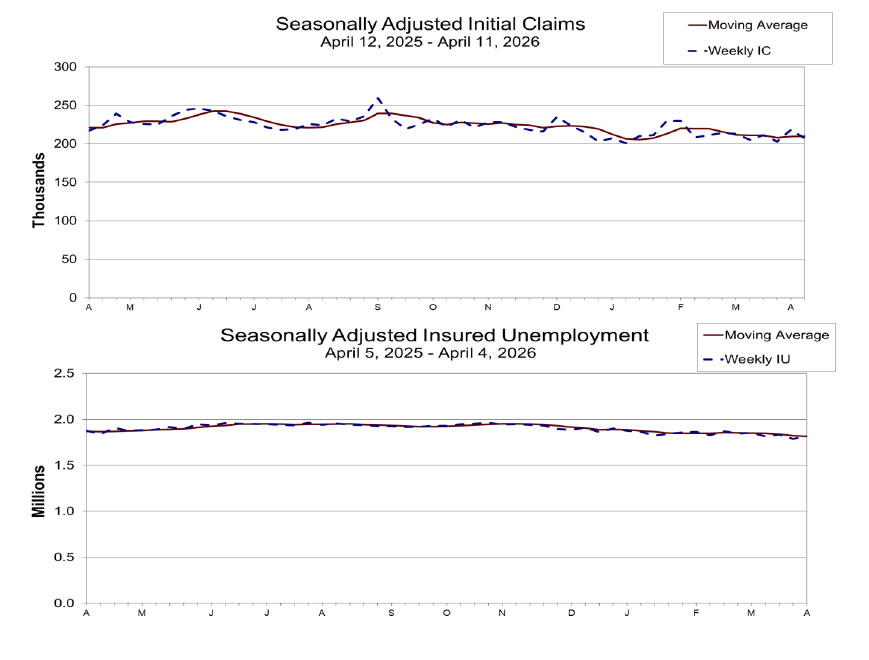
US Initial Unemployment Claims Fall to 207k as Labor Market Remains Tight
US jobless claims fell again, highlighting low layoffs, but rising continuing claims suggest workers are taking longer to find new jobs. Read more.
ECB Minutes Signal Willingness to Tolerate Temporary Inflation Deviations
ECB minutes show policymakers are willing to tolerate temporary inflation spikes, focusing instead on whether pressures become persistent and feed into wages and expectations. Read more.
Eurozone Inflation Jumps to 2.6%, Energy and Services Drive
Eurozone inflation rose sharply in March, driven by energy and services, but core CPI eased slightly—highlighting rising external pressures with stable underlying inflation. Read more.
UK GDP Beats Expectations at 0.5% mom with Broad-Based February Growth
UK economic growth surprised to the upside in February, with GDP rising well above expectations on broad-based gains across key sectors. But beneath the headline strength, underlying trends remain uneven, with construction still dragging on the three-month outlook. Read More.
SNB Minutes Stress Intervention as Franc Surge Threatens Price Stability
SNB minutes show policymakers are ready to intervene as safe-haven flows push the Swiss franc higher, raising risks to price stability. Read more.
Australia's 17.9k Job Growth Driven by Full-Time Gains, Unemployment Rate Steady at 4.3%.
Australia’s labor market held steady in March, with employment rising in line with expectations and full-time jobs surging. Strong gains in hours worked point to resilient labor demand. Read more.
China's 5% GDP Growth Tops Forecasts as Supply Holds Firm, Demand Lags
China’s economy beat expectations in Q1, but weak retail sales and falling investment highlight an uneven recovery driven by supply, not demand. Read more.
EUR/AUD Mid-Day Outlook
Daily Pivots: (S1) 1.6405; (P) 1.6493; (R1) 1.6544; More...
EUR/AUD's fall from 1.6842 continues today and intraday bias stays on the downside for retesting 1.6125 low. Firm break there will resume whole down trend from 1.8554 to 1.5913 fibonacci level next. For now, risk will stay on the downside as long as 1.6667 resistance holds, in case of recovery.
In the bigger picture, fall from 1.8554 (2025 high) is in progress and deeper decline should be seen to 61.8% retracement of 1.4281 to 1.8554 at 1.5913, which is slightly below 1.5963 structural support. Decisive break there will pave the way back to 1.4281 (2022 low). For now, risk will stay on the downside as long as 55 W EMA (now at 1.7163) holds, even in case of strong rebound.
US Initial Unemployment Claims Fall to 207k as Labor Market Remains Tight
US initial jobless claims fell by -11k to 207k in the week ending April 10, coming in below expectations of 215k and signaling continued strength in the labor market. The 4-week moving average edged up slightly to 209,750, but remains consistent with a low level of layoffs overall.
However, continuing claims told a more nuanced story. The number of people receiving ongoing unemployment benefits rose by 31k to 1.818 million, suggesting it is taking slightly longer for displaced workers to find new jobs. Despite the weekly increase, the 4-week average declined to 1.813 million, the lowest level since early June 2024, pointing to broadly stable underlying conditions.
Taken together, low initial claims indicate limited layoffs, while the rise in continuing claims hints at some softening in re-employment dynamics.
| Indicator | Latest | Notes |
|---|---|---|
| Initial Jobless Claims | 207k | Fell -11k, below 215k expectation |
| 4-Week Avg (Initial) | 209.8k | Up +0.5k, still low overall |
| Continuing Claims | 1.818M | Rose +31k, slower re-employment |
| 4-Week Avg (Continuing) | 1.813M | Down -8.25k, lowest since June 2024 |
ECB Minutes Signal Willingness to Tolerate Temporary Inflation Deviations
ECB’s March meeting minutes reinforce a cautious, data-dependent stance, with policymakers signaling no urgency to respond to the latest energy-driven inflation shock. The Governing Council emphasized that it would “closely monitor the situation,” with decisions guided by incoming data to ensure inflation returns to target in a “timely and sustainable manner.” Short-term volatility alone will not trigger a policy shift.
A key takeaway is that the ECB remains willing to tolerate temporary deviations from its inflation target. The minutes noted that such deviations “could be tolerated” as long as they are “short-lived and limited in size” and do not lead to a de-anchoring of expectations. However, the tolerance has limits—“large, sustained deviations” would require “appropriately forceful or persistent monetary policy action.”
At the heart of the discussion is the challenge posed by supply-side shocks from the Middle East conflict. Policymakers acknowledged that these shocks create a dilemma, as preserving price stability “could require a tighter monetary policy, even if this reinforced the adverse impact on growth.” At the same time, if the shock proves temporary, it could be “looked through to avoid imposing unnecessary costs on the economy,” underscoring the importance of judging its duration.
Ultimately, the ECB’s reaction will hinge on whether second-round effects begin to emerge. The Governing Council stressed the need to monitor wage and price-setting behavior closely, warning that policy action would be required if higher costs feed into a “wage-price spiral.” For now, the central bank is firmly focused on the medium term, prepared to act if needed, but equally determined not to move prematurely in response to a shock that may yet prove transitory.
(ECB) Monetary policy accounts
Account of the monetary policy meeting of the Governing Council of the European Central Bank held in Frankfurt am Main on Wednesday and Thursday, 18-19 March 2026
16 April 2026
1. Review of financial, economic and monetary developments and policy options
Financial market developments
Ms Schnabel started her presentation by noting that the period after the Governing Council’s previous monetary policy meeting on 4-5 February 2026 could be divided into two distinct phases. In the first phase, up to the start of the war in the Middle East, the low-volatility and strong risk appetite environment had remained in place. In the second phase, when energy prices had surged in response to the war, volatility had increased in equity markets and especially in bond markets, and there had been sell-offs in both risk asset markets and bond markets.
Brent crude oil prices had surged above USD 100 per barrel to levels last seen after the Russian invasion of Ukraine in 2022. Natural gas prices had also increased substantially, but had remained well below their 2022 levels. At the same time, the Brent crude oil futures curve had shown historically high backwardation – a strong negative slope – suggesting that traders were expecting the spike in oil prices to be reversed quickly. However, over time traders had pared back expectations of a swift reversal of the spike in energy prices. Since the beginning of the war, the Brent crude oil futures curve had gradually shifted upwards and stood visibly above the curve that had prevailed shortly after it started.
Comparing market reactions in the first week of the war with past geopolitical shocks accompanied by energy price increases showed that the reactions of euro area equity prices, the EUR/USD exchange rate and financial market volatility had been at the upper end of the historical ranges. Interest rate markets had reacted more strongly than suggested by historical regularities. The increase in near-term inflation compensation had been at the upper end of the range seen with previous shocks, and was only comparable to the sharp increase after the Russian invasion of Ukraine in 2022. Most notably, in previous episodes, risk-free overnight index swap (OIS) rates and policy expectations had tended to decline in response to energy price shocks, as investors had seemingly priced in the negative impact on economic growth as dominating the inflationary impulse. This time around, markets were pricing in the view that the inflationary effects of the war dominated, requiring a tightening of monetary policy.
The energy supply shock had had a large impact on near-term inflation compensation in the euro area. Inflation fixings (excluding tobacco) for 2026 had increased sharply and inflation-linked swap forward rates stood above 2% across horizons. Longer-term inflation compensation had remained broadly stable, however, reflecting market participants’ assessment of the credibility of monetary policy. The shifts had been driven in broadly equal parts by higher genuine inflation expectations and by higher inflation risk premia, as investors expected higher inflation but also demanded compensation for higher inflation uncertainty in a geopolitically fragmented world. Based on evidence from option prices, the balance of risks to the outlook for inflation over the two-year horizon and the five-year horizon had also shifted up sharply and was currently tilted to the upside, especially over shorter horizons. By contrast, risks over the longer term had remained broadly balanced.
Shifts in inflation compensation, rather than in real rates, had dominated developments in euro area risk-free rate markets. Nominal rates in both the euro area and the United States had moved up significantly. The reassessment of inflation prospects had been substantially more pronounced in the euro area across horizons. At the same time, euro area two-year real rates had declined, reflecting a downward revision to economic growth, whereas US two-year real rates had remained broadly stable. Long-term real rates had increased in the United States but had remained stable in the euro area. Both in the euro area and in the United States, the rise in longer-term nominal rates had been driven by higher short-term rate expectations, indicating expectations of tighter monetary policy, and a higher term premium, reflecting greater uncertainty about the impact of the war on the longer-term outlook for the economy and for inflation.
Following the Governing Council’s previous monetary policy meeting the OIS forward curve had edged lower, pricing in a roughly one-third probability of a 25 basis point rate cut by the end of 2026. This trend had reversed sharply following the start of the war. According to the latest curve, investors were pricing in rate hikes of about 40 basis points by the end of 2026, with some volatility regarding the exact number. Moreover, there had been a sharp rise in uncertainty surrounding the path of the ECB’s monetary policy in response to the energy price shock, after rate uncertainty had hovered around multi-year lows ahead of the war. By contrast, in the Survey of Monetary Analysts, as well as in the subsequent Bloomberg and Reuters surveys, participants had reported that they anticipated that policy rates would remain at their current levels throughout 2026 and 2027. In the United States, markets had revised their monetary policy expectations to a similar degree, despite the US economy being more shielded from the energy shock.
The degree to which asset prices had been affected across countries and sectors depended on their exposure to the energy price shock. The euro area’s terms of trade had deteriorated markedly since the start of the war, reflecting its position as a net energy importer. The exposure to the energy shock was affecting exchange rate dynamics. The EUR/USD exchange rate had closely tracked changes in European energy prices over recent weeks, with the euro depreciating markedly against the US dollar. The euro had, however, held up slightly better than the euro area’s large net energy import position would have suggested. Nevertheless, near-term risks to the EUR/USD exchange rate remained tilted to the downside, while medium-term risks remained broadly balanced, suggesting that markets perceived the terms-of-trade shock to be short-lived.
Risk appetite had deteriorated since the start of the war. The decline had been somewhat more pronounced in the euro area than in the United States, which was consistent with the greater energy dependence of the euro area. That said, the deterioration had remained contained overall. By way of comparison, in response to the Russian invasion of Ukraine in 2022 and the April 2025 tariff shock, risk sentiment had deteriorated much more sharply. The dominant driver of the correction in equity prices since the outbreak of the war in the Middle East had been the rise in risk-free rates. Higher risk premia and somewhat weaker long-term earnings expectations had contributed only to a limited extent. The sharpest correction had been seen for euro area financial stocks, which had underperformed after having significantly overperformed in 2025.
One reason for the underperformance of financial stocks had been their exposure to private markets, which had come under increased scrutiny over past months. Euro area private markets remained small compared with the US market, but they too had grown at double-digit rates since 2010, across both private equity and private credit. One major concern about private markets was their opacity. Recent concerns had focused on the sizeable and growing exposures of private funds to the technology and software sectors. The escalation of geopolitical tensions had added to the concerns about private markets. Tighter financing conditions and weaker growth would exert pressure on highly leveraged firms, reinforcing downside risks in this segment. Several large funds had experienced an increase in the volume of redemption requests and had applied – often contractually stipulated – withdrawal restrictions.
Credit spreads in fixed income markets had also come under some upward pressure. Euro area sovereign bond spreads over OIS rates had widened, with the exception of German bond spreads. Markets judged that the conflict in the Middle East would have some impact on growth and fiscal balances, and this was contributing to a rise in risk premia. Overall, the widening of spreads had remained contained, including in corporate bond markets. This was consistent with the modest tightening seen in financial conditions so far. The ECB’s Macro-Finance Financial Conditions Index (“Macro-Finance FCI”) had tightened on the back of lower risk asset prices and higher long-term interest rates. However, so far it had remained in the range observed since the summer of 2025.
Finally, money markets had hardly been affected by recent events. Demand in the Eurosystem’s standard refinancing operations had been low and stable over the past year as excess liquidity had remained abundant. However, there were encouraging signs that banks were increasingly making sure that they were ready to borrow in these operations, as the number of banks participating in operations had been rising steadily, even if the amounts involved remained small.
The global environment and economic and monetary developments in the euro area
Mr Lane then went through the latest economic, monetary and financial developments in the global economy and the euro area.
Prior to the onset of the war in the Middle East, the incoming information had appeared to broadly confirm the December projections baseline. The war had made the outlook significantly more uncertain, with upside risks to inflation and downside risks to output.
Starting with inflation developments in the euro area, headline inflation had increased to 1.9% in February, from 1.7% in January. Energy inflation had risen to -3.1%, from -4.0% in January, while non-energy inflation had risen to 2.4% from 2.3%. Food inflation had edged down to 2.5%, from 2.6% in January, but core inflation (excluding energy and food) had increased by 0.2 percentage points to 2.4%. Goods inflation had risen to 0.7% in February, from 0.4% in January, in part because of a rebound from the January sales period. Services inflation had increased to 3.4%, from 3.2%, partly reflecting the temporary impact of the Winter Olympics on services inflation in Italy. Indicators of underlying inflation had changed little over recent months and, before the onset of the war, had remained consistent with the 2% medium-term target.
Wage growth had continued to decelerate, with the growth rate of compensation per employee slowing more than expected in the fourth quarter, to 3.7%, from 4.0% in the third quarter of 2025. This was due to a marked compression in wage drift. Negotiated wage growth had increased to 3.0% in annual terms in the fourth quarter, from 1.9% in the third quarter, driven by fading base effects related to previous one-off payments. Forward-looking indicators, such as the ECB wage tracker and surveys on wage expectations, had suggested that labour costs would ease further in the course of 2026. But close monitoring of wages and underlying inflation dynamics would be important, as the energy shock – especially if it turned out to be strong and persistent – had the potential to trigger material indirect and second-round effects.
The war in the Middle East would have a marked impact on near-term inflation through higher energy prices. Crude oil and gas prices had risen sharply since the end of February amid significant disruption of shipping through the Strait of Hormuz and attacks on energy infrastructure in the Gulf region. Oil prices had risen by 47%, to slightly above USD 100 per barrel, since the previous Governing Council meeting, amid considerable volatility. This oil price reaction had been significant but not unprecedented. Oil futures curves had shifted upwards but indicated that investors expected oil prices to fall again over the coming year. European gas prices had risen by 52% since the previous monetary policy meeting and the gas futures curve had shifted upwards, especially at shorter horizons. The increase in gas prices had been compounded by the current low levels of gas inventories in Europe, which left prices vulnerable to supply disruptions. As with oil futures, gas futures displayed a steep downward-tilting slope. The medium-term implications of the war would depend both on the intensity and duration of the energy shock (connected to the intensity and duration of the conflict) and on the strength and breadth of the propagation of the energy shock to the economy and inflation.
In the baseline of the March ECB staff projections, which exceptionally incorporated information up to 11 March, a later cut-off date than usual, headline inflation was seen to average 2.6% in 2026, 2.0% in 2027 and 2.1% in 2028. Relative to the December projections, it had been revised up by 0.7 percentage points for 2026, 0.2 percentage points for 2027 and 0.1 percentage points for 2028. The upward revision for 2026 reflected the marked increase in energy prices. Beyond the near term, the downward slope of the energy futures curves implied a negative base effect in the energy component that would pull inflation down in 2027. Inflation was projected to edge up in 2028 as this base effect faded and the Emissions Trading System 2 was due to be implemented. Inflation excluding energy was seen to average 2.3% in 2026, 2.4% in 2027 and 2.2% in 2028. Core inflation was projected to average 2.3% in 2026, 2.2% in 2027 and 2.1% in 2028. It had been revised up by 0.1 percentage points for 2026, 0.3 percentage points for 2027 and 0.1 percentage points for 2028.
Both market-based and survey-based measures of inflation expectations recorded after the onset of the war had moved up significantly over shorter horizons but pointed to a stabilisation at the 2% target in the medium term. The inflation expectation component derived from market-based inflation compensation measures stood on average at 2.9% for 2026, 2.2% for 2027 and 2.0% for 2028. The profile of a short-lived jump in inflation followed by stabilisation at the target was consistent with the latest round of the ECB Survey of Monetary Analysts, conducted during the first week of the war, and with the most recent Reuters survey, carried out during the second week of the war. In terms of the balance of risks to the inflation outlook, market-based and survey-based measures pointed to upside risks in the near term and broadly balanced risks in the medium term.
The global economy had been resilient so far, but the war in the Middle East created headwinds and the external environment also remained challenging owing to volatile global trade policies. Global GDP growth excluding the euro area had been 0.8% in the fourth quarter of 2025, while global imports had grown by 0.6%. The global growth outlook had remained broadly unchanged in the March projections relative to the previous projection exercise. The carry-over from stronger than expected data releases for 2025 had been offset by downward revisions due to the adverse impact of the war in the Middle East. The euro exchange rate had weakened by 2.9% against the US dollar since the last Governing Council meeting, as the war had triggered a deterioration in global risk sentiment and an adverse energy terms-of-trade shock for the euro area. Against the currencies of the euro area’s major trading partners, the euro had weakened by a more modest 1.4%.
The euro area economy had grown by 0.2% in the fourth quarter of 2025, which was in line with the December staff projections,and by 0.4% when excluding volatile Irish data. Growth had been driven by stronger domestic demand and had been underpinned mainly by services. Rising real incomes had supported private consumption, which had expanded by 0.4% in quarterly terms in the fourth quarter. Construction and housing renovation had strengthened. Non-construction investment had grown by 0.4% – excluding volatile Irish data – supported by investment in intangibles such as research and development, software and databases. Surveys conducted before the war also pointed to resilient activity at the start of the year. However, declines in the euro area Sentix Economic Index and the German ZEW Indicator of Economic Sentiment – both published after the war had started – suggested that the conflict was already weighing on sentiment.
The unemployment rate had remained close to its historical low in January, at 6.1%. Employment growth had been unchanged at 0.2%, quarter on quarter, in the fourth quarter of 2025, supported by an expanding labour force. However, labour demand had continued to soften. The job vacancy rate published by Eurostat had stood at 2.2% in the fourth quarter, while job postings from Indeed pointed to a moderation in demand in February relative to the end of 2025. Meanwhile, the share of firms in the European Commission’s business survey citing labour as a factor limiting production had declined for both manufacturing and services.
With respect to fiscal policies, the euro area fiscal stance was projected to have loosened slightly in 2025 and to continue loosening in 2026, after which it was expected to tighten somewhat over 2027-28. Compared with the December staff projections, the March projections for the fiscal stance were broadly unchanged overall. These projections had followed the usual convention of only including fiscal measures that had already been legislated, or had been announced and were highly likely to be legislated, whereas possible future measures by governments to contain the economic impact from the crisis had not been included.
Looking ahead, the war in the Middle East was clouding the growth outlook by disrupting commodity markets and weighing on real incomes and confidence, which was likely to dampen private consumption and investment dynamics. The economy was now expected to expand at a slower pace in the short term than previously envisaged. The March baseline projections saw growth at 0.9% in 2026, 1.3% in 2027 and 1.4% in 2028. Relative to the December projections, growth had been revised down by 0.3 percentage points for 2026 and 0.1 percentage points for 2027, while it was unchanged for 2028. Private consumption was expected to remain the main driver of growth over the medium term. Investment should also continue to grow, with governments spending more on defence and infrastructure, and firms increasingly investing in new digital technologies.
The war in the Middle East was a major risk event. In line with the Governing Council’s monetary policy strategy commitment to incorporate risks and uncertainty into its decision-making, staff had assessed how the war could affect growth and inflation under some alternative illustrative scenarios. The scenario analysis suggested that a prolonged disruption in the supply of oil and gas would result in inflation being above, and growth being below, the baseline projections in 2026 and 2027. The implications for medium-term inflation depended on the magnitude of indirect and second-round effects of a stronger and more persistent energy shock. Under the severe scenario, medium-term inflation would be markedly above the target in the absence of policy action beyond that embedded in the baseline. By contrast, if the war-related disruptions to commodity markets were to end earlier than assumed and second-round effects remained contained, inflation would be lower and growth higher than in the baseline in 2026 and 2027.
The war in the Middle East had had a pronounced impact on global financial markets. Overall financial conditions had tightened since the Governing Council’s last meeting. Stock markets had fallen and market interest rates in the euro area, especially short-term rates, had risen notably.
As regards bank-based transmission, reporting lags meant that the available data did not yet offer insights into the impact of the war. In January bank lending rates for firms and the cost of issuing market-based debt had both remained at 3.6%, while the average interest rate on new mortgages had edged up to 3.4% after remaining broadly stable at 3.3% for a year. Bank lending to firms had grown by 2.8% on a yearly basis in January, down from 3.0% in December. However, this had been offset by stronger issuance of corporate bonds, with the annual growth rate rising to 4.0%, from 3.5% in December. Mortgage lending had grown by 3.0%, unchanged from December. The upcoming bank lending survey for the euro area and the Survey on the Access to Finance of Enterprises would offer valuable information on the impact of the war on financing and credit conditions.
Monetary policy considerations and policy options
Based on the incoming information and the March 2026 staff projections (including the scenario analyses and the risk assessment), as well as the dynamics of underlying inflation and the strength of transmission, Mr Lane proposed keeping the three key ECB interest rates unchanged while preserving agility to respond as the inflation outlook evolved. The war in the Middle East had made the outlook significantly more uncertain, creating upside risks for inflation and downside risks for growth. The Governing Council was well positioned to navigate this uncertainty. Inflation had been at around its target, longer-term inflation expectations were well anchored and the economy had shown resilience over recent quarters. Although the near-term inflation outlook had been revised up substantially in the March projections, inflation was still seen (based on the 11 March cut-off date) to stabilise around the 2% target over the medium term according to the baseline projection and the adverse scenario. Inflation was expected to return to target in 2027 according to the latest market-based and survey-based measures. However, under the severe scenario, inflation was projected to remain markedly above the target in 2028 in the absence of monetary policy tightening beyond that embedded in the baseline. The scale of potential second-round effects remained uncertain. On the one hand, memories of the 2022 inflation episode could prompt responses that could strengthen the propagation of the current shock to non-energy inflation. On the other hand, the current environment was distinct from the situation in 2022. The expected severity and duration of the energy shock – as reflected in the oil and gas futures curves – had been more contained so far. In terms of the economy, the labour market had been cooling and there were no pronounced sectoral supply-demand imbalances in the euro area economy. The fiscal space to take compensatory measures that could turn out to be inflationary was more limited. The monetary policy stance was broadly neutral, and the Governing Council had firmly demonstrated its commitment and ability to return inflation to target in a timely manner following the 2022 energy shock. Against this background, keeping rates unchanged in March while retaining optionality for future meetings was a prudent approach.
In the period ahead, the incoming information would help the Governing Council gauge the impact of the war on inflation dynamics, activity levels and financial conditions. The data-dependent, meeting-by-meeting approach with no pre-commitment as to the rate path provided a solid framework for determining the appropriate monetary policy stance. In particular, it provided sufficient agility to respond to the inflation shock while guarding against the risk of a premature and too-pronounced tightening of financial conditions.
2. Governing Council’s discussion and monetary policy decisions
Economic, monetary and financial analyses
Regarding the economic analysis, members broadly agreed with the assessment provided by Mr Lane in his introduction and welcomed the efforts made by staff to incorporate the latest information into the baseline projections and accompanying alternative scenarios. Turning to the external environment, global growth had remained robust at the beginning of the year and had exceeded expectations, but US growth in the fourth quarter of 2025 had been revised down significantly. Most recently, the war in the Middle East and the associated increase in energy prices had created headwinds for the global economy and made the outlook significantly more uncertain. It had also led to a depreciation of the euro against the US dollar, which was linked to the energy price increase being an adverse terms-of-trade shock for the euro area, as well as to the deterioration in global risk sentiment. Exchange rate depreciation could put upward pressure on euro area inflation as the strength of the euro had been one of the factors that had previously supported the disinflation process. There was also continuing uncertainty regarding the future evolution of US tariffs.
With respect to commodity prices, oil and gas price developments since the start of the war in the Middle East stood out markedly. Despite strong increases in spot prices, it was argued that energy markets could still be seen as rather sanguine about the situation, as the strong backwardation of futures prices seemed to suggest that a normalisation of global oil and gas supply within the next few months remained a realistic prospect. However, even if there was a rapid resolution of the conflict, it could still take several months for supply through the Strait of Hormuz to be fully restored. In addition, logistical bottlenecks might slow the restarting of energy production. Supply might also be impaired for longer if there was extensive damage to energy infrastructure. Energy facilities in Iran had been targeted by Israel and Iran had retaliated by targeting energy facilities in Qatar. These attacks highlighted the possibility of further unexpected developments, which could rapidly exacerbate the shock but were almost impossible to predict. A prolonged war could increase energy prices further and for longer than currently expected. In view of the limited substitutability for oil in most means of transportation, energy shortages could also lead to a bigger impact on economic activity and inflation than suggested by past regularities. At the same time, it was noted that global strategic oil reserves and the amount of oil still in transit in tankers already at sea provided some level of buffer for now. Besides risks relating to the oil market, it seemed equally important to highlight inflationary risks stemming from the increase in natural gas prices. This was particularly relevant given that levels of gas in storage in Europe were very low, and inventories would likely need to be replenished at elevated prices amid the upcoming phasing-out of Russian liquefied natural gas (LNG) imports from April and greater competition from Asia in LNG markets due to the closure of the Strait of Hormuz. This situation created conditions for a potential broadening of price pressures beyond those stemming from transport fuel prices, considering the link between gas and electricity markets in Europe, as well as the link between gas and fertiliser prices.
With regard to economic activity, members concurred with the assessment presented by Mr Lane. At the beginning of the year the euro area economy had continued to show solid growth momentum, confirming the resilience it had demonstrated over previous quarters. In the fourth quarter of 2025, growth had accelerated broadly across euro area countries. In the euro area as a whole, the economy had grown by 0.2%, driven by stronger domestic demand. On an ex-Ireland basis, the figure rose to 0.4%. Households had increased their spending as real incomes had risen. Unemployment had dropped further, to 6.1%, remaining close to its historical low and underlining the resilience of the labour market, even though there were also some signs of cooling labour demand. Construction and housing renovation had strengthened, and firms had invested more, particularly in areas such as research and development, software and databases. Growth had no longer been weighed down by net exports as in the previous two quarters. It had been underpinned mainly by services. Surveys up to February also pointed to robust activity in early 2026, suggesting a further recovery in manufacturing. Moreover, tailwinds were expected from rising public defence and infrastructure expenditure, especially in Germany. Hence, before the war in the Middle East, the euro area had been on a good path to continue its recovery.
The war was disrupting commodity markets and weighing on real incomes and confidence. This was likely to dampen both consumption and investment, constraining growth. The energy shock would act as a large external tax, weighing significantly on the euro area as a net energy-importing economy. Overall, the war was creating significant uncertainty and constituted a negative supply shock, pushing up inflation and dampening economic activity in the coming months – and possibly even years. At the same time, the starting position of the economy had been quite favourable, with solid growth and inflation close to target, which should help to cushion the impact of the shock. In particular, low unemployment, solid private sector balance sheets, and public spending on defence and infrastructure should still continue to underpin growth.
Against this backdrop, the baseline staff projections for growth, which exceptionally incorporated information up to the later than usual cut-off date of 11 March, had been revised down relative to the December projections, especially for 2026. In the baseline, staff now expected economic growth to average 0.9% in 2026, 1.3% in 2027 and 1.4% in 2028. Staff still saw private consumption as the main driver of growth over the medium term. Investment should also continue to grow, with governments spending more on defence and infrastructure, and firms increasingly investing in new digital technologies. The external environment remained challenging, especially because of the war in the Middle East, but also in light of volatile global trade policies. The war had led to a downward revision of consumption and investment in the baseline staff projections, particularly for 2026. The impact would be even more pronounced in alternative scenarios with a more severe and prolonged energy shock.
Despite the downward revisions, it was argued that the baseline projection for growth could still be seen as too benign, especially since the war could precipitate non-linear effects on growth. First, consumption growth was projected to be supported by a decline in the saving rate. However, in a situation of particularly high uncertainty in which households were concerned about their financial prospects, the saving rate might not fall by as much as expected. It was recalled that the saving rate had been higher than predicted over several projection rounds. Consumption growth could therefore be weaker than projected in the baseline. Second, business investment, and especially investment in artificial intelligence, which had been one of the most dynamic components of investment, could be highly sensitive to constraints on energy availability and to high energy prices. Third, the projection for the global growth outlook might also be too optimistic, as it was based partly on strong US growth. The downward revision of US growth for the last quarter of 2025 suggested that it might not be as resilient as previously thought, which could adversely affect demand for euro area exports. Finally, it was uncertain whether firms would react to lower demand with another period of labour hoarding. Alternatively, as the diffusion of artificial intelligence proceeded, they could use a decline in demand as an opportunity to reduce their workforces, which might lead to a weaker labour market. Such non-linear effects on aggregate demand and the labour market could also result in weaker wage growth, thereby limiting second-round effects of the energy price shock on inflation.
At the same time, it was argued that this was the fourth crisis in six years, and the economy had been more resilient than expected in the pandemic, the inflation surge in 2022 and the recent trade conflict. It might also prove to be resilient this time, reflecting a greater diversification of energy sources, a larger role for renewables and limited direct exposure to the Middle East. In addition, a diversion of tourism from the Middle East to the euro area could boost the economy, while the latest trade deals with India and Australia could support growth over the longer term.
Turning to fiscal policy, it was observed that several governments had already started to prepare support measures to cushion the energy shock and were likely to face further public demands. This posed an upside risk to inflation, especially if the support measures were not limited in time and extent. In the context of constrained fiscal space in many countries, it was also highlighted that broad-based support measures could lead to greater market scrutiny of debt sustainability. Drawing on the lessons from the energy shock in 2022, it was therefore important that any fiscal responses to the current shock were temporary, targeted and tailored, also with a view to maintaining sound public finances.
Regarding structural policies, it was seen as crucial for Europe to continue to diversify its energy supply and address other critical dependencies to reduce vulnerabilities in the future. In this regard, the current energy crisis underscored the imperative to further reduce dependence on fossil fuels. Accelerating the green transition was vital, as this was the best protection against fossil fuel energy shocks, and it was therefore also a matter of strategic autonomy and energy security. More generally, while the euro area economy was now facing pressing short-term challenges, it remained important to bolster its resilience by continuing to implement structural reforms and enhancing the EU’s Single Market. Completing the savings and investments union was vital to fund innovation and support the green and digital transitions. The digital euro and tokenised wholesale central bank money would enhance Europe’s strategic autonomy, competitiveness and financial integration, and would boost innovation in payments. It was thus essential to swiftly adopt the Regulation on the establishment of the digital euro. Simplifying and harmonising rules across the Single Market would help European firms grow faster.
Against this background, members assessed that the risks to the growth outlook were tilted to the downside, especially in the near term. The war in the Middle East was a downside risk to the euro area economy, adding to the volatile global policy environment. A prolonged war could increase energy prices further and for longer than currently expected, and also weigh on confidence. These factors would erode real incomes and make firms and households more reluctant to invest and spend. A worsening of global financial market sentiment could further dampen demand. Additional frictions in international trade could disrupt supply chains, reduce exports and weaken consumption and investment. Other geopolitical tensions, in particular Russia’s unjustified war against Ukraine, remained a major source of uncertainty. By contrast, growth could turn out to be higher if the economic repercussions of the war in the Middle East proved to be more short-lived than currently expected. Moreover, planned defence and infrastructure spending, reforms to enhance productivity, and euro area firms adopting new technologies might drive up growth by more than expected. New trade agreements and a deeper integration of the Single Market could also boost growth beyond current expectations.
With regard to price developments, members concurred with the assessment presented by Mr Lane in his introduction. The increase in energy prices caused by the war would drive inflation materially above 2% in the near term. Indeed, incoming high-frequency data showed that increases in transportation costs were already being observed, driven by sharply rising prices for diesel and jet fuels. Against this backdrop, the baseline staff projections for inflation had been revised up relative to the December projections, especially for 2026. In the baseline, staff now expected headline inflation to average 2.6% in 2026, 2.0% in 2027 and 2.1% in 2028. For inflation excluding energy and food, staff projected an average of 2.3% in 2026, 2.2% in 2027 and 2.1% in 2028. While recognising the exceptional uncertainty, members welcomed the efforts of staff in using a later cut-off date than usual, which had helped to make the baseline projections more meaningful and realistic.
Members discussed the treatment of indirect and second-round effects from higher energy prices in the baseline projections. On the one hand, it was argued that such effects might be greater than had been assumed. The potential impact of the shock on food prices, which would be under pressure from both higher energy costs and higher prices for fertilisers coming at the start of the planting season, was a concern, as food prices played an important role in the formation of households’ inflation perceptions. More generally, the shock was large, so inflation expectations could rise quickly, and there could be non-linearities in price and wage-setting. In particular, given their experience of the inflation surge in 2022 and the low unemployment rate, workers might react quickly to try to recoup losses in purchasing power, posing upside risks to the baseline projection for wage growth. Firms might also increase their prices quickly. It was noted that some large industrial companies had already started to announce price increases for products such as detergents, car tyres, animal food, building materials, nappies, shampoo and rubbish bags. Therefore, it was argued that the pass-through from higher energy prices to goods inflation might be stronger than had been assumed in the baseline projections. In addition, some prospective fiscal support measures in response to the shock could put upward pressure on inflation.
On the other hand, it was argued that the upward revision to the staff projection for wage growth seemed somewhat surprising given the slowing wage growth in the fourth quarter of 2025, the recent downward revision of the ECB wage tracker for 2026, the cooling labour market and weaker expected economic growth due to the energy price shock. In this context, reference was made to an empirical analysis which had found very limited pass-through from energy price shocks to wages, suggesting that the risk of a wage-price spiral might be limited. From this perspective, it was argued that large second-round effects should not necessarily be taken for granted. More generally, it was noted that the deterioration in the terms of trade following the energy price shock essentially worked as an external tax, which had to be absorbed by some combination of workers, firms and governments.
Inflation expectations in the financial markets had moved up significantly over shorter horizons. At the same time, medium-term inflation expectations had remained broadly stable, and most measures of longer-term inflation expectations stood at around 2%, supporting the stabilisation of inflation around the target.
Against this background, members assessed that the risks to the inflation outlook were tilted to the upside, especially in the near term. A prolonged war in the Middle East could lead to a larger and longer-lasting upward shift in energy prices than currently expected, raising euro area inflation further. This could be reinforced and become more persistent if inflation expectations and wage growth were to rise in response, if the energy price increase were to spill over to non-energy inflation to a larger extent than assumed in the baseline, or if the war disrupted global supply chains more broadly. Ongoing trade tensions could also give rise to more fragmented global supply chains, curtail the supply of critical raw materials and tighten capacity constraints in the euro area economy. By contrast, inflation could turn out to be lower if the economic repercussions of the war in the Middle East proved to be more short-lived or if indirect and second-round effects proved less pronounced than currently expected. Inflation could also be lower if tariffs reduced demand for euro area exports by more than expected and if countries with overcapacity increased further their exports to the euro area. More volatile and risk-averse financial markets could weigh on demand and thereby lower inflation as well.
In line with the monetary policy strategy commitment to incorporate risks and uncertainty into the Governing Council’s decision-making, the particularly uncertain economic outlook was exactly the type of situation which called for the baseline staff projections and regular risk assessment to be supplemented with alternative illustrative scenarios. Scenario analysis could help to underscore the wide dispersion of potential inflation and growth outcomes in the current environment and provide a useful framework for processing incoming data as conditions evolved. The approach taken in the staff projections to assess how the war in the Middle East could affect economic growth and inflation under both an adverse and a severe scenario, each with a clear narrative, was therefore particularly welcomed. The scenario analysis suggested that a prolonged disruption in the supply of oil and gas would result in inflation being above, and growth being below, the baseline projections. The implications for medium-term inflation depended crucially on the magnitude of indirect and second-round effects of a stronger and more persistent energy shock. The outcomes in the severe scenario were worse than in the adverse scenario, and even if the severe scenario might seem extreme, it was still viewed as helpful in understanding what might happen if the war in the Middle East escalated substantially and lasted for a very long time. Regarding the adverse scenario, some members wondered whether the latest information was more consistent with that scenario than with the baseline staff projections.
With respect to the communication of the scenarios, members agreed that the baseline, adverse and severe scenarios should all be published. In addition, fully fledged projections with a cut-off date for the technical assumptions of 4 March, one week earlier than the exceptional cut-off date used for the baseline projections, would also be published and could be seen as illustrating a faster than expected end to the war-related disruptions in the commodity markets.
Publishing the different scenarios was seen as very helpful in explaining the range of risks and uncertainties that the Governing Council was facing in relation to the war in the Middle East, and would also demonstrate readiness to act decisively if the situation deteriorated significantly. At the same time, it was important to explain that the scenarios were only illustrative of the uncertainty surrounding the outlook, that they had been constructed with a view to mitigating the risk of potentially underestimating the impact of the shock should there be adverse developments, and that they should therefore not be seen as a forecast or as projections in parallel to the baseline.
It was agreed that ECB staff would regularly update the scenario analysis with new information. This was seen as being a very useful way to provide input for the future policy deliberations of the Governing Council.
Turning to the monetary and financial analysis, members broadly concurred with the assessment provided by Ms Schnabel and Mr Lane in their introductions. Overall financial conditions had tightened since the Governing Council’s previous monetary policy meeting, with the war in the Middle East having had a pronounced impact on global financial markets. Market interest rates in the euro area, especially short-term rates, had risen notably. Financial markets were pricing in close to two 25 basis point interest rate hikes by the end of the year, with the first of these expected around June. Market participants had also become more reluctant to take on risk, and stock markets had fallen.
Heightened volatility in the financial markets was likely to persist unless the war ended rapidly. It was important to watch out for financial stability risks, especially in more severe scenarios, as these could lead to disorderly market corrections. In this context, it was suggested that there were some pre-existing financial sector vulnerabilities. First, equity valuations still appeared to be stretched in the technology sector, especially in the United States, and it was also observed that parts of that sector had a high demand for energy. Second, there were also potential financial stability risks from rapidly growing private credit markets, owing to factors such as opacity, liquidity mismatch, high levels of leverage and interconnections with the wider financial system, and there had been increasing signs of stress in these markets recently. In this context, it was seen as concerning that software firms and other IT firms were involved in a large and growing share of global private credit transactions, as this sat at the intersection of these two risks. At the same time, it was highlighted that the balance sheets of euro area banks were solid. The banking sector was therefore well positioned to withstand possible turbulence ahead.
Regarding the financing conditions applying to households and firms prior to the war, the average interest rate on new mortgages had edged up to 3.4% in January. Mortgage lending had grown by 3.0% on a yearly basis in January, unchanged from December. Bank lending rates for firms and the cost of issuing market-based debt had both remained at 3.6% in January. Bank lending to firms had grown by 2.8% on a yearly basis, down from 3.0% in December. However, this had been offset by stronger issuance of corporate bonds, with the annual growth rate rising to 4.0%, from 3.5% in December. It was noted that increasing bank lending to the non-bank financial intermediation sector seemed to be crowding out corporate lending. It was suggested that this largely reflected the growing use of short-term repo lending for liquidity management, which had become more attractive as repo rates had risen relative to the deposit facility rate. At the same time, money market transactions taking place at rates above the deposit facility rate were to a large extent driven by hedge funds, so they should not yet be interpreted as reflecting any reserve scarcity among banks.
Monetary policy stance and policy considerations
Turning to the monetary policy stance, members assessed the data that had become available since the last monetary policy meeting in accordance with the three main elements that the Governing Council had communicated in 2023, and updated in July 2025, as shaping its reaction function, namely: (i) the implications of the incoming economic and financial data for the inflation outlook and the risks surrounding it; (ii) the dynamics of underlying inflation; and (iii) the strength of monetary policy transmission.
Starting with the inflation outlook, the war in the Middle East had fundamentally changed the outlook and also made it significantly more uncertain. Through higher energy prices, the war would have a significant impact on near-term inflation, driving it materially above 2%, which contrasted with the previously projected moderate undershooting of the target. Consistent with this, inflation expectations in the financial markets had moved up significantly over shorter horizons.
The implications for medium-term inflation – the key element in the monetary policy strategy – were very hard to gauge at this stage, partly because of fundamental uncertainty over the evolution of the war and highly volatile energy markets. The extent of the impact would depend on the intensity and duration of the conflict, associated damage to energy infrastructure and oil or gas production shutdowns, and the openness of key supply routes including the Strait of Hormuz. All of these factors could affect the scale and persistence of higher energy prices and in turn how energy prices affected non-energy consumer prices and the economy through indirect and second-round effects. The extent and severity of these effects would be a key determinant of the implications of the shock for medium-term inflation. The effects were uncertain, and it would take some time for them to unfold and to ascertain their size, so the situation required close monitoring. However, it was noted that the longer and more extensive the conflict, and the bigger and more prolonged the shock to the global energy supply, the higher was the risk to medium-term inflation and the Governing Council’s medium-term price stability objective. Still, medium to longer-term inflation expectations currently remained well anchored. Most measures of longer-term inflation expectations stood at around 2%, which also supported the stabilisation of inflation around the target.
Against this background, all members viewed the risks surrounding the inflation outlook as tilted to the upside relative to the baseline staff projections, especially in the near term. The upside risks to medium-term inflation had clearly increased since the time of the Governing Council’s previous monetary policy meeting, and the risk of undershooting the target had disappeared for the time being. Upside risks were rising as the duration of the war in the Middle East extended, and it was suggested that the ongoing escalation made a quick resolution increasingly unlikely. A prolonged war could lead to a larger and longer-lasting upward shift in energy prices than expected in the baseline, raising euro area inflation further. This could be reinforced and become more persistent if inflation expectations and wage growth were to rise in response, if the energy price increase were to spill over to non-energy inflation to a larger extent than assumed in the baseline, or if the war disrupted global supply chains more broadly. These risks were consistent with the staff scenario analysis, which suggested that a prolonged disruption in the supply of oil and gas would result in inflation being above the baseline projections, with the implications for medium-term inflation depending crucially on the magnitude of indirect and second-round effects of a stronger and more persistent energy shock, but with a clear possibility of persistent inflationary pressures.
It was highlighted that the risk of second-round effects was state-contingent. Large and sufficiently persistent commodity price shocks had the potential to generate non-linear effects and were more likely to pass through to underlying inflation, and it was argued that these non-linearities were not well captured by standard models. In addition, the closure of the Strait of Hormuz or attacks affecting wider transport infrastructure could lead to the misallocation of shipping resources and broader supply chain disruptions, for example for refined products, fertilisers, petrochemicals, metals and helium. This could result in higher food prices, shortages of key products such as semiconductors, higher freight rates and longer delivery times in global trade, against a backdrop of ongoing trade tensions that still had the potential to give rise to more fragmented global supply chains, curtail the supply of critical raw materials and tighten capacity constraints in the euro area economy. It was noted that the magnitude of second-round effects depended on broader macroeconomic conditions, especially the strength of demand, profit margins and the tightness of the labour market, since these factors determined the ability of firms to pass through higher costs to consumer prices and the ability of workers to negotiate higher wages. On the one hand, it was argued that the tight labour markets and robust global growth seen before the war could mean that the shock might unleash significant second-round effects and thus pose risks to the expected pace of disinflation. On the other hand, the shock could have a major, stronger than expected downward impact on external demand and could significantly weaken domestic demand, amid high uncertainty, already shaky consumer confidence and a saving rate that was still high. In this case, second-round effects could be more limited than assumed in the projections, since firms might be inclined to resist strong wage demands in view of challenges in passing on higher costs, and they could also increase lay-offs, thereby reducing wage pressures. Such dynamics could pose a downside risk to the growth and inflation outlook.
More generally, inflation could turn out to be lower if the economic repercussions of the war in the Middle East proved to be more short-lived or if indirect and second-round effects proved less pronounced than currently expected. In particular, if the war was resolved promptly and energy prices normalised swiftly, second-round effects would be limited and there would probably be only a short-lived impact on headline inflation, although it was highlighted that supply disruptions and other effects of the war would probably still persist for several months. It also remained possible that inflation could be lower if tariffs reduced demand for euro area exports by more than expected and if countries with overcapacity further increased their exports to the euro area. While it was suggested that disinflationary effects from Chinese imports were now unlikely, as Chinese companies were also facing notably higher input costs, it was pointed out that this did not affect competitiveness and disinflationary pressures from cheaper Chinese goods in relative terms.
In this context, members discussed how the current environment compared to the situation at the time of the energy shock triggered by the Russian invasion of Ukraine in 2022, after which significant second-round effects and non-linearities had come into play. Overall, although memories of the 2022 shock were still fresh, the current situation was clearly distinct from 2022 and it was important to recognise the differences between the two episodes.
In particular, the starting position for inflation was much more favourable now than it had been in 2022. Inflation had stood at almost 6% in February 2022, while it was now close to 2% after being broadly stable at around the target for about a year. Inflation expectations prior to the current shock had been well anchored and the outlook before the war had suggested that inflation should stabilise at the 2% target in the medium term. Supply and demand were now more balanced than in 2022. The energy shock in 2022 had occurred in the context of strong pent-up demand after the post-pandemic reopening, global supply chain pressures and bottlenecks, and highly accommodative fiscal and monetary policy. By contrast, the economy was currently experiencing more subdued growth amid relatively weaker demand conditions, with moderating wage pressures, significantly lower pre-existing supply chain pressures and a broadly neutral fiscal and monetary policy stance. In addition, while the Russian invasion of Ukraine had led to a persistent impairment of the gas and oil supply, the expected severity and duration of the current energy shock had been more contained so far. Still, its persistence was subject to significant uncertainty and, even if the Strait of Hormuz reopened quickly, there could also be a lasting impact on supply this time, especially if there were extensive damage to energy infrastructure. However, Europe was better prepared than it had been in 2022, because energy supplies were more diverse thanks to the further development of green energy and a more diversified gas supply, and because nuclear power shutdowns on the scale experienced in 2022 were not currently foreseen.
At the same time, the memory of the 2022 inflation episode and the experience of above-target inflation over many years might mean that second-round effects could now materialise more quickly. A generation of people had experienced high inflation for the first time in 2022, partly precipitated by a war-related energy shock. This episode was still fresh in people’s memories, with the after-effects still being felt given the long lags for cumulated wage increases to catch up with the cumulated increase in prices throughout that period. Therefore, much more attention was likely to be paid to price rises now than had been the case at the time of the previous energy shock. It was also observed that inflation had not come down as quickly as projected in even the severe scenario prepared by staff in March 2022. All of this might imply greater sensitivity of households and firms to the energy shock triggered by the war in the Middle East. Given these factors, medium-term inflation expectations might be more fragile now and could increase more quickly than in the past, especially if food inflation were to increase. In particular, workers might react more quickly this time around to try to recoup losses in purchasing power by making higher wage claims earlier than in the previous episode, especially given that unemployment was low, or by calling for support from governments more swiftly. Firms might also increase their prices more quickly this time, especially as they had learnt from the previous inflation episode that they could easily do so. In the other direction, the absence of pent-up demand meant that the growth outlook was more fragile than in 2022, amid still high US tariffs, elevated trade policy uncertainty and limited space for fiscal support.
Turning to underlying inflation, the indicators had changed little over recent months and members concurred that, before the energy price shock, they had remained consistent with the 2% medium-term target. Corporate profits had recovered further in the fourth quarter of 2025, while unit labour costs had risen at a similar rate as in the previous quarter. Although wage growth still remained elevated, growth in compensation per employee had slowed to 3.7%, from 4.0% in the third quarter. Looking ahead, negotiated wage growth and forward-looking indicators, such as the ECB’s wage tracker and surveys on wage expectations, had suggested that labour costs would ease further in the course of 2026. At the same time, the projected path of core inflation in the March 2026 staff baseline projections was higher than in the December 2025 staff projections, mainly owing to indirect effects from higher energy prices feeding into inflation excluding energy and food. In addition, both domestic and services inflation remained elevated. There was also a risk that uncertainties related to tariffs and future energy price developments might mean that firms would be less inclined to buffer shocks through their profit margins and could instead increase their mark-ups. More generally, if persistent, higher energy prices might lead to a broader increase in inflation through indirect and second-round effects, a situation which required close monitoring.
Finally, the transmission of monetary policy continued to be smooth and effective. Owing to reporting lags, the available data did not yet offer insights into the impact of the war in the Middle East on bank-based transmission. However, the tightening of financial conditions since the onset of the war would probably result in higher financing costs, tighter credit conditions and weaker credit growth, which could amplify the likely weakening of economic activity. A further worsening of global financial sentiment and increase in volatility, or the materialisation of financial stability risks, could also lead to greater risk aversion in the euro area financial system and financial amplification effects, which could weigh on demand and thereby also lower growth and inflation.
Monetary policy decisions and communication
Against this background, all members supported the proposal made by Mr Lane to keep the three key ECB interest rates unchanged. Given the rapidly changing circumstances, it was the Governing Council’s duty to remain calm, focused, accountable to European citizens and fully committed to delivering on its mandate. In this context, members emphasised their collective determination to ensure that inflation would stabilise at the 2% target in the medium term.
The war in the Middle East had made the outlook significantly more uncertain, creating upside risks for inflation and downside risks for economic growth. It would have a material impact on near-term inflation through higher energy prices. Its medium-term implications would depend both on the intensity and duration of the conflict and on how energy prices affected consumer prices and the economy. However, there were many unknowns about how the shock would unfold and there was currently too little evidence to reach any firm judgements on its medium-term implications.
The Governing Council was well positioned to navigate the current uncertainty. The starting point prior to the war had been good. Inflation had been at around the 2% target, longer-term inflation expectations were well anchored, the policy stance was broadly neutral without any pre-commitment to a particular rate path, and the economy had shown resilience over recent quarters. Following the successful disinflation over the past few years, with the ECB having brought inflation back to target without a recession or financial stability problems, the credibility of the ECB to do whatever was necessary to deliver on its mandate was also high.
Against this backdrop and in view of the exceptional uncertainty surrounding both the evolution of the war and the medium-term inflation outlook, the option value of waiting was high on this occasion, and it was therefore appropriate to leave policy rates unchanged. Given that the current policy stance was broadly neutral and the next monetary policy meeting was only six weeks away, the well-established meeting-by-meeting approach still left the Governing Council with sufficient flexibility to react at short notice if necessary. It was also in line with the data-dependent approach, as it would allow more time for the Governing Council to see how the war evolved, understand the magnitude and persistence of the shock and monitor the scale of potential second-round effects before taking action. In particular, the incoming information in the period ahead would help the Governing Council assess how the war was affecting the inflation outlook and the risks surrounding it.
With regard to communication, members reiterated that the Governing Council’s future interest rate decisions would continue to be based on its assessment of the inflation outlook and the risks surrounding it, in light of the incoming economic and financial data, as well as the dynamics of underlying inflation and the strength of monetary policy transmission. The Governing Council would also continue to follow a data-dependent and meeting-by-meeting approach to determining the appropriate monetary policy stance without pre-committing to a particular rate path.
The Governing Council needed to be prepared for all eventualities. Recent events had shown that the environment could change rapidly, and uncertainty regarding both the war and its economic impact was likely to remain very high in the future. However, it was also possible that this uncertainty might be resolved in one direction or the other over the coming weeks or months. Given all of this, it was important for the Governing Council to keep its options open for future meetings and to be agile to react quickly if and when the outlook for medium-term inflation called for policy action. The meeting-by-meeting approach without any pre-commitment to a particular rate path was especially helpful at this juncture.
In this highly uncertain environment, it was also important for the Governing Council to maintain a steady hand, be clear about what was known and what was not known, articulate a clear narrative and avoid overreacting to potentially rapidly changing news. At the same time, vigilance was vital and the decision to keep interest rates unchanged at the current meeting should not be seen as diminishing the Governing Council’s readiness to act if required. Therefore, it was important to communicate that the Governing Council was firmly committed to delivering 2% inflation over the medium term, was closely monitoring the situation, and would not hesitate to act if there were a threat to its price stability objective. Such communication could give confidence to households and firms that the Governing Council would continue to do whatever was necessary to ensure that inflation stabilised at the 2% target in the medium term, thereby also helping to ensure that inflation expectations remained well anchored and manage potential second-round effects. Confidence in the Governing Council to manage the current situation effectively could be further strengthened by referencing the recently updated monetary policy strategy commitment to incorporate risks and uncertainty surrounding the outlook into decision-making, including via enhanced toolkits for scenario and sensitivity analyses.
Looking ahead, the Governing Council would closely monitor the situation, and its data-dependent approach would help it to set monetary policy as appropriate to ensure that inflation stabilised sustainably at the medium-term target.
The insights from the recently concluded monetary policy strategy assessment would inform the evaluation of how to respond to the current shock, especially since a major focus of the assessment had been on how to handle more frequent and larger supply shocks, which was now turning out to be very relevant. In particular, deviations from the inflation target – in either direction – could be tolerated, as long as they were short-lived and limited in size, and as long as inflation expectations remained well anchored. However, large, sustained deviations of inflation from the target would call for appropriately forceful or persistent monetary policy action to keep inflation expectations anchored. Therefore, the Governing Council needed to be firmly focused on the medium term. Monetary policy could not prevent the first-round short-term inflation spike resulting from higher energy prices, but it was for monetary policy to ensure that indirect and second-round effects remained limited and that inflation returned to target in a timely and sustainable manner.
In this regard, supply-side shocks, like the one currently being experienced, posed a dilemma for central banks. Preserving price stability could require a tighter monetary policy, even if this reinforced the adverse impact on growth from the shock itself. Provided that the supply shock remained short-lived, it could be looked through to avoid imposing unnecessary costs on the economy. However, if there was a threat that inflation could deviate sustainably from target, policy action would be necessary to ensure that inflation expectations remained anchored and that the pass-through of higher costs to selling prices and wages did not give rise to a wage-price spiral. Therefore, the monetary policy reaction would hinge crucially on the extent to which firms and employees incorporated the initial inflation shock into their price and wage-setting. In particular, while wages would have to catch up to some extent, it was important to watch out for indications of excessive second-round effects and any signs that medium to longer-term inflation expectations might be becoming unanchored, as well as to carefully monitor the persistence of the energy price shock.
Identifying higher-frequency or softer early warning indicators would be helpful in this respect. First, it was important to assess the impact of the shock on the inflation expectations of firms and households, based on the Consumer Expectations Survey, the Survey on the Access to Finance of Enterprises and the European Commission’s business and consumer surveys. In this regard, the entire distribution of inflation expectations should be considered, since shifts in the right tail could be informative for identifying risks of unanchoring, provided that the right tail reflected the behaviour of early movers rather than economic agents overreacting to the shock. Although medium-term expectations were most relevant, it was also highlighted that shorter-term inflation expectations could matter for inflation and wage outcomes. In turn, short-term inflation expectations were often affected by inflation perceptions, which were heavily influenced by prices of the most salient goods, such as food and petrol. At the same time, it was noted that, in assessing shorter-term expectations, there was a need to determine the extent to which these expectations simply reflected an understanding that inflation would always take a year or two to decline following a significant spike in prices, as opposed to being a causal factor that could amplify the shock. Second, it was crucial to monitor the price-setting behaviour of firms because the causal chain from households’ and firms’ expectations to inflation operated via the actual decision-making of firms, and selling prices would help to assess whether the risk of second-round effects was material and imminent. In this regard, the evolution of producer prices could help gauge potential pipeline pressures. Another important indicator was firms’ selling price expectations, which were published regularly by the European Commission, in the Purchasing Managers’ Indices and in the Survey on the Access to Finance of Enterprises. These data sources could be complemented by information from monthly surveys of firms conducted by some national central banks. In addition, monitoring the frequency of price changes would be useful, partly because it could give an early indication of any potential steepening of the Phillips curve. More generally, it was important to watch out for signs that elevated energy prices were spilling over to food prices or to the prices of other goods and services, with the prices of energy-intensive goods and services, such as plane tickets, likely to react first. Third, it would be useful to monitor the strength of demand and the evolution of profit margins in order to assess the ability and willingness of firms to pass through higher input costs to consumer prices. High-frequency data on activity, employment and consumption were likely to be particularly important, since hard data on growth were only available with a substantial lag. In this respect, over and above monitoring standard indicators of confidence and sentiment among firms and households, it would be useful to consider high-frequency data that might be available in some euro area countries, such as information on credit card spending and fiscal data. Fourth, indicators of the tightness of the labour market should be monitored to assess the bargaining power of workers in wage negotiations. In this regard, upcoming wage agreements should inform the assessment of whether wage demands were being pushed up by higher inflation or restrained by weaker economic growth. Fifth, indicators of underlying inflation remained highly relevant, and their evolution in the period ahead should be scrutinised for signs of pass-through via indirect and second-round effects. It would also be useful to monitor the share of the core inflation basket for which momentum was accelerating. Sixth, it was important to look at indicators of supply chain disruptions, such as freight costs, delivery times and export restrictions, since there was a risk that the large increase in freight rates already seen around the Persian Gulf could start spreading to other parts of the world. Finally, close monitoring of financial markets and financial conditions was necessary, including to watch for potential financial stability issues.
Scenario analysis would continue to be an important tool for navigating the highly uncertain inflation and growth outlook. One concrete outcome of the 2025 strategy assessment had been the decision to explicitly reference the role of scenario and sensitivity analyses in helping to inform decision-making, and models had been enhanced to incorporate the lessons from past experience and the many crises that the global economy had faced over the past six years. Therefore, the Governing Council was well positioned in terms of the analytical tools at its disposal to guide its future decisions. In particular, scenario analysis was complementary to the baseline projections and allowed the Governing Council to assess risks associated with the energy shock that standard tools struggled to capture, such as significant non-linearities and second-round effects. Incoming data could then be monitored to assess which scenario seemed to be crystallising, thereby facilitating swift policy action if necessary. At the same time, it was important not to act prematurely on the basis of adverse or severe scenarios, unless incoming data suggested that they were becoming increasingly likely.
Members also discussed considerations related to future policy choices. By the time of its next monetary policy meeting, the Governing Council would have more information regarding the duration and magnitude of the conflict, the persistence of its effect on energy prices, and fiscal support measures that might be implemented, as well as initial insights from many of the key indicators that had been discussed. All of this would help to assess whether developments were moving in line with the baseline outlook or one of the scenarios, even though it might still be difficult to judge whether there was a threat to the price stability objective. However, it was important to stand ready to act should there be evidence that medium-term inflation was likely to deviate materially from the target owing to greater persistence of the shock or strong indirect and second-round effects leading to more broadly embedded underlying inflationary pressures.
Taking into account the foregoing discussion among the members, upon a proposal by the President, the Governing Council took the monetary policy decisions as set out in the monetary policy press release. The members of the Governing Council subsequently finalised the monetary policy statement, which the President and the Vice-President would, as usual, deliver at the press conference following the Governing Council meeting.
Monetary policy statement
Monetary policy statement for the press conference of 19 March 2026
Press release
Meeting of the ECB’s Governing Council, 18-19 March 2026
Members
- Ms Lagarde, President
- Mr de Guindos, Vice-President
- Mr Cipollone
- Mr Demarco
- Mr Dolenc
- Mr Elderson
- Mr Escrivá
- Mr Kazāks
- Mr Kažimír
- Mr Kocher
- Mr Lane
- Mr Makhlouf*
- Mr Müller*
- Mr Nagel*
- Mr Panetta
- Mr Patsalides*
- Mr Pereira
- Mr Radev
- Mr Rehn
- Mr Reinesch
- Ms Schnabel
- Mr Sleijpen
- Mr Stournaras*
- Mr Villeroy de Galhau
- Mr Vujčić*
- Mr Wunsch
* Members not holding a voting right in March 2026 under Article 10.2 of the ESCB Statute.
Other attendees
- Ms Senkovic, Secretary, Director General Secretariat
- Mr Kamps, Acting Secretary for monetary policy, Acting Director General Monetary Policy
- Mr Kapadia, Head of Division, Directorate General Monetary Policy
Accompanying persons
- Ms Bénassy-Quéré
- Ms Brezigar
- Mr Dewachter
- Mr Gilbert
- Mr Horváth
- Mr Kaasik
- Mr Kelly
- Mr Koukoularides
- Mr López
- Mr Lünnemann
- Ms Mauderer
- Mr Meichenitsch
- Mr Nicoletti Altimari
- Ms Raposo
- Mr Rutkaste
- Ms Schembri
- Mr Šiaudinis
- Mr Šošić
- Mr Tavlas
- Mr Välimäki
- Ms Varanauskienė, Alternate to Mr Šimkus
Other ECB staff
- Mr Proissl, Director General Communications
- Ms Vansteenkiste, Counsellor to the President
- Ms Rahmouni-Rousseau, Director General Market Operations
- Mr Arce, Director General Economics
- Ms Nickel, Deputy Director General Economics
Release of the next monetary policy account foreseen on 28 May 2026.
Chart Alert: AUD/USD 360 Pips Rally at Risk of a Minor Mean Reversion Decline Below 0.7200 Before New Upleg
Key takeaways
Strong rally driven by risk-on sentiment: AUD/USD surged ~360 pips from late-March lows, supported by US–Iran ceasefire optimism and its high-beta sensitivity to global risk assets, outperforming most major currencies.
Short-term pullback likely: The recent three-week bullish move appears overstretched, with technical signals pointing to a minor mean reversion decline after testing the 0.7188–0.7200 resistance zone.
Key levels to watch: A break below 0.7120 may trigger a pullback toward 0.7080–0.7033 (50-day MA) before a potential next up leg, while a sustained move above 0.7200 would extend gains toward 0.7240–0.7300.
The Australian dollar has benefited significantly since last Wednesday, 8 April, when the US and Iran agreed to a ceasefire due to its higher beta factor, as the AUD has mirrored the movement of risk assets such as equities since the start of the US-Iran war on 28 February 2026, exhibiting similar risk-off movements, ignoring the hawkish monetary policy guidance advocated by the RBA.
The AUD/USD has jumped by 230 pips (+3.3%) from the 8 April 2026 low to print an intraday high of 0.7198 on Thursday, 16 April 2026 at this time of writing, just a whisker above its prior 11 March 2026 high of 0.7188.
When measured from its current minor uptrend low of 0.6833 printed on 30 March 2026, it has rallied by almost 360 pips (+5.3%), making the Australian dollar the second-best-performing major currency against the US dollar based on a one-month rolling performance; USD/AUD (-2.47%), just behind the euro where the USD/EUR slid -3.04% (see Fig. 1).
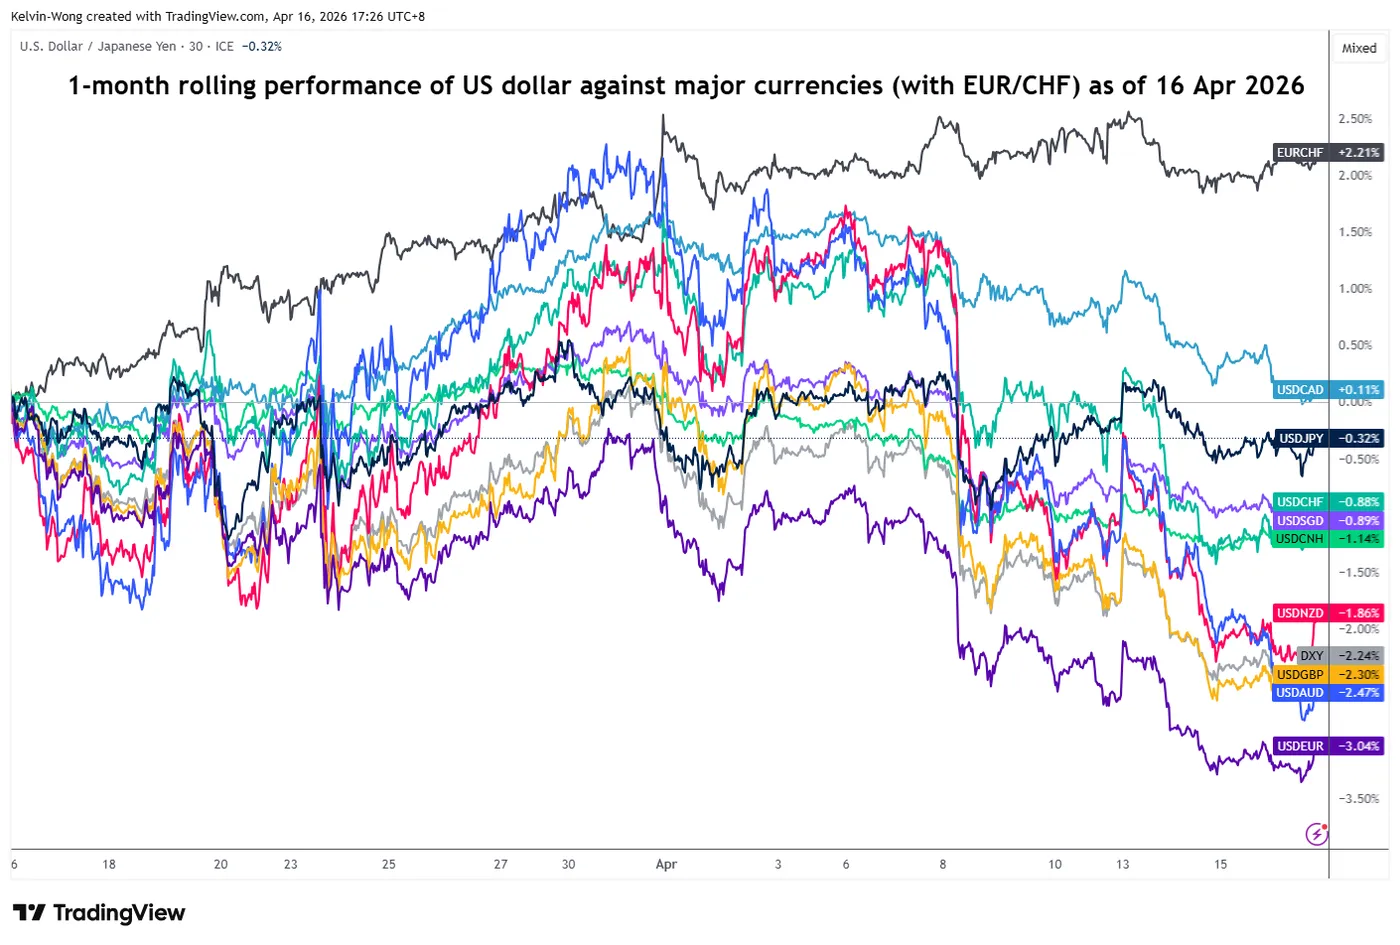
Fig. 1: 1-month rolling performances of the US dollar against major currencies as of 16 Apr 2026 (Source: TradingView).
However, price actions of highly liquid tradable instruments do move vertically but oscillate within trends.
Technically speaking, the three -week bullish impulsive up move on the AUD/USD from its 30 March 2026 low of 0.6833 is now due for a minor mean reversion corrective decline.
Let’s now focus on the technical factors to determine AUD/USD’s potential short-term trajectory (1 to 3 days).
AUD/USD – Potential minor corrective decline towards 50-day moving average
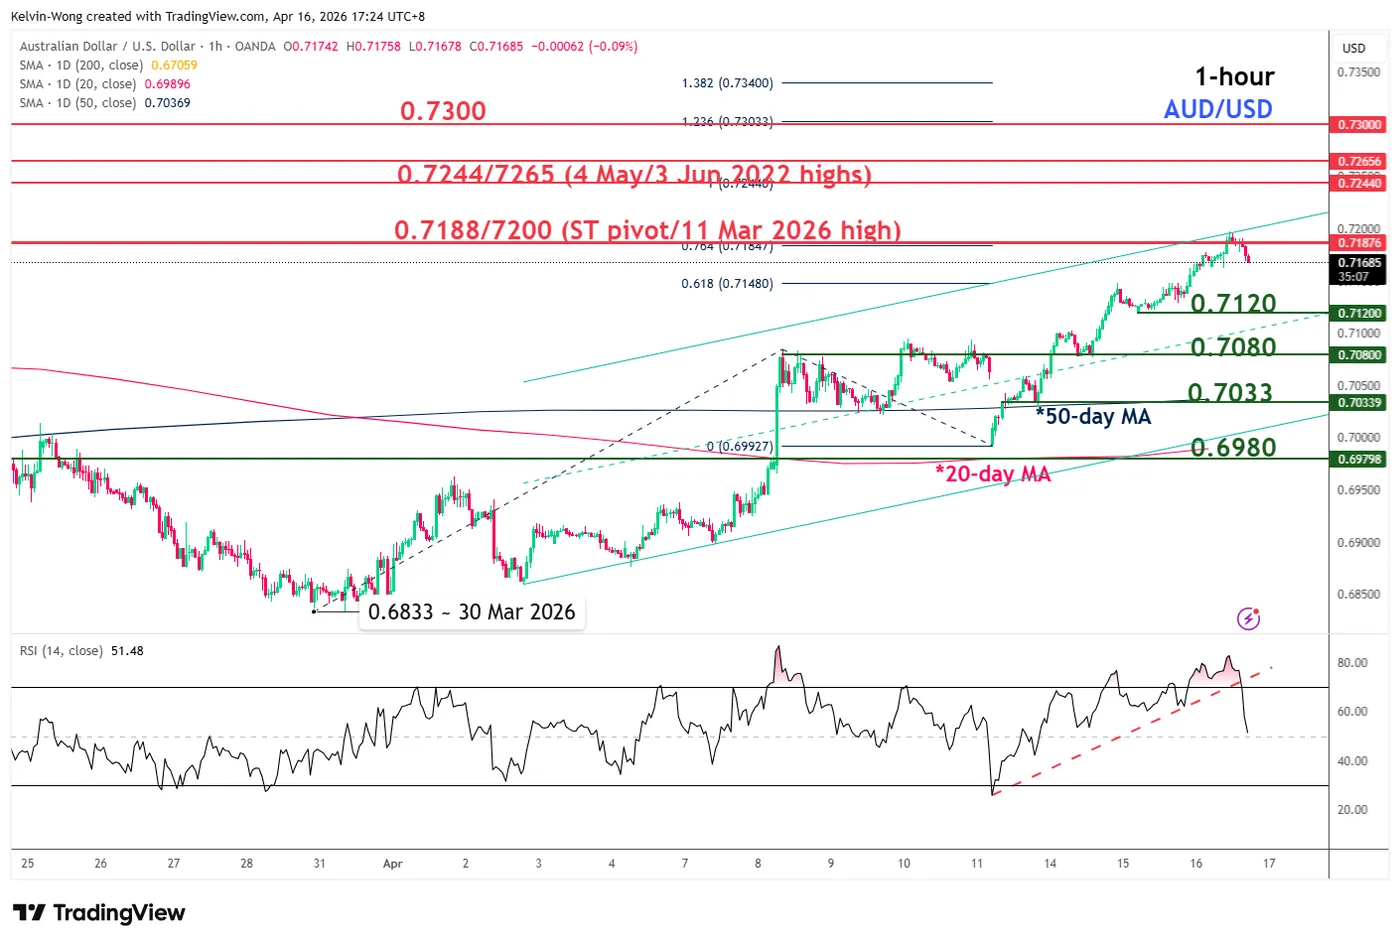
Fig. 2: AUD/USD minor trend as of 16 Apr 2026 (Source: TradingView).
Watch the 0.7188/0.7200 key short-term pivotal resistance on the AUD/USD. A break below 0.7120 increases the odds of a minor mean reversion decline towards the next intermediate supports of 0.7080 and 0.7033 (also the 50-day moving average) before the next bullish impulsive up move sequence materializes (see Fig. 2).
On the flip side, a clearance and an hourly close above 0.7200 invalidates the bearish bias for a continuation of the bullish move towards 0.7244/0.7265 and 0.7300 in the first step.
Key elements to support the near-term bearish bias on the AUD/USD
- The hourly RSI momentum indicator has exited from its overbought region and broken a key ascending support from 13 April 2026.
- Today’s current intraday high of 0.7198 has hit the upper boundary of the minor ascending channel in place since the 2 April 2026 low.
- In addition, the 0.7198 intraday high confluences closely with the 0.764 Fibonacci extension of a minor five-wave bullish impulsive up move sequence target of 0.7185, which suggests the potential end of the current minor up move sequence of the AUD/USD from the 30 March 2026 low of 0.6833, based on the Elliot Wave Theory.
Cable Eyes 1.3696 After Reclaiming Key Moving Averages, Bulls Defend 1.3500
- The daily chart confirms a major structural breakout, shifting the macro bias for GBP/USD from "sell the rallies" to "buy the dips".
- The primary structural target for the current rally is the major resistance zone at 1.3696
- "Cable" is consolidating near the 1.3600 handle, with intraday bulls defending the critical psychological pivot at 1.3500.
- The Bullish Scenario requires a sustained hourly close above 1.3584 to target 1.3650, while a break below 1.3500 would signal a deeper corrective phase.
GBP/USD has enjoyed a stellar run of late, capitalizing on a weakening US Dollar and a shift in global risk sentiment. However, as we move into the tail end of the week, "Cable" is finding the air a bit thin near the 1.3600 handle, setting the stage for a battle between trend followers and mean-reversion traders.
Daily Chart: Structural Breakout Confirmed
The daily timeframe provides the most compelling evidence of a medium-term trend shift. After months of being capped by a persistent descending trendline (dark navy), GBP/USD staged a clean breakout in early April.
Crucially, the pair has successfully reclaimed its 100-day MA (blue) at 1.3444 and its 200-day MA (black) at 1.3413. This "double reclaim" of the major moving averages suggests that the macro bias has shifted from "sell the rallies" to "buy the dips." Currently, the pair is eyeing the next major structural hurdle at 1.3696, which represents a significant historical resistance zone.
The Daily RSI is at 62.7, indicating healthy bullish momentum with plenty of runway before hitting the overbought 70.0 threshold.
GBP/USD Daily Chart, April 16, 2026
Source: TradingView
H4 Chart: Bulls Defend the 1.3500 Handle
Moving down to the H4 chart, the impulsive nature of the current rally is clear. The pair surged through the 1.3500 psychological level, which had previously acted as a formidable ceiling.
What is particularly encouraging for bulls is the "retest and depart" behavior seen around the 1.3500 mark. The H4 RSI (currently at 65.7) recently flagged a "BEAR" pivot, leading to a minor cooling-off period.
However, as long as the price remains comfortably above the 1.3378 structural support and the ascending moving averages, the intraday path of least resistance remains to the upside.
GBP/USD Four-Hour Chart, April 16, 2026
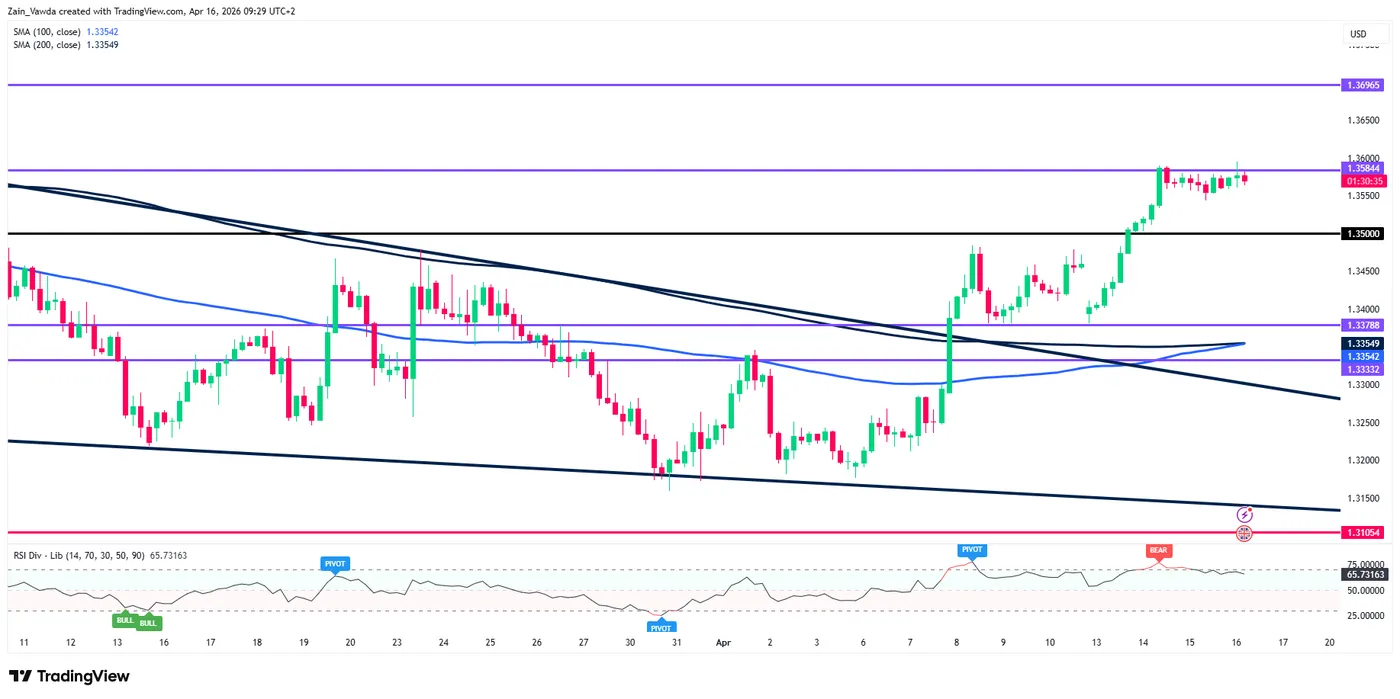
Source: TradingView
H1 Chart: Session Scenarios & Intraday Levels
The hourly chart shows Cable currently consolidating in a tight range between 1.3560 and 1.3585. The 100-MA (blue) on this timeframe is providing immediate dynamic support at 1.3509.
The Bullish Scenario
For the rally to extend in the upcoming session, we need to see a sustained hourly close above the 1.3584 resistance level (the purple line). A successful breach here would likely see a quick test of the 1.3600 psychological barrier, with the door then opening for a move toward 1.3650. Bulls should look for high-volume candles on the breakout to confirm the move isn't a "bull trap."
The Bearish Scenario
The bearish case rests on the potential for a "double top" or exhaustion near 1.3585. If the pair fails to clear this hurdle and slips below 1.3540, we could see a deeper retracement toward the 1.3500 pivot. This area aligns with the 100-period SMA on the H1, making it a critical "line in the sand" for intraday bulls. A break below 1.3500 would signal a broader corrective phase toward 1.3422.
Key Levels to Watch:
- Resistance: 1.3584, 1.3600, 1.3696
- Support: 1.3500, 1.3444 (Daily 100-MA), 1.3378
GBP/USD One-Hour Chart, April 16, 2026
Source: TradingView
GBP/USD is clearly the "pro-cyclical" choice at the moment, benefitting from the broader USD retreat. While short-term overextension is a risk, the daily structural breakout suggests that any near-term weakness should be viewed as an opportunity for bulls to reload.