Sample Category Title
USD/JPY Daily Outlook
Daily Pivots: (S1) 135.71; (P) 136.21; (R1) 136.74; More...
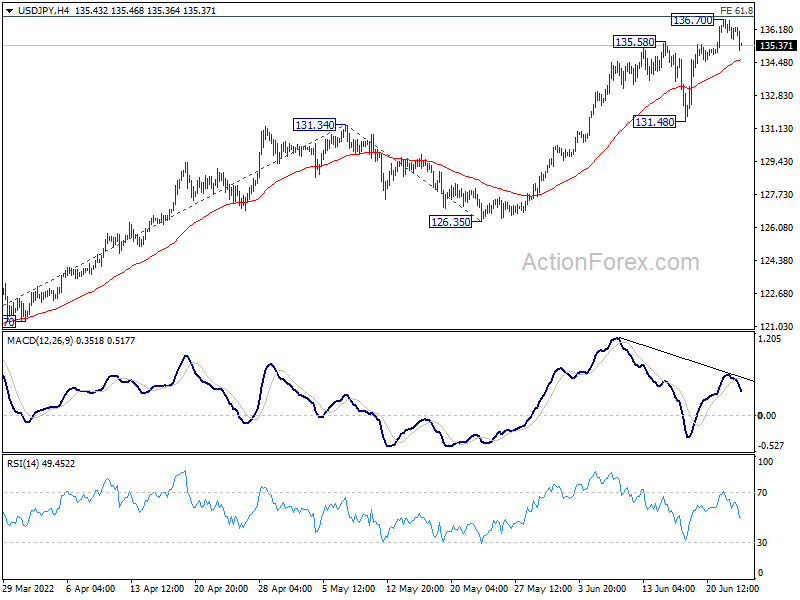
Intraday bias in USD/JPY is turned neutral with current retreat and some consolidations could be seen below 136.70 first. Downside should be contained above 131.48 support to bring rebound. On the upside, break of 61.8% projection of 114.40 to 131.34 from 126.35 at 136.81 will target 100% projection at 143.29.
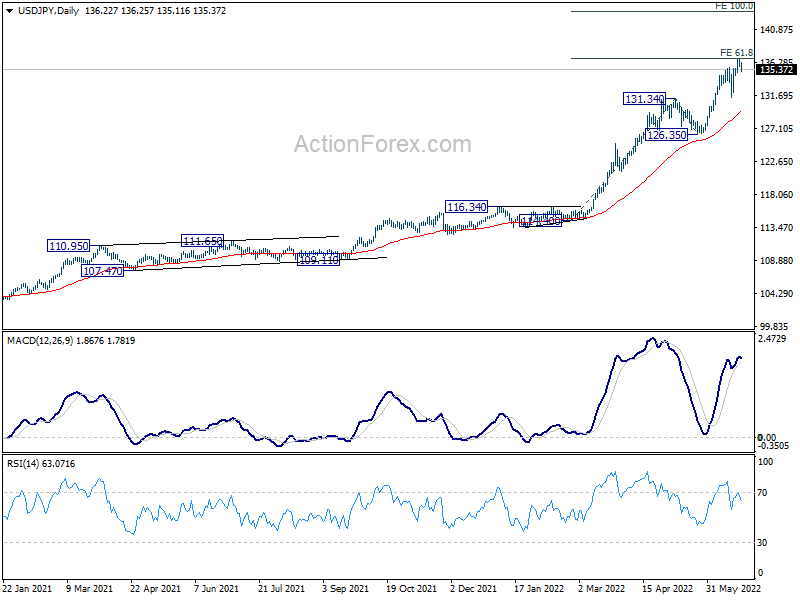
In the bigger picture, current rally is seen as part of the long term up trend from 75.56 (2011 low). Next target is 100% projection of 75.56 (2011 low) to 125.85 (2015 high) from 98.97 at 149.26, which is close to 147.68 (1998 high). This will remain the favored case as long as 126.35 support holds.
Yen Recovering, Aussie Follows Commodities Lower
While the stock markets are steady, Aussie, Kiwi, and to a lesser extend Loonie, are trading generally lower. Decline in commodity and energy prices, on concerns over recession, appear to be weighing down on these currencies. Copper prices dropped to the lowest level since March 2021, while iron ore price has fallen 15% in 2 weeks. Yen is currently the stronger one for today, followed by Euro and Swiss Franc. Dollar and Sterling are mixed.
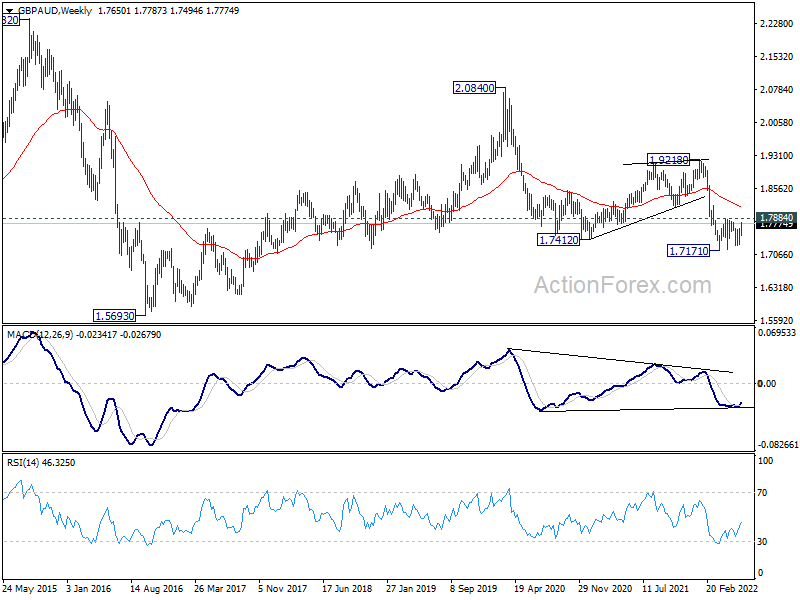
Technically, Aussie would be a focus for the rest of the week. Sustained break of 1.5354 support turned resistance will be a strong sign of medium term bullish reversal. At the same time, firm break of 1.7884 resistance in GBP/AUD would likely set the stage for further rebound to 55 week EMA (now at 1.8134) at least.
In Asia, at the time of writing, Nikkei is up 0.12%. Hong Kong HSI is up 0.96%. China Shanghai SSE is up 0.58%. Singapore Strait Times is up 0.62%. Japan 10-year JGB yield is down -0.0015 at 0.239. Overnight, DOW dropped -0.15%. S&P 500 dropped -0.13%. NASDAQ dropped -0.15%. 10-year yield dropped -0.151 to 3.156.
Fed Harker: I'd like to get above 3%
Philadelphia Fed President Patrick Harker said interest rates should go above 3% by the end of the year. Then Fed would assess how much more tightening is needed to bring inflation down.
"We don't have to overreact in terms of the fed funds rate," Harker said during a conference held by the regional Federal Reserve bank. "We need to get above neutral, again I'd like to get above three, but I don't think you have to accelerate rapidly beyond that at this point until we get a better understanding of what exactly the quantitative tightening is doing."
Fed Evans: Another 75bps hike in line with strong concerns on inflation
Chicago Fed President Charles Evans said another 75bps rate hike is a "very reasonable place" to have a discussion at next FOMC meeting. He said, "I think 75 would be in line with continued strong concerns that the inflation data isn't coming down as quickly as we thought."
"The first thing that we're looking at is to make sure we take the steam out of the inflation pressures," he added.
"We're obviously taking on risk when we want to slow demand, to keep it in line with supply," Evans said. "To think that we can fine tune something like this with tremendous precision -- I mean, we just don't have that ability."
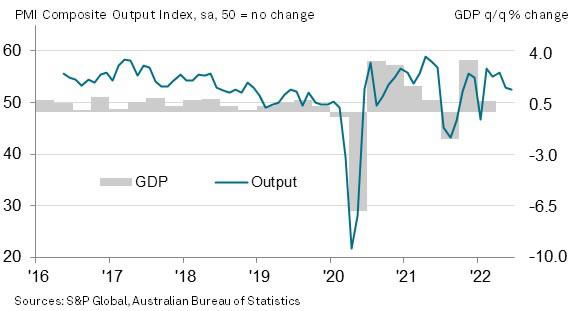
Australia PMI composite dropped to 52.6, downside risks have increased
Australia PMI Manufacturing ticked up from 55.7 to 55.8 in June. PMI Services, on the other hand, dropped from 53.2 to 52.6. PMI Composite dropped from 52.9 to 52.6, a 5-month low.
Laura Denman, Economist at S&P Global Market Intelligence said:
"Expansion across Australia's private sector economy continued in June, according to the S&P Global Flash Australia Composite PMI. The easing of COVID-19 policies and opening of international borders has encouraged growth in demand, especially overseas. Stronger demand conditions have had a positive influence on other areas of the economy, with employment levels continuing to rise at a solid rate.
"That said, firms have taken advantage of rising demand levels and passed through higher costs to their selling prices at a substantial pace. With interest rates rising to contain rapid price pressures, as well as a fading boost to economic activity post-lockdown, downside risks to the Australian economy have increased."
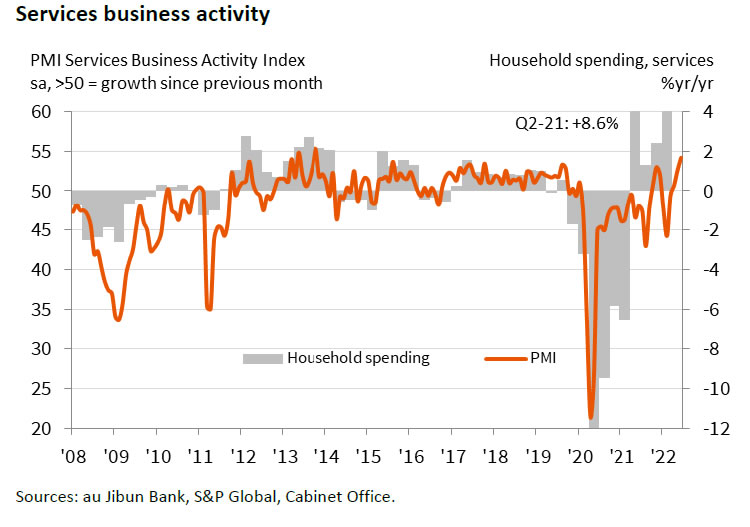
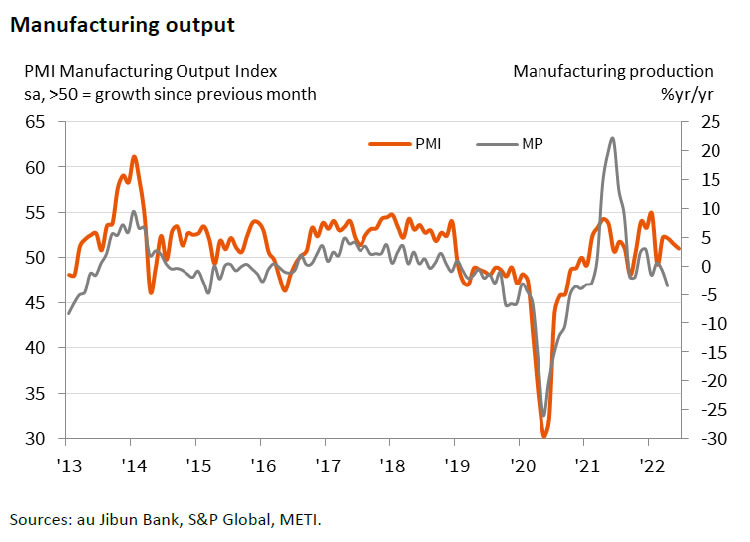
Japan PMI manufacturing dropped to 52.7, but services jumped to 54.2
Japan PMI Manufacturing dropped slightly from 53.3 to 52.7 in June, below expectation of 54.4. PMI Services rose from 52.6 to 54.2, highest since October 2013. PMI Composite Output rose form 52.3 to 53.2.
Usamah Bhatti, Economist at S&P Global Market Intelligence, said:
"Activity at Japanese private sector businesses rose solidly at the midway point of 2022 as border restrictions related to the COVID-19 pandemic were eased. The rise was the fourth in as many months and the sharpest recorded since last November amid the strongest expansion in the services sector since October 2013, with firms relating the increase to the return of international visitors. Concurrently, manufacturers signalled the softest upturn in the current four-month growth sequence as COVID-19 restrictions in mainland China contributed to further supply chain disruption and exacerbated existing supply and demand pressures.
"Private sector firms also noted a further robust increase in prices in June. While the rate of input price inflation remained broadly similar to May's series record, the slight easing in inflation was the first for five months and provided tentative evidence that the rise in input prices had peaked. That said, prices charged for Japanese goods and services rose at an unprecedented rate for the second successive month as higher material and staff cost burdens were partially passed through to customers."
Looking ahead
Eurozone PMIs and UK PMIs will be released in European session. ECB will publish monthly economic bulletin. Later in the day, US will release jobless claims, current account and PMIs.
USD/JPY Daily Outlook
Daily Pivots: (S1) 135.71; (P) 136.21; (R1) 136.74; More...
Intraday bias in USD/JPY is turned neutral with current retreat and some consolidations could be seen below 136.70 first. Downside should be contained above 131.48 support to bring rebound. On the upside, break of 61.8% projection of 114.40 to 131.34 from 126.35 at 136.81 will target 100% projection at 143.29.
In the bigger picture, current rally is seen as part of the long term up trend from 75.56 (2011 low). Next target is 100% projection of 75.56 (2011 low) to 125.85 (2015 high) from 98.97 at 149.26, which is close to 147.68 (1998 high). This will remain the favored case as long as 126.35 support holds.
Economic Indicators Update
| GMT | Ccy | Events | Actual | Forecast | Previous | Revised |
|---|---|---|---|---|---|---|
| 23:00 | AUD | Manufacturing PMI Jun P | 55.8 | 55.7 | ||
| 22:00 | AUD | Services PMI Jun P | 52.6 | 53.2 | ||
| 00:30 | JPY | Manufacturing PMI Jun P | 52.7 | 54.4 | 53.3 | |
| 06:00 | GBP | Public Sector Net Borrowing (GBP) May | 17.8B | |||
| 07:15 | EUR | France Manufacturing PMI Jun P | 53.8 | 54.6 | ||
| 07:15 | EUR | France Services PMI Jun P | 57.5 | 58.3 | ||
| 07:30 | EUR | Germany Manufacturing PMI Jun P | 54 | 54.8 | ||
| 07:30 | EUR | Germany Services PMI Jun P | 54.5 | 55 | ||
| 08:00 | EUR | Eurozone Manufacturing PMI Jun P | 53.9 | 54.6 | ||
| 08:00 | EUR | Eurozone Services PMI Jun P | 55.5 | 56.1 | ||
| 08:00 | EUR | ECB Economic Bulletin | ||||
| 08:30 | GBP | Manufacturing PMI Jun P | 53.8 | 54.6 | ||
| 08:30 | GBP | Services PMI Jun P | 53 | 53.4 | ||
| 12:30 | USD | Current Account (USD) Q1 | -275B | -218B | ||
| 12:30 | USD | Initial Jobless Claims (Jun 17) | 229K | 229K | ||
| 13:45 | USD | Manufacturing PMI Jun P | 56.4 | 57 | ||
| 13:45 | USD | Services PMI Jun P | 53.5 | 53.4 | ||
| 14:30 | USD | Natural Gas Storage | 63B | 92B |
Japan PMI manufacturing dropped to 52.7, but services jumped to 54.2
Japan PMI Manufacturing dropped slightly from 53.3 to 52.7 in June, below expectation of 54.4. PMI Services rose from 52.6 to 54.2, highest since October 2013. PMI Composite Output rose form 52.3 to 53.2.
Usamah Bhatti, Economist at S&P Global Market Intelligence, said:
"Activity at Japanese private sector businesses rose solidly at the midway point of 2022 as border restrictions related to the COVID-19 pandemic were eased. The rise was the fourth in as many months and the sharpest recorded since last November amid the strongest expansion in the services sector since October 2013, with firms relating the increase to the return of international visitors. Concurrently, manufacturers signalled the softest upturn in the current four-month growth sequence as COVID-19 restrictions in mainland China contributed to further supply chain disruption and exacerbated existing supply and demand pressures.
"Private sector firms also noted a further robust increase in prices in June. While the rate of input price inflation remained broadly similar to May's series record, the slight easing in inflation was the first for five months and provided tentative evidence that the rise in input prices had peaked. That said, prices charged for Japanese goods and services rose at an unprecedented rate for the second successive month as higher material and staff cost burdens were partially passed through to customers."
Australia PMI composite dropped to 52.6, downside risks have increased
Australia PMI Manufacturing ticked up from 55.7 to 55.8 in June. PMI Services, on the other hand, dropped from 53.2 to 52.6. PMI Composite dropped from 52.9 to 52.6, a 5-month low.
Laura Denman, Economist at S&P Global Market Intelligence said:
"Expansion across Australia's private sector economy continued in June, according to the S&P Global Flash Australia Composite PMI. The easing of COVID-19 policies and opening of international borders has encouraged growth in demand, especially overseas. Stronger demand conditions have had a positive influence on other areas of the economy, with employment levels continuing to rise at a solid rate.
"That said, firms have taken advantage of rising demand levels and passed through higher costs to their selling prices at a substantial pace. With interest rates rising to contain rapid price pressures, as well as a fading boost to economic activity post-lockdown, downside risks to the Australian economy have increased."
Fed Evans: Another 75bps hike in line with strong concerns on inflation
Chicago Fed President Charles Evans said another 75bps rate hike is a "very reasonable place" to have a discussion at next FOMC meeting. He said, "I think 75 would be in line with continued strong concerns that the inflation data isn't coming down as quickly as we thought."
"The first thing that we're looking at is to make sure we take the steam out of the inflation pressures," he added.
"We're obviously taking on risk when we want to slow demand, to keep it in line with supply," Evans said. "To think that we can fine tune something like this with tremendous precision -- I mean, we just don't have that ability."
Fed Harker: I’d like to get above 3%
Philadelphia Fed President Patrick Harker said interest rates should go above 3% by the end of the year. Then Fed would assess how much more tightening is needed to bring inflation down.
"We don't have to overreact in terms of the fed funds rate," Harker said during a conference held by the regional Federal Reserve bank. "We need to get above neutral, again I'd like to get above three, but I don't think you have to accelerate rapidly beyond that at this point until we get a better understanding of what exactly the quantitative tightening is doing."
Technical Outlook and Review
DXY:
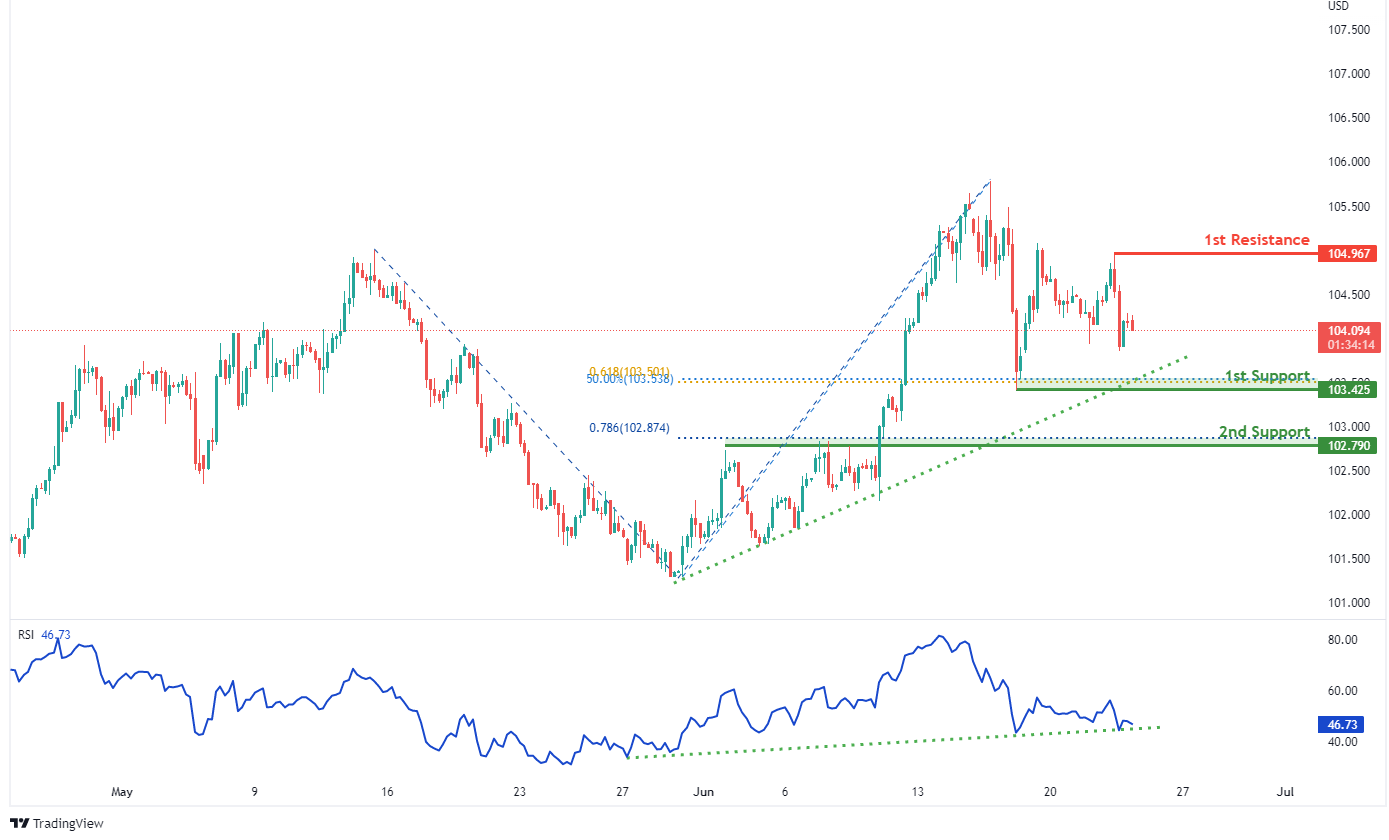
On the H4, with RSI moving along an ascending trendline and prices moving along the ascending trendline, we have a bullish bias that bullish momentum will carry prices from our 1st support at 103.425 where the 61.8% fibonacci projection, 50% fibonacci retracement and swing low support are to our 1st resistance at 104.967 in line with the horizontal swing high resistance. Alternatively, price may break 1st support structure and head for 2nd support at 102.790 where the horizontal overlap support and 78.6% fibonacci projection.
Areas of consideration:
- H4 time frame, 1st resistance at 104.967
- H4 time frame, 1st support at 103.425
XAU/USD (GOLD):
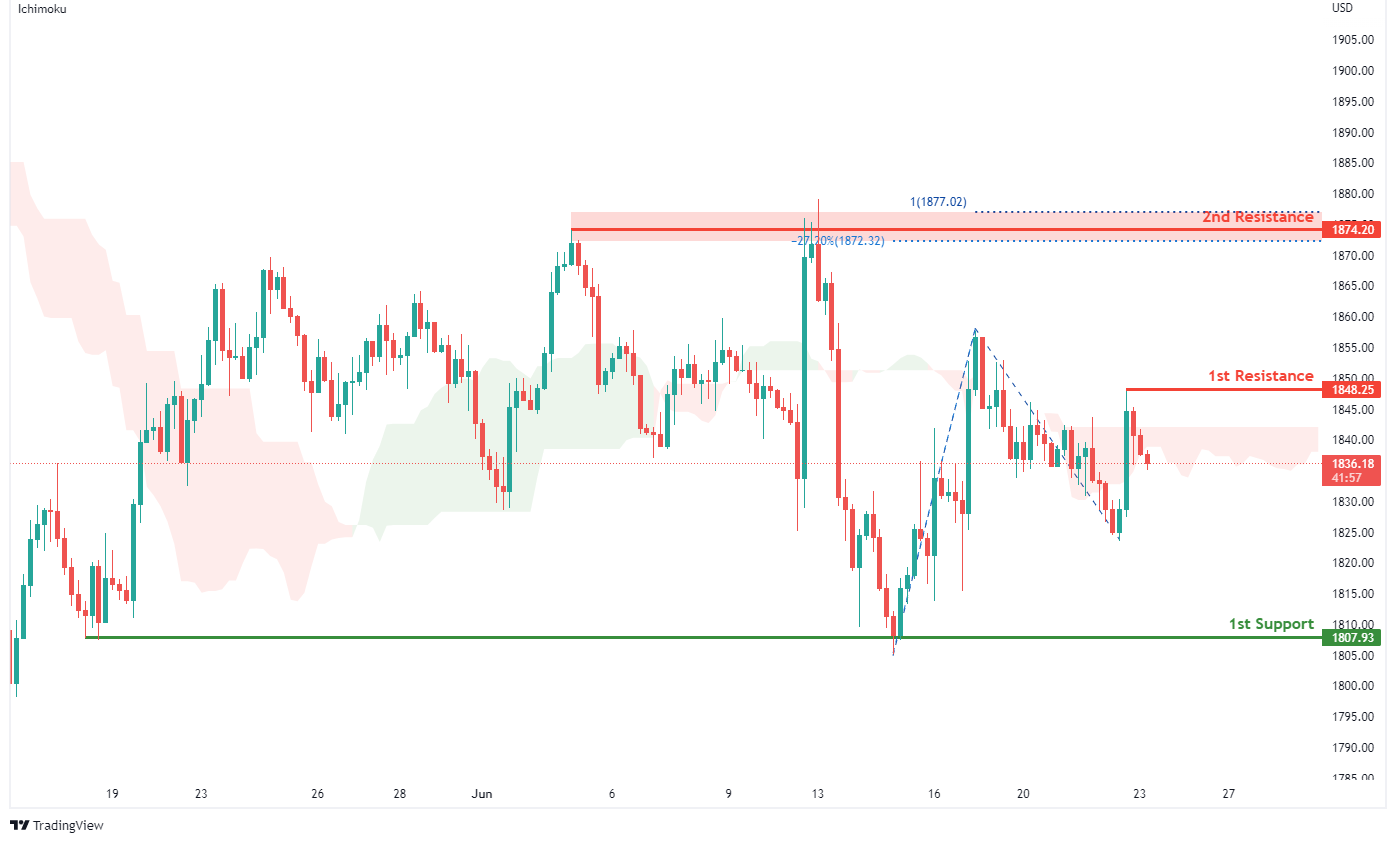
On the H4, with prices moving below the ichimoku indicator, we have a bearish bias that prices will drop from our 1st resistance at 1848.25 where the horizontal swing high resistance is to our 1st support at 1807.93 in line with swing low support. Alternatively, price may break 1st resistance structure and head for 2nd resistance at 1874.20 in line with swing high resistance, -27.2% fibonacci expansion and 100% fibonacci projection.
Areas of consideration:
- H4 time frame, 1st Resistance at 1848.25
- H4 time frame, 1st Support at 1807.93
GBP/USD:
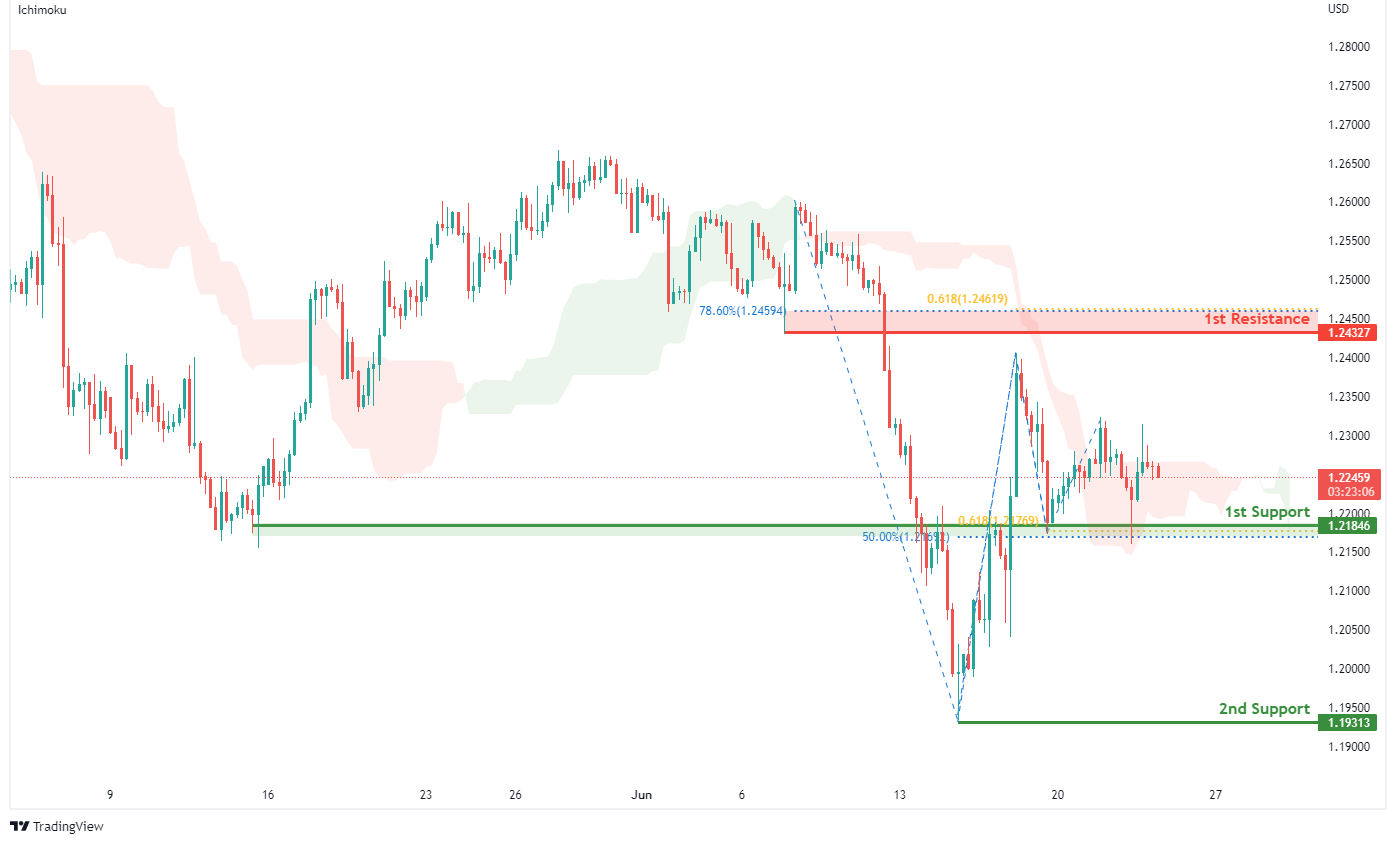
On the H4, with prices expected to bounce off the ichimoku support, we have a bullish bias that price will rise from our 1st support at 1.21846 where the horizontal overlap support,50% fibonacci retracement and 61.8% fibonacci projection to our 1st resistance at 1.24327 in line with the 61.8% fibonacci projection, 78.6% fibonacci retracement and pullback resistance. Alternatively, price may break 1st support structure and head for 2nd support at 1.19313 where the horizontal swing low support is.
Areas of consideration:
- H4 1st resistance at 1.24327
- H4 1st support at 1.21846
USD/CHF:
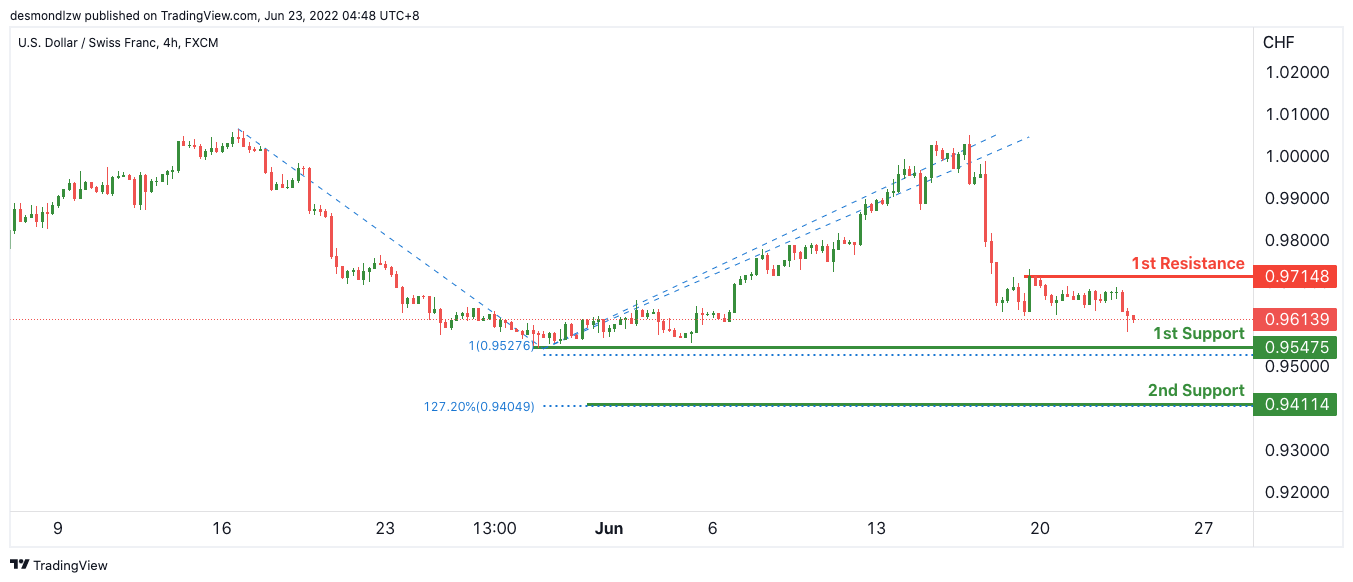
On the H4, with price expected to bounce off the stochastics indicator, we have a bullish bias that price will rise from our 1st support at 0.95475 where the horizontal pullback support and 78.6% Fibonacci retracement is to our 1st resistance at 0.987548 in line with the horizontal pullback resistance and 61.8% Fibonacci retracement. Alternatively, price may break structure and head for 2nd support where the 127.2% Fibonacci extension is.
Areas of consideration
- 1st support level at 0.95475
- 1st resistance level at 0.987548
EUR/USD :
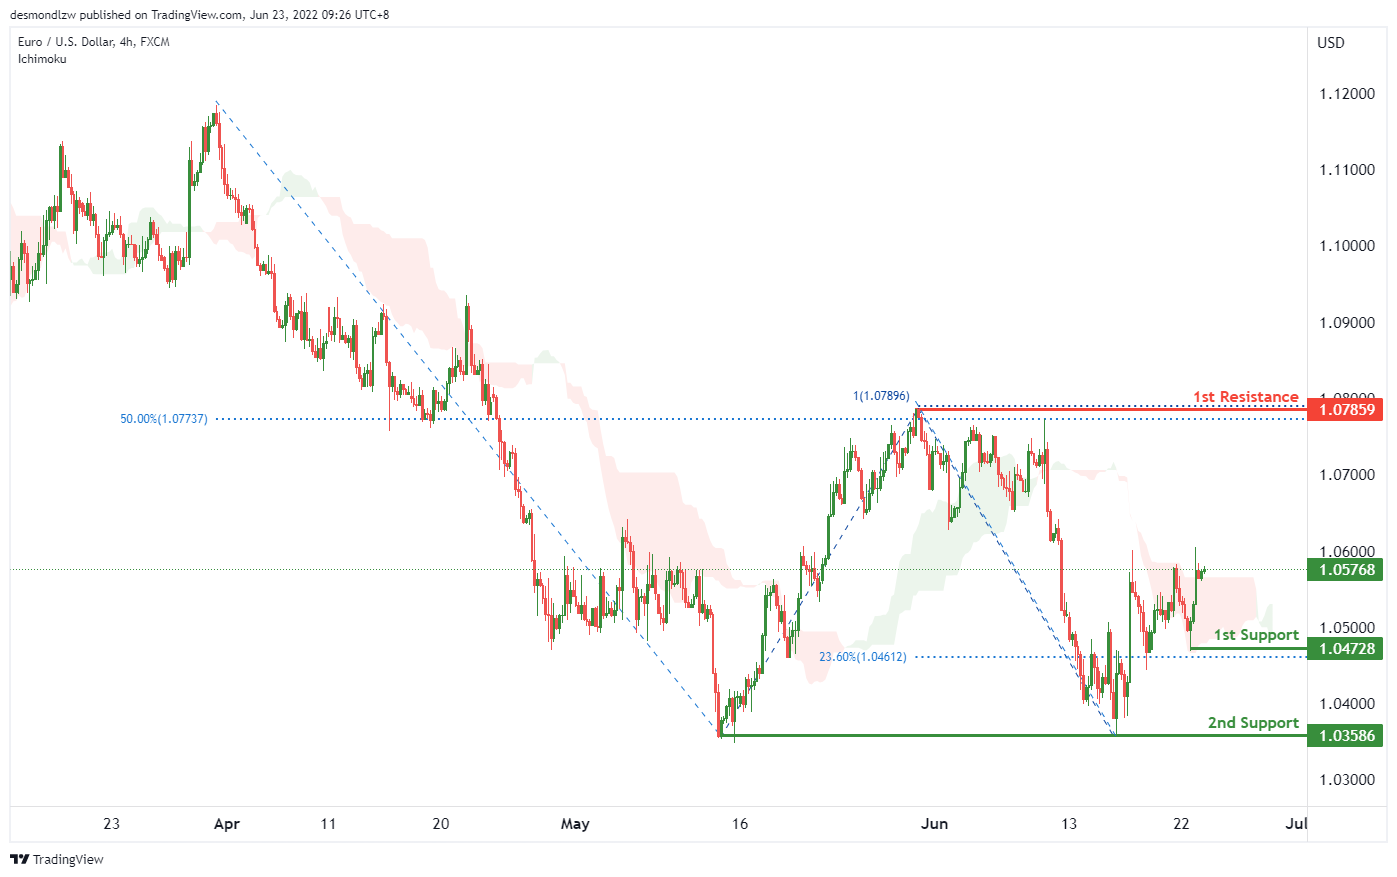
On the H4, with price moving above the ichimoku cloud, we have a bullish bias that price will continue to rise from the 1st support at 1.04728 in line with the 23.6% fibonacci retracement and swing low to the 1st resistance at 1.07859 at the swing high in line with the 100% fibonaci projection and 50% fibonacci retracement. Alternatively, price may drop from the 1st support to the 2nd support at 1.03586 at the horizontal swing lows.
Areas of consideration :
- H4 1st resistance at 1.07859
- H4 1st support at 1.04728
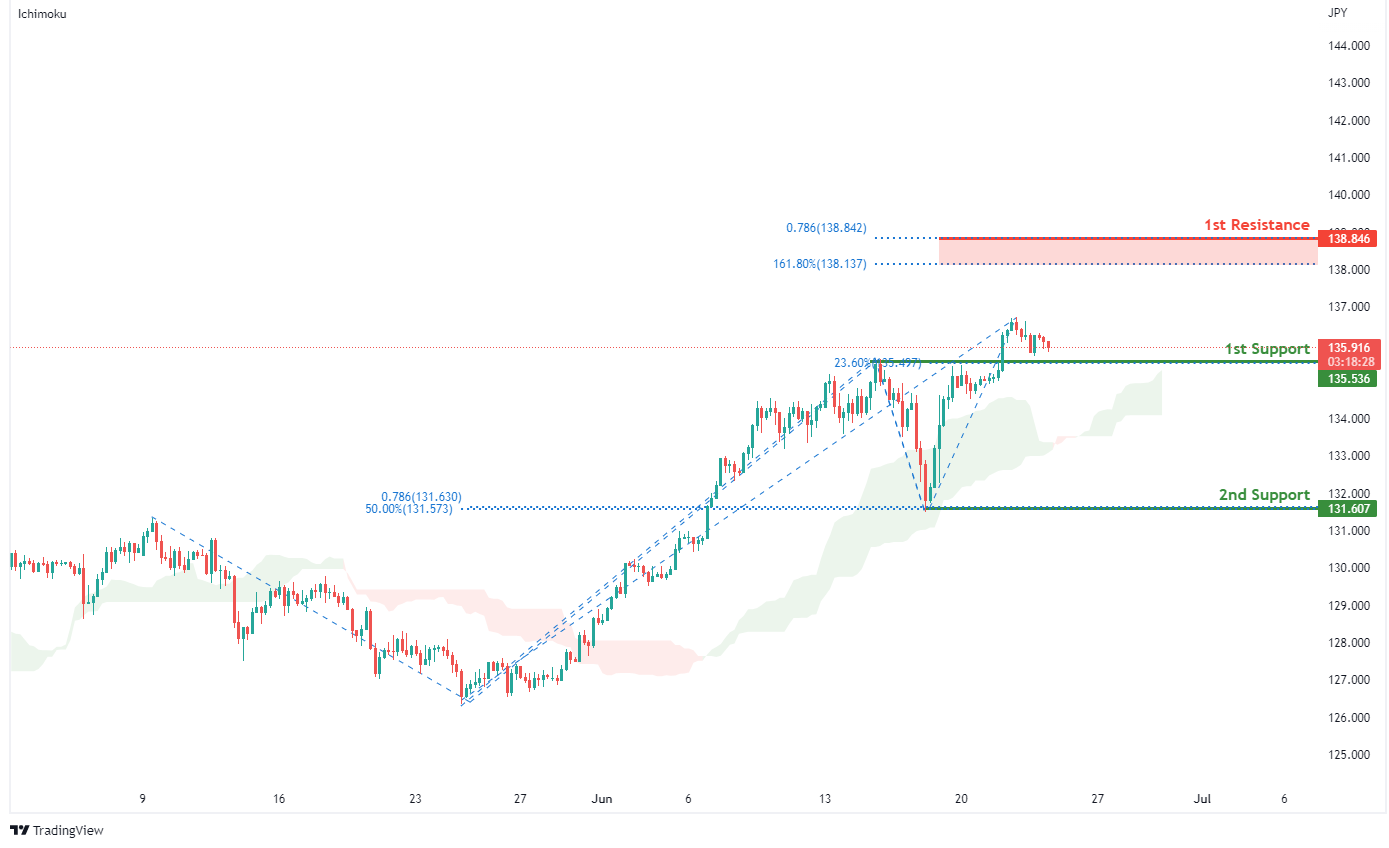
USD/JPY:
On the H4, with price moving above the ichimoku indicator, we have a bullish bias that price will rise from our 1st support at 135.536 in line with the pullback support and 23.6% fibonacci retracement to our 1st resistance at 138.846 where the 161.8% fibonacci extension and 78.6% fibonacci projection are . Alternatively, price may break 1st support structure and head for 2nd support at 131.607 in line with the swing low support,78.6% fibonacci projection and 50% fibonacci retracement.
Areas of consideration:
- H4 time frame, 1st resistance at 138.846
- H4 time frame, 1st support at 135.536
AUD/USD:
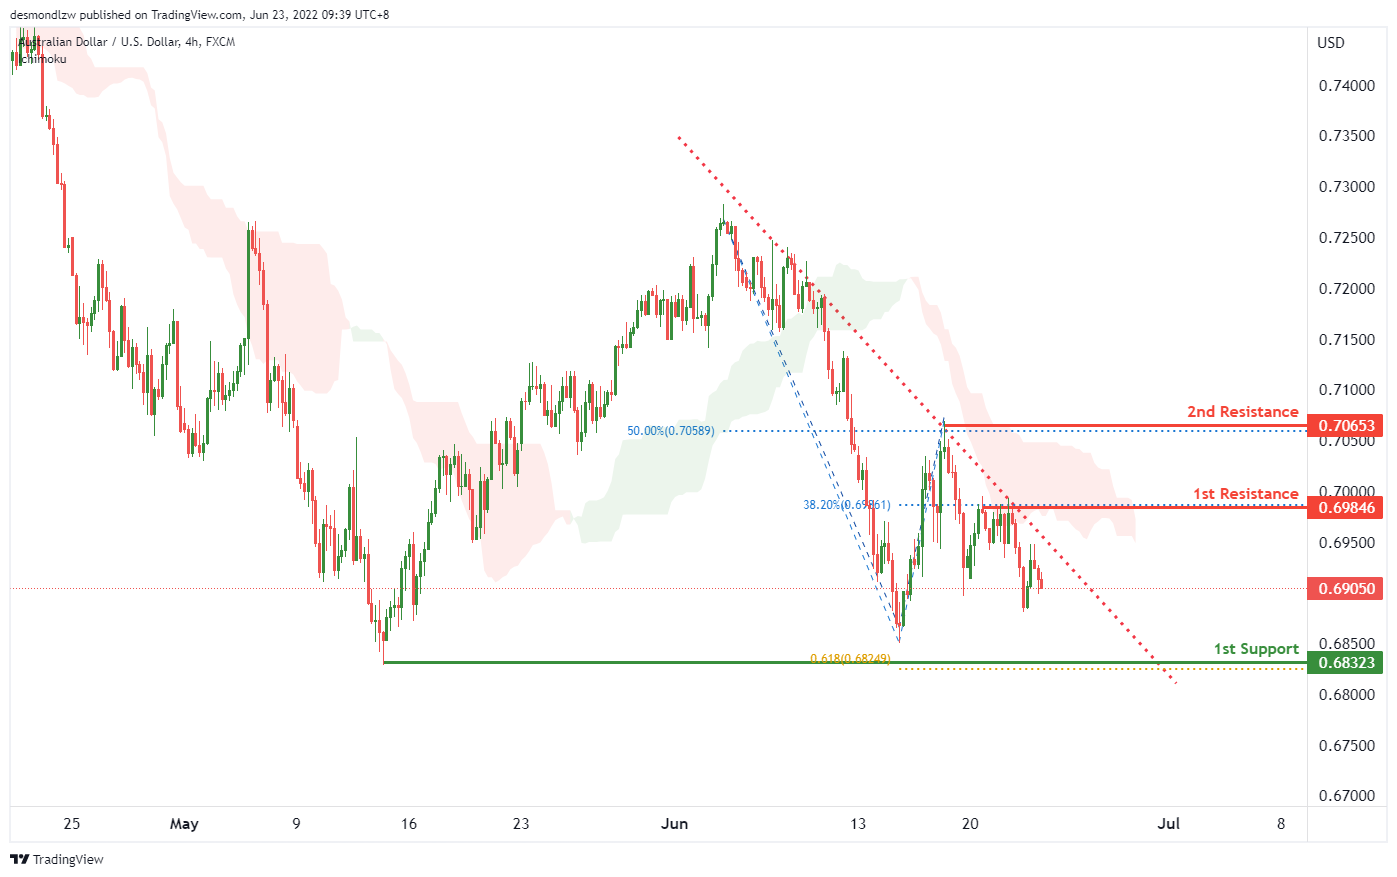
On the H4, with price moving below the ichimoku cloud and in a descending trendline, we have a bearish bias that price will continue to drop from the 1st pullback resistance at 0.69846 in line with the 38.2% fibonacci retracement to the 1st support at 0.68323 in line with the horizontal swing low and 61.8% fibonacci projection. Alternatively, price may reverse off the 1st resistance and rise to the 2nd resistance at 0.70653 in line with the 50% fibonacci retracement and swing high.
Areas of consideration
- H4 1st resistance at 0.69846
- H4 1st support at 0.68323
NZD/USD:
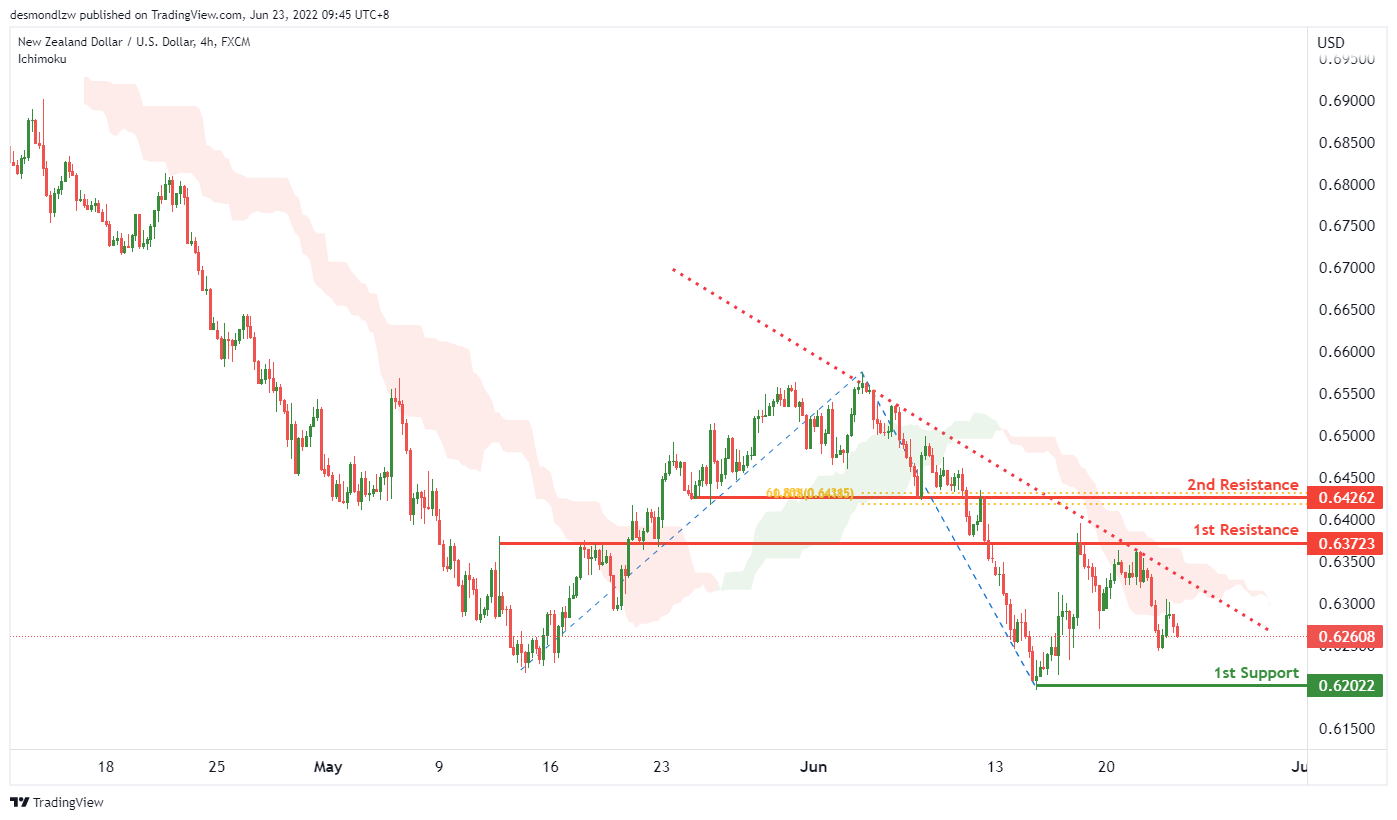
On the H4, with price moving within the ichimoku cloud and in a descending trendline, we have a bearish bias that price will drop from the 1st resistance at 0.63723 at the pullback resistance to the 1st support at 0.62022 at the horizontal swing low. Alternatively, price may reverse off the 1st resistance and rise to the 2nd resistance at 0.64262 in line with the 61.8% Fibonacci projection and 61.8% Fibonacci retracement.
Areas of consideration:
- H4 time frame, 1st support at 0.62022
- H4 time frame, 1st resistance at 0.63723
USD/CAD:
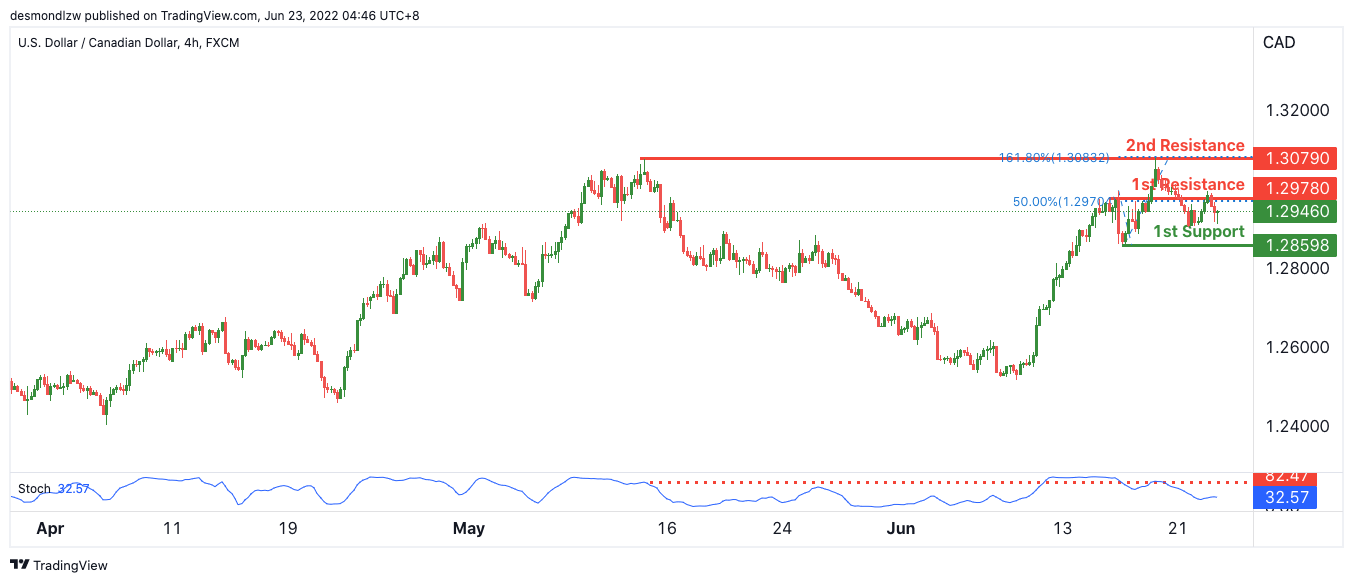
On the H4, with price expected to reverse off the stochastics indicator, we have a bearish bias that price will rise from our 1st resistance where the 50% Fibonacci retracement is to our 1st support at 1.28598 in line with the horizontal pullback support and 50% Fibonacci retracement. Alternatively, price may head for 2nd resistance where the horizontal swing high resistance and 161.8% Fibonacci projection is.
Areas of consideration:
- H4 time frame, 1st resistance at 1.29780
- H4 time frame, 1st support at 1.28598
OIL:
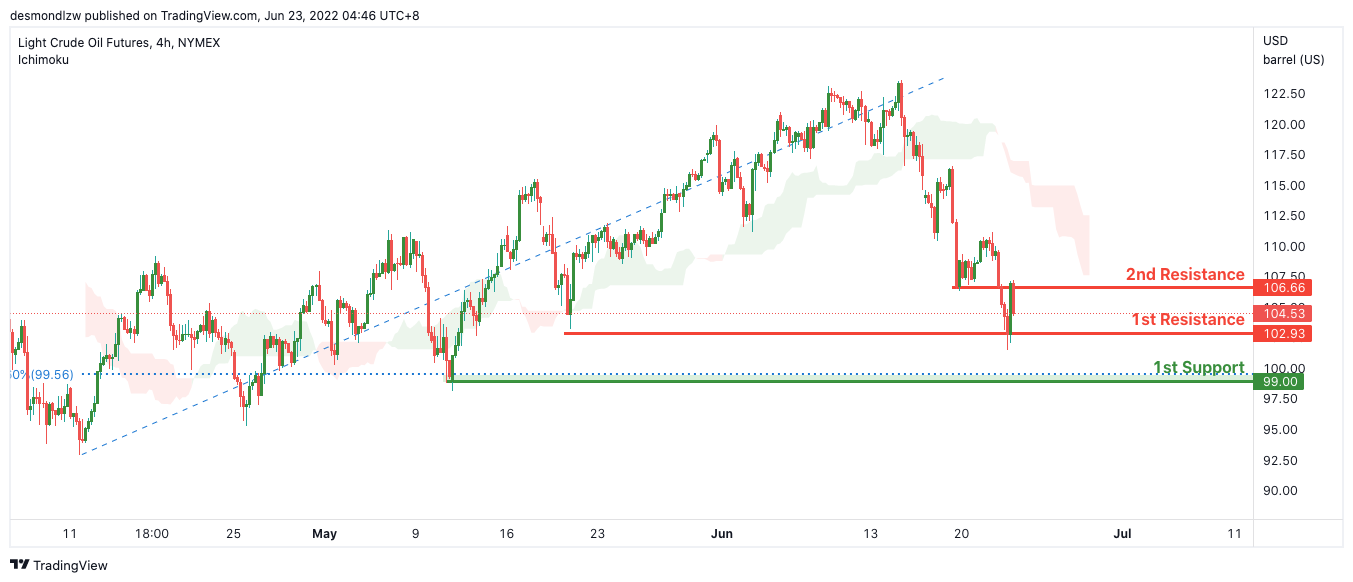
On the H4, with price moving below the ichimoku cloud, we have a bearish bias that price will rise from our 1st resistance where the horizontal pullback resistance is to our 1st support in line with the horizontal swing low support. Alternatively, price may head for 2nd resistance where the horizontal pullback resistance is. Take note that we are waiting for the break of 1st resistance to confirm the bearish continuation.
Areas of consideration:
- H4 time frame, 1st resistance of 102.93
- H4 time frame, 1st support of 99.00
Dow Jones Industrial Average:
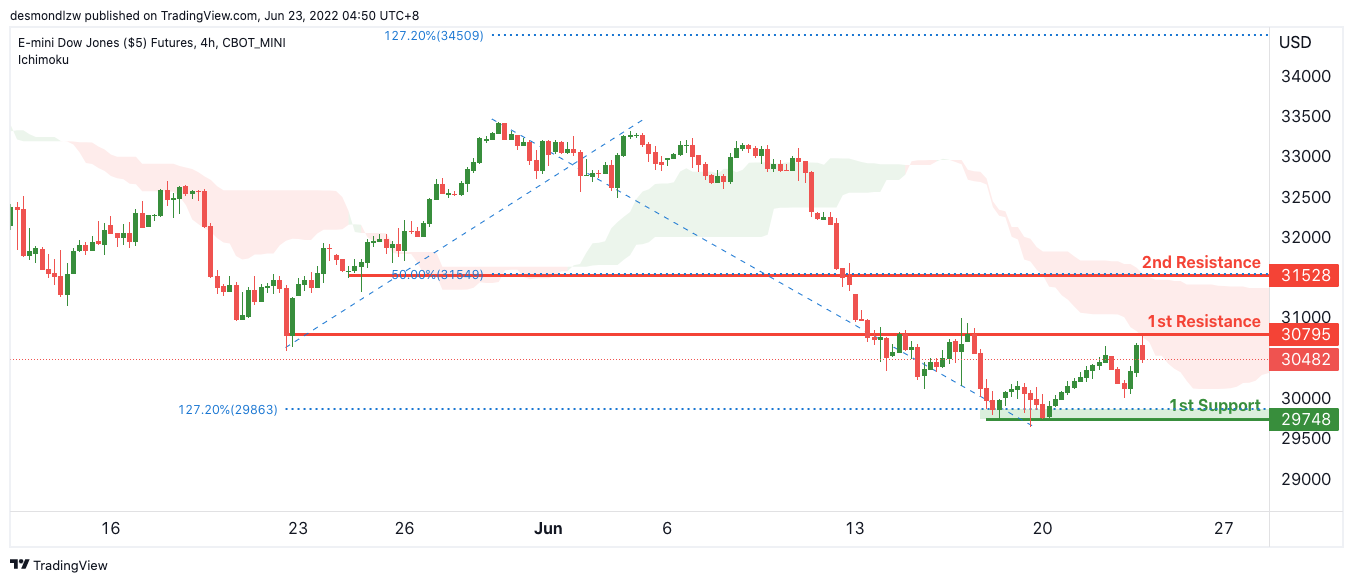
On the H4, with price moving below the ichimoku cloud, we have a bearish bias that price will rise from our 1st resistance at 30795 where the horizontal pullback resistance is to our 1st support at 29748 in line with the horizontal swing low support. Alternatively, price may head for 2nd resistance where the horizontal pullback resistance and 50% Fibonacci retracement is.
Areas of consideration :
- H4 time frame, 1st resistance at 30795
- H4 time frame, 1st support at 29748
RBA to Hike Rates by 50 Basis Points in Both July and August – Terminal Rate to Reach 2.6%
Last week we lifted our forecast for the terminal US federal funds rate in December from 2.675% to 3.375%.
We now expect this more aggressive approach to see the US economy stalling, with the risk of a mild recession in the second half of 2023.We expect a need for a series of rate cuts from December 2023 eventually taking the federal funds rate back to 2.125% through 2024.
That cycle for the remainder of 2022 will entail increases of 75bps in July; 50bps in September; 25bps in November and 25bps in December.
This shift toward higher global rates has also led us to lift our terminal rate for the RBA's tightening cycle, from 2.35% to 2.6%. Note that this is still significantly short of the market's forecast terminal rate of around 4.5% and only a 25bp upward revision compared to the 75bp lift in the federal funds profile.
The 2.6% is broadly in line with the '2.5% guideline' the RBA Governor has given in speeches and other commentary (from his ABC interview on June 14: "I think it's reasonable that the cash rate gets to 2½ per cent at some point").
The sensitivity of the Australian economy to the RBA cash rate is markedly higher than the sensitivity of the US economy to the federal funds rate. Around 60% of Australian mortgages are on floating rate terms with a further 75% of the remaining fixed rate loans set to mature by the end of 2023.
Effectively 90% of mortgage borrowers are directly exposed to moves in the RBA cash rate over the next year and a half. The rate affects borrowers and homeowners through multiple channels, including: the cash flow of existing borrowers; the capacity of prospective borrowers to obtain and service new loans; the wealth effect from associated adjustments in house prices; and via confidence effects.
In the US, the current surge in the mortgage rate only affects new borrowers directly as existing borrowers typically have fixed rate mortgages up to 30 years.
The more direct impact of the federal funds rate on financial assets in the US is through the equity market and confidence. This 25bp upward revision in the forecast terminal rate is likely to manifest as a 50bp increase in the cash rate at the August Board meeting – revised up from our previous forecast of 25bps.
That would push the cash rate from our forecast 1.35% (following the expected 50bp lift at the upcoming July meeting) to 1.85% after the August meeting – firmly in our estimated 'neutral zone' for policy in Australia of 1.5-2.0%.
The August Board meeting will respond to what is expected to be a very unsettling June quarter inflation report set to be released on July 27.
We expect headline inflation to lift 1.5% in the quarter taking annual inflation from 5.1%yr to 5.8%yr. Underlying inflation, as represented by the trimmed mean, is expected to print 1.2% in the quarter for a lift in annual inflation from 3.7%yr to 4.5%yr.
We see the risks to these numbers to the upside.
After responding firmly to the further significant uplift in inflation – moving the cash rate into the 'neutral zone' and signalling a clear commitment to containing inflation and inflationary expectations – we expect the RBA to pause.
Consistent with our previous view, we expect the pause for two months to assess the impact of the rapid cumulative 175bp increase over four months.
As the Governor noted in this week's speech to the American Chamber of Commerce, the key high frequency data he will be watching will be around consumer spending, particularly consumer durables and the housing market – not just house prices (as a pointer to wealth effects) but also with respect to dwelling construction and other housing-related expenditure.
It is noteworthy that a swift move to 1.85% will still only restore the cash rate to slightly above the 1.5% that held for nearly three years between August 2016 and May 2019, when inflation persistently undershot the Bank's 2-3% target zone.
Moving swiftly to reverse what is clearly an over-stimulatory policy setting and then pausing before moving into the 'contractionary zone' is the best approach, and one that is most likely to avoid the damaging overshoot we are forecasting for the FOMC.
Such a strategy would also assist in the central objective of the tightening cycle: to signal clearly to economic agents – households and trade unions in particular – that the Bank is committed to returning inflation to target over the medium term, thereby containing any lift in inflation expectations.
In his speech, the Governor made a major point around the key objective of containing inflationary expectations.
Our central case remains that, following the release of the September quarter inflation report on October 26, a further tightening will be seen as necessary at the November Board meeting.
In that report we expect annual headline inflation to be steady at 5.7%yr (due in part to state government subsidies temporarily forestalling the effect of a big rise in electricity costs), but underlying inflation to have lifted from 4.5%yr to 4.8%yr.
The next move would put policy into the contractionary zone. As such, it would be prudent to revert to proceeding in 25bp increments given the added uncertainty around the impact of each move.
We continue to expect a further move in December and a final 25bp lift at the February Board meeting in response to the December quarter inflation report.
The December quarter is expected to see the peak in both headline and underlying inflation. (6.6% and 4.8% respectively). Having responded to that move it would be prudent to go on hold to assess the economy's response to a cumulative increase in the cash rate over nine meetings of 250bp.
Such a move would be the second fastest tightening cycle since 1990, exceeded only by the 275bp increase over five meetings in the second half of 1994.
Our forecast is that, along with the clear slowing in the economy over the December and March quarters in particular, the March quarter inflation report will provide evidence that the slowing in demand and the freeing up of supply has brought demand and supply into closer alignment easing inflation pressures.
In the March inflation report we expect annual headline inflation to have fallen from 6.6%yr to 5.6%yr and underlying inflation to have fallen from 4.8%yr to 4.2%yr.
That evidence would be available by the May 2023 Board meeting, allowing the Board to move to a 'wait and see' approach, potentially signalling the end of the tightening cycle with the cash rate having reached 2.6%.
We also expect that the evidence around the sharp slowdown in the US economy will be a signal to the Board that steady policy is appropriate.
Markets have no sympathy with our view that the RBA can chart this course. They would point to the unsustainability of Australia's cash rate settling 87.5bp below the federal funds rate.
Australia's soft landing will allow the RBA to hold rates steady in 2023 and 2024 as inflation gradually eases back into the 2-3% target zone.
On our forecasts, after the FOMC is forced to reset policy in the aftermath of its economy stalling and potentially falling into recession, the RBA cash rate would settle around 50bps above the federal funds rate by the second half of 2024.
We accept that our forecasts for the cash rate assume a successful navigation of a very narrow path towards a soft landing.
In particular, the risks that we have seen recently with large increases in wage settlements are unsettling. That is why it is so important for the RBA to be decisive in the early stages of the tightening cycle with that clear message that it is committed to containing inflation risks.
A swift move into the neutral zone is a critical step and we strongly support adopting those three consecutive 50bp moves before a pause in September.
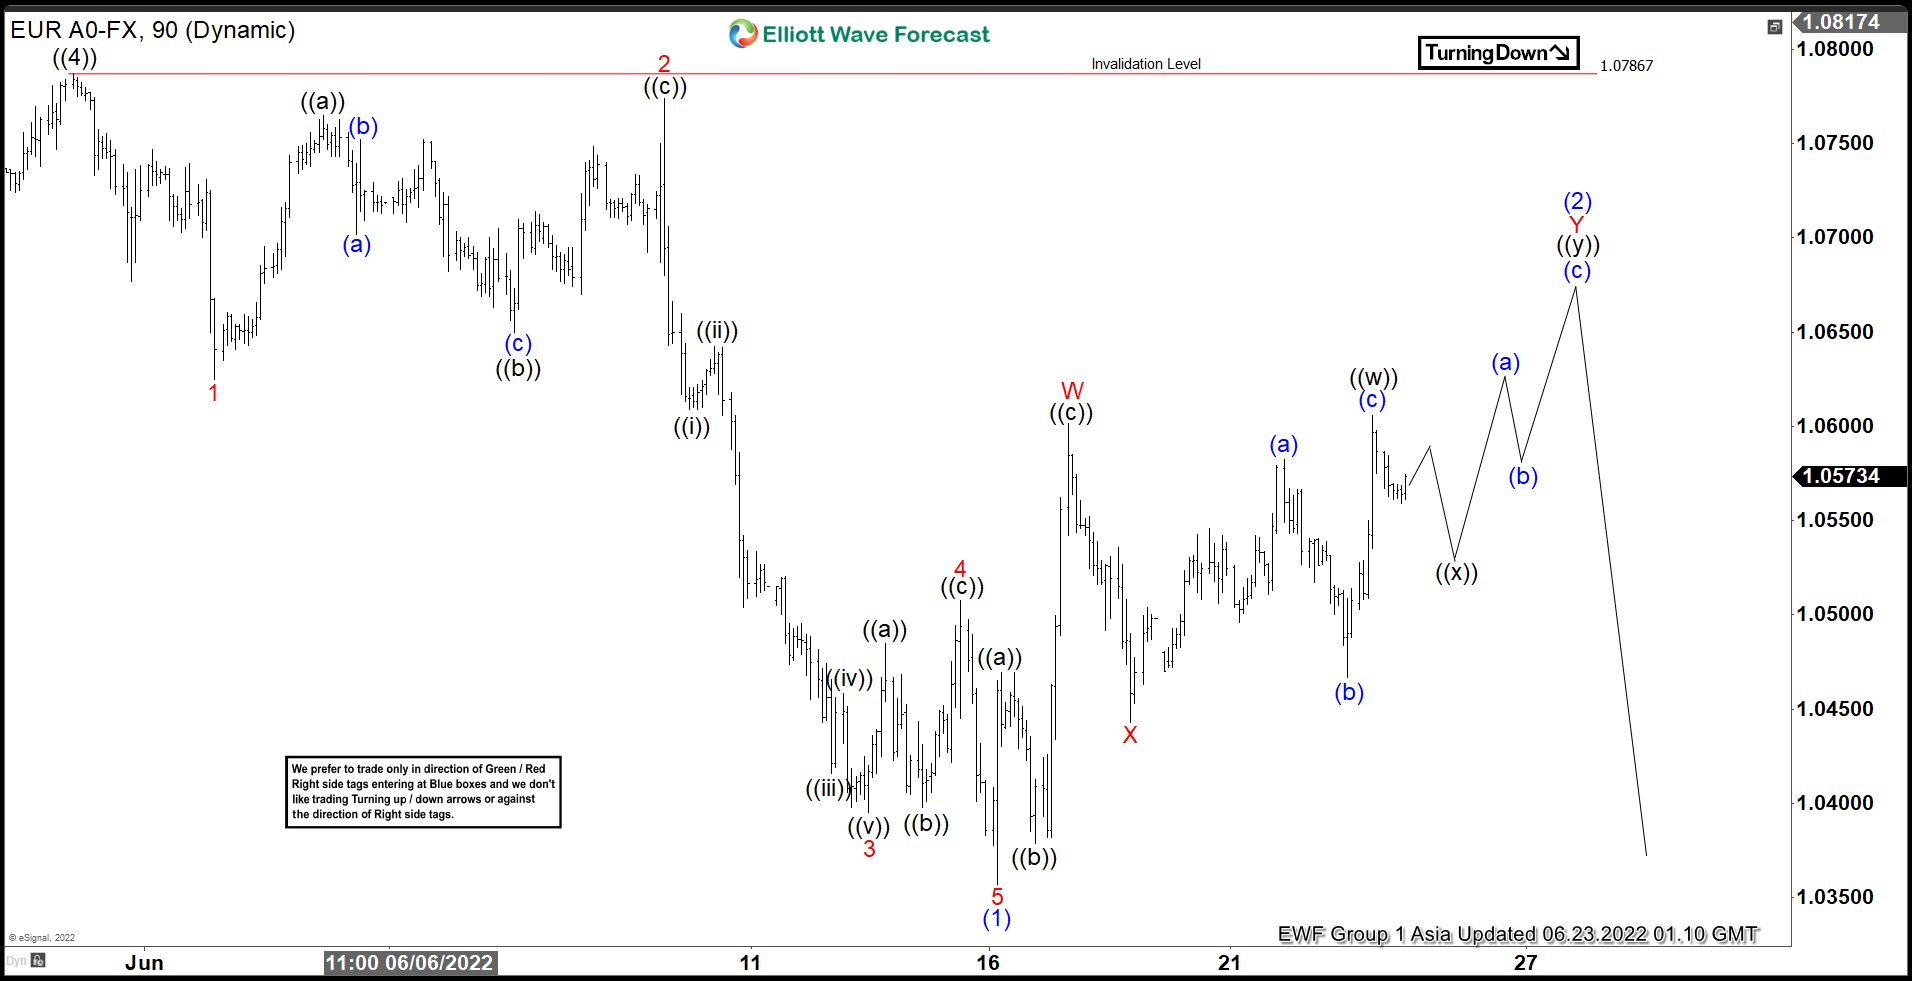
Elliott Wave View: EURUSD 7 Swing Rally
Short term Elliott Wave in EURUSD suggests rally to 1.078 ended wave ((4)). Wave ((5)) lower is currently in progress with subdivision as a 5 waves impulse Elliott Wave structure. Pair however still needs to break previous wave ((3)) low at 1.0348 on May 13, 2022 to rule out a double correction. Down from wave ((4)), wave 1 ended at 1.0625 and rally in wave 2 ended at 1.0774. Pair then resumes lower in wave 3 towards 1.0395, and rally in wave 4 ended at 1.0508. Final leg lower wave 5 ended at 1.0357 which also completed wave (1) in higher degree.
Wave (2) rally is in progress to correct cycle from 5/31/2022 high before the decline resumes. Subdivision of wave (2) is unfolding as a double three Elliott Wave structure. Up from wave (1), wave ((a)) ended at 1.0469 and pullback in wave ((b)) ended at 1.0379. Wave ((c)) higher ended at 1.0601 which completed wave W. Pullback in wave X ended at 1.044 and pair can extend higher in wave Y of (2) now towards 1.069 – 1.0746 area before the decline resumes. Near term, as far as pivot at 1.078 holds, expect rally to fail in 3, 7, 11 swing for further downside.
EURUSD 90 Minutes Elliott Wave Chart