
Sample Category Title
EURUSD Falls to One-Year Low
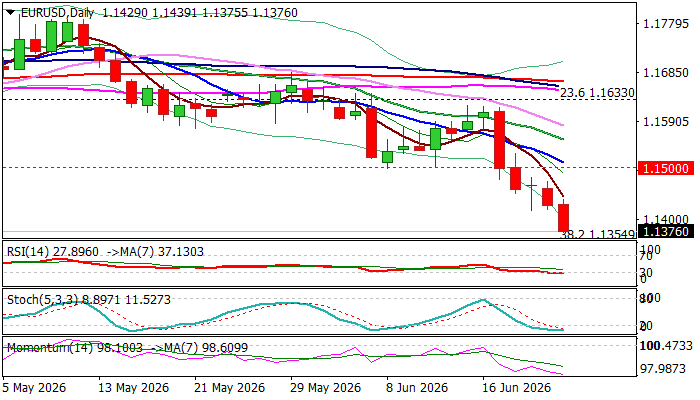
The Euro extends steep fall into fifth consecutive day and falls to the lowest in one year on Tuesday, following break of former 2026 low (1.1410).
The single currency was deflated by growing expectations of Fed rate hike that continue to boost US dollar, with latest dovish remarks from ECB President Lagarde, adding pressure.
Fresh weakness nears next technical support at 1.1354 (Fibo 38.2% of 1.0177/1.2082 rally) and is about to complete Head and Shoulders pattern on weekly chart that would reinforce bearish stance.
Full bearish setup of daily studies supports negative scenario, but oversold conditions warn of increased headwinds bears may face on approach 1.1354 Fibo level and 100WMA (1.1290).
Daily close below 1.1410 is needed to validate signal, however, bounce on partial profit taking may precede.
Under current conditions, upticks are likely to be limited and ideally to be capped by 1.1500 resistance zone (psychological / falling 10DMA / former daily higher base) to provide better levels for re-entering bearish market.
Firm break of 1.1354/1.1290 pivots to open way for extension towards 1.1130 (50% retracement) and to unmask weekly cloud base (1.1048) and 1.1000 zone (psychological / 200WMA).
Res: 1.1410; 1.1443; 1.1500; 1.1555
Sup: 1.1354; 1.1290; 1.1210; 1.1130
AUDUSD Wave Analysis – 23 June 2026
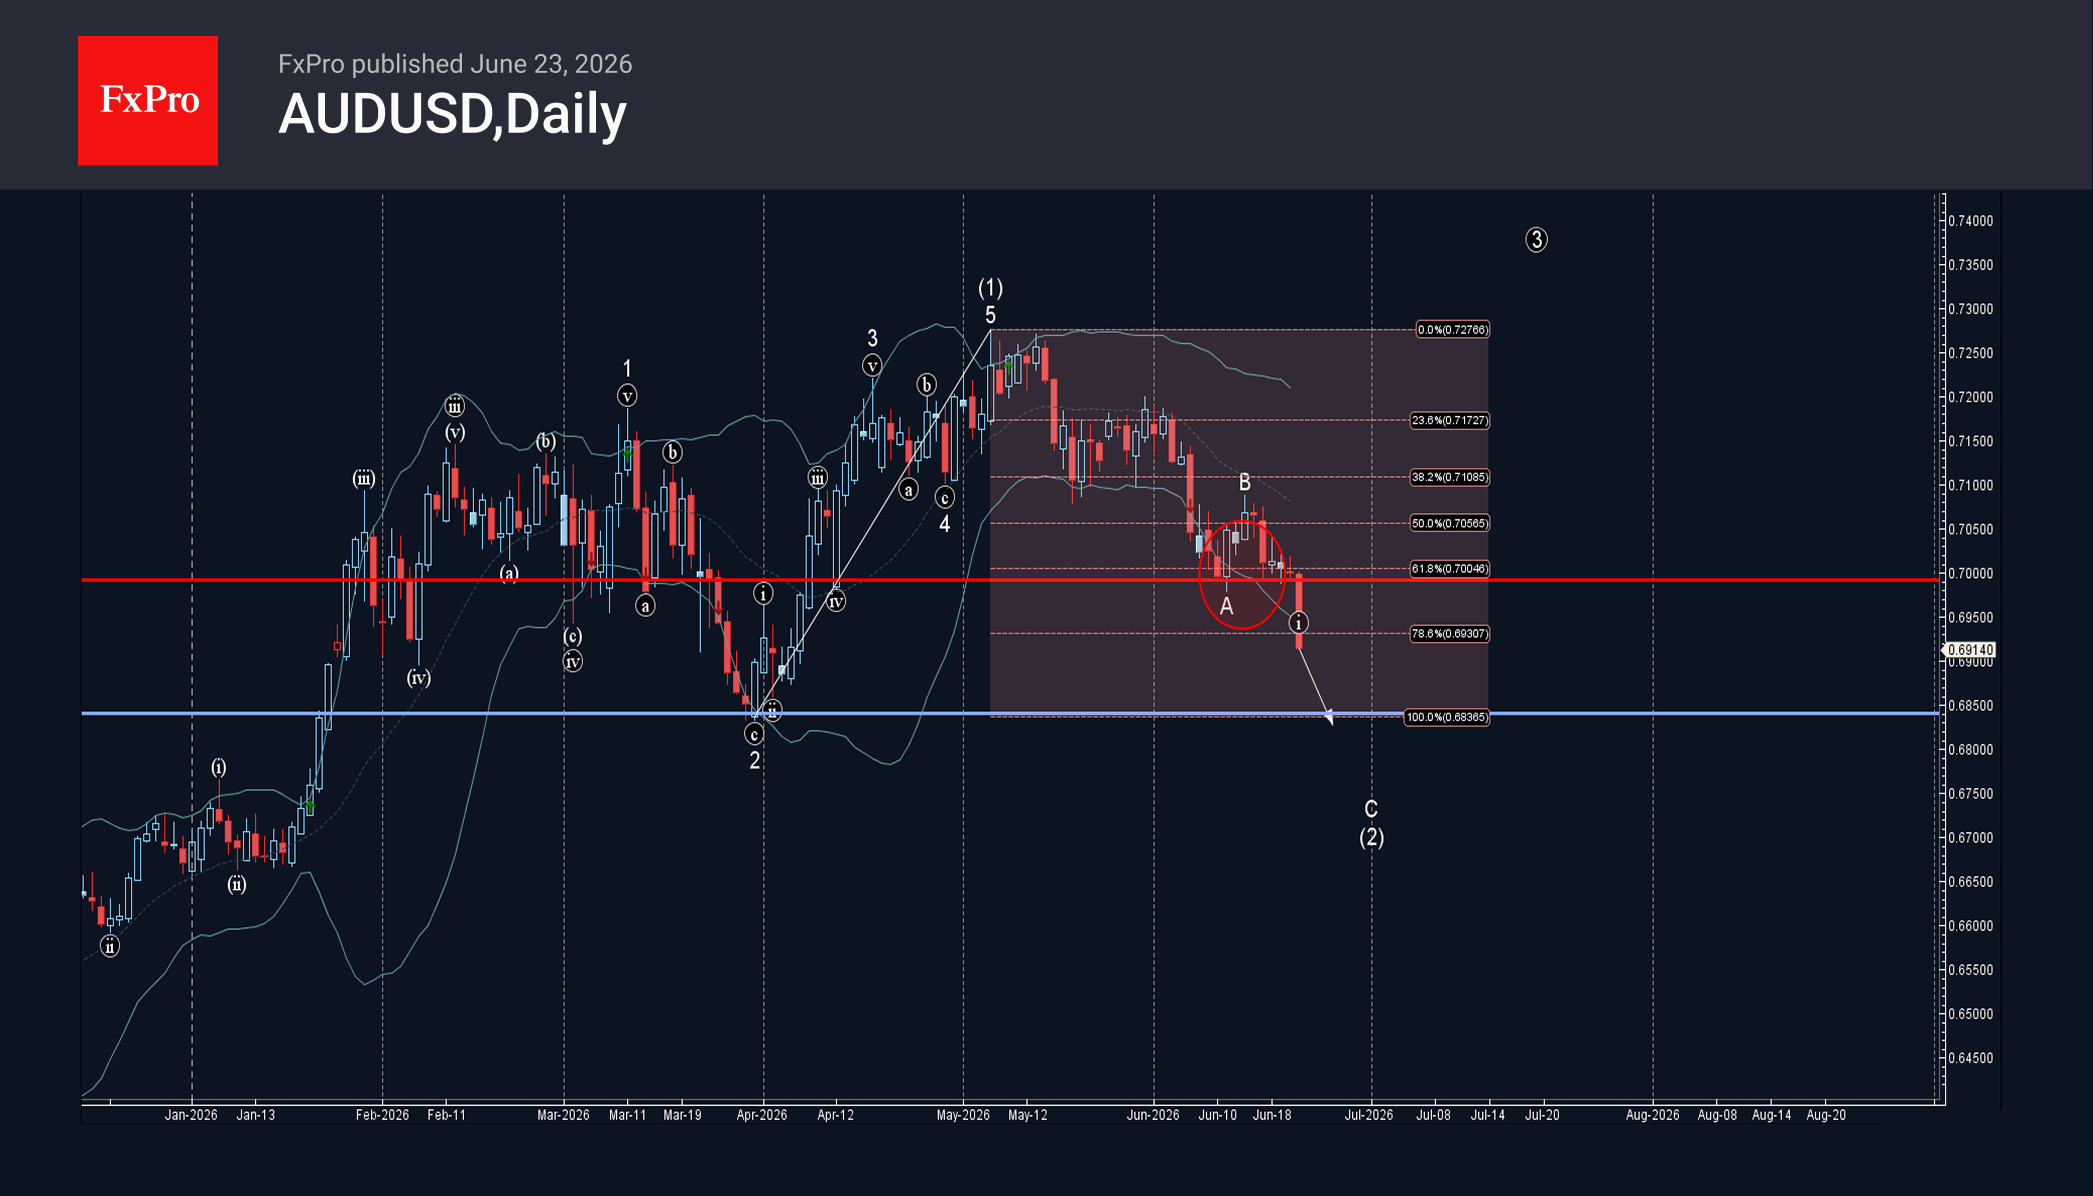
AUDUSD: ⬇️ Sell
– AUDUSD broke support zone
– Likely to fall to support level 0.6850
AUDUSD currency pair recently broke the support zone between the round support level 0.7000 (which stopped the previous impulse wave A at the start of June, as can be seen below) and the 61.8% Fibonacci correction of the upward impulse from March.
The breakout of this support zone accelerated wave C of the ABC correction (2) from the start of May.
AUDUSD currency pair can be expected to fall further to the next support level 0.6850 (former multi-month low from the end of March).
NZDUSD Wave Analysis – 23 June 2026
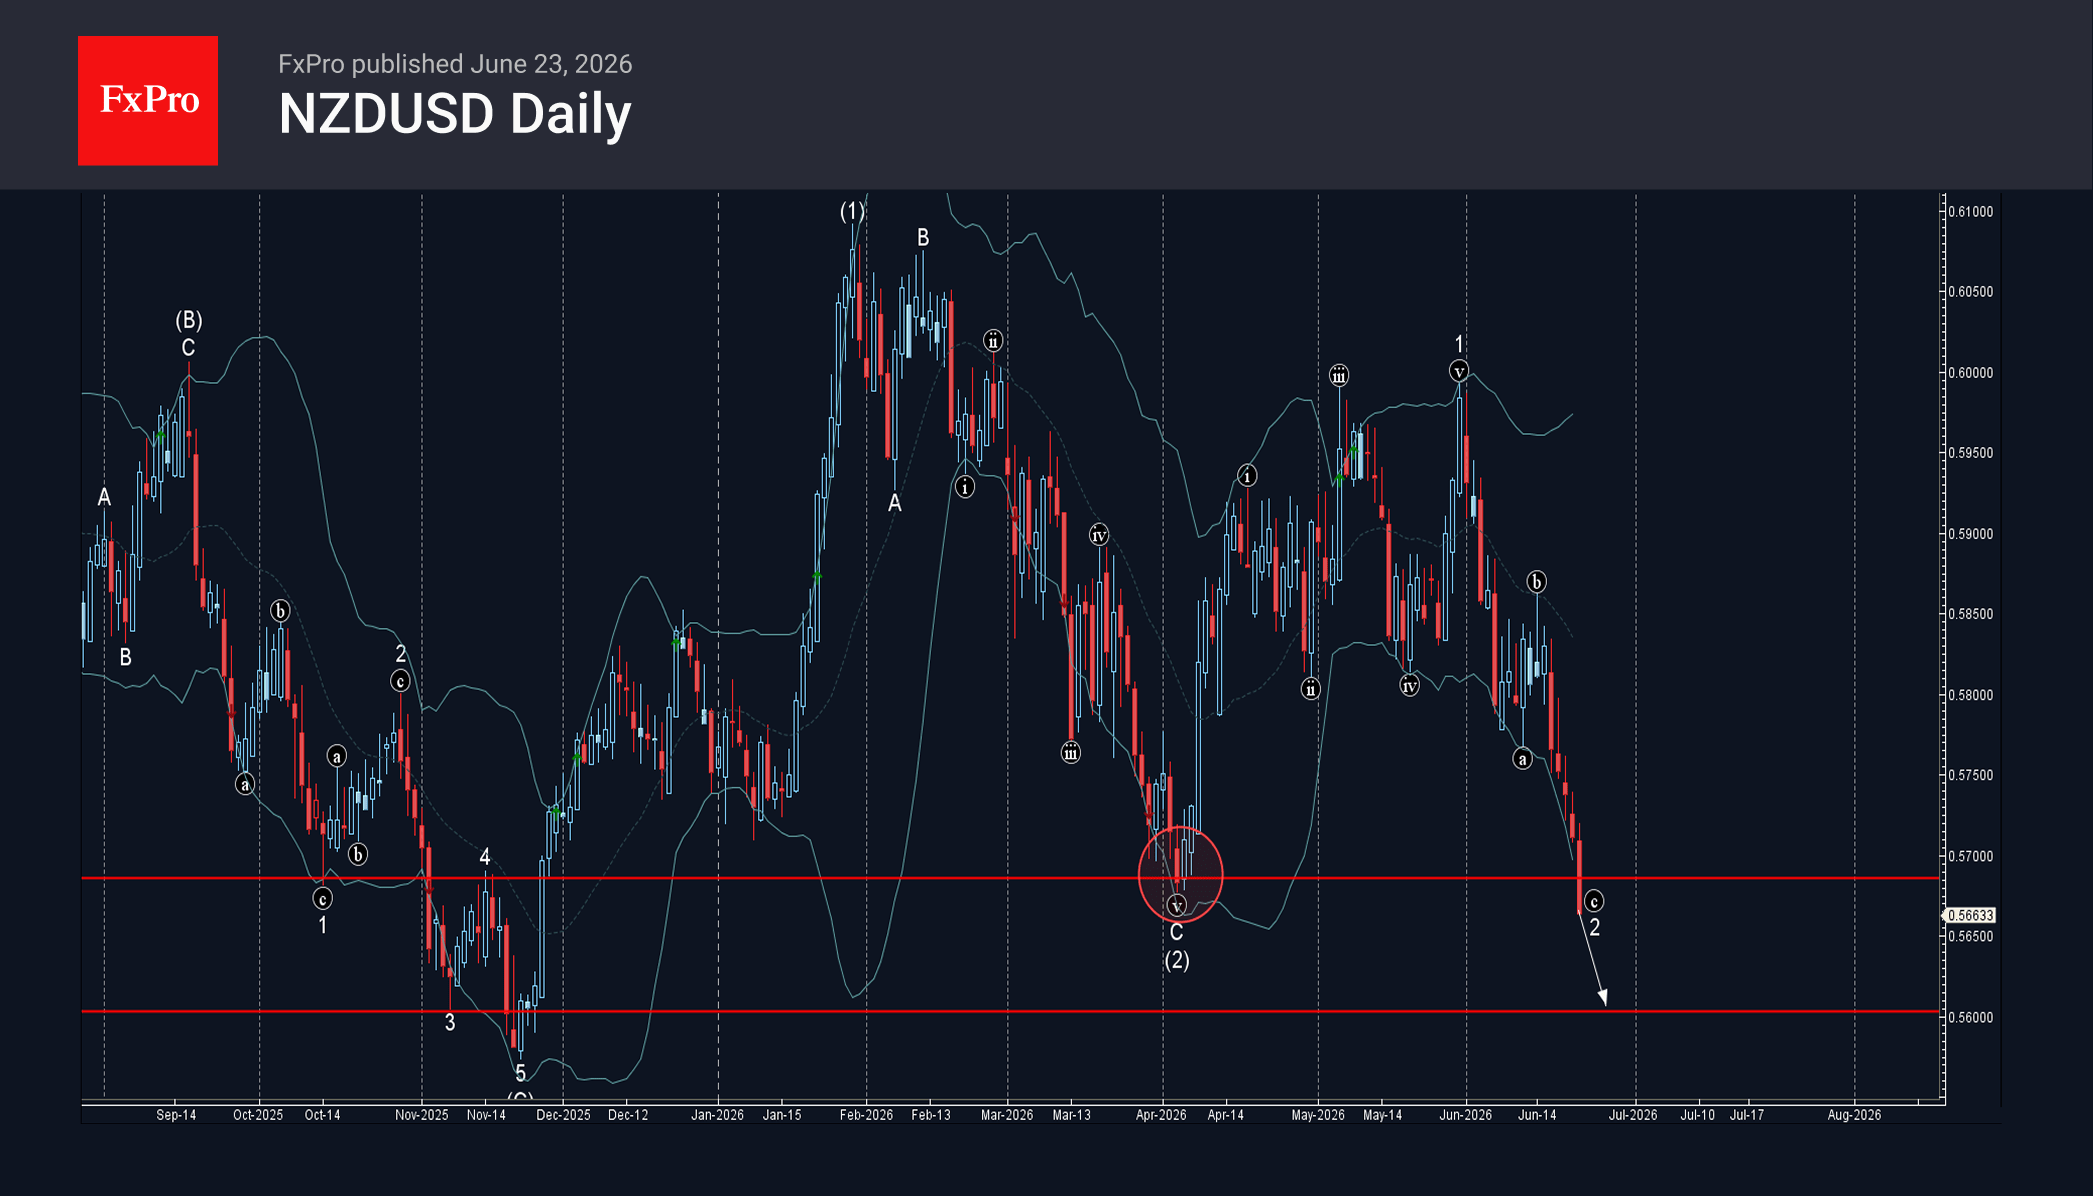
NZDUSD: ⬇️ Sell
– NZDUSD broke key support level 0.5685
– Likely to fall to support level 0.5600
NZDUSD currency pair recently broke the key support level 0.5685 (which stopped the previous impulse wave С at the start of April, as can be seen below).
The breakout of the support level 0.5685 accelerated wave c of the ABC correction 2 from the end of May.
Given the strongly bullish US dollar sentiment seen today, NZDUSD currency pair can be expected to fall to the next support level 0.5600 (former strong support from November).
Eco Data 6/24/26
| GMT | Ccy | Events | Act | Cons | Prev | Rev |
|---|---|---|---|---|---|---|
| 23:50 | JPY | Corporate Service Price Index Y/Y May | 3.30% | 3.30% | 3.00% | 3.30% |
| 23:50 | JPY | BoJ Summary of Opinions | ||||
| 01:30 | AUD | CPI M/M May | -0.70% | -0.40% | 0.40% | |
| 01:30 | AUD | CPI Y/Y May | 4.00% | 4.30% | 4.20% | |
| 01:30 | AUD | Trimmed Mean CPI M/M May | 0.40% | 0.30% | 0.30% | |
| 01:30 | AUD | Trimmed Mean CPI Y/Y May | 3.60% | 3.60% | 3.40% | |
| 08:00 | CHF | UBS Economic Expectations Jun | -25 | -11.1 | ||
| 08:00 | EUR | Germany IFO Business Climate Jun | 85.6 | 85.6 | 84.9 | |
| 08:00 | EUR | Germany IFO Current Assessment Jun | 87 | 86 | 86.1 | |
| 08:00 | EUR | Germany IFO Expectations Jun | 84.1 | 85 | 83.8 | |
| 12:30 | USD | Current Account (USD) Q1 | -227B | -225B | -190.7B | -221B |
| 14:00 | USD | New Home Sales May | 580K | 640K | 622K | 626K |
| 14:30 | USD | Crude Oil Inventories (Jun 19) | -6.1M | -3.9M | -8.3M |
| 23:50 | JPY |
| Corporate Service Price Index Y/Y May | |
| Actual | 3.30% |
| Consensus | 3.30% |
| Previous | 3.00% |
| Revised | 3.30% |
| 23:50 | JPY |
| BoJ Summary of Opinions | |
| Actual | |
| Consensus | |
| Previous | |
| 01:30 | AUD |
| CPI M/M May | |
| Actual | -0.70% |
| Consensus | -0.40% |
| Previous | 0.40% |
| 01:30 | AUD |
| CPI Y/Y May | |
| Actual | 4.00% |
| Consensus | 4.30% |
| Previous | 4.20% |
| 01:30 | AUD |
| Trimmed Mean CPI M/M May | |
| Actual | 0.40% |
| Consensus | 0.30% |
| Previous | 0.30% |
| 01:30 | AUD |
| Trimmed Mean CPI Y/Y May | |
| Actual | 3.60% |
| Consensus | 3.60% |
| Previous | 3.40% |
| 08:00 | CHF |
| UBS Economic Expectations Jun | |
| Actual | -25 |
| Consensus | |
| Previous | -11.1 |
| 08:00 | EUR |
| Germany IFO Business Climate Jun | |
| Actual | 85.6 |
| Consensus | 85.6 |
| Previous | 84.9 |
| 08:00 | EUR |
| Germany IFO Current Assessment Jun | |
| Actual | 87 |
| Consensus | 86 |
| Previous | 86.1 |
| 08:00 | EUR |
| Germany IFO Expectations Jun | |
| Actual | 84.1 |
| Consensus | 85 |
| Previous | 83.8 |
| 12:30 | USD |
| Current Account (USD) Q1 | |
| Actual | -227B |
| Consensus | -225B |
| Previous | -190.7B |
| Revised | -221B |
| 14:00 | USD |
| New Home Sales May | |
| Actual | 580K |
| Consensus | 640K |
| Previous | 622K |
| Revised | 626K |
| 14:30 | USD |
| Crude Oil Inventories (Jun 19) | |
| Actual | -6.1M |
| Consensus | -3.9M |
| Previous | -8.3M |
Sunset Market Commentary
Markets
The June PMIs come with an important disclaimer this time around: "Most of the responses used in the calculation of the June flash PMI data were received prior to the signing of the memorandum of understanding for a cessation of hostilities between the US and Iran on June 17th." A deal was reached at the start of last week, meaning some related optimism entered the closely watched business confidence indicators. But with the actual signing of the deal days later, it's likely that the final reading (July 3) will get revised higher. For now, the euro area economy is contracting at a slower pace than in May with the headline index recovering from 48.5 to 49.5. The survey is indicative of unchanged GDP over Q2, the owner said. The services sector carried the improvement on signs that demand recovers after war-related disruptions. Activity slowed at a slower pace (48.9 from 47.7). Manufacturing production continued to rise modestly (51.2 from 51.3). New businesses fell again. A small increase in manufacturing failed to counter a further fall in services. June saw a renewed, but marginal increase in service staffing levels. Sustained job cuts in manufacturing, however, more than offset that. Manufacturers reported lengthening suppliers' delivery times while purchasing activity was broadly unchanged. The latter meant the end of a three-month increase in anticipative buying. Inflationary pressures eased. Input costs rose rapidly, yet at the slowest pace since February across both sectors. Prices charged/output prices rose again. While less quickly than in May, they did not fully reflect the larger easing in factory gate prices. Optimism for the year ahead ticked higher from the 31-month low seen in June. While still low historically, the direction is encouraging. The PMIs printed close to consensus and leave little traces on markets. German bunds gradually grinded high, resulting in yield changes varying between -3.5 and -4.6 bps. It's more a haven-thing though. A tech shake-out is weighing on stock markets with rotation into value and small caps continuing. The Nasdaq trades another 1.6% lower. The shaky risk environment turns out to be the biggest driver for FX too. It could remain a key factor for trading going into the close of 2026Q2 and 2026H1. The US dollar is the main beneficiary. EUR/USD is testing critical support at 1.1392. Breaking lower means a return to intermediate support in the 1.1214-1.1276 area (2024 and 2023 high respectively). Strong support lies at 1.1109/1.1111, where the 38.2% and the 50% pullback on the 2022-2026 and 2025-2026 rally merge. DXY breaks through 101.14 resistance (38.2% recovery on the 2025-2026 decline) to trade at 101.30. Next stops are 102.86 (50% recovery), followed by 104.59 (61.8%) and 104.68 (March 2025 correction high). Today's market environment helps the yen to stop the haemorrhaging of the last couple of weeks. USD/JPY stabilizes just shy of multidecade highs around 161.5. Sterling continues to enjoy a politically inspired bid, shrugging off the largely weaker-than-expected UK PMIs. The composite indicator unexpectedly slipped marginally deeper into contraction territory (49.4). EUR/GBP trades at 0.8618, the weakest since mid-March. US PMIs improved from May to 52.2 (composite) with better readings across both sectors. They amount to an annualized 1% growth in Q2. The PMI owners strike a cautious tone, particularly when it comes to employment. Factory job cuts are running at the highest since 2009 if the pandemic is excluded. Input cost inflation is high but has eased from May while prices charged rose at the same pace seen last month.
News & Views
The Hungarian central bank (MNB) lowered its policy rate as generally expected by 25 bps, from 6.25% to 6%. The inflation path in the June forecast significantly shifted downwards compared to the March Inflation Report. The stronger forint, as well as the decline in energy and food prices has resulted in lower inflation. With the easing of the conflict in Iran, market fuel prices are declining below the level of fuel price caps. For the rest of this year and next year the rate of price increases will remain below the central bank's 3% target. On annual average, inflation is expected to be 1.8% this year, 2.3% in 2027, and 3% in 2028. New GDP forecasts stand at 2%-3%-2.9% for the policy horizon. The baseline scenario is surrounded by balanced inflation and upside growth risks. The global risk environment has become more favourable, Hungarian risk premia remain tight and frozen EU funds will be unlocked. Looking ahead, if current positive developments persist, the MNB – while maintaining a positive real interest rate – sees room for further interest rate cuts throughout the summer, with a decision on their continuation to be made based on the September Inflation Report. The MNB meets both in July (21) and August (25) suggesting a 5.5% policy rate going into the September meeting. That's faster than markets were anticipating. EUR/HUF extends today's risk-off gains, moving from 352 to 355. The HUF swap rate curve bull steepens with yields up to 6 bps lower at the front end.
US PMI Improves as Middle East Tensions Ease and Energy Costs Fall
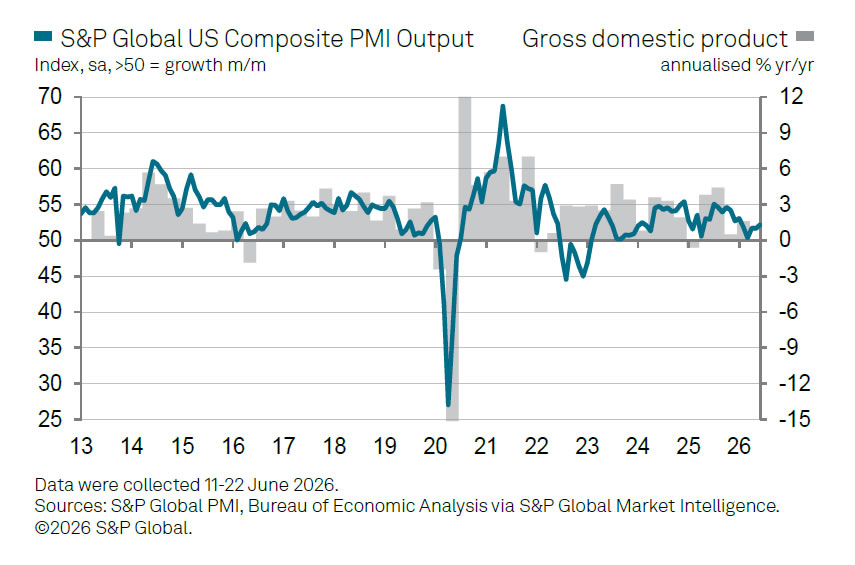
US business activity accelerated in June, with the Flash Composite PMI Output Index rising from 51.5 to 52.2, its highest level in five months. The improvement was driven largely by manufacturing, where the Manufacturing PMI increased from 55.1 to 55.7, a 49-month high, while the Manufacturing Output Index climbed from 56.6 to 57.7, the strongest reading in nearly five years. Services activity also improved modestly, with the Services PMI Business Activity Index rising from 50.7 to 51.3, a four-month high.
According to S&P Global's Chris Williamson, improved sentiment following progress toward peace in the Middle East helped support business confidence. However, he cautioned that overall growth remains relatively subdued compared with the pace seen before the conflict. The survey is consistent with an economy expanding at little more than a 1% annualized rate in the second quarter. Services activity continued to be restrained by consumer resistance to higher prices and weak confidence, while manufacturing growth remained supported by inventory building as firms sought protection against supply disruptions. Supply delays became more widespread during June, suggesting concerns about supply chains have not fully disappeared.
The labor market remained the weakest part of the report. Williamson noted that employment fell again, with manufacturing job losses running at their fastest pace since 2009, excluding the pandemic period. Businesses appear increasingly concerned about the durability of recent demand growth and the impact of rising raw material costs. Nevertheless, there was some relief on the inflation front. While input cost pressures remained elevated by historical standards, June data showed signs of cooling, helped in part by lower energy prices toward the end of the survey period.
| Indicator | May | June | Change |
|---|---|---|---|
| Composite PMI Output Index | 51.5 | 52.2 | ↑ 0.7 |
| Services PMI Business Activity Index | 50.7 | 51.3 | ↑ 0.6 |
| Manufacturing PMI | 55.1 | 55.7 | ↑ 0.6 |
| Manufacturing Output Index | 56.6 | 57.7 | ↑ 1.1 |
Warsh: the New Fed Chief Would Like to Repeat Greenspan’s Trick of Ignoring a Productivity Boom
At the remarkable age of one hundred, the legendary central banker Alan Greenspan passed away yesterday. An economist who was nominated no fewer than five times by four different U.S. presidents, he spent twenty years at the helm of the Federal Reserve around the turn of the century. If central banks owe their de facto independence to any one individual, it is Alan Greenspan. In the 1990s, through repeated confrontations with several presidents, he secured for the Fed respect not only among politicians but also among the public.
Obituaries of Greenspan naturally offer a range of assessments of his career as well as anecdotes from the financial world—stories that, on the one hand, built his extraordinary popularity, but on the other significantly undermine the legacy with which he will enter history. In the latter case, we are of course referring to Greenspan’s lax approach to regulation, which likely contributed to the bubble in the U.S. housing market and subsequently to the financial crisis of 2008.
Nevertheless, if there is a current Greenspan legacy worth revisiting, it is his bold mid‑1990s view that the U.S. economy was entering a positive technological shock thanks to the internet. This, he argued, would put downward pressure on unit costs, slow inflation, and therefore remove the need to respond to the associated boom with aggressive interest rate hikes aimed at cooling the economy. As a result, the U.S. enjoyed a strong expansion throughout the 1990s.
A similar masterstroke is what the newly installed Fed leader Kevin Warsh would like to replicate. He sees a parallel between today’s rise of artificial intelligence and the “discovery” of the internet back then. However, if Warsh wants to push through Greenspan-style monetary tolerance toward a positive supply shock, he will face a major obstacle: Kevin Warsh in 2026 is no Alan Greenspan of 1995. Greenspan’s authority and reputation at the Fed in the mid‑1990s were enormous, not only among the general public but also within the expert community. This made him an overwhelmingly dominant figure within the Federal Open Market Committee (FOMC), the body that sets official U.S. interest rates, and he could easily bring other policymakers around to his view.
The relatively young Kevin Warsh has no such standing. It is therefore entirely possible that his position will not prevail at FOMC meetings; he may simply be outvoted, leaving the institution he leads to conduct monetary policy with which he disagrees. In other words, he could find himself in a situation that would have been utterly unthinkable within the Fed during the Greenspan era.
Disclaimer:
Any opinion expressed in this publication represents the personal opinion by the author(s). Neither the degree to which the hypotheses, risks and forecasts contained in this report reflect market expectations, nor their effective chances of realisation can be guaranteed. Any forecasts are indicative. The information contained in this publication is general in nature and for information purposes only. It may not be considered as investment advice. Sustainability is part of the overall business strategy of KBC Group NV (see https://www.kbc.com/en/corporate-sustainability.html). We take this strategy into account when choosing topics for our publications, but a thorough analysis of economic and financial developments requires discussing a wider variety of topics. This publication cannot be considered as ‘investment research’ as described in the law and regulations concerning the markets for financial instruments. Any transfer, distribution or reproduction in any form or means of information is prohibited without the express prior written consent of KBC Group NV. KBC cannot be held responsible for the accuracy or completeness of this information.
Tech Rout Dominates as Yen Surge Raises Risk of Dangerous Feedback Loop
Global markets were gripped by a technology-led selloff today, with investors abruptly shifting their attention away from the fading Middle East energy shock and toward mounting concerns over stretched valuations, leverage, and financial conditions. The sharp decline in Asian equities spilled into Europe and U.S. futures, driving classic risk-off positioning across currencies. Yen led gains, followed by Dollar and Swiss Franc, while Aussie, Kiwi and Euro underperformed.
The immediate catalyst appeared to come from South Korea, where the KOSPI plunged -9.99%, its steepest drop in more than three months. The selloff was severe enough to trigger a mandatory 20-minute market-wide trading halt. Unlike many sudden market declines, this move was not driven by a vague deterioration in sentiment. Instead, it followed comments from Financial Supervisory Service Governor Lee Chan-jin, who expressed deep regret over approving a large batch of highly leveraged single-stock ETFs linked to Samsung Electronics and SK Hynix. The remarks triggered a rapid unwinding of an estimated USD 9.1B retail-heavy leveraged trade, amplifying selling pressure throughout the broader market.
Japan, however, appeared to be experiencing something more than simple contagion from Korea. The Nikkei 225 fell -3.55%, while the Nikkei Semiconductor Stock Index plunged more than -9%. The scale of the losses suggested a broader liquidation of technology and AI-related positions rather than merely a reaction to events in Seoul. Weakness then spread beyond Asia, with NASDAQ futures trading more than -2.5% lower in European hours, raising concerns that investors are beginning to reassess the lofty valuations built during the AI-driven rally.
Not everyone sees the selloff as a fundamental threat to the long-term AI story. Many economists and market strategists continue to argue that artificial intelligence will drive earnings growth for years to come and justify massive capital expenditure programs. From that perspective, today's weakness could ultimately prove to be a buying opportunity rather than the beginning of a bear market. However, even the strongest secular trends are vulnerable to cyclical corrections, particularly after periods of aggressive positioning and elevated valuations.
A more immediate concern for markets is the relationship between the Yen and Japanese equities. The Nikkei reached a record high of 72,353.96 just yesterday, helped significantly by USD/JPY's rise to a multi-decade high near 161.7. A weak Yen has been a major pillar supporting Japanese exporters by boosting overseas earnings when translated back into local currency. That relationship now risks working in reverse.
If risk aversion continues to drive investors into the Yen, a stronger Japanese currency would undermine earnings expectations for exporters and place additional pressure on the Nikkei. Further declines in equities could then reinforce global risk aversion, generating additional safe-haven demand for Yen and creating a self-reinforcing cycle. Such feedback loops have played a significant role during previous global deleveraging episodes. With the Yen still close to multi-decade lows against Dollar, the potential magnitude of any reversal could be amplified.
Meanwhile, not all developments were negative. On the geopolitical front, the United States took another major step toward normalizing relations with Iran by issuing a broad 60-day exemption allowing Iranian crude oil, petroleum products and petrochemicals to be traded in U.S. dollars through August 21. The move represents the most significant rollback of U.S. oil sanctions since the 1979 Islamic Revolution and follows positive progress in Swiss negotiations aimed at securing a permanent peace agreement. Together with last week's memorandum of understanding, the measures continue to remove the energy shock premium that dominated markets earlier this year. Ironically, just as one major source of market anxiety fades, investors appear to have discovered another.
Gold's $4,000 Floor Faces Fresh Threat as Tech Rout Fuels Dollar Surge
Gold is behaving less like a safe haven and more like a casualty of a broader market selloff. As technology stocks plunge across Asia and traders raise bets on further Fed tightening, investors are rushing into the Dollar instead. The result is renewed pressure on Gold's most important support zone of 2026: 4,000. Read More.
UK PMI Signals Second Month of Contraction as Services Slump Deepens
The UK economy contracted for a second straight month in June, but the real story lies beneath the surface. Services activity fell to its weakest level in 41 months, while manufacturing surged to a near two-year high as firms built precautionary inventories amid ongoing supply concerns. The question is whether that factory strength can last. Read More.
Eurozone PMI: Economy Stays Out of Recession as Services Recover
The Eurozone may not be growing, but it is no longer slipping toward recession. June PMI data showed services activity recovering, tourism demand improving, and inflation pressures easing as lower energy prices filtered through the economy. The question now is whether that stabilization can turn into genuine growth. Read More.
Katayama-Bessent Talks Trigger Mild USD/JPY Pullback, But Intervention Fears Stay Contained
USD/JPY finally encountered a reason to pause as Finance Minister Satsuki Katayama revealed talks with U.S. Treasury Secretary Scott Bessent. Her reference to a "firm mutual understanding" on taking action if necessary sounded like a subtle reminder that intervention remains an option. Yet the market's muted reaction suggests traders still view Fed repricing as a far more powerful force than Tokyo's warnings. Read More.
Japan PMI Growth Accelerates as Manufacturing Boom Extends
Japan's economy appears to have weathered the Middle East shock better than expected. Manufacturing output is growing at one of its strongest rates in over a decade, services activity is recovering, and overall business activity accelerated in June. Yet behind the strong headline numbers, rising costs and war-related stockpiling raise questions about how sustainable the momentum really is. Read More.
Australia Composite PMI Climbs Toward Growth, But Demand Remains Weak
Australia's PMI report delivered both good news and bad news. Business activity came close to stabilizing, inflation pressures eased, and services firms resumed hiring. Yet new orders continued to fall and confidence dropped to among the weakest levels on record, leaving the economy at a crucial turning point ahead of this week's inflation and jobs data. Read More.
Fed's Goolsbee: Key Question Is Whether Inflation Stays at 3%-4%
Austan Goolsbee distilled the Fed's inflation dilemma into one question: will inflation stuck at 3%-4% eventually fall back to target, or is it becoming entrenched? While tariff and energy-related price pressures may prove temporary, the Chicago Fed President singled out services inflation as the more troubling and persistent threat. Read More.
USD/JPY Daily Outlook
Intraday bias in USD/JPY stays mildly on the upside at this point. Decisive break of 161.94 high will resume the larger up trend to 100% projection of 152.25 to 160.71 from 155.01 at 163.47 next. On the downside, break of 160.58 minor support will turn bias back to the downside, and bring deeper pullback to 55 D EMA (now at 159.30).
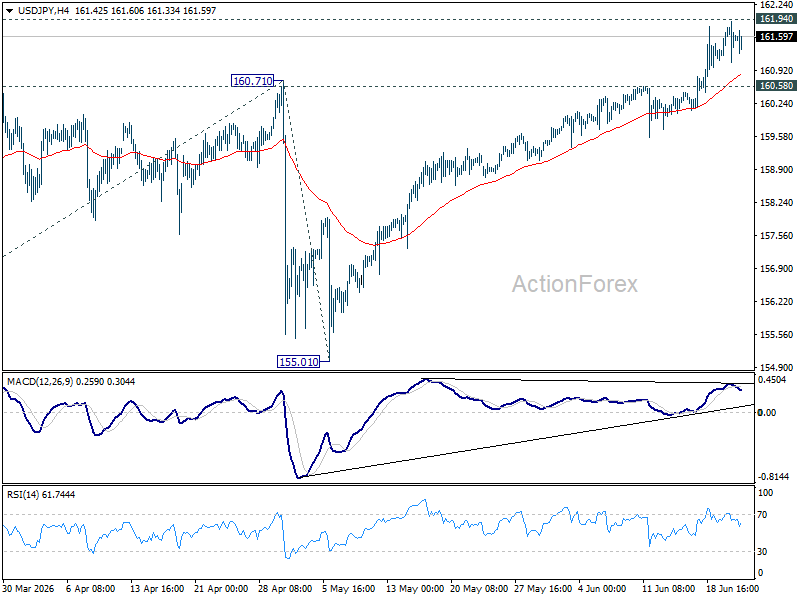
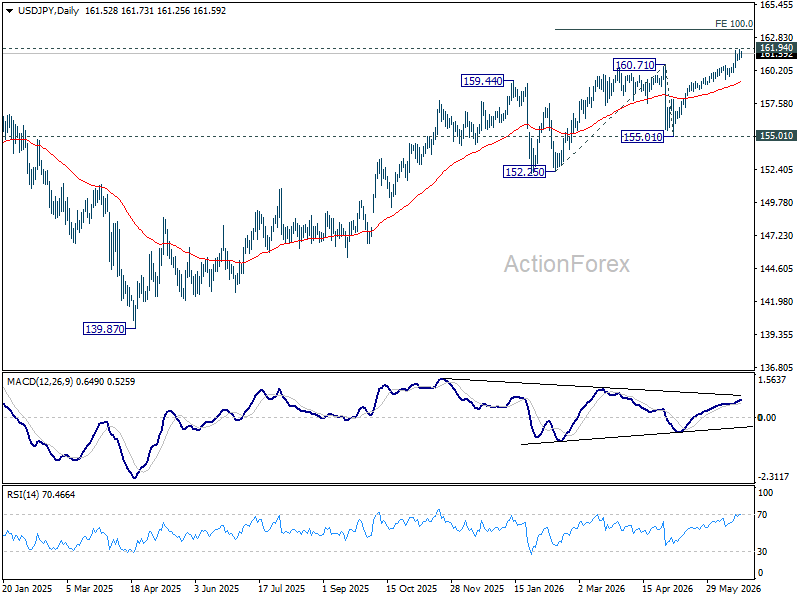
In the bigger picture, for now, corrective pattern from 161.94 (2024 high) is still seen as completed at 139.87. Rise from there is seen as resuming the long term up trend. This will remain the favored case as long as 55 W EMA (now at 155.17) holds.
EUR/USD Daily Outlook
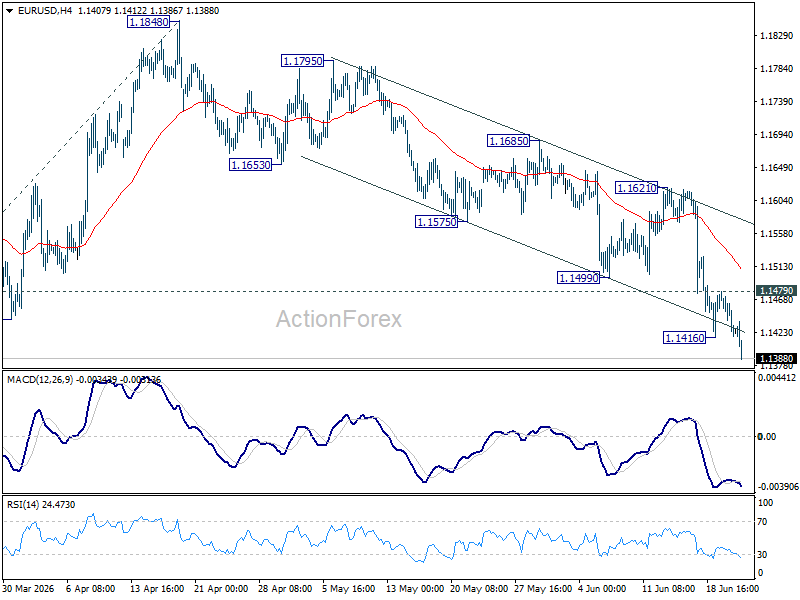
EUR/USD's fall form 1.2081 is resuming by breaking 1.1408 support. Intraday bias is back on the downside. Further decline should be seen to 100% projection of 1.2081 to 1.1408 from 1.1848 at 1.1175. On the upside, above 1.1479 minor resistance will turn intraday bias neutral again first. But risk will remain on the downside as long as 1.1621 resistance holds, in case of recovery.
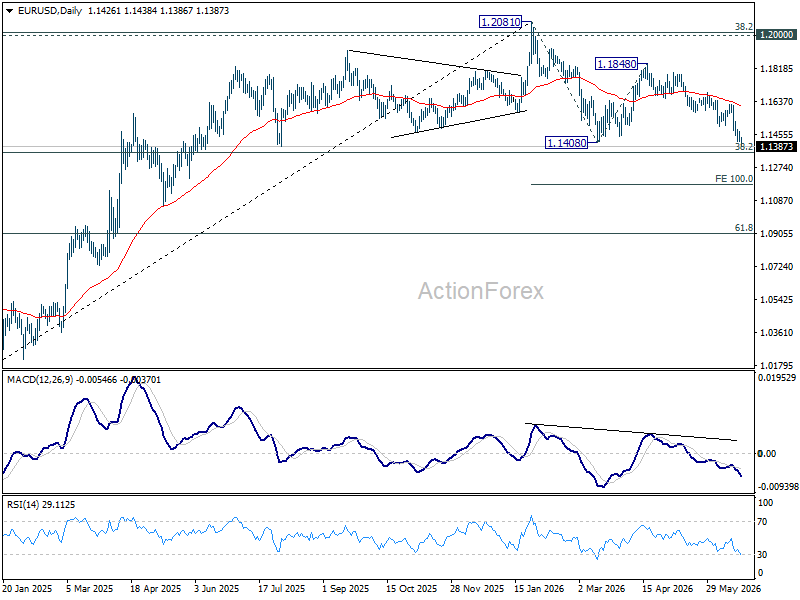
In the bigger picture, focus is back on 38.2% retracement of 1.0176 to 1.2081 at 1.1353. Decisive break there will revive the case of medium term bearish trend reversal after rejection by 1.2 key cluster resistance level. Further fall should be seen to 61.8% retracement at 1.0904. Nevertheless, strong rebound from 1.1353, followed by break of 1.1621 resistance, will retain medium term bullishness.
USD/JPY Daily Outlook
Intraday bias in USD/JPY stays mildly on the upside at this point. Decisive break of 161.94 high will resume the larger up trend to 100% projection of 152.25 to 160.71 from 155.01 at 163.47 next. On the downside, break of 160.58 minor support will turn bias back to the downside, and bring deeper pullback to 55 D EMA (now at 159.30).
In the bigger picture, for now, corrective pattern from 161.94 (2024 high) is still seen as completed at 139.87. Rise from there is seen as resuming the long term up trend. This will remain the favored case as long as 55 W EMA (now at 155.17) holds.