Sample Category Title
EUR/AUD Weekly Outlook
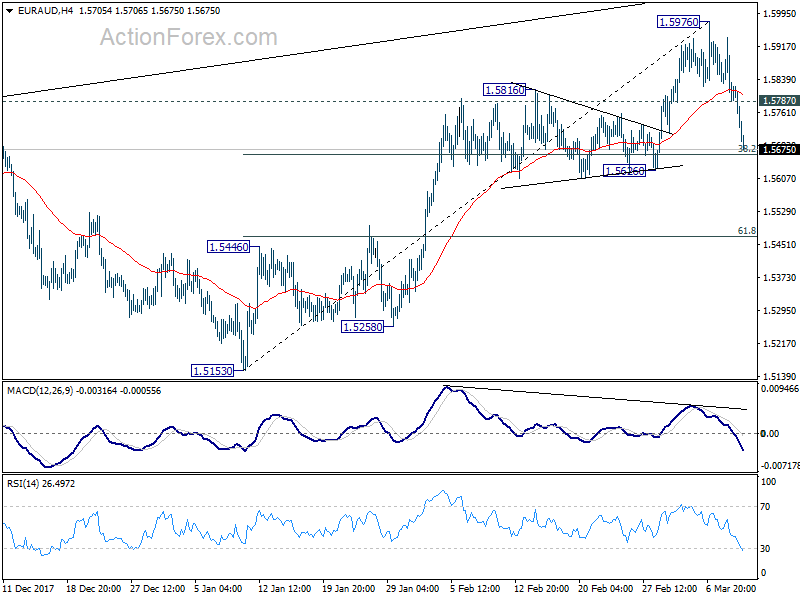
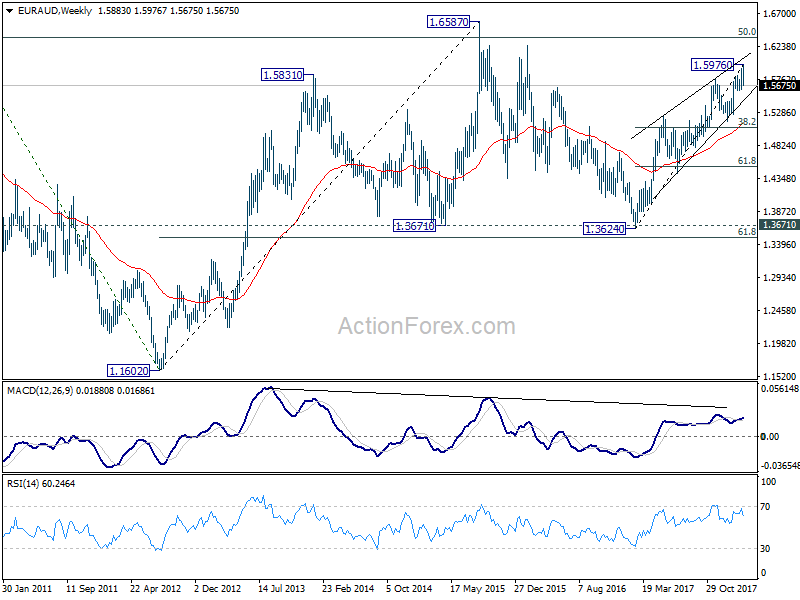
EUR/AUD edged higher to 1.5976 last week but reversed from there. A short term top is at least formed on bearish divergence condition in 4 hour MACD. Initial bias remains on the downside this week for a 1.5626 support. Based on current momentum, break of 1.5626 will pave the way to 61.8% retracement of 1.5153 to 1.5976 at 1.5467 and below. On the upside above 1.5787 minor resistance will turn intraday bias neutral first. But risk will for now stay on the downside as long as 1.5976 resistance holds.
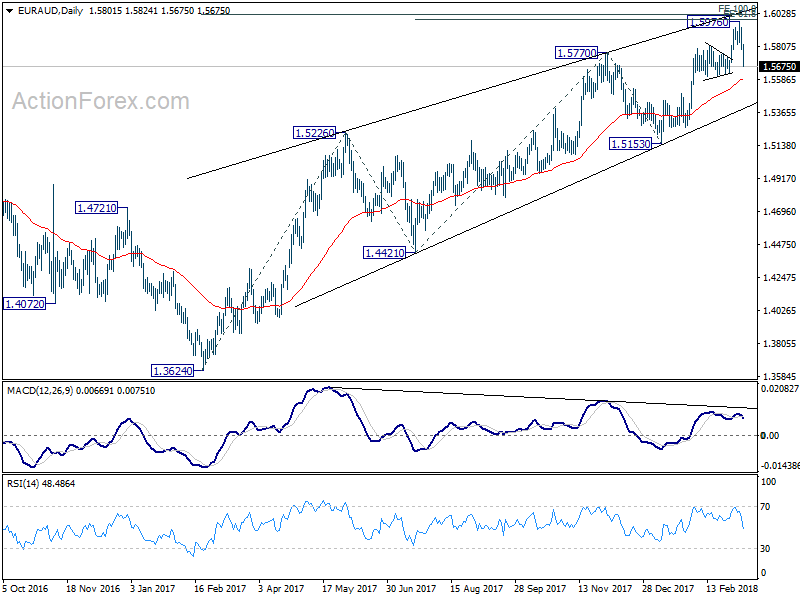
In the bigger picture, change of medium term reversal is increasing with EUR/AUD just missing double projection target. They are 61.8% projection of 1.4421 to 1.5770 from 1.5153 at 1.5987, and 100% projection of 1.3624 to 1.5226 from 1.4421at 1.6023. Also, bearish divergence condition remains in daily MACD. Break of 1.5626 support will add to this bearish case and target 1.5153 key support for confirmation. Nonetheless, before that happens, as long as 1.5153 support holds, medium term rise from 1.3624 could still extend to retest 1.6587 high.
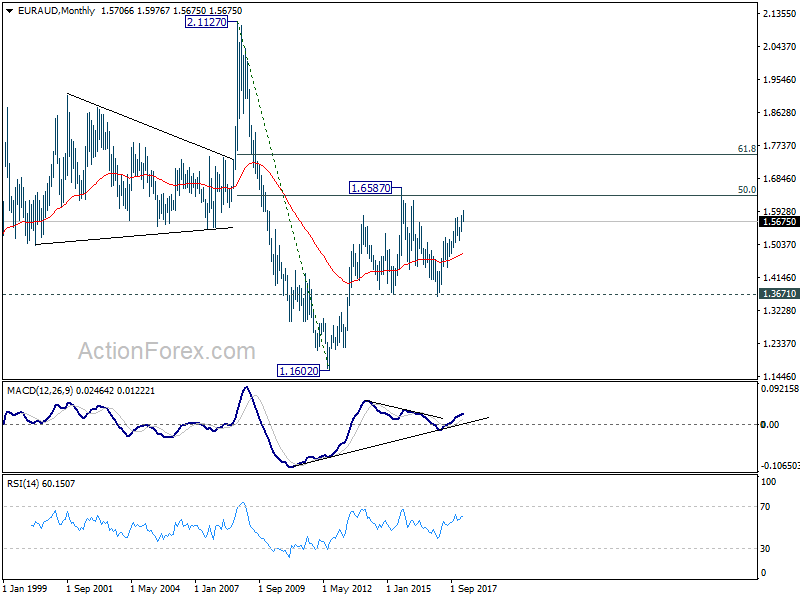
In the longer term picture, the rise from 1.1602 long term bottom (2012 low) isn't over yet. We'll keep monitoring the development but there is prospect of extending the rise to 61.8% retracement of 2.1127 to 1.1602 at 1.7488 and above. However, sustained trading below 1.3671 should indicate long term reversal and target 1.1602 long term bottom again.

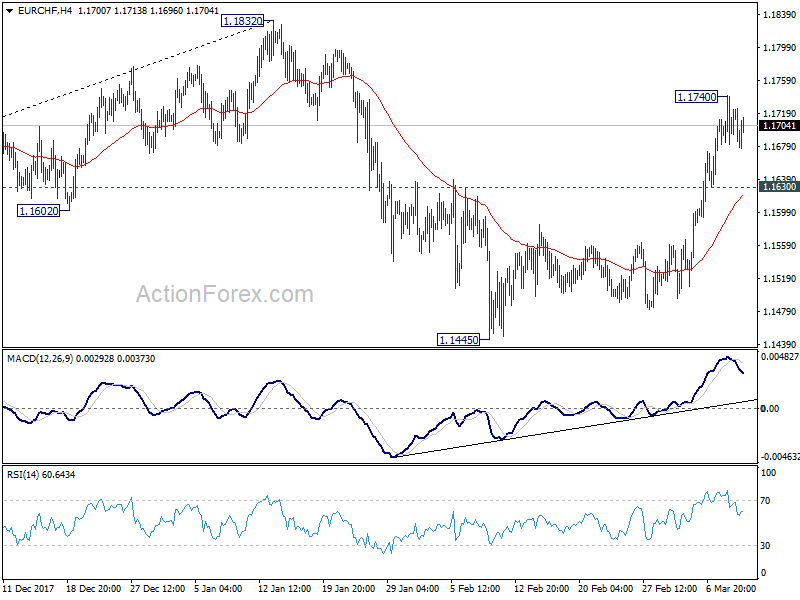
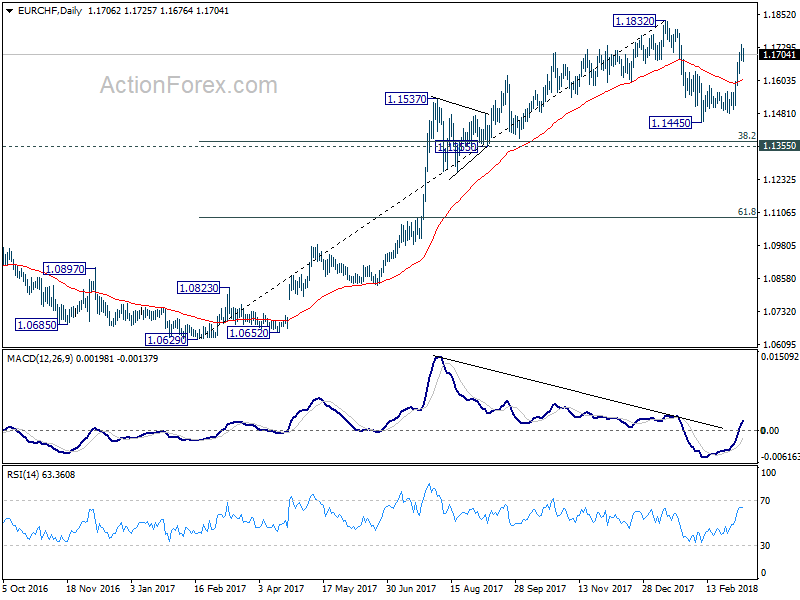
EUR/CHF Weekly Outlook
EUR/CHF's rebound from 1.1445 resumed last week and surged to as high as 1.1740. The development suggests that pull back from 1.1832 is already completed at 1.1445. As a temporary top is formed, initial bias is neutral this week first. With 1.1630 minor support intact, further rise still expected retest 1.1832 high. At this point, we'll stay cautious strong resistance from there to bring another fall. Corrective pattern from 1.1832 might still have an attempt on 1.1355 cluster support (38.2% retracement of 1.0629 to 1.1832 at 1.1372) before completion. On the downside, below 1.1630 minor support will target 1.1445 low again.
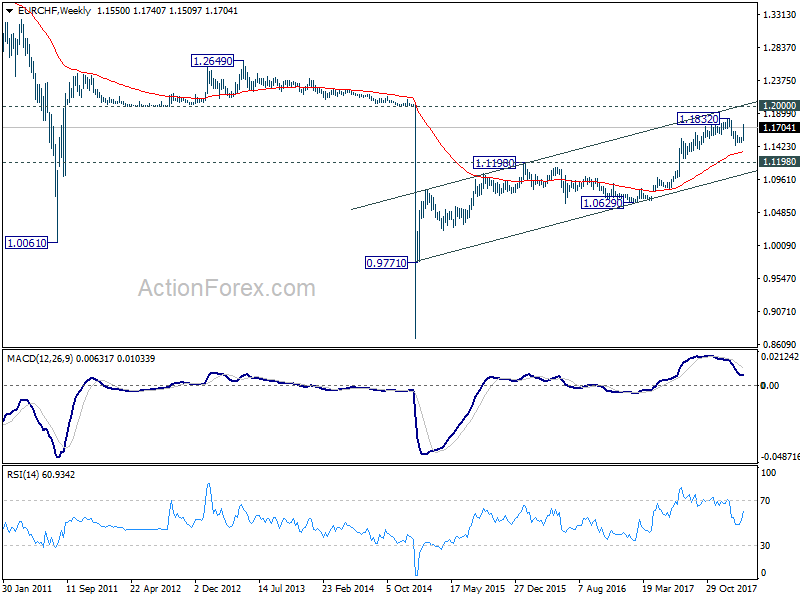
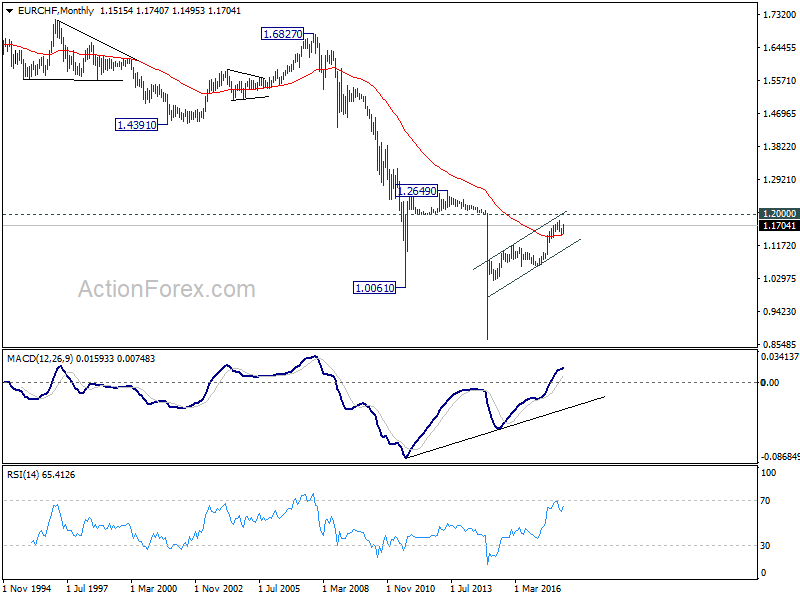
In the bigger picture, a medium term top should be in place at 1.1832 on bearish divergence condition in daily MACD. But there is no indication of long term reversal yet. As long as 1.1198 resistance turned support holds, we'd still expect another rise through prior SNB imposed floor at 1.2000.
Stocks Survived Trump’s Tariffs, Boosted by Perfect NFP, Commodity Currencies Came Back
The stock markets in the US ended the week up solidly as boosted by the "perfect" job report as seen by investors. Worries over trade wars also receded as US President Donald Trump has backed down on his steel and aluminum tariff even on the day of its arrival. DOW took out an important near term 25000 handle firmly to closed the week at 25335.74. NASDAQ even closed at record high at 7560.81 as tech giants were back in form. While strength in other global markets were not as apparent, FTSE, DAX and Nikkei did close the week up.
In the currency markets, Swiss Franc and Yen were the weakest ones as markets were in full risk-on mode towards the end of the week. Euro followed as the third weakest. Even though ECB dropped the easing bias in its statement, President Mario Draghi tried to talk down the significance in the post meeting press conference. Dollar also ended the week down except versus Euro, Yen and Swiss. Sluggish wage growth as report in non-farm payroll gave no support for Fed to hike four times this year.
Commodity currencies were generally higher on risk appetite. Canadian Dollar was once the weakest one during the week. But Canada was exempted by US steel and aluminum tariffs subjected to NAFTA negotiation. The Loonie than regained ground. Aussie ended as the strongest, followed by Loonie and then Kiwi.
NFP perfect for stocks, not so for Dollar
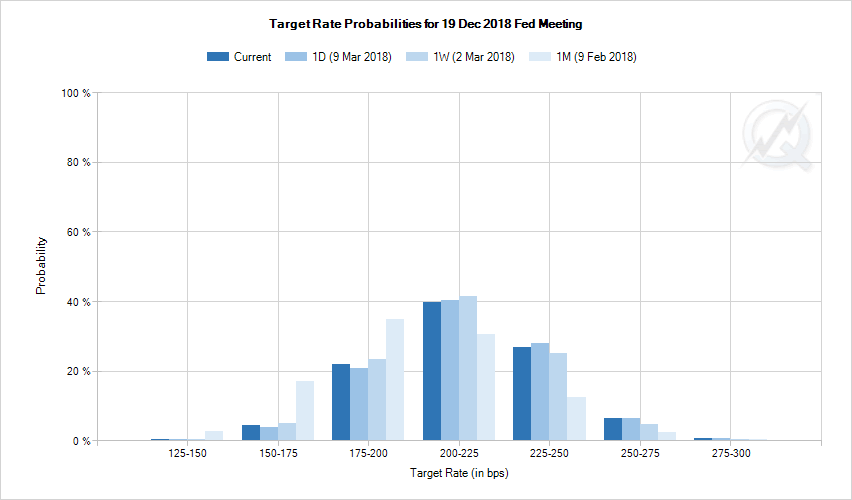
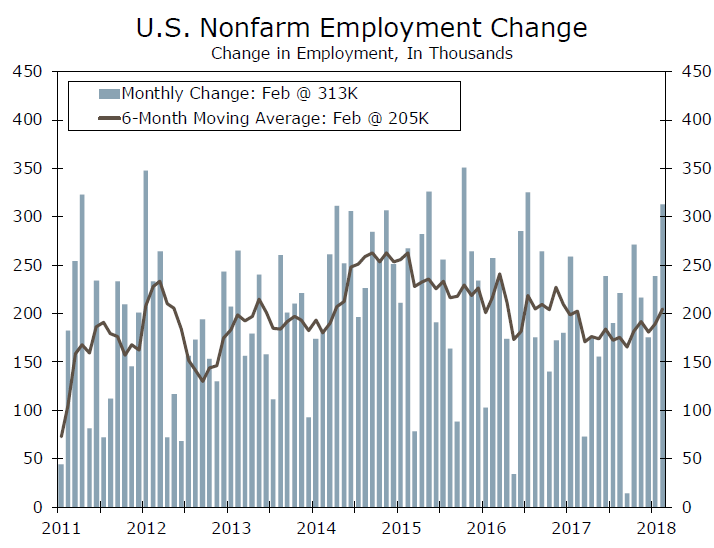
Non-farm payrolls report showed stellar 313k growth in job market in February, way better than expectation of 205k. That's also the fastest growth since mid 2016. However, average hourly earnings only rose 0.1% mom, missing expectation of 0.2% mom. On annual basis, average hour earnings has indeed slowed from 2.8% yoy to 2.6% yoy. Strong job growth showed underlying momentum in the economy. Yet sluggish wage growth gives no reason for Fed to rush into a fourth hike this year.
According to fed fund futures, markets are pricing in 88.8% change of a March hike, pretty much unchanged. The chance for four hikes by December didn't change much from a week ago neither.
 After Canada, Mexico and Australia, who elsewhere will be exempted from Trump's tariff?
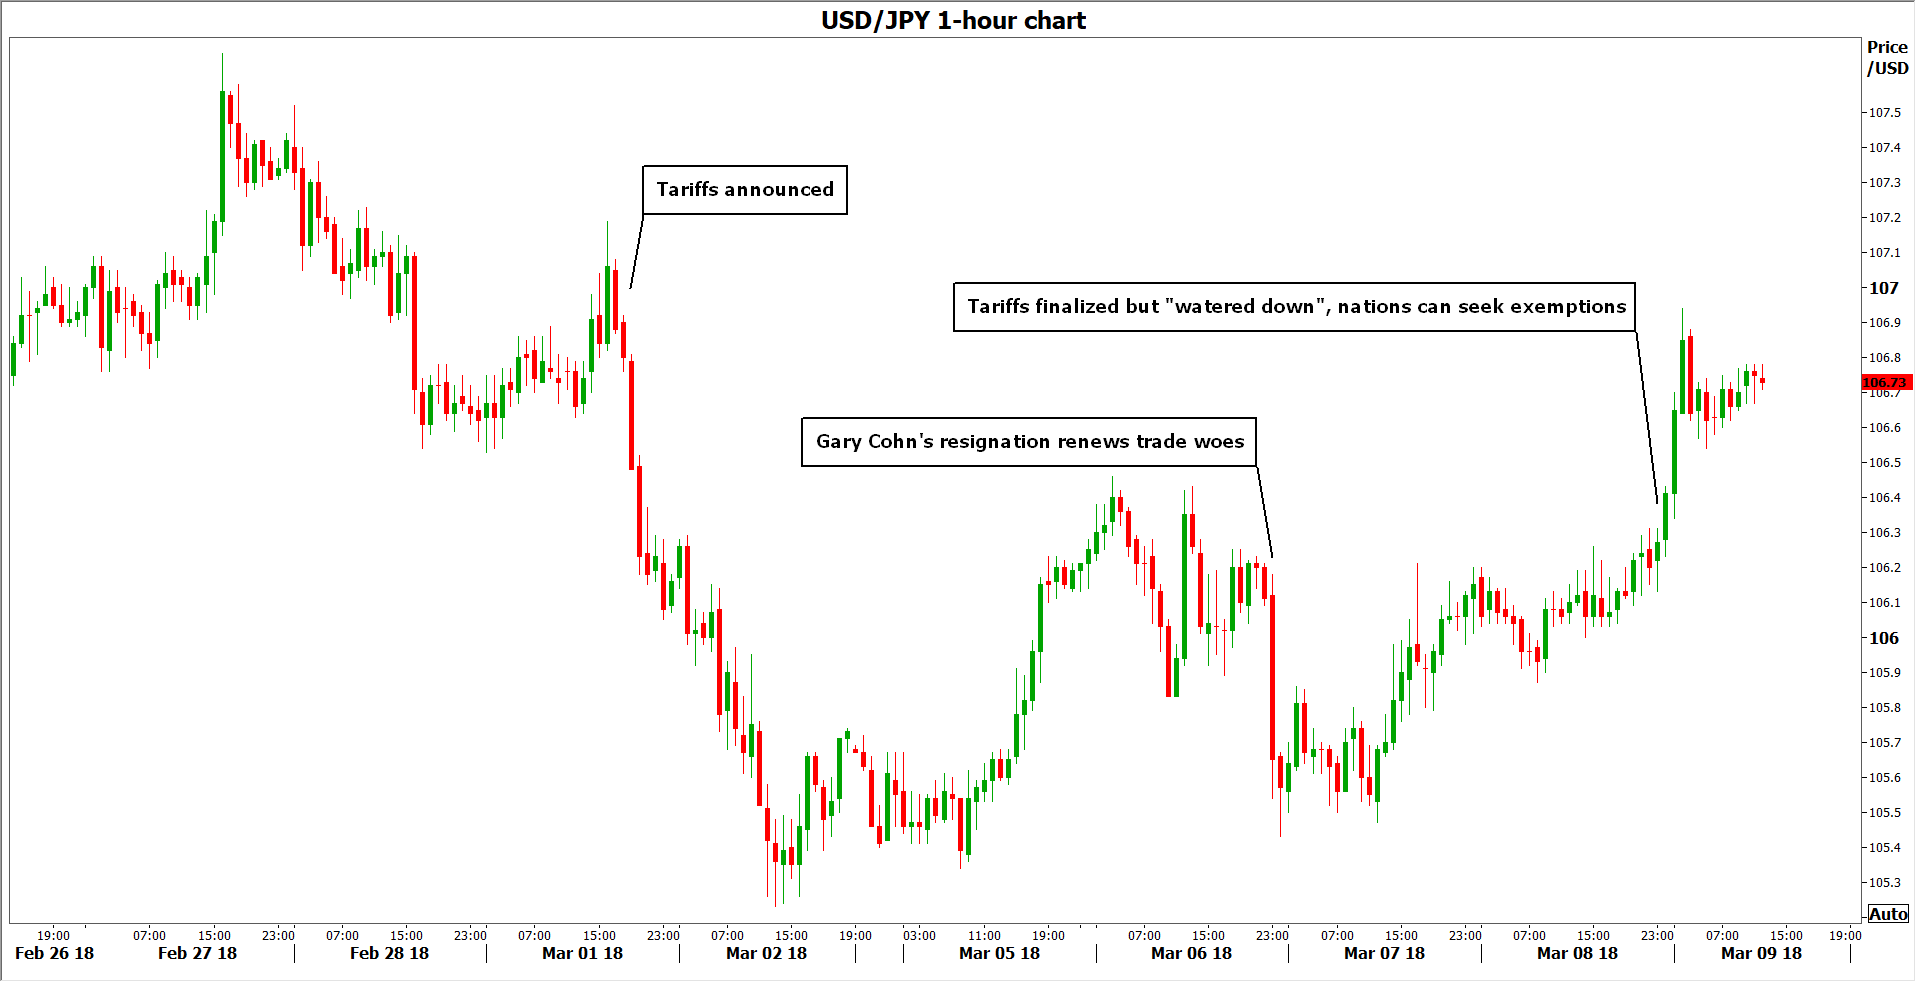
Trump finally signed the proclamations of 25% steel and 10% aluminum tariff on Thursday. The new tariffs will take effect in 15 days. But even before the press conference, he has already backed down from his original position of no exemption. Canada and Mexico are exempted, pending NAFTA negotiations outcome. These two countries are the first (16%) and fourth (9%) largest of steel importers to the US in 2017. And he opened the door for reduction in or even exemptions from tariffs for countries that are "great partners" and "great military allies".
It is firstly unsure who is the person to judge which countries are "great partners" and if there will be any objective criteria for that at all. Or it is, in the end, down to Trump to cherry pick the exemption list? EU and Australia are already knocking the door for exemptions. Indeed, on Saturday, Trump has already tweeted he's going to exempt Australia. Trump could call China being "very helpful" in geopolitical matters with North Korea. Then how about South Korea and Japan, who are much closer to the US in terms on military alliance? South Korea (10%) and Japan (5%) combined contribute to another 15% of US steel imports.
So just Canada, Mexico, South Korea, Japan add up to 40%. If 40% of steel imports is exempted from the tariffs, how is it going to "protect and build our steel and aluminum industries" as Trump declared?
Suggested readings on trade wars:
- The "Winners" and the Losers of a Potential Trade War
- 5 Fronts of Trump's Trade War
- Steel Your Nerves: Effects of Tariffs on U.S. Inflation
- Research US: Symbolic Protectionism With Limited Impact on Growth and Inflation But Risks Remain
Cautious Draghi disappointed Euro bulls
The main takeaway from last week's ECB meeting was that the following texts were omitted from the statement.
"If the outlook becomes less favourable, or if financial conditions become inconsistent with further progress towards a sustained adjustment in the path of inflation, the Governing Council stands ready to increase the asset purchase programme (APP) in terms of size and/or duration."
That is, ECB no longer takes expanding the EUR 30b per month asset purchase program as an option. But later in the post meeting press conference, Draghi tried to tone down the change. While the decision was unanimous, Draghi emphasized that it's just removing "explicit reference" to the chance of increasing the size of the APP again. However, firstly, ECB will keep interest rate at the current level for an extended period after the APP ends. And secondly ECB is still keeping the option to "extend" the APP beyond September.
Euro bulls were clearly dissatisfied with the over messages. Still, EUR/USD ended the week above 1.2268 minor support and well above last weeks low at 1.2154. It's down but not out yet.
Suggested readings on ECB:
- ECB Surprisingly Removed Easing Bias, Draghi Downplayed The Implication On Future Policy
- Draghi's Dovish Message Overrides End to ECB Easing Bias
- ECB Review: 'Hawkish' Action – Softish Language
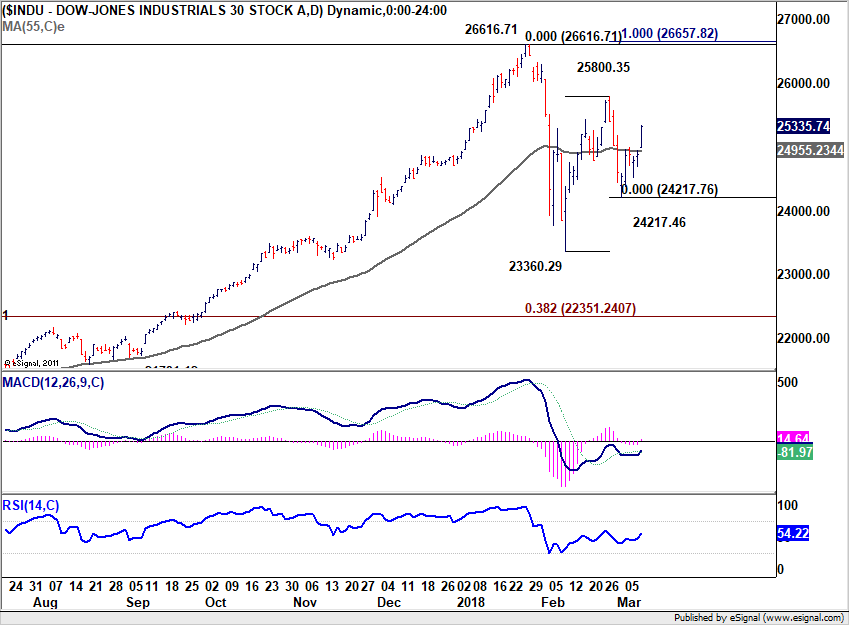
DOW heading back to record high at 26616.71
Technically, DOW's rebound last week suggests that pull back from 25800.35 has completed at 24217.46 already. And rebound from 23360.29 is likely resuming. More upside should be seen this week for 25800.35 and above. However, there is no clear sign that rise from 23360.29 is resuming the larger up trend. It could, in the end, turn out to be the second leg of the corrective pattern from 26616.71. Therefore, we'll look for topping signal as it approaches 26616.71, which is close to 100% projection of 23360.29 to 25800.35 from 24217.76. The corrective pattern from 26616.71 could still have another fall to 38.2% retracement of 15450.56 to 26616.71 at 22351.24 before completion.
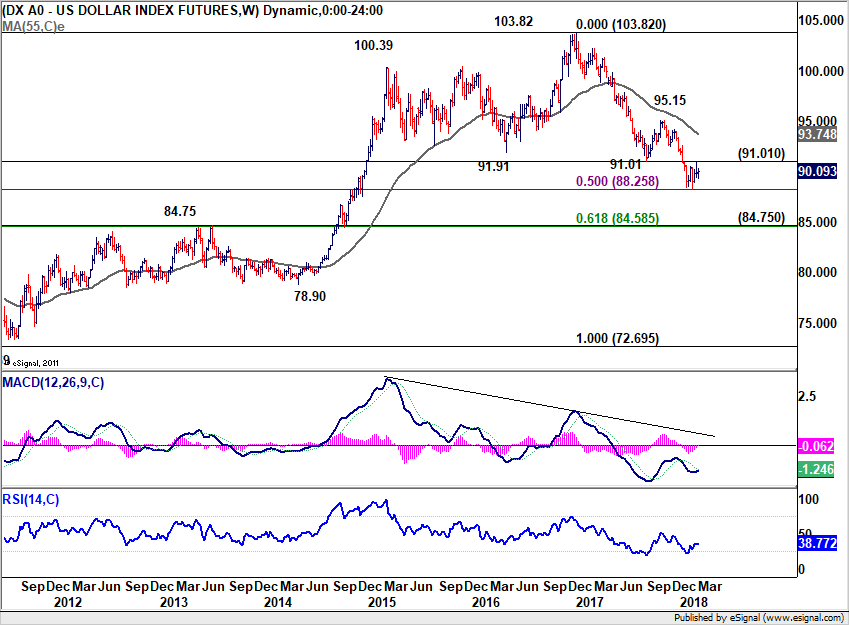
Dollar index still struggles below 91.01 key resistance
Dollar index continued to struggle in established range last week without making any progress. It could be trying to bottom around 50% retracement of 72.69 to 103.82 at 88.25. But there is so far no follow through strength through 91.01 key resistance. And, as long as 91.01 holds, the medium term corrective fall from 103.82 is still favor to extend to 84.75 cluster support (61.8% retracement at 84.58, before completion. Nonetheless, firm break of 91.01 will be a strong sign of reversal and will turn focus back to 95.15 resistance for confirmation.
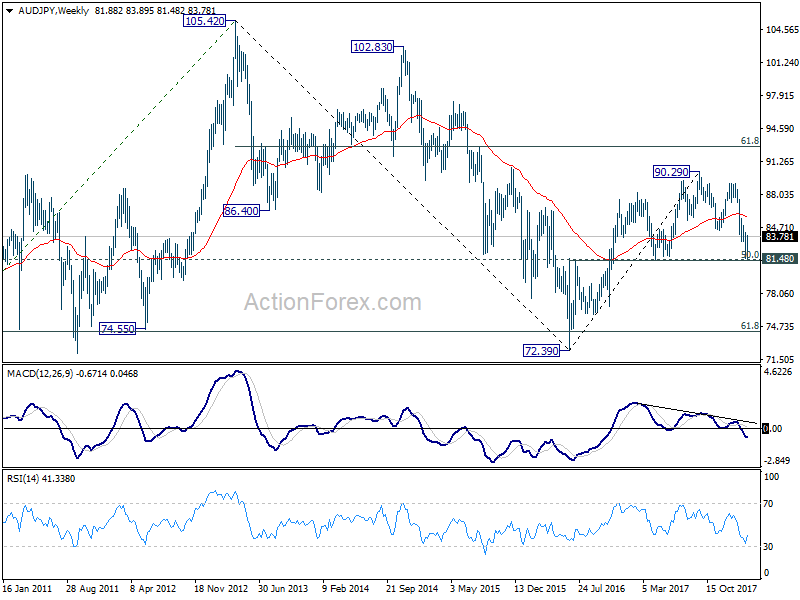
AUD/JPY, EUR/AUD, EUR/CAD
In the currency markets, there are a couple of important developments to note.
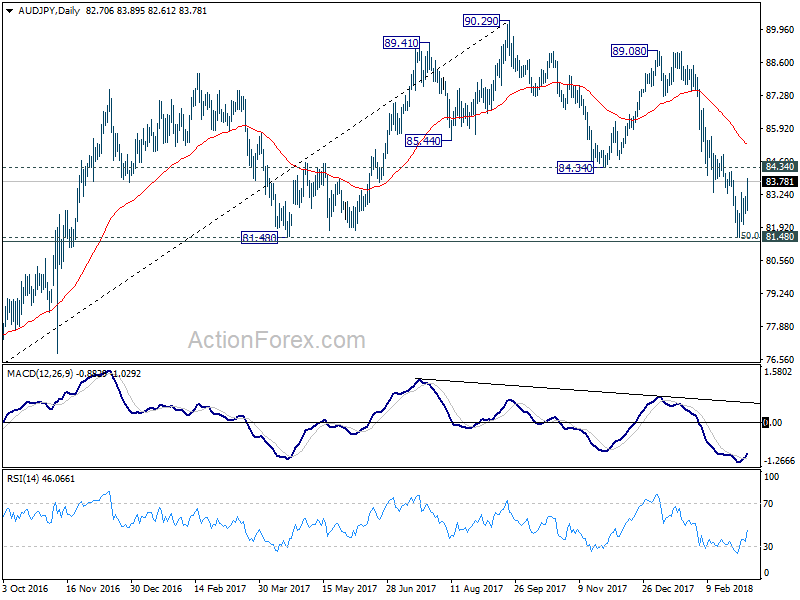
AUD/JPY holds on to key long term cluster support at 81.48 rather well (50% retracement of 72.39 to 90.29 at 81.34). The medium term decline form 90.29 could have already completed, with three waves down after testing this key support level. Immediate focus is now back on 84.34 support support turned resistance this week. Firm break that will pave the way back to 89.08/90.29 resistance zone for, at least, extending range trading.

EUR/AUD's sharp fall is raising the chance of medium term reversal. 1.5976 was close to 61.8% projection of 1.4421 to 1.5770 from 1.5153 at 1.5987, and 100% projection of 1.3624 to 1.5226 from 1.4421at 1.6023. Bearish divergence condition is also seen, persistently, in daily MACD. Rise from 1.3624 could be completed as an abc-x-abc corrective move. A break below 1.5626 support this week will add credence to this bearish case. EUR/AUD should then drop at least to 38.2% retracement of 1.3624 to 1.5976 at 1.5078 with prospect of targeting 61.8% retracement at 1.4522.

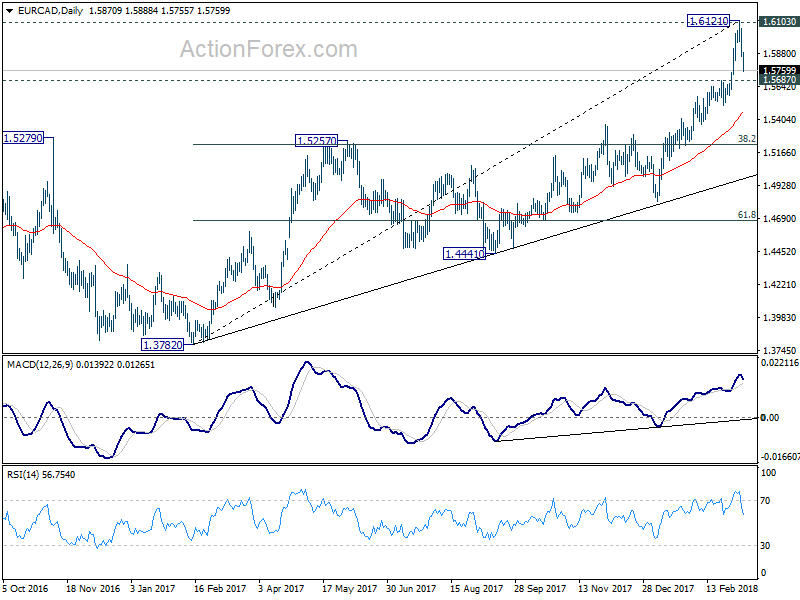
 EUR/CAD has likely topped at 1.6121 after failing to sustain above 1.6103 key resistance. Outlook isn't that bad as we don't see anything serious in daily and weekly MACD and RSI. But the near term, EUR/CAD should gyrate lower. And break of 1.5687 will at least drop to 1.5257 resistance turned support, 38.2% retracement of 1.3782 to 1.6121 at 1.5228, to corrective the medium term rise from 1.3782.
Position trading strategy
The return of global risk appetite after surviving all the recent event risks will likely help support commodity currencies. While Canadian Dollar tried to rebound, it's outlook is still clouded by NAFTA renegotiation. That leaves Aussie as the better choice. To us, it's a choice between Dollar, Euro and Yen. While EUR/USD was resistance, the Euro faced stronger resistance levels against Aussie and Canadian. Therefore, we'll leave Dollar alone. And, comparing EUR/AUD and AUD/JPY, we believe the technical outlook of AUD/JPY is more convincing.
Therefore, we'll jump the gun this week and buy AUD/JPY at market with a stop at 82.40, below 82.48 minor support. Firm break of 84.34 resistance will give on more confidence on the long trade for 89.08/90.29 target zone.
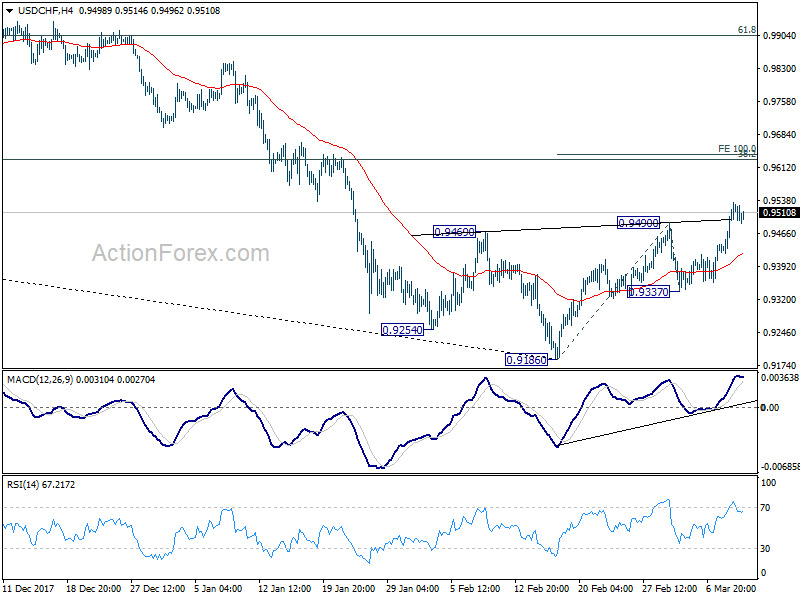
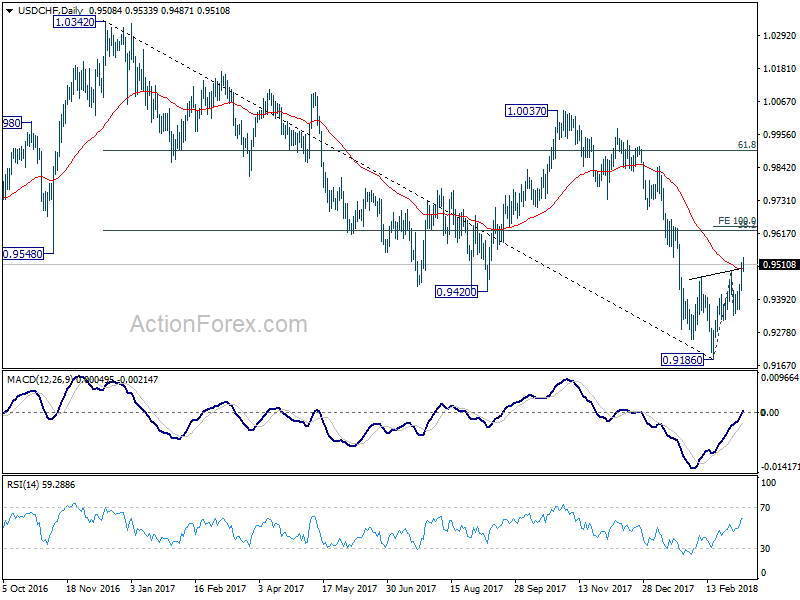
USD/CHF Weekly Outlook
USD/CHF's rebound from 0.9186 resumed last week by taking out 0.9490 resistance. The head and shoulder bottom formation (ls: 0.9254, h: 0.9186, rs: 0.9337) suggests near term reversal. Initial bias remain son the upside this week for 100% projection of 0.9186 to 0.9490 from 0.9337 at 0.9641 first. On the downside, break of 0.9337 minor support is needed to indicate completion of the rebound. Otherwise, near term outlook will be cautiously bullish even in case of retreat.
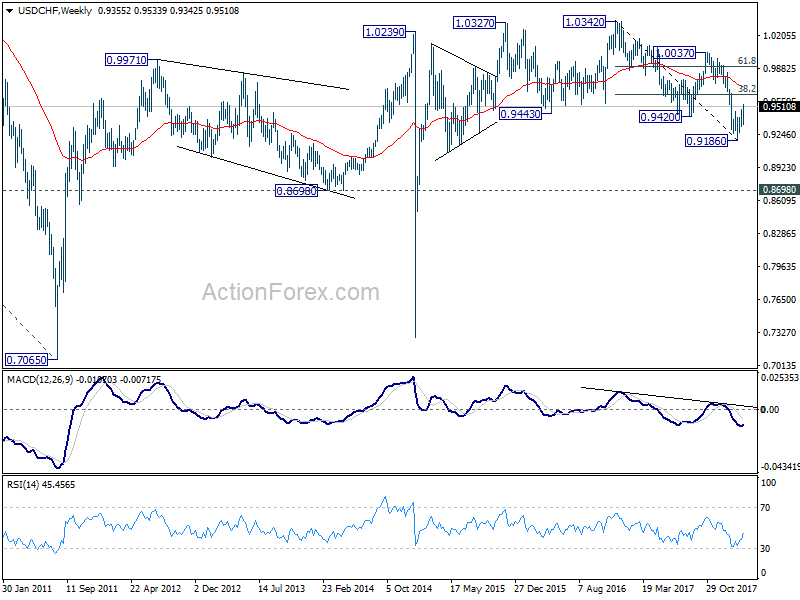
In the bigger picture, fall from 1.0342 is seen as a medium term down trend. Current development is raising the chance that it is completed. But there is no confirmation yet. Focus will now be back on 38.2% retracement of 1.0342 (2016 high) to 0.9186 (2018 low) at 0.9626. Sustained break there will add much credence to the case of trend reversal and target 61.8% retracement at 0.9900 and above). However, rejection from 0.9626 will maintain medium term bearishness for another low below 0.9186.
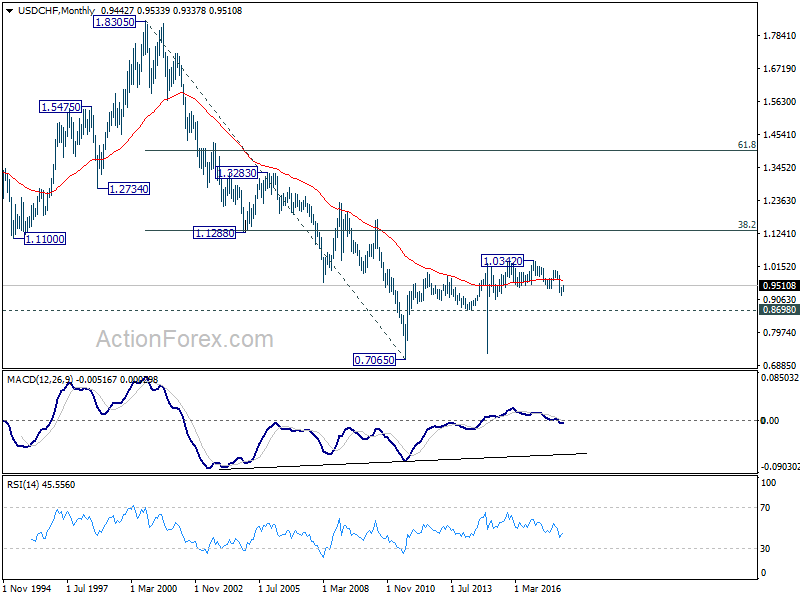
In the long term picture, at this point, the long term decline from 1.0342 is still in favor to extend lower to 0.8698 key support. But sustained break of above mentioned 0.9626 will turn focus back to 1.0037/0342 resistance zone.
Summary 3/12 – 3/16
Monday, Mar 12, 2018
[php_everywhere instance="1"]
Tuesday, Mar 13, 2018
[php_everywhere instance="2"]
Wednesday, Mar 14, 2018
[php_everywhere instance="3"]
Thursday, Mar 15, 2018
[php_everywhere instance="4"]
Friday, Mar 16, 2018
[php_everywhere instance="5"]
The “Winners” and the Losers of a Potential Trade War
Talks of a trade war have been dominating headlines in recent days, with investors being spooked that the latest US tariffs could spark retaliation from other major economies. The “good news” is that recent price action has given us a taste of what to expect in financial markets should the situation escalate from here.
Blink and you missed it. That is how quickly trade-related headlines have been hitting the wires recently, and how sharply markets have been responding to them. The trade narrative came into the spotlight last week, when the US administration announced its plans to slap tariffs on steel and aluminum imports. The announcement prompted major economies like the EU to indicate they will respond to protectionist measures in kind and introduce their own tariffs on the US, generating fears that the situation could rapidly escalate into a retaliatory trade war.
The market movements that ensued – as investors priced in the risk of such a war – are probably one’s best guide of what to expect in case tensions intensify. So, which assets stand to lose and gain the most in a potential tit-for-tat trade war? Let’s start with the losers, as they outnumber the “winners” and require more explaining.
Losers
Aussie & Loonie
In the G10 FX spectrum, the Australian and Canadian dollars probably stand to lose the most. Australia is an export-focused economy, so it could take a heavy hit in case global trade slows. Besides that, the Aussie is very sensitive to developments in China and as such, a slowdown in the Chinese economy due to tariffs would probably weigh on Australia too. Strangely enough, while the New Zealand dollar shares many similar qualities, it has not been responding too negatively to the tensions.
Canada is another major commodity exporter and since it exports the vast majority of its goods directly to the US, its economy would likely suffer in case of increased protectionism. While Canada will gain an exemption from the steel and aluminum duties, according to the White House, the duration of this exemption will depend on how NAFTA talks progress. This implies that the loonie will remain vulnerable to NAFTA negotiations, and also to the risk of tariffs by other countries.
EM currencies
The currencies of emerging economies would be rather defenseless as well. Most of these nations are very sensitive to investors’ risk appetite and global trade, and if trade volumes fall, their currencies could follow suit. Prominent examples include the Mexican peso and the South African rand. In the case of Mexico, the US said it will be excluded just like Canada, but that certainly does not mean the currency is now “out of the woods”.
US dollar – it’s complicated
The greenback weakened notably after the tariffs were announced. However, it lost ground mainly against major currencies, like the euro and the pound, while it managed to gain some ground against the likes of the South African rand. Thus, markets seem to be speculating that increased protectionism in the US would see its own economy perform worse than other developed economies like the Eurozone, but better than emerging economies that would be hit the hardest from trade restrictions. Thus, escalating trade tensions may exert upward pressure on pairs like euro/dollar and sterling/dollar.
Stocks, particularly in Asia – but France seems vulnerable too
Equities would likely be one of the worst performing assets in a trade war environment. There are exceptions of course, which will be outlined below. Speaking about stock markets in general though, they are likely to lose out as companies are faced with higher costs due to tariffs, and also find it more difficult to sell their products abroad. In the end, corporate profits would probably take a hit, exerting downward pressure on equity prices.
Based on the magnitude of the market reactions in recent days, one can argue that Asian stocks are likely to feel the heat even more than their US or European counterparts. This is reasonable, considering that many Asian nations are focused on manufacturing and exporting, and are thus more exposed to changes in global trading volumes.
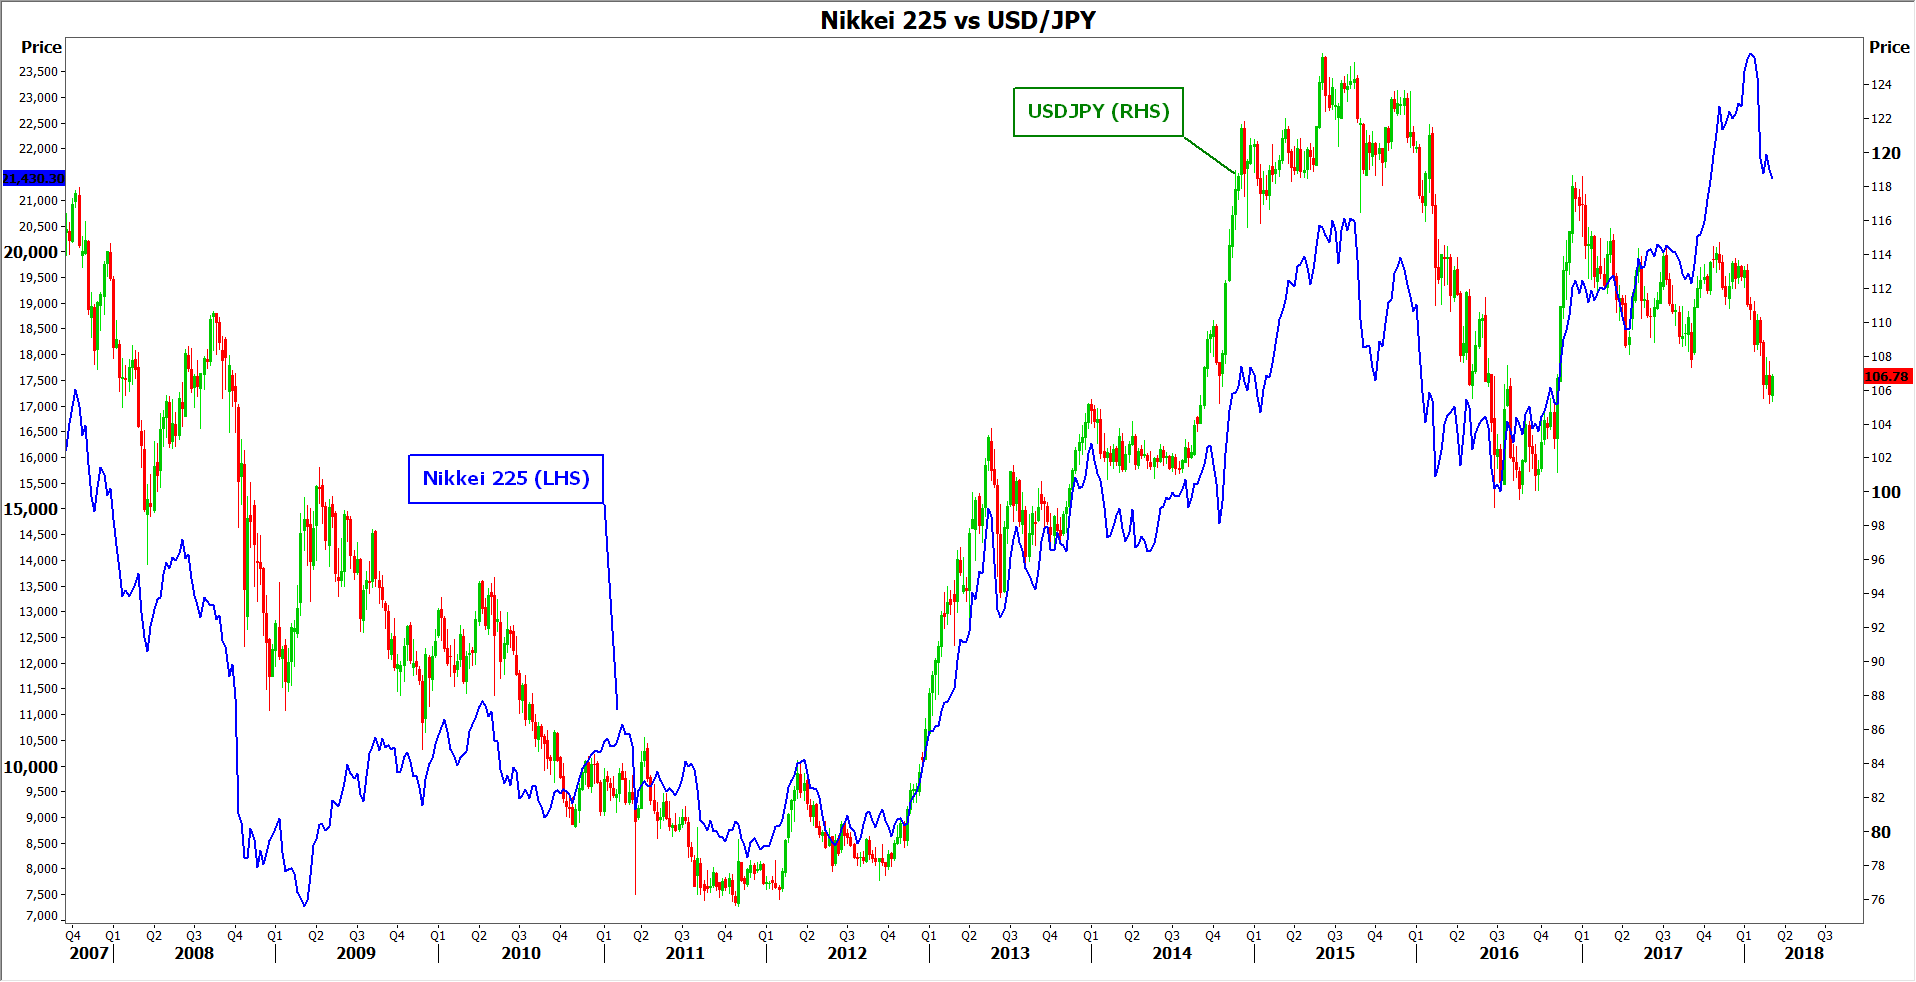
The biggest losses may be recorded in Japanese indices like the Nikkei 225 and the Topix. Since the US tariffs were announced, these indices have declined by much more than their counterparts, and the reason for this discrepancy may be related to the yen. The yen is considered as a safe haven and tends to gain in times of turmoil, such as right now. However, its appreciation typically weighs on Japanese stocks, as the stronger currency hurts the profits of major exporting firms, most of which are listed on the Nikkei.
The next most vulnerable benchmark seems to be the French CAC 40, which has been under severe pressure lately, perhaps due to the concentration of car and plane manufacturers in the index, many of which are major exporters. The Euro STOXX 50 also posted losses, but to be fair to European indices, some of their underperformance may be related to the political events in Italy, not just speculation on tariffs. Hong Kong’s Hang Seng index appears to be at risk as well. Funnily enough, these uncertainties seem to be affecting US and Chinese equity benchmarks the least so far. The S&P 500, Nasdaq 100, and CSI 300 are all higher overall in March.
Risk-sensitive commodities, like oil
Commodities like oil are considered relatively risky and are thus sensitive to changes in investors’ risk appetite. Given that risk sentiment and confidence would likely take a hit in the event of further protectionism, oil prices might come under pressure. From another perspective, tariffs would pose a danger to global economic growth and thereby, hinder demand for oil.
Winners
Japanese yen & Swiss franc – Euro to a smaller extent
The JPY and the CHF are seen as traditional safe haven currencies, that typically appreciate in times of turmoil as investors seek protection. This time was no exception, with both currencies gaining ground amid the trade uncertainties.
What was surprising, was seeing broad gains in the euro. While this may also reflect other factors, like speculation the ECB would appear hawkish at its March gathering, it is worth noting that the euro has served as a “safe haven” in the past. In case a trade war breaks out, the common currency could be viewed as a haven again, especially considering that European nations tend to do a higher portion of their trade between themselves and would thus be less impacted by a deterioration in global trade.
Precious metals, such as gold and silver
Precious metals have traditionally been viewed as safe assets, and true to that statement, both gold and silver saw a jump in their prices after trade headlines started to hit the wires last week.
Individual stocks of companies protected by tariffs
A good example of this is stocks of US steel companies. After Commerce Secretary Wilbur Ross first hinted at steel tariffs back in February 16, the stock price of the US Steel Corporation surged 17% in a single day. The logic is that faced with weakened competition due to the tariffs, these firms could well see their profits go up, and stock prices would follow. Another example is gains in US aluminum stocks after the aluminum tariffs announcement.
Government bonds
Bonds tend to attract safe haven demand, same as precious metals. The idea is that unless you are in a hyperinflationary environment or in a debt crisis, governments will typically pay your money back, and thus your investment is considered as “safe”.
Conclusion
There are generally no “winners” in a trade war, but some stand to lose more than others. While the probability of a full-blown trade war is still relatively low, it is not something to dismiss either as the past week has shown. It will be critical to see how major economies like the EU and China respond to the US tariffs. If they reply in harsh fashion, that could provoke more US action, starting a vicious protectionist cycle. If cooler heads prevail though and tensions deescalate, then the market moves that ensue will probably be the opposite of what was described above: safe havens could tumble, while riskier assets and trade-sensitive currencies may regain their footing.
Finally, the ideal proxies for trade tensions in the FX market may be pairs such as aussie/yen, loonie/yen, and Mexican peso/yen, as these will likely respond very sharply to increased protectionism.
Despite Speedbumps, Eurozone Expansion Continues
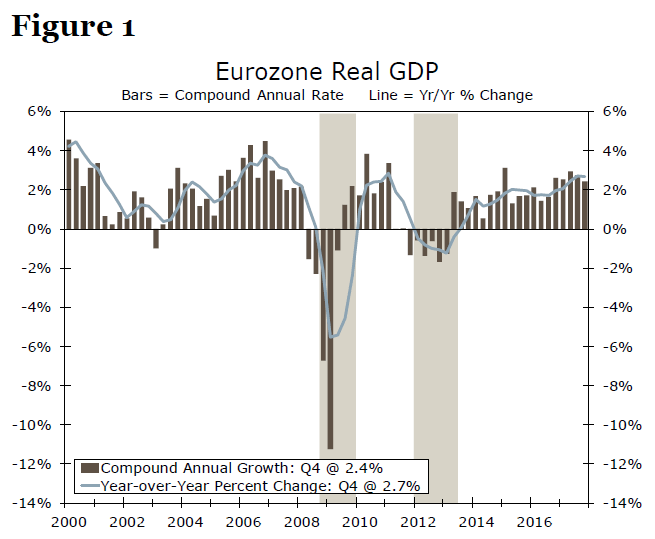
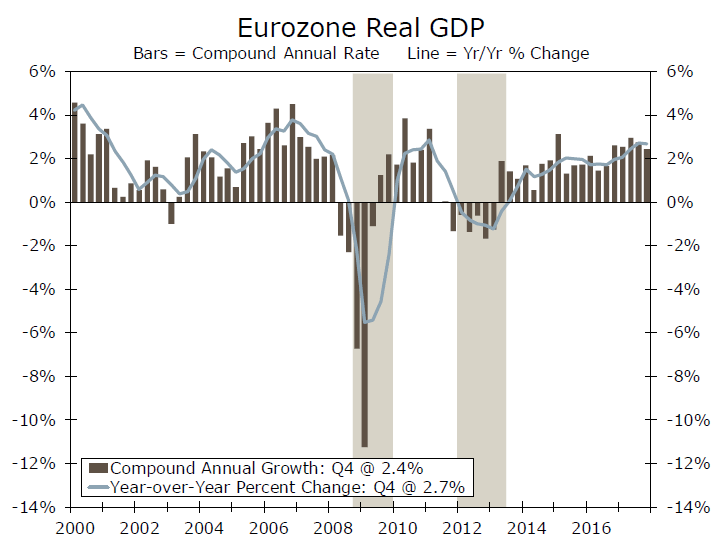
Real GDP in the Eurozone grew 2.5 percent in 2017, the strongest annual growth rate since 2007. There are some signs that the economic activity in the euro area has decelerated a bit thus far in 2018, but we look for the expansion to generally remain intact. The ECB also apparently has confidence in the economic outlook. At its policy meeting this week the Governing Council dropped a reference to expand its QE program again, if necessary. Although we look the Council to "taper" its QE program further later this year, benign inflation means that the ECB is probably in no hurry to actually tighten policy.
Data released this week confirmed that real GDP in the Eurozone grew at an annualized rate of 2.4 percent on a sequential basis in Q4-2017 (Figure 1). The new information in the data release - preliminary data printed at the end of January - was the breakdown of the GDP data into its underlying demand components.
The good news is that all domestic spending components (i.e., consumer spending, investment spending and government spending) continued to expand in Q4. The bad news is that sequential growth in domestic demand was sluggish, rising only 1.5 percent on an annualized basis. Strength in exports relative to imports - the former rose nearly 8 percent while the latter grew only 4.4 percent - boosted the overall rate of real GDP growth in the fourth quarter.
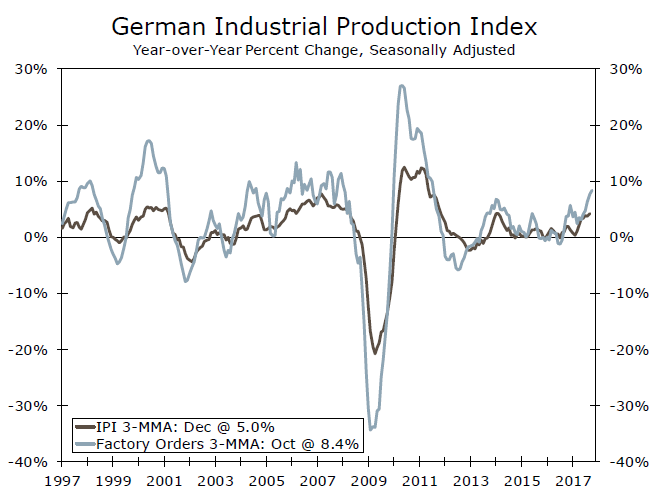
The data from January that are now starting to trickle in suggest that economic activity may be decelerating a bit in early 2018. For example, retail sales in the overall euro area edged down 0.1 percent in January, which follows the 1.0 percent decline that was registered in December. Factory orders in Germany tumbled 3.9 percent in January, completely reversing December's 3.0 percent gain. Industrial production (IP) in Germany declined 0.1 percent in January, while IP in France fell 2.0 percent. That said, the year-over-year growth rates in factory orders and IP in Germany remained robust in January (Figure 2).
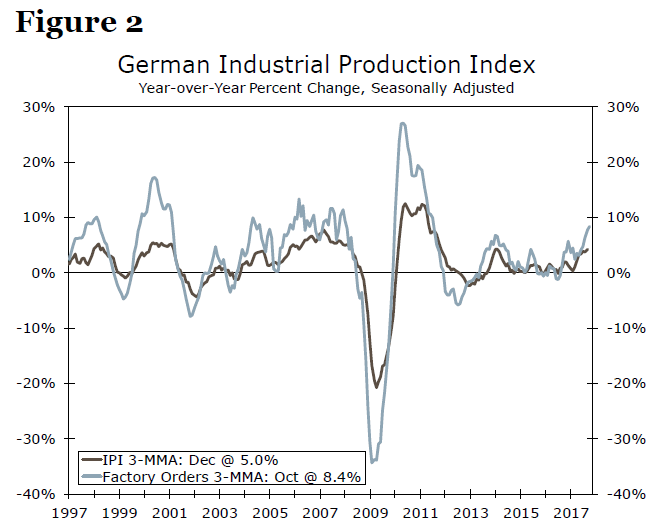
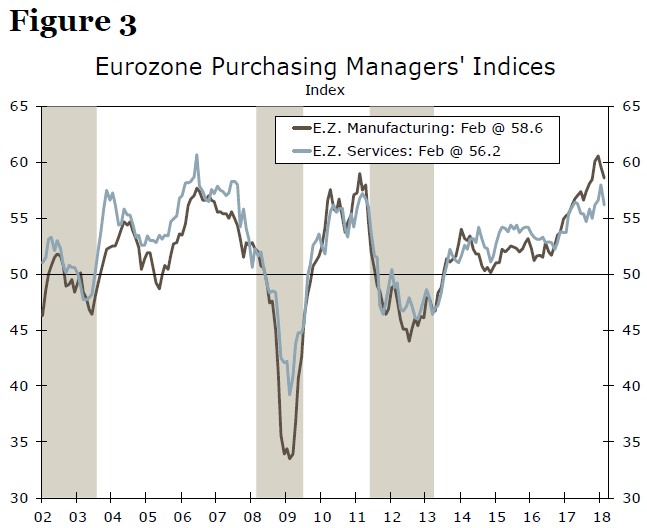
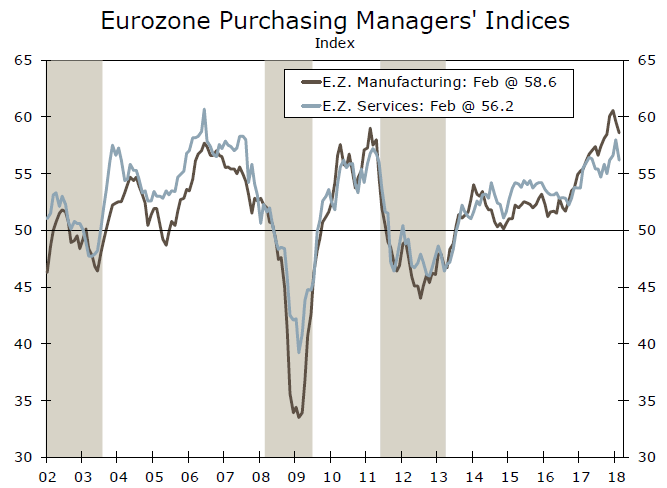
Does this mean that the expansion in the euro area is stalling? Probably not. For starters, sequential growth rates can be volatile. As the year-over-year strength in German factory orders and IP show, underlying growth momentum appears to be solid at present. In addition, the manufacturing and service sector PMIs remained at high levels through February, although both indices have edged a bit lower in recent months (Figure 3). Moreover, macroeconomic policy in the Eurozone is still accommodative at least for now, and bank credit is accelerating. We look for some deceleration in Eurozone real GDP this year, but we expect that the expansion will generally remain intact.
The European Central Bank (ECB) is showing increased confidence in the economic outlook. Until this week, the Governing Council had been saying that it could increase the size or duration of its quantitative easing (QE) program, if necessary. At its policy meeting on March 8 the Council dropped this reference to increasing its QE program. In our view, the ECB is signaling that it intends to "taper" its QE program further later this year.
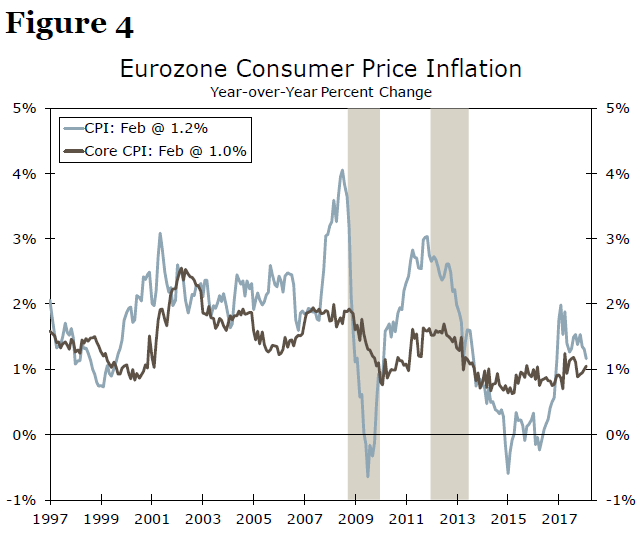
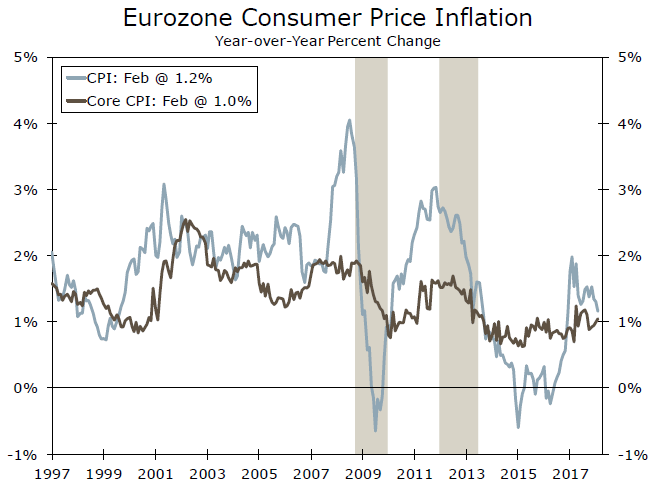
That said, the Governing Council appears to be in no hurry to tighten policy. ("Tapering" just dials back further accommodation.) The policy statement this week noted that "measures of underlying inflation remain subdued and have yet to show convincing signs of a sustained upward trend" (Figure 4). Indeed, we continue to believe that the Council will refrain from hiking rates until well into 2019.
Weekly Economic and Financial Commentary: February Hiring Heats Up, While Wages Cool Down
U.S. Review
February Hiring Heats Up, While Wages Cool Down
- Businesses added 313,000 new jobs in February and the unemployment rate was unchanged at 4.1 percent. Average hourly earnings growth slowed to 0.1 percent, but the trend remains upward.
- The ISM non-manufacturing index edged down in February, but remained well within expansion territory at 59.5.
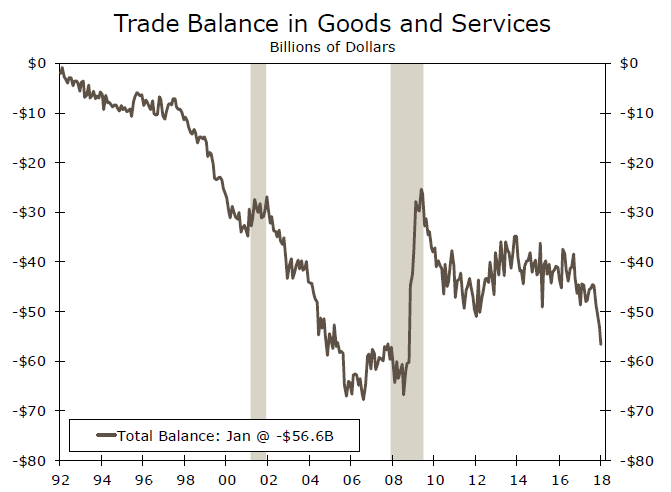
- In January, the trade deficit widened by $2.7 billion to reach the largest gap since October 2008. Lower exports of goods and services drove the increase, as imports were more or less flat over the month.
February Hiring Heats Up, While Wages Cool Down
Employment growth strengthened in February with businesses adding 313,000 new jobs. That pushed the three-month average up to 242,000 after job gains in December and January were also revised higher by a net of 54,000 jobs. Strength was widespread across industries, including gains of 50,000 in retail, 28,000 in financial services and 61,000 in construction, which likely benefited from a return to less severe winter weather.
Nevertheless, the unemployment rate was unchanged at 4.1 percent amid the largest monthly increase in the labor force since 2003. The labor force participation rate rose 0.3 points to 63.0, which puts it back at the top end of the past two year's range.
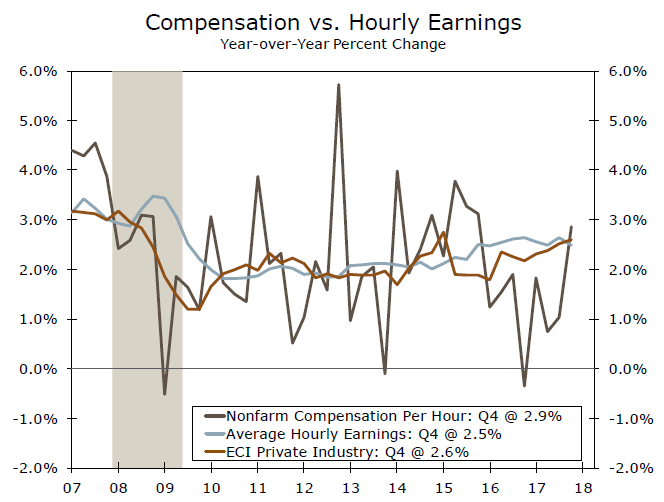
Average hourly earnings were up 0.1 percent (0.149 percent before rounding), barely missing expectations for a 0.2 percent increase. February average hourly earnings were up 2.6 percent from a year ago compared to 2.5 percent in 2017.
Other data released this week point to labor compensation trending higher. The updated look at fourth quarter productivity and costs showed hourly compensation increasing at a 2.4 percent annualized pace in the fourth quarter compared to an earlier estimate of 1.8 percent. That puts compensation per hour up 2.9 percent over the past year and makes it look more consistent with the increase in average hourly earnings over the same period.
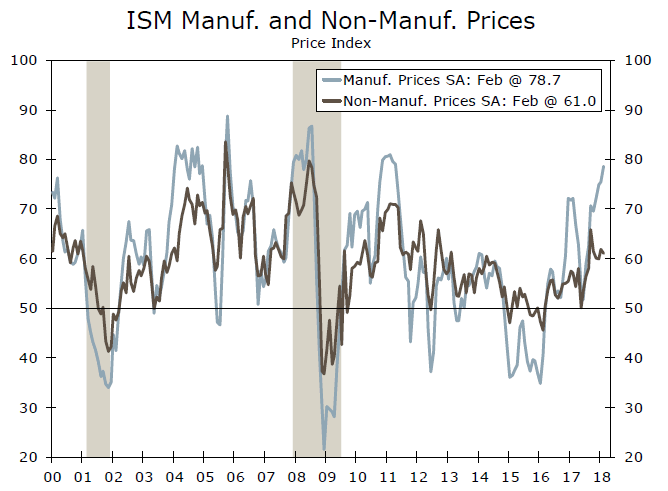
Moving beyond the labor market, the ISM non-manufacturing index suggests that the economy continues to expand at a solid clip. The index edged down 0.4 points to a still-strong 59.5 after setting a cycle high in January. Current activity edged up and a 12-year high in new orders suggest near-term momentum remains positive.
Higher input costs may be becoming more of a concern for businesses, however. The prices paid component of the ISM nonmanufacturing survey ticked down almost a point but, at 61, still indicates input costs rising at nearly the fastest pace in a number of years. Cost concerns were more ubiquitous in the comments section. Respondents ranging from construction and mining to health care and hospitality specifically mentioned higher prices. Although more impactful for the manufacturing sector, where input prices are rising more dramatically, recent tariff plans could intensify cost pressures. We discuss tariffs' impact on price inflation further on page 7 in our Topic of the Week.
The proposed tariffs have been fueled in part by the Trump administration's concerns over the trade deficit. The most recent monthly trade print is unlikely to allay their concerns. In January, the trade deficit widened by $2.7 billion to reach the largest gap since October 2008. Lower exports of goods and services drove the increase as imports were more or less flat over the month. The drop in exports was driven by some of the more volatile categories like aircraft and petroleum products. We expect exports to recover in the coming months due to solid growth in the rest of the world and a weaker dollar. However, imports should also rise amid strong domestic demand, keeping trade as a drag on real GDP growth over the next few quarters.
U.S. Outlook
CPI • Tuesday
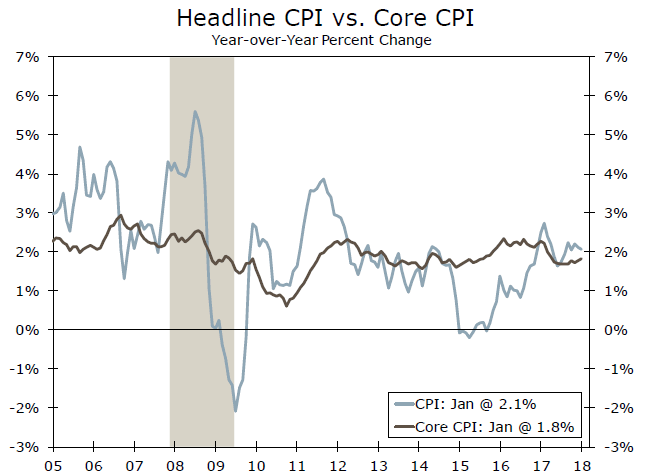
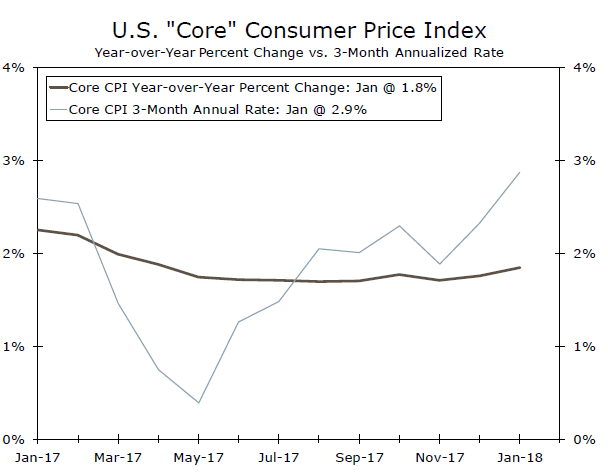
The recent pickup in inflation pressure was underscored by a largerthan- expected 0.5 percent gain in the CPI during January. Headline prices have increased 2.1 percent over the year, as higher energy prices provided a lift both on the month and on the year.
Core inflation gains were notable in January, notching a 0.3 percent rise during the month on higher prices for goods, particularly used vehicles and apparel, and services prices which were boosted by medical and insurance costs. Core CPI year-over-year growth held steady at 1.8 percent in January, but its 2.9 percent three-month annualized rate suggests the trend is strengthening more recently.
The Fed will be encouraged that the inflation readings have firmed as expected, and is likely to proceed with plans to tighten monetary policy.
Previous: 0.5% Wells Fargo: 0.1% Consensus: 0.2% (Month-over-Month)
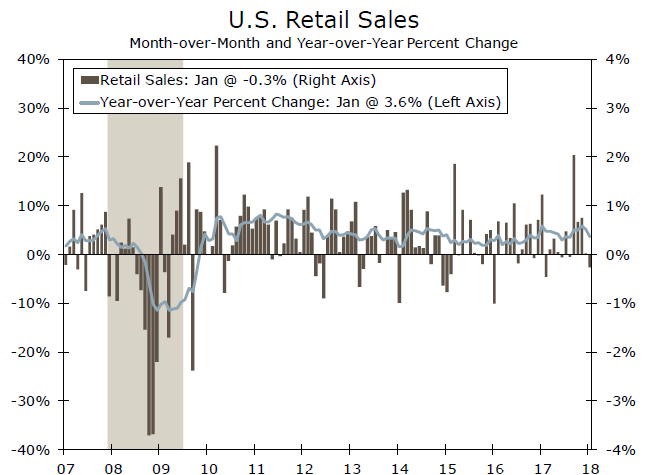
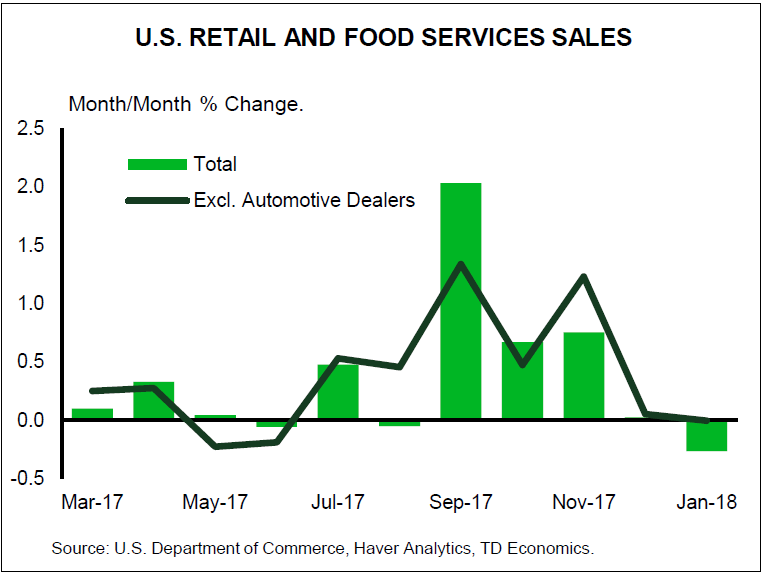
Retail Sales • Wednesday
January's 0.3 percent decline in headline retail sales was a surprise, and downward revisions to past months' control group sales made it more disappointing. Even with higher gasoline prices, sales ex-auto were down 0.2 percent in January. Motor vehicles sales posted the largest decline in January, but there were also broad based monthto- month losses in other categories. We expect seasonal adjustment issues were more to blame than an actual slowing in consumer purchases from December to January. Compared to January 2017, nominal retail sales were up solidly, with nonstore retailers and gasoline stations posting the largest sales growth over the year.
February's showing should be stronger, and it will be interesting to see what impact, if any, the new tax withholding schedules that took effect in February had for retailers. We will also be watching for the impact that rising inflation may have on spending in coming months.
Previous: -0.3% Wells Fargo: 0.3% Consensus: 0.3% (Month-over-Month)
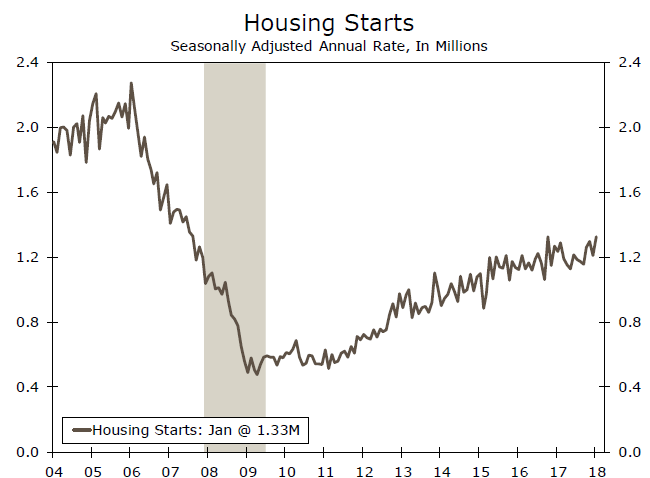
Housing Starts • Friday
Homebuilding got off to a solid start this year, as housing starts rose 9.7 percent to a 1.33-million unit pace in January. These data can be volatile in winter months, but the January ramp-up is still a reassuring sign that the stage is set for a strong spring season for the housing market.
Multifamily starts were particularly strong, rising 23.7 percent in January. Single-family starts rose 3.7 percent. The Northeast saw the largest percentage gain even with severe weather early in the month, though weather likely held back building in the Midwest. The South and West are seeing solid rises in both multifamily and single-family building, thanks to continued population and job gains. Overall momentum should continue strengthening as the year progresses, though labor shortages and higher materials costs could exert some downward pressure, particularly in the West where building is already expensive.
Previous: 1,326K Wells Fargo: 1,283K Consensus: 1,291K
Global Review
Despite Speedbumps, Eurozone Expansion Continues
- Real GDP in the Eurozone grew 2.5 percent in 2017, the strongest annual growth rate since 2007. There are some signs that economic activity in the euro area has decelerated a bit thus far in 2018, but we look for the expansion to generally remain intact.
- The ECB apparently has confidence in the economic outlook. At its policy meeting this week, the Governing Council dropped a reference to expand its QE program again, if necessary. Although we look for the Council to "taper" its QE program further later this year, benign inflation means that the ECB is probably in no hurry to actually tighten policy.
Despite Speedbumps, Eurozone Expansion Continues
Data released this week confirmed that real GDP in the Eurozone grew at an annualized rate of 2.4 percent on a sequential basis in Q4-2017 (see graph on front page). The new information in the data release—preliminary data printed at the end of January—was the breakdown of the GDP data into its underlying demand components.
The good news is that all domestic spending components (i.e., consumer spending, investment spending and government spending) continued to expand in Q4. The bad news is that sequential growth in domestic demand was sluggish, rising only 1.5 percent on an annualized basis. Strength in exports relative to imports—the former rose nearly 8 percent while the latter grew only 4.4 percent—boosted the overall rate of real GDP growth in the fourth quarter.
The data from January that are now starting to trickle in suggest that economic activity may be decelerating a bit in early 2018. For example, retail sales in the overall euro area edged down 0.1 percent in January, which follows the 1.0 percent decline that was registered in December. Factory orders in Germany tumbled 3.9 percent in January, completely reversing December's 3.0 percent gain. Industrial production (IP) in Germany declined 0.1 percent in January, while IP in France fell 2.0 percent. That said, the year-over-year growth rates in factory orders and IP in Germany remained robust in January (top chart).
Does this mean that the expansion in the euro area is stalling? Probably not. For starters, sequential growth rates can be volatile. As the year-over-year strength in German factory orders and IP show, underlying growth momentum appears to be solid at present. In addition, the manufacturing and service sector PMIs remained at high levels through February, although both indices have edged a bit lower in recent months (middle chart). Moreover, macroeconomic policy in the Eurozone is still accommodative at least for now, and bank credit is accelerating.
Real GDP in the Eurozone grew 2.5 percent in 2017, which was the strongest annual growth rate since 2007. We look for some deceleration this year, but we expect that the expansion in the Eurozone will generally remain intact.
The European Central Bank (ECB) is showing increased confidence in the economic outlook. Until this week, the Governing Council had been saying that it could increase the size or duration of its quantitative easing (QE) program, if necessary. At its policy meeting on March 8 the Council dropped this reference to increasing its QE program. In our view, the ECB is signaling that it intends to "taper" its QE program further later this year.
That said, the Governing Council appears to be in no hurry to tighten policy. ("Tapering" just dials back further accommodation.) The policy statement this week noted that "measures of underlying inflation remain subdued and have yet to show convincing signs of a sustained upward trend" (bottom chart). Indeed, we continue to believe that the Council will refrain from hiking rates until well into 2019.
Global Outlook
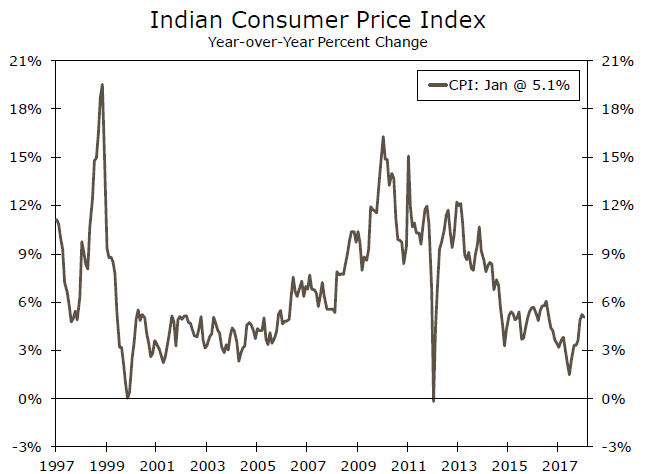
India Consumer Price Index • Monday
A perfect storm of demonetization, rupee appreciation, falling food prices and slowing economic growth pushed Indian inflation below 2 percent by mid-2017. Sluggish growth and inflation led the Reserve Bank of India (RBI) to cut its repo rate 200 bps since 2015. However, inflation has since moved closer to the RBI's 4 percent target (with a +/- target band of 2 percentage points). Food prices account for nearly half the weight of the Indian CPI, and a turnaround in food price growth has propelled the index higher. The food and beverage component of the Indian CPI was up 4.6 percent in January, a marked pickup from 1.2 percent deflation as recently as last June.
The inflation pressures have extended beyond food, as both fuel and shelter prices have accelerated since last summer. The RBI is likely to proceed with caution as disruptions from structural reforms echo through the economy, but a sustained acceleration in prices in the coming months could force the RBI's hand.
Previous: 5.07% Consensus: 4.74% (Year-over-Year)
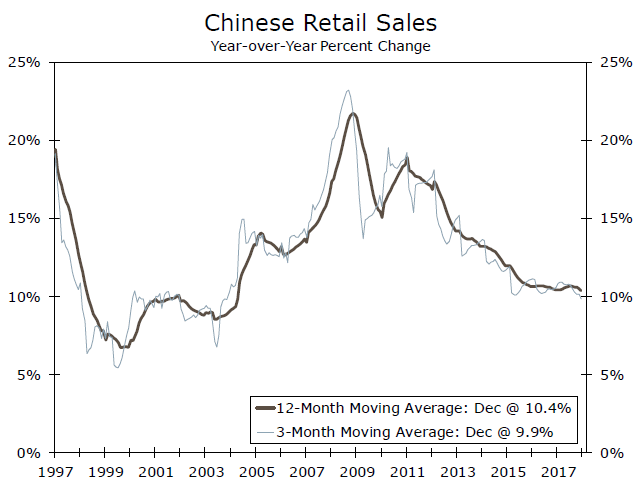
China Retail Sales • Tuesday
As China's economy has developed, policymakers have strived to rebalance economic growth away from its heavy reliance on investment spending and towards a more consumption-oriented model. To that end, retail sales growth held up fairly well in China last year. Retail sales grew 10.2 percent in 2017 compared to 10.4 percent in 2016. A challenge to sustaining this growth in future years will be unfavorable demographics—the working-age population has already peaked and is expected to decline by nearly 2 percent between 2015 and 2025. Chinese industrial production data also print next Wednesday, with markets eyeing whether Chinese manufacturers can sustain the momentum achieved in 2017.
Because of the Chinese New Year, next week's retail sales/industrial production data will encompass both January and February, adding a bit more weight than usual to these typically monthly prints.
Previous: 10.2% (Year-to-Date) Consensus: 10.0% (Year-to-Date)
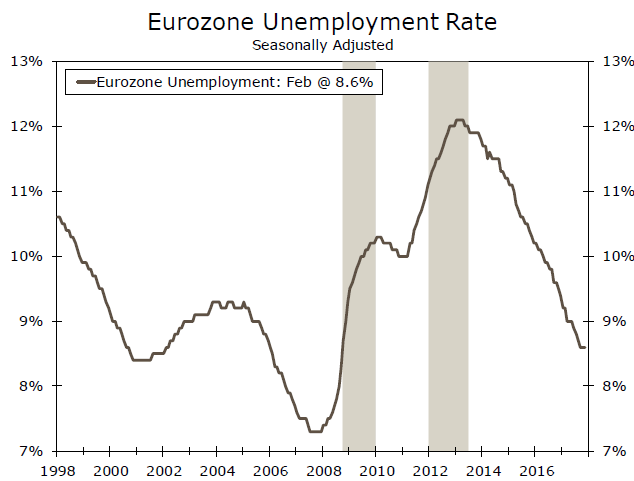
Eurozone Employment• Wednesday
Data on employment in the Eurozone in Q4-2017 will be released next Wednesday. Employment growth was a solid 1.7 percent year over year in Q3, helping to bring the unemployment rate down to post-Great Recession lows. Spain, Portugal, Italy and Sweden outpaced the Eurozone's quarterly average employment growth, while Greece and France were among the laggards. However, the quarterly weakness in Greece came on the heels of two strong quarters: the year-over-year employment growth was 2.0 percent in Q3.
Continued strength in employment growth across Europe would help European Central Bank policymakers reaffirm that it should end its bond-buying program by the end of this year. Our forecast looks for real GDP growth in the Eurozone to exceed long-term potential growth in the next two years, which should help drive the unemployment rate in the euro area even lower.
Previous: 0.4% (Quarter-over-Quarter)
Point of View
Interest Rate Watch
Things fall apart
Over the past six months, the framework for an economic outlook based upon the prior five year history of economic performance has fallen apart. As illustrated in the top graph, over the past three months, core CPI has risen 2.9 percent, intimating that the year-over-year core CPI and overall CPI will rise. In addition, we anticipate the PCE deflator will rise steadily to approach, then exceed the FOMC's 2 percent target (precisely 2.2 percent) in the second quarter of 2018 and remain at about that pace in Q3.
In addition, despite the rise in the funds rate and short-term interest rates in the U.S., the trade-weighted dollar has continued to decline contrary to many analyst expectations.
Finally, recent Treasury auctions have been disappointing while projected Treasury financing over the next few years has shifted upward.
Center Cannot Hold
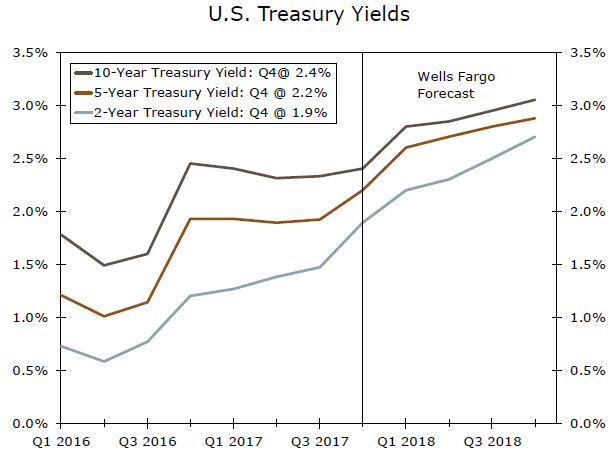
As a result, market interest rates and expectations of future interest rates (middle graph) have moved upward away from the pattern of the past five years and interest rates have broken from the range of the past five years.
Fundamentals are, well, fundamental. The four forces of higher growth expectations, higher inflation expectations, weaker dollar and increased future federal deficit estimates all support the case that interest rates will rise in the period ahead and will not return to the center of economic expectations of the past.
Ride the Lightening
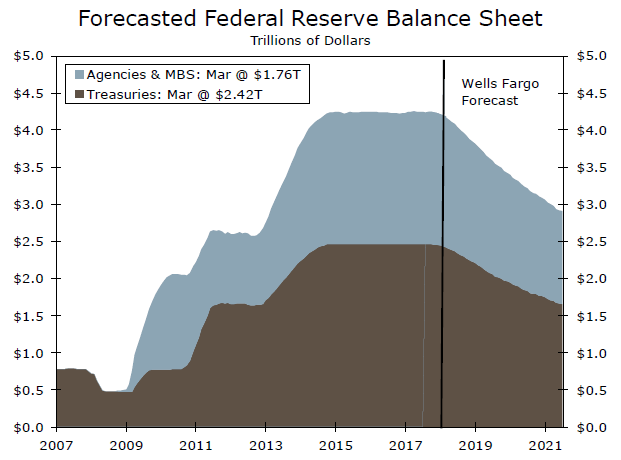
What to do? Our outlook remains for higher market interest rates ahead. We are particularly concerned about the conflict of the FOMC's intent to reduce their balance sheet (bottom graph) in the face of rising CBO estimates of federal financing needs. Once again, the center cannot hold at the current interest rate/dollar/growth combination.
We are not assured that plans of a simultaneous reduction of the balance sheet and increases in the funds rate are consistent with growth at a 2.5 percent plus pace.
Credit Market Insights
Beige Book Corroborates Hard Data
Amid several credit market reports released by the Federal Reserve this week, the March Beige Book detailed generally positive credit conditions across the 12 Federal Reserve districts. The majority of districts reported unchanged or modestly stronger loan demand to start the year, and noted an optimistic outlook for lending activity and credit quality in the next six months. Some districts also described a modest decline in delinquency rates across various loan types.
The soft data from the most recent Beige Book largely confirms the hard data seen in this week's consumer credit report. Consumer credit expanded a solid $13.9 billion in January, even with relatively flat revolving credit growth, which is largely comprised of credit card loans. Beige Book respondents noted that consumers likely paid down credit card bills following the holiday shopping season. Nonrevolving credit subsequently drove the expansion, up about 5 percent in January, year over year.
While overall consumer credit remains solid, increasing short-term interest rates on various loan types detailed by Beige Book respondents is a key area to watch over the coming months. Indeed, credit card interest rates have increased over the course of 2017, now at 13.2 percent in Q4. We forecast three hikes in the federal funds rate this year, likely pushing interest rates on consumer loans higher. However, in the near-term, solid loan quality and lower delinquency rates will likely support continued health in the credit market.
Topic of the Week
Limited Pass-Through of Tariffs to CPI
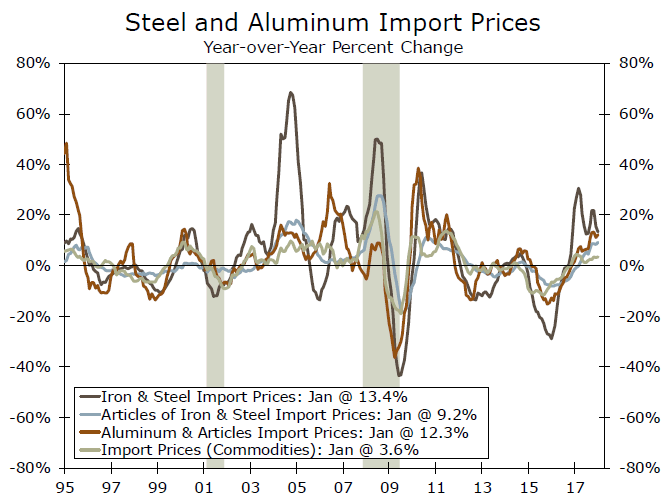
On March 8, President Trump imposed tariffs of 25 percent on steel imports and 10 percent on aluminum imports, with Canada and Mexico excluded for now and the possibility to extend exemptions to other countries. Prices for some products may rise as a result, but we suspect that the effect on overall consumer price index (CPI) inflation will be modest at best.
The combined share of steel and aluminum imports hovers below 4 percent of total U.S. merchandise imports, which limits the effect on overall prices (top chart). If steel and aluminum import prices increased by the full amount of the recently-proposed tariffs, this could add about 79 basis points to year-over-year import price inflation. Domestic producers could also raise prices as tariffs ease competitive pressure.
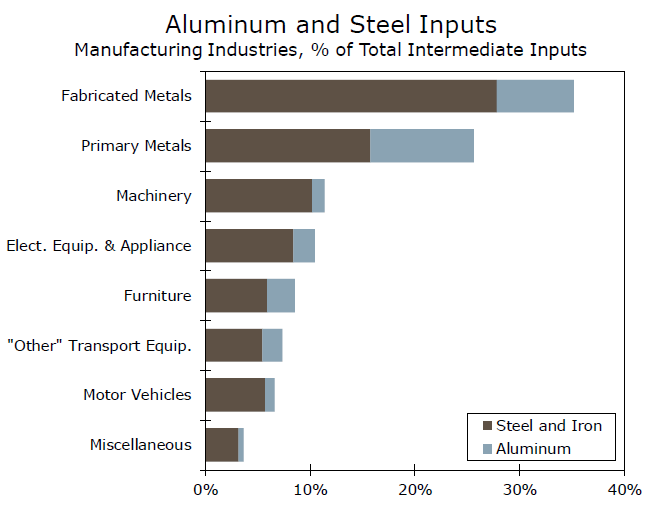
The ultimate pass-through to consumer price inflation, however, tends to be small after steel and aluminum get incorporated into finished products. Although there are positive correlations between producer prices for steel and aluminum and the CPI, the relationship is weaker than it is between import and producer prices. This is not surprising given that nearly two-thirds of CPI consists of services, where the largest input cost is labor.
That is not to say some industries will not see significantly higher costs. A look at the detailed input-output tables for the United States reveals which industries bear the greatest exposure to higher steel and aluminum costs (bottom chart). Still, the pass-through to consumers should be fairly small. Even in the industries that use steel and aluminum most intensively, those metals account for less than 40 percent of costs. In addition, firms may absorb some of the costs via tighter margins rather than adjusting prices fully.
We suspect that CPI inflation would rise only modestly as a result of the currently-proposed tariffs, assuming no trade war ensues. This would likely not be enough to change the Fed's path of rate hikes. For more, see "Steel Your Nerves: Effects of Tariffs on U.S. Inflation."
The Weekly Bottom Line: All Signs Point to Higher Inflation
U.S. Highlights
- President Trump announced tariffs on steel and aluminium imports to take effect in 15 days. The scope is narrower than initially announced. Mexico and Canada are exempt, and more allies may be excluded once the levies take effect.
- The American economy continues to hum along, with a very solid job report in February. The Fed's Beige Book also painted a relatively rosy picture, but also one where businesses are starting to pass higher costs onto customers.
- Inflationary pressures are building in the U.S., and import tariffs will increase the force. This presents a challenge for the Fed which will have to incorporate the uncertain impacts of fiscal stimulus, and now tariffs into its forecast.
Canadian Highlights
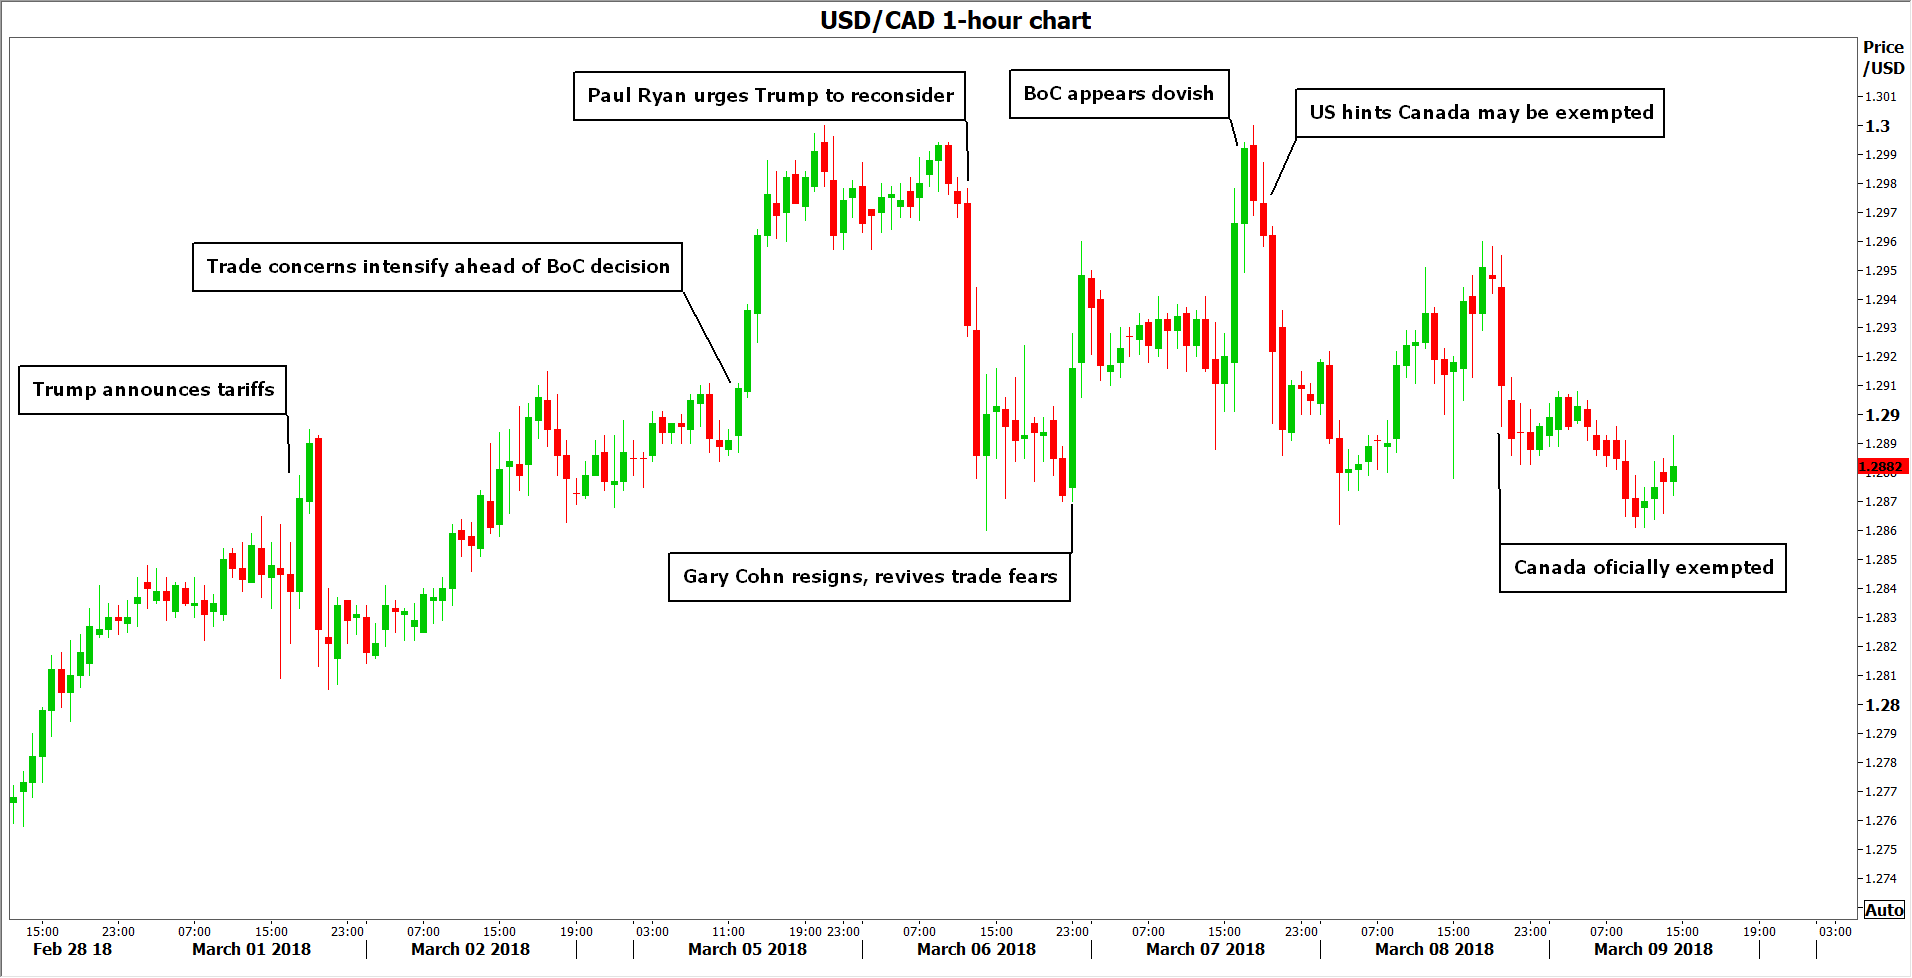
- Canada avoided (at least temporarily) the U.S. administration's steel and aluminum tariffs, providing a relief and potentially even a modest boost to the industries.
- The Bank of Canada left the overnight rate unchanged at 1.25% this week, but struck a dovish tone, citing trade uncertainty and the impact of recent housing regulations.
- Canada added 15.4k jobs in February, bringing the unemployment rate to 5.8%. Wage growth ticked down slightly, but remained buoyant at 3.1% year-on-year (from 3.3% in January).
U.S. - All Signs Point to Higher Inflation
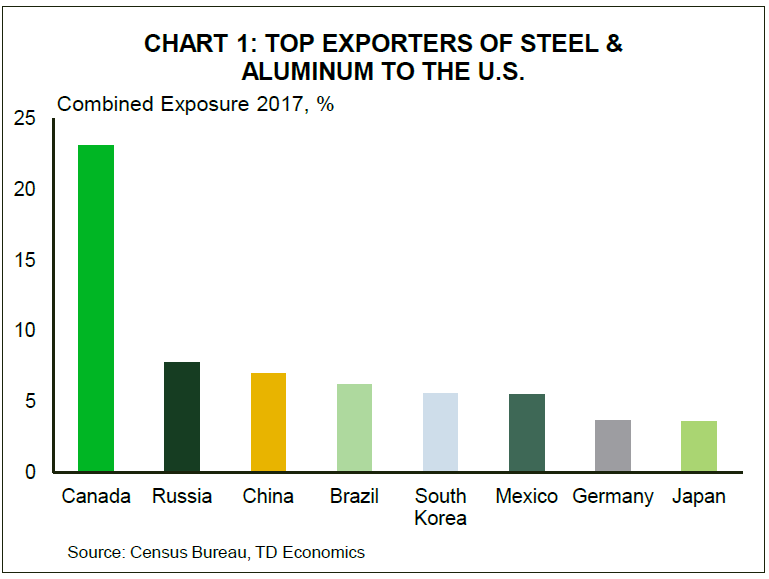
Politics overshadowed economics this week as markets awaited Trump's announcement on steel and aluminum tariffs. When it came on Thursday afternoon the scope was narrower than first thought. Canada and Mexico are exempt from the tariffs as long as negotiations on the North American Free Trade Agreement continue, and other allies may ultimately be exempt once the tariffs are put in place in 15 days. Together Canada and Mexico represent a quarter of American steel imports and 43 percent of aluminum. America's neighbors may now benefit from the plan as they take market share from other countries slapped with tariffs.
However, trading partners are expected to retaliate, levying tariffs on U.S. exports. Economic studies have shown that the overall costs to the economy from these trade battles outweigh the job gains in the protected sector. Our own estimates for the steel and aluminum tariffs specifically suggest the overall growth impacts in the large U.S. economy would be fairly modest, but that they could raise inflation a couple of tenths of a percentage point.
The President didn't stop at steel and aluminum. He reiterated his goal to reverse the U.S. trade deficit, and that he may implement a reciprocal or "mirror tax" to help achieve this. He offered few details, but suggested the U.S. would slap the same level of duties on trading partners that U.S. companies face in those countries. These actions will raise prices for many U.S. businesses that use the materials as inputs in manufacturing, and ultimately raise prices for consumers, adding to budding inflation pressures across the economy.
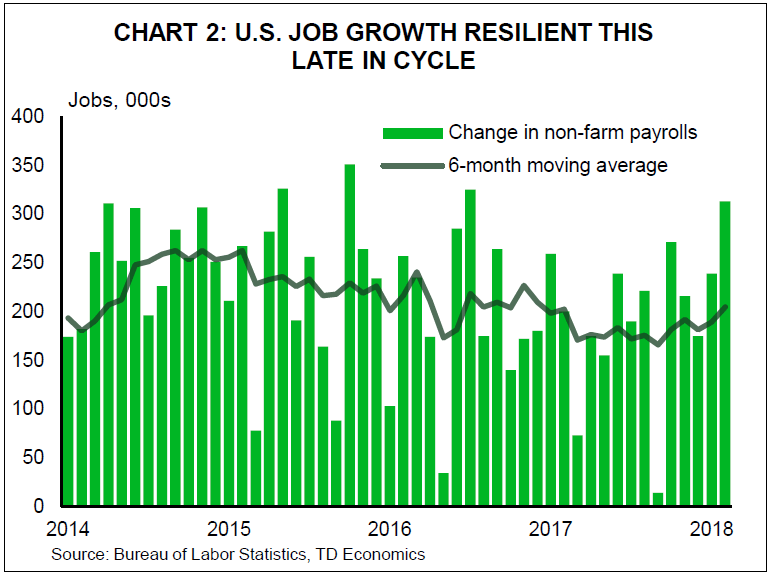
This week's economic data certainly doesn't suggest the U.S. needs economic protection. Payrolls grew by an impressive 313k jobs in February. The unemployment rate stayed at its 17-year low of 4.1%, where it has been since October. Hiring has accelerated in recent months, driven by the goods sector, which had stumbled somewhat in the wake of the oil price crash, but is now making up the lost ground. Wage growth cooled slightly, with average hourly earnings up 2.6% versus a year ago, down from 2.8% in January. However, when this volatile series is smoothed, wage gains have been steady at around 2.6% for about a year, and have been outpacing inflation for over three years.
The Fed's Beige Book also painted a picture of an economy that is humming along. Fed districts universally reported labor market tightness and heightened demand for qualified workers. Several districts reported increasing compensation as a result of the tax cuts that came into effect at the start of the year. The report also suggested that businesses are increasingly passing on increases in input prices. A variety of forces are expected to push inflation higher this year, the only question is how quickly.
The risks that inflation will accelerate faster than the Fed currently expects are mounting. The FOMC's next announcement is on March 21st, and a hike at the meeting is essentially a lock. We currently expect three 25-basis point moves in 2018, but the risks are skewed to more hikes rather than fewer.
Canada - Canada Avoids Trump's Tariffs (For Now)
The Bank of Canada surprised no one with its decision to leave interest rates unchanged this week. The policy announcement is usually the main event for economy watchers in Canada, but took second billing to an announcement south of the border on steel and aluminum tariffs. When that decision came down, it was good news for Canada, as it will be exempt from the 25% tariffs on steel and 10% tariffs on aluminum, pending a successful renegotiation of NAFTA.
Had the tariffs been imposed they would have resulted in a decline in steel and aluminum production and exerted a modest headwind on the Canadian economy – likely enough to shave a tenth of a percentage point off real GDP growth. The impact would have been concentrated in Ontario and Quebec, where most of the steel and aluminum is produced and downstream users of both products are located. However, with the exemption the two regions may benefit from decreased competition from parts of the world hit by tariffs. Still, with NAFTA negotiations showing little evidence of a speedy resolution, uncertainty will continue to hang over Canada's manufacturing sector.
Turning back to Ottawa, the Bank of Canada's statement was explicit in its recognition of risks on the external front, noting that net exports were a significant drag on economic growth in the fourth quarter of last year and that "trade policy developments are an important and growing source of uncertainty for the global and Canadian outlooks." Indeed, the statement overall struck a dovish tone, also referencing the impact of new housing regulations and the economy's sensitivity to rising rates.
As part of a new communication strategy, Deputy Governor Tim Lane provided more colour on the Bank's thinking. Lane struck a more positive tone, remarking on domestic strengths and encouraging trends. Still, the overall tone of communication suggests the Bank is in wait and see mode – looking for clarity on the trade front and on how the Canadian economy and heavily indebted households in particular are responding to the three rate hikes it has already enacted over the past year.
Beyond policy, the economic data out this week showed an economy that continues to make steady, if more staid, economic progress. The Canadian economy added 15.4k jobs in February, slightly under the consensus projection for 21k, but in a series as volatile as this one, basically a hit. The increase was enough to pull down the unemployment rate to 5.8% – regaining its pre-recession trough. The tight labor market has been supportive of wage growth, which edged down slightly to 3.1% year-on-year from a robust 3.3% in January.
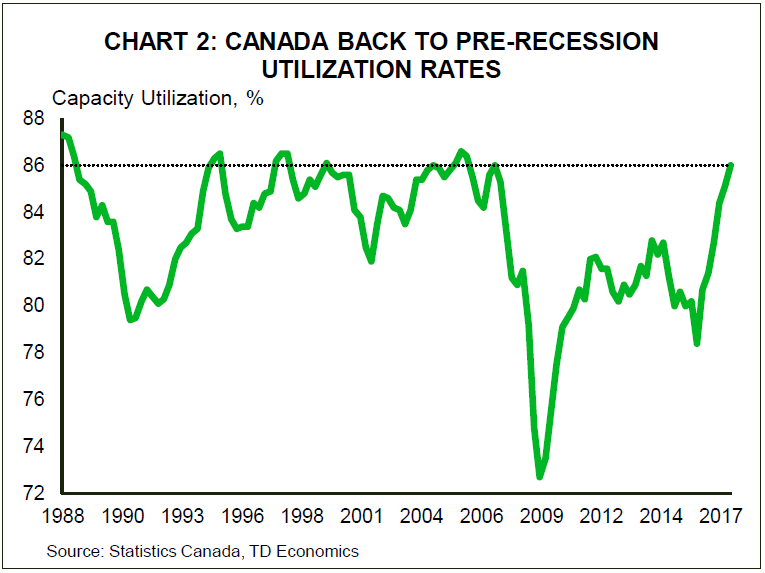
Evidence that the economy is running up against capacity constraints was also revealed in the capacity utilization data reported this week. Overall industrial capacity utilization hit its highest level in over a decade in the fourth quarter of 2017. The rise was broad-based across industries and came despite healthy growth in business investment in the same quarter. Within manufacturing, capacity utilization hit its highest level since 2000. High utilization should support ongoing investment, providing some offset to the trade uncertainty weighing on the outlook. 
U.S.: Upcoming Key Economic Releases
U.S. Consumer Price Index - February
Release Date: March 13, 2018
Previous Result: 0.5% m/m, 2.1% y/y
TD Forecast: 0.2% m/m, 2.2% y/y
Consensus: 0.2% m/m, 2.2% y/y
We expect headline CPI inflation to accelerate to 2.2% y/y in February, with prices up a seasonally adjusted 0.2% m/m. Energy prices should be a small net positive, led by higher gasoline prices. We also see scope for a stronger pickup in food prices, as presaged by higher import prices. Excluding food and energy, we expect core CPI to print a solid 0.2% m/m increase, moderating from the previous 0.3% print. With imported consumer price inflation still benign, we do not look for the strength in January to be repeated. We also expect some oneoffs from the previous month to correct, such as the apparel category (+1.7% m/m in January).
U.S. Retail Sales - February
Release Date: March 14, 2018
Previous Result: -0.3%, ex-auto 0.0%
TD Forecast: 0.2%, ex-auto 0.3%
Consensus: 0.3%, ex-auto 0.4%
We expect retail sales to rise 0.2% in February, with the control group up 0.3%. Gasoline station receipts and auto sales should have neutral contributions. One downside risk is the late start to the tax refund season, which pushed refunds into March. The modest gains would be consistent with real PCE tracking slightly below 2%.
Canada: Upcoming Key Economic Releases
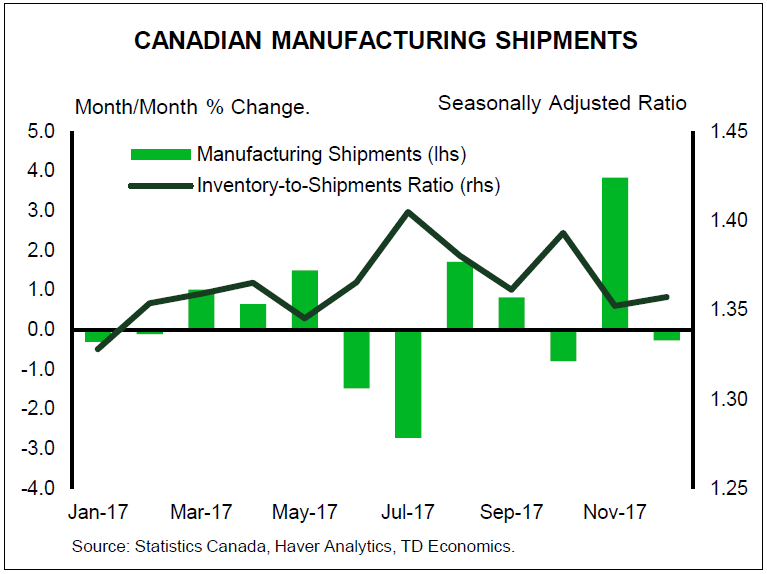
Canadian Manufacturing Sales - January
Release Date: March 16, 2018
Previous Result: -0.3% nm/m
TD Forecast: -1.0% m/m
Consensus: N/A
January is shaping up to be another slow month for Canadian manufacturers, with headline sales forecast to decline 1.0% m/m. Disruptions to auto production will once again play a part due to shutdowns at an Oshawa plant, which should drive a sharp decline in transportation equipment sales. Meanwhile, the broad decline in exports bodes poorly for factory output as a whole. Energy should provide an offsetting source of strength on higher prices for refined products though we see headwinds to forestry products after the US resumed collecting duties on softwood lumber. Volumes should come in below the headline print due to higher factory prices, driven largely by gasoline, which will come at the detriment to Q1 GDP tracking.
Dollar Mixed Ahead of Retail Sales, Inflation and North Korea Meeting
The US dollar ended up mixed against major pairs after the release of the U.S. non farm payrolls (NFP) report for February and news of a potential meet up between North Korea and American leaders. The NFP was a mixed bag with a monster 313,000 jobs gain but underperforming wage growth at 0.1 percent. US President Donald Trump tweeted about a meeting with Kim Jong Un being planned which capped a difficult week for US international relations after the steel and aluminum tariffs could be a non starter as a long list of nations are demanding exceptions.
- US worker wages missed despite massive jobs gains in February
- US inflation expected to slowdown
- US retail sales forecasted to bounce back
Dollar Mixed on Strong Jobs but Tame Wage Growth
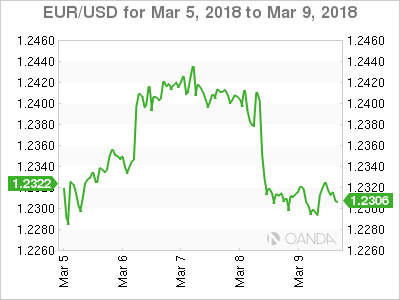 The EUR/USD lost 0.07 percent in the last five days. The single currency is trading at 1.2307 and its trading near where it opened on Monday. The EUR started the week appreciating versus the USD but it all took a U-turn on Thursday. The European Central Bank (ECB) kept rates and quantitive easing unchanged but did remove mention of adding more stimulus if the economy needed it. ECB President Mario Draghi was neutral with his comments as he praised rising European growth but also mentioned slow inflation and trade challenges ahead.
The pair stayed close to 1.23 after the NFP jobs report came out. The big gains in the number of jobs were more than offset by the low wage growth component. The lack of inflationary pressure will add ammunition to the doves within the Federal Open Market Committee (FOMC). The market still expected an interest rate hike on March 21, with 86 percent probably of a 25 basis points lift putting the range in 1.50–1.75 percent.
Next week will be more quiet with US inflation and retail sales to dictate the pace of the US dollar. Inflation anxiety has derailed stock market gains as rising costs of living would validate the Fed’s tightening policy and spell an even more rapid rise of interest rates. The consumer price index data will be published on Tuesday, March 13 at 8:30 am EDT. Retailers are hoping for a rebound on the last two months. Retail sales will be released by the Census Bureau on Wednesday, March 14 at 8:30 am EDT.
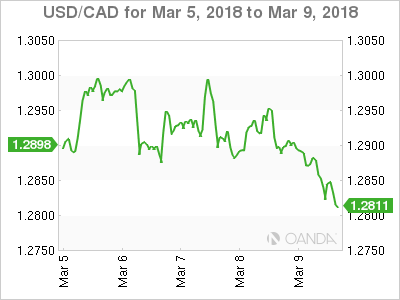 The USD/CAD lost 0.43 percent during the week. The currency pair is trading at 1.2829 after both Canada and the United States released employment reports for the month of February. The US added a massive 313,000 jobs last month, but investors were focused on the hourly earnings, which fell below expectations to 0.1 percent and the previous month’s data was also revised downward. Given the market anxiety with inflation this is a wrench in the plans of the U.S. Federal Reserve.
Canadian jobs came in below expectations with 15,400 positions instead of the forecast of 21,300 but they were enough to drive the unemployment rate lower to 5.8 percent. Concerns remain about the rise of part time jobs at the expense of full time positions. The loonie appreciated on a solid report, specially given last month’s drop of 88,000 jobs and the sell-off of the dollar that also put oil prices higher.
Bank of Canada (BoC) Governor Poloz will speak at Queen’s University on Tuesday, March 13 at 9:15 to deliver a very timely speech titled: “Today’s Labour Market and the Future of Work”. In the latest employment report it was clear the government was the biggest driver of employment with 50,300 jobs. It seems the job market like the rest of the Canadian economy is showing signs of the anticipated slowdown in the fourth quarter of 2017 with the BoC not in a rush to hike interest rates.
The CAD has had a horrible start to 2018 and is down 2.51 percent against the USD year to date as the uncertainty of the fate of NAFTA lingers with the 8th and final round to take place at the end of the month. The Canadian economy is slowing down, which in turn will make it less likely the Bank of Canada (BoC) keeps pace with the Fed’s rate hike path. With Canada being exempt from the steel and aluminum tariffs the threats from the Trump Administration are less credible, but that does not mean NAFTA is out of the woods yet as the White House can still push a unilateral move however unpopular it might be even within the Republican party.
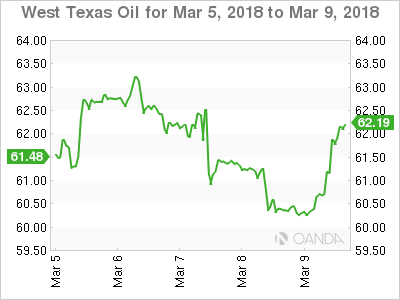 Energy prices bounced back on Friday and recouped most of the losses from earlier in the week. A 2 percent gain in the last day of the trading week took West Texas Intermediate to trade at $62.16. Oil prices started a weekly downward trend on Tuesday as inventories were coming out with confirmed buildups. The Energy Information Administration (EIA) weekly crude stocks report on Wednesday came in at 2.4 million additional barrels. The biggest factor keeping energy prices under pressure has been increase of supply concerns about US shale producers.
The EIA expected US crude production to reach 11.17 million barrels per day in the fourth quarter of 2018. This level of supply would put the US in the number one spot, overtaking Russia as the biggest producer. Russia and Saudi Arabia are part of the Organization of the Petroleum Exporting Countries (OPEC) crude output cut agreement along with other major producers. This has allowed US producers to ramp up production to take advantage of the stability in prices. Weather disruptions have impaired the ramp up in output, but analysts are tracking that potential surge in supply and see more downside for energy prices despite the best efforts of Russia and OPEC producers.
Market events to watch this week:
Tuesday, March 13
- 6:30am GBP Annual Budget Release
- 7:30 am USD CPI m/m
- 7:30 am USD Core CPI m/m
- 9:15am CAD BOC Gov Poloz Speaks
- 9:00pm CNY Industrial Production y/y
Wednesday, Mar 14
- 3:00am EUR ECB President Draghi Speaks
- 7:30am USD Core Retail Sales m/m
- 7:30am USD PPI m/m
- 7:30am USD Retail Sales m/m
- 9:30am USD Crude Oil Inventories
- 4:45pm NZD GDP q/q
Thursday, Mar 15
- 3:30am CHF Libor Rate
- 3:30am CHF SNB Monetary Policy Assessment
Friday, Mar 16
- 7:30am USD Building Permits
*All times EDT
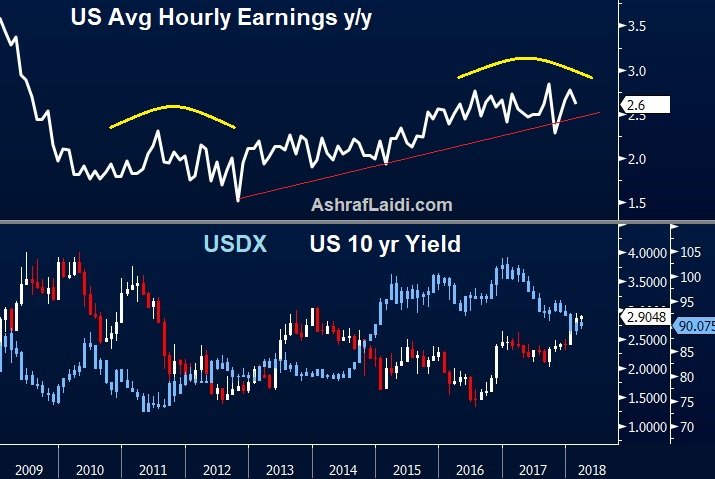
Jobs no FX Game-Changer
Today’s release of the US February jobs report may be exactly what stocks bulls wanted in the way of goldilocks economic growth. Steady tightening in labour markets without inflationary growth in pay growth. The 313,000 increase in non-farm payrolls was the highest since July 2016, the unemployment rate held at 4.1% for the fifth consecutive month, while average hourly earnings growth eased to 2.6% y/y from the market-shaking 2.9% --which was revised down to 2.8%.
No game-changer for the Fed
It may be too early to write about this month’s FOMC meeting, which carries a 100% chance of a 25-bp rate hike in the Fed Funds rate target. But the more important question is will the Fed’s dot plot shift members’ views in favour of four Fed hikes for the year from the current three hikes. Today’s earnings data suggests that will not be the case.
Recall that the 2.9% y/y rise seen in the January earnings was emerged with scepticism due to weather-induced decline in average weekly hours. The subsequent pullback to 2.6%, coupled with the fact that the Fed’s inflation target remains at 1.5% does not call for an upgrade in the pace of Fed tightening.
No game-changer for USD
Since FX markets run on expectations, nothing in today’s jobs report or recent US data provide traders to alter their outlook based on faster Fed tightening. Thursday’s ECB press conference highlighted how the central bank faces increasing difficulty at convincing the world that plenty of accommodation remains. In contrast, Fed hawks are at difficulty in justifying faster tightening at a time when the ascent in earnings may reflect a possible end-of cycle phenomenon – a lagging indicator in labour markets.
Today’s report is a fresh confirmation of the status quo (3 Fed hikes in 2018) instead of increasing the odds of a 4th rate hike. With core PCE steady at 1.5% and ascending bond yields looming large over an aggressive Treasury borrowing schedule, it best to not rock the boat. EUR/USD remains closer to $1.35 than it is to $1.15.