
Sample Category Title
Euro Extends Losses After Soft PMIs Release
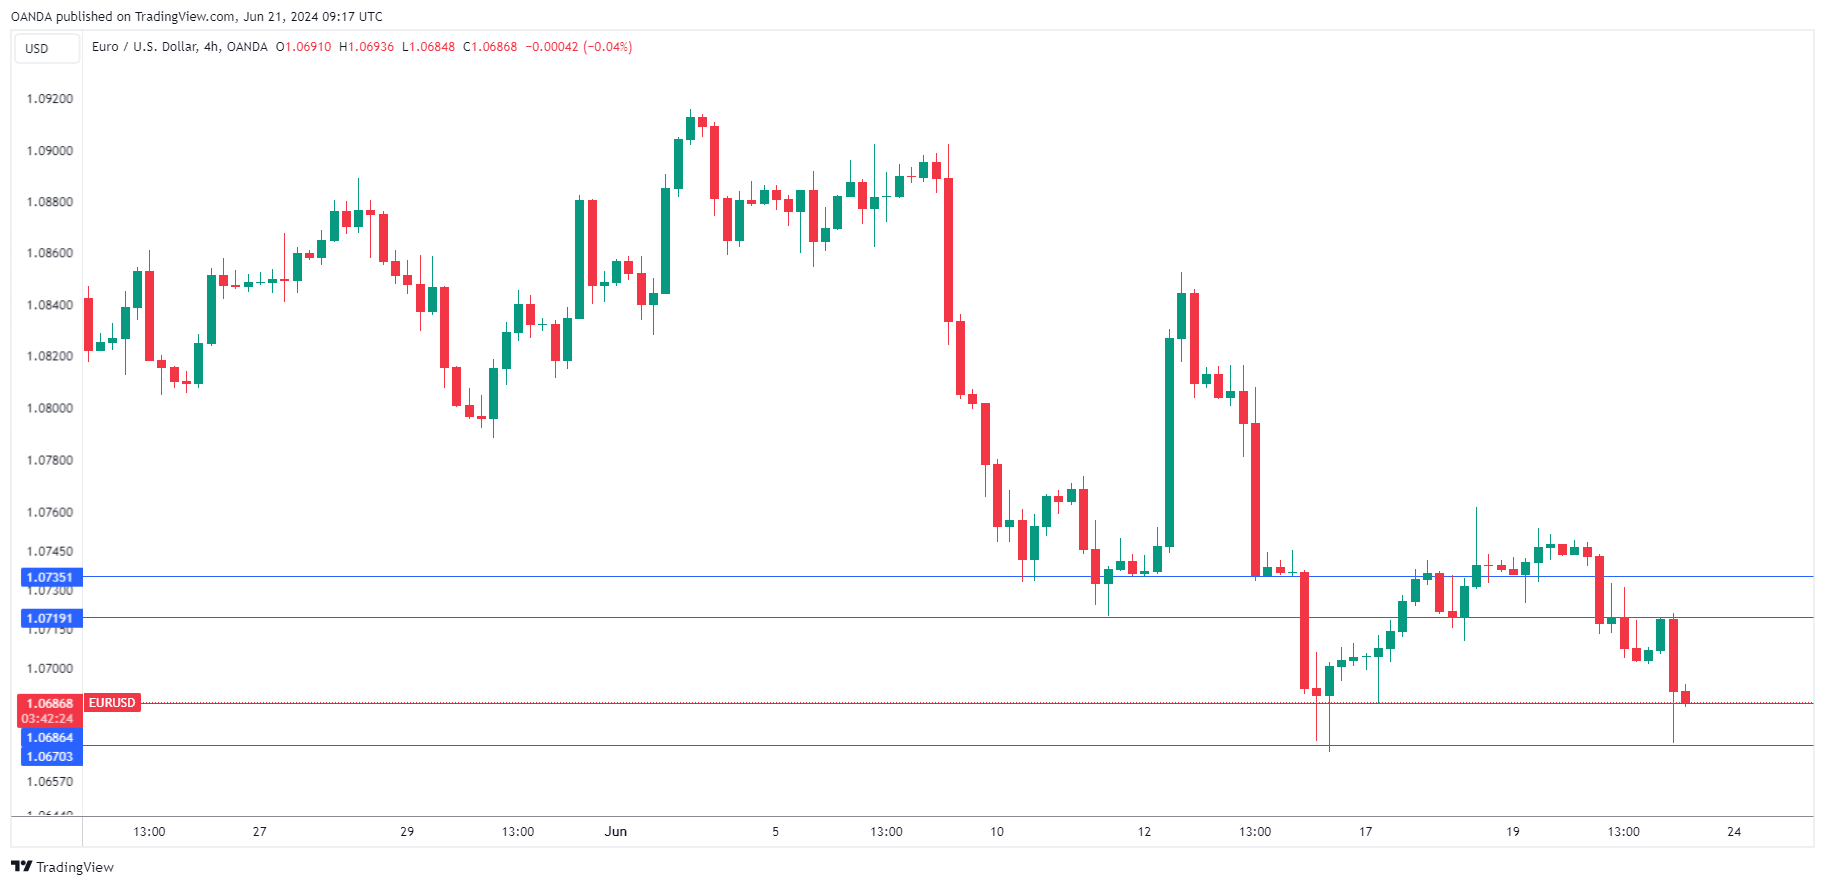
The euro has edged lower on Friday. EUR/USD is trading at 1.0687 in the European session, down 0.14% on the day.
Is the eurozone economy slowing down?
The week ended on a sour note in Europe as June PMIs declined in the eurozone. The Services PMI dropped to 52.6, down from 53.2 in May and below the market estimate of 53.5. The Manufacturing PMI eased to 45.6, down from 47.3 in May and shy of the market estimate of 47.9. The manufacturing sector remains in a prolonged depression and hasn’t recorded growth (a reading above 50.0) since June 2022. Germany and France, the two largest economies in the eurozone, also posted weaker services and manufacturing PMIs in June.
The weak PMI data could point to slow growth in the second quarter. Still, this is just one report and the European Central Bank will be looking at further data before deciding if another rate cut is appropriate. The ECB cut rates earlier this month, the first cut since it embarked on a rate-tightening cycle to curb inflation.
Inflation has proven to be stubborn as the ECB tries to bring it back down to the 2% target. The May CPI report was disappointing, as headline CPI rose in May from 2.4% to 2.6% and core inflation climbed to 2.9%, up from 2.7% in April. The ECB has shown that it is willing to lower rates even if inflation is above the 2% level but it is unlikely to cut again before inflation moves lower.
Another headache for the ECB and the euro is the uncertainly over the elections in France, which take place on June 30th and July 7th. Stock markets in France have already suffered a sell-off and that could be repeated if the extreme-right makes gains, as it did in the recent European Parliament elections.
.
EUR/USD Technical
- EUR/USD tested resistance at 1.0719 earlier. Above, there is resistance at 1.0735
- 1.0686 and 1.0670 are providing support
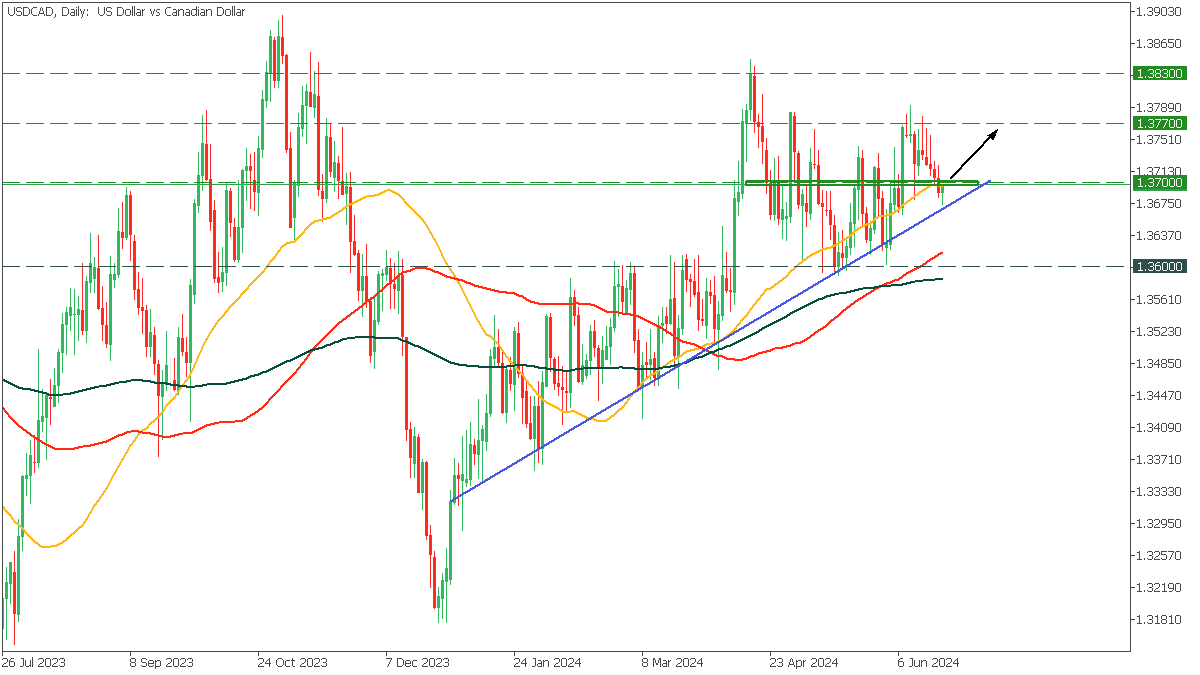
USDCAD: Rising Opportunity
In the Daily timeframe, USDCAD is in a long-term bullish trend, and the price has fallen to the trend line. Despite a minor correction, the price bounced off the trend line and is testing an important resistance area. Moving averages indicate the possibility of further growth.
- USDCAD may be considered for a buy on a rise above the resistance area at 1.3700 with a target of 1.3770;
- If the bulls push the price above 1.3770, the price may reach 1.3830;
Crypto Didn’t Dare to Grow
Market picture
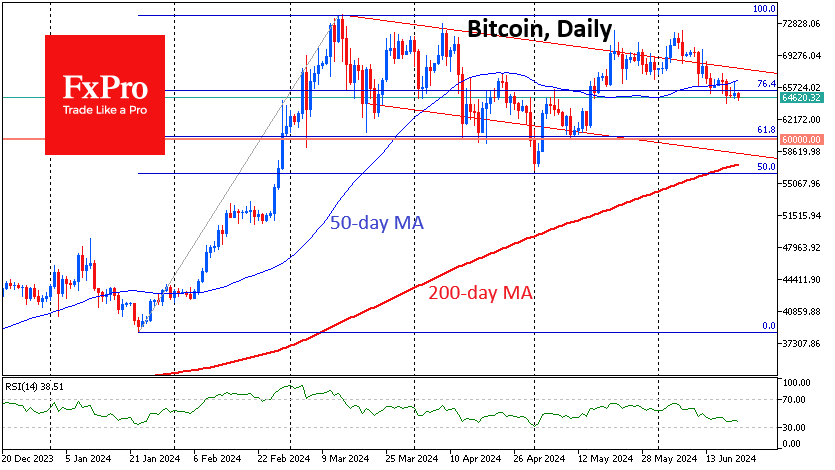
The crypto market failed to get on a growth path, with its capitalisation falling 1.5% to $2.35 trillion in the last 24 hours. Cryptocurrencies have had their wings clipped by the sell-off in equity markets, reflecting a downturn in risk appetite in global finance. Due to the link to traditional finance, the largest coins came under pressure. Bitcoin lost 1.3%, Ethereum lost 1.9% and BNB lost 2.9%. Meanwhile, TON added 1%, and TRON is up 0.6%.
Bitcoin was actively rising to $66.4K on Thursday, where it reversed just as rapidly to the downside. Local resistance was the 50-day moving average, another important signal of a shift from bullish to bearish sentiment in the cryptocurrency market in addition to the two-week downward trend.
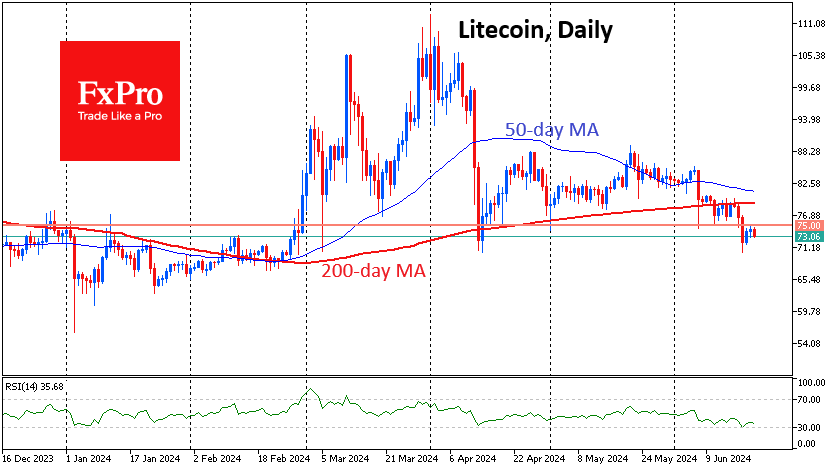
Litecoin has failed in its attempt to get back above $75 and has been trading around lows since early March. So far, the market has been ruthless on older altcoins, favouring new promising projects or heavyweights like Bitcoin and Ethereum benefiting from actual or potential ETF launches.
News background
CryptoQuant estimates that large bitcoin holders, including miners, have reduced positions through OTC platforms by $1.2bn in the past two weeks. Bitcoin miners’ reserves have fallen below 2021 levels. Net outflows from BTC-ETFs totalled $460 million in the same two weeks.
“If this nearly $1.7bn in sell-side BTC is not redeemed OTC, brokers may take bitcoins to the CEX, negatively impacting the market,” commented CryptoQuant CEO Ki Yoon Ju.
MicroStrategy acquired an additional 11,931 BTC for $786 million (~$65,883 per coin) using proceeds from bonds issued and excess cash. MicroStrategy said it sold $800 million worth of bonds. In total, the company now owns 226,331 BTC, acquired for approximately $8.33 billion.
According to QCP Capital, the options market is betting on Ethereum rising towards $4800. Bullish sentiment is supported by the conclusion of the SEC’s investigation into Ethereum 2.0, where the regulator did not recognise ETH sales as securities transactions.
The BNB Chain ecosystem activated the BEP 336 Haber hardfork, which reduced transaction costs for L2 solutions by 90%.
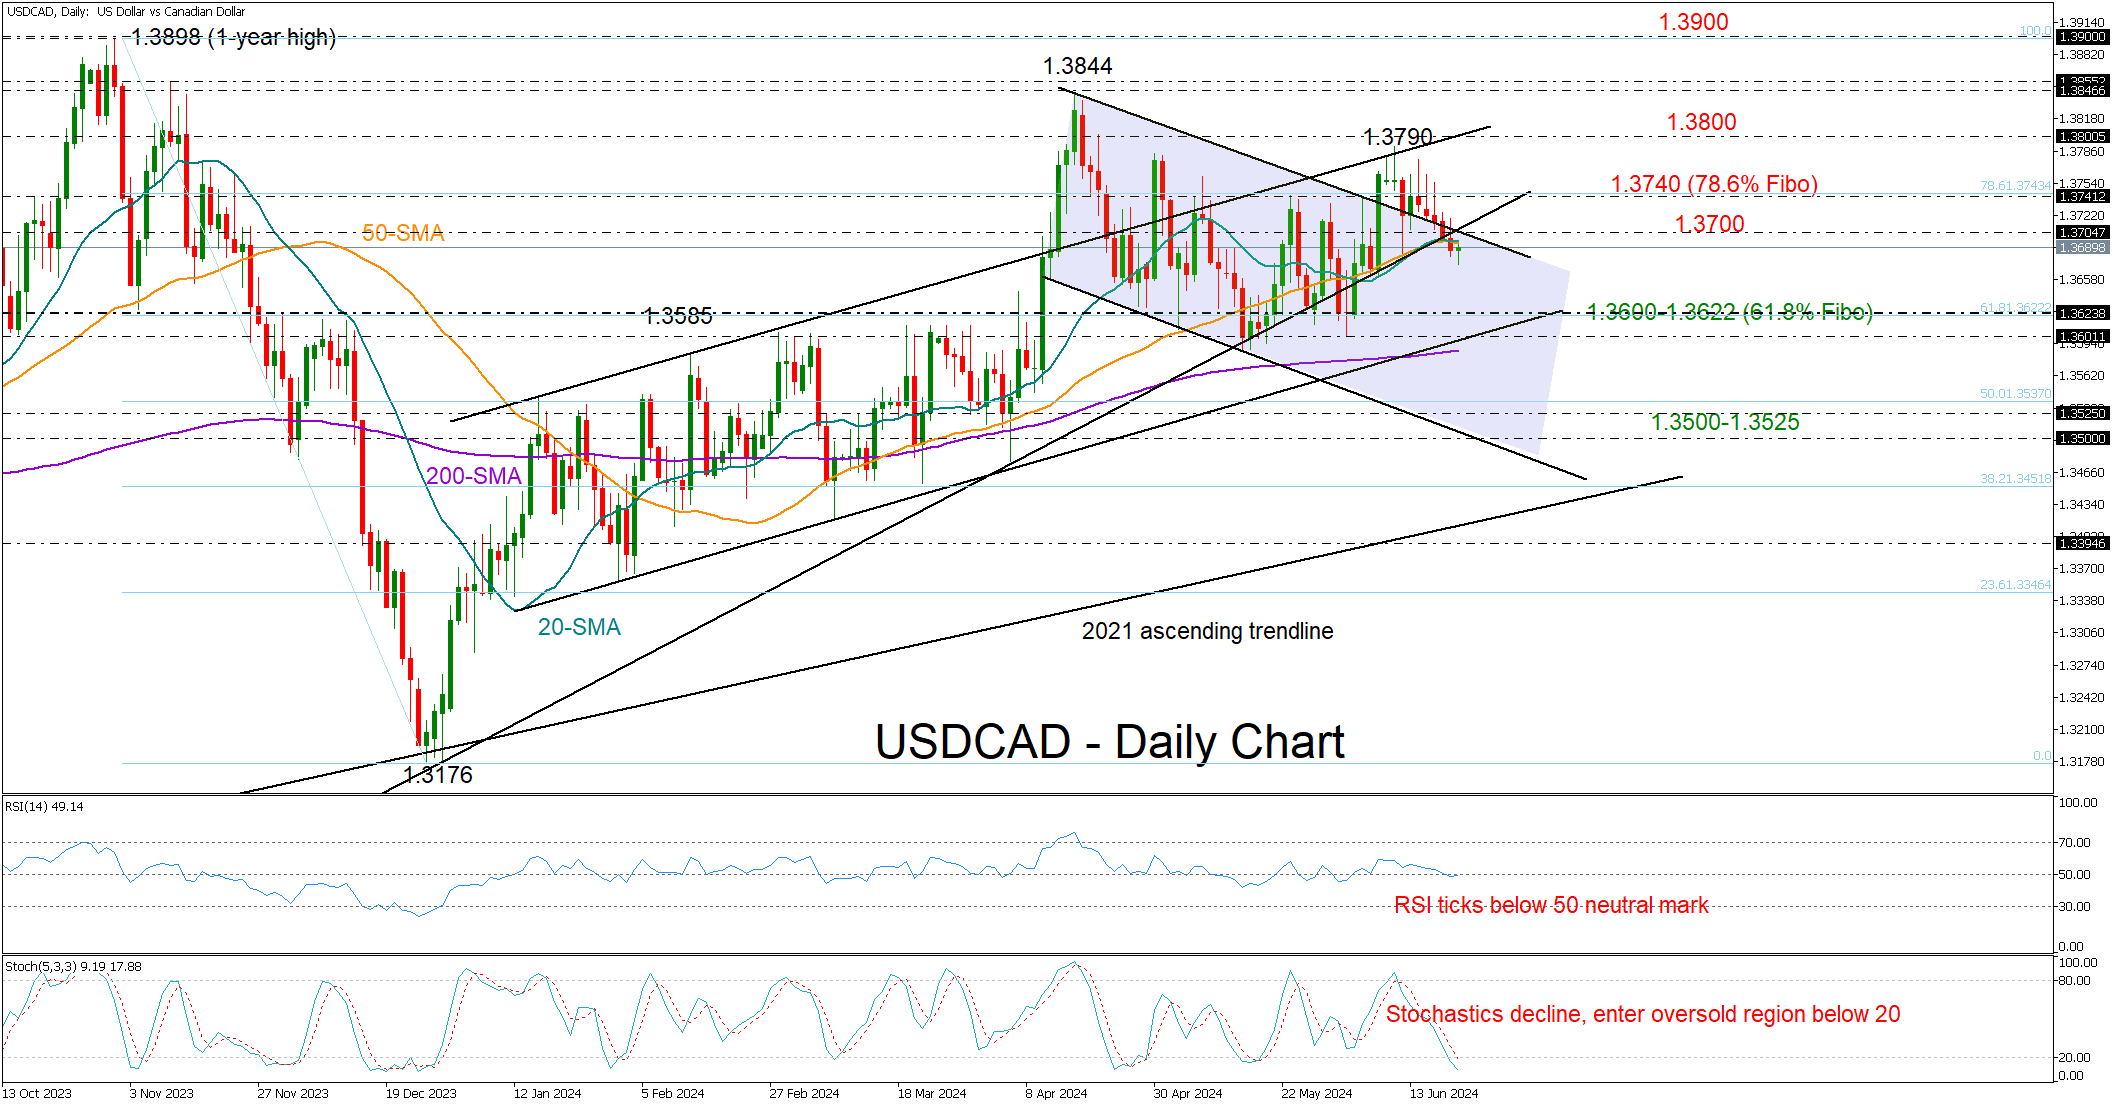
USDCAD Bears Could Remain in Control
- USDCAD eases below 1.3700; could attract new sellers in short-term
- Next support could emerge within 1.3600-1.3622 territory
- US S&P Global PMIs, Canadian retail sales on the agenda
USDCAD has been tiptoeing to the downside for five consecutive trading days, increasing speculation that some stability could soon occur.
The technical picture, however, suggests that the bears have more to accomplish. Thursday’s close below the 20- and 50-day simple moving averages (SMAs) and the drop back into the short-term falling channel could raise fresh selling interest in the coming session. Meanwhile, the RSI has ticked below its 50 neutral mark and the stochastic oscillator, although within the oversold region, has yet to bottom out, both signaling more downside ahead.
If the bearish scenario plays out, the pair could seek support somewhere between the 61.8% Fibonacci retracement of the October-December 2023 downtrend at 1.3622 and the lower band of the broad bullish channel at 1.3600. Note that the 200-day SMA is within the neighborhood and a step below it could trigger a new decline towards 1.3500-1.3525.
Alternatively, a bounce above 1.3700 may not excite traders unless the price stretches successfully above the 78.6% Fibonacci mark of 1.3740. If that happens, attention will shift to the 1.3800 level, where the upper boundary of the bullish channel is located. Another victory there could lift the pair up to the 2024 top of 1.3844, while higher, the 2023 peak of 1.3900 could be the next resistance.
Overall, USDCAD remains exposed to more selling in the short-term picture. Unless the pair returns above 1.3700, the bears could next head for the 1.3600-1.3622 region.
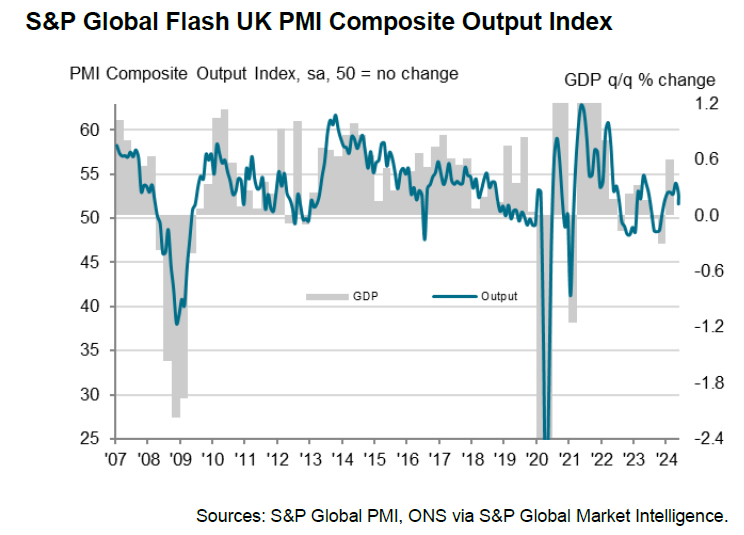
UK economic growth slows as services PMI hits 7-month low
UK's PMI data for June presents a mixed picture. Manufacturing PMI slightly increased from 51.2 to 51.4, surpassing the expectation of 51.0 and marking a 23-month high. However, Services PMI fell from 52.9 to 51.2, below expected 53.2, reaching a 7-month low. Consequently, Composite PMI also declined from 53.0 to 51.7, hitting its lowest point in seven months.
Chris Williamson, Chief Business Economist at S&P Global Market Intelligence, noted that the Flash PMI survey data for June signals a slowdown in the pace of economic growth, with GDP now growing at a "sluggish" quarterly rate of just over 0.1%. This slowdown is partly due to uncertainty in the business environment ahead of the general election, causing many firms to pause decision-making while awaiting clarity on future policies.
From an inflation perspective, the survey highlights persistent inflation in the service sector, which remains a significant barrier to lowering interest rates. This stubborn inflation is currently at a 5.7% pace but is expected to cool further in the coming months.
In summary, while the current economic slowdown may be temporary, contingent on business reactions to new government policies, the persistent underlying inflationary pressures above BoE's target remain a concern.
Eurozone PMI manufacturing falls to 45.6, services down to 52.6
Eurozone's PMI data for June revealed significant declines, with Manufacturing PMI falling from 47.3 to 45.6, below the expected 45.6. Services PMI also dropped from 53.2 to 52.6, missing the forecast of 53.5. Consequently, Composite PMI decreased from 52.2 to 48.0.
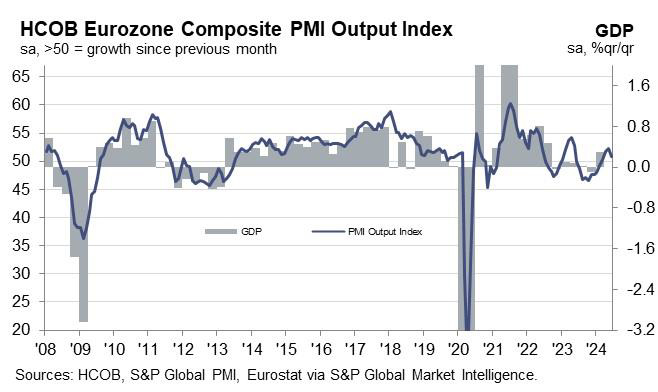
Cyrus de la Rubia, Chief Economist at Hamburg Commercial Bank, noted that the preliminary HCOB Flash Eurozone Composite Output Index indicates a slight downgrade in GDP growth for Q2, though it still suggests positive growth of 0.2% compared to Q1.
ECB's June rate cut may be justified by easing price pressures in the service sector, he added. However, the PMI data do not support another rate cut in July. In Germany, service providers increased their prices more sharply than in May. Additionally, the manufacturing sector, which faced deflation in output charges for 14 months, saw input prices rise in June for the first time since February 2023.
He also noted that orsening conditions in France's services and manufacturing sectors may be tied to recent European Parliament election results and President Macron's announcement of snap elections on June 30. This uncertainty has likely led many companies to pause new investments and orders, contributing to the economic downturn in the Eurozone.
German PMI Manfacturing fell from 45.4 to 43.4. PMI Services fell from 54.2 to 53.5. PMI Composite fell from 52.4 to 50.6. French PMI Manufacturing fell from 46.4 to 45.3. PMI Services fell from 49.3 to 48.8. PMI Composite fell from 48.9 to 48.2.
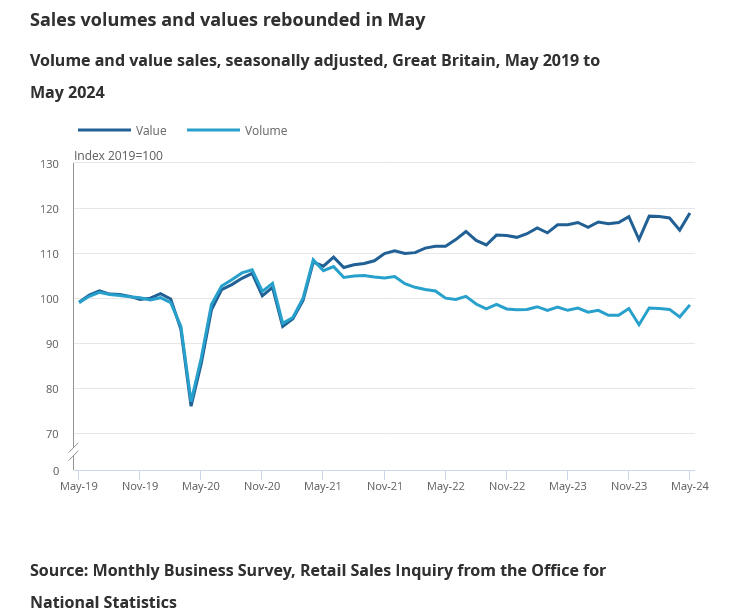
UK retail sales volume grows 2.9% mom in May, vs exp 1.5% mom
UK retail sales volume rose 2.9% mom in May, above expectation of 1.5% mom. More broadly, sales volumes rose by 1.0% in the three months to May 2024 when compared with the previous three months. Over the year to May 2024, volumes rose by 1.3%, and were -0.5% below their pre-coronavirus (COVID-19) pandemic level in February 2020.
Market Analysis: Gold Price and Crude Oil Price Turn Green
Gold price started a fresh increase above the $2,335 resistance level. Crude oil prices are gaining bullish momentum and might rise toward $82.50.
Important Takeaways for Gold and Oil Prices Analysis Today
- Gold price started a decent increase from the $2,300 zone against the US Dollar.
- A connecting bullish trend line is forming with support near $2,345 on the hourly chart of gold at FXOpen.
- Crude oil prices rallied above the $79.00 and $80.00 resistance levels.
- There is a key rising channel forming with support at $80.85 on the hourly chart of XTI/USD at FXOpen.
Gold Price Technical Analysis
On the hourly chart of Gold at FXOpen, the price found support near the $2,300 zone. The price formed a base and started a fresh increase above the $2,320 level.
There was a decent move above the 50-hour simple moving average and $2,335. The bulls pushed the price above the $2,350 resistance zone. Finally, the bears appeared near $2,365. A high was formed near $2,365.43 and the price is now consolidating gains.
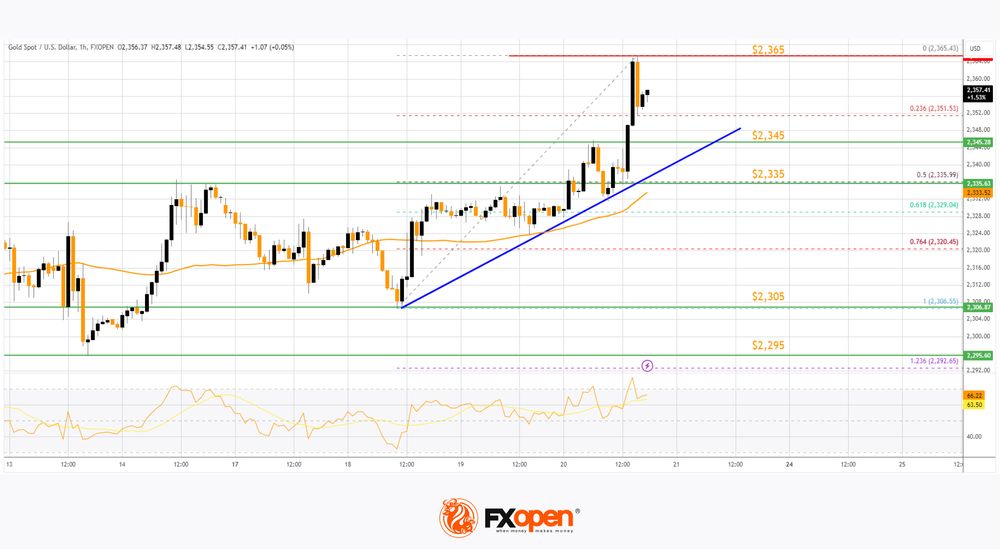
The current price action is positive above the 23.6% Fib retracement level of the upward move from the $2,306 swing low to the $2,365 high. The RSI is still above 60 and the price could aim for more gains.
Immediate resistance is near the $2,365 level. The next major resistance is near the $2,380 level. An upside break above the $2,380 resistance could send Gold price toward $2,400. Any more gains may perhaps set the pace for an increase toward the $2,420 level.
Initial support on the downside is near the $2,345 zone. There is also a connecting bullish trend line forming with support near $2,345. If there is a downside break below the $2,345 support, the price might decline further.
In the stated case, the price might drop toward the $2,335 support or the 50% Fib retracement level of the upward move from the $2,306 swing low to the $2,365 high.
Read analytical Gold price forecasts for 2024 and beyond.
Oil Price Technical Analysis
On the hourly chart of WTI Crude Oil at FXOpen, the price started a major upward move against the US Dollar. The price gained bullish momentum after it broke the $79.00 resistance.
There was a sustained upward move above the $80.0 and $80.45 resistance levels. The bulls pushed the price toward $81.50. The current price action is positive above the 50-hour simple moving average and RSI is stable above 50.
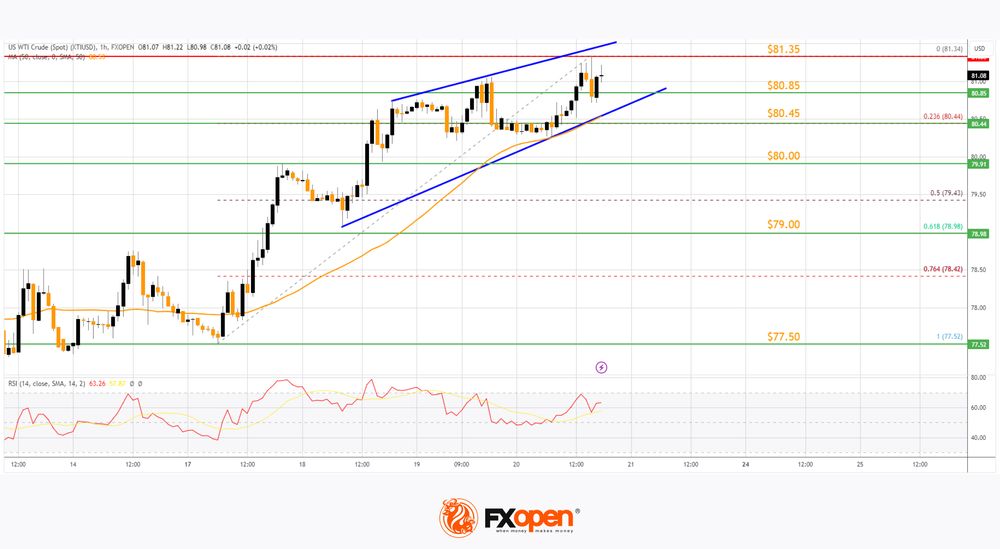
The price is holding gains above the 23.6% Fib retracement level of the upward move from the $77.52 swing low to the $81.34 high.
If the price climbs higher again, it could face resistance near $81.35. The next major resistance is near the $81.50 level. Any more gains might send the price toward the $82.50 level.
Conversely, the price might correct gains and test $80.85. There is also a rising channel forming with support at $80.85. The next major support on the WTI crude oil chart is near the $80.00 zone, below which the price could test the 50% Fib retracement level of the upward move from the $77.52 swing low to the $81.34 high at $79.00.
If there is a downside break, the price might decline toward $77.50. Any more losses may perhaps open the doors for a move toward the $76.00 support zone.
Start trading commodity CFDs with tight spreads. Open your trading account now or learn more about trading commodity CFDs with FXOpen.
This article represents the opinion of the Companies operating under the FXOpen brand only. It is not to be construed as an offer, solicitation, or recommendation with respect to products and services provided by the Companies operating under the FXOpen brand, nor is it to be considered financial advice.
Japanese Yen Trades Stoic After Closing at New 34-y Low
Markets
US invertors returning after Wednesday’s Juneteenth holiday found some disappointing, admittedly mostly second tier, US data (jobless claims at a high 238k, housing starts and permits declining and the Philly Fed business outlook unexpectedly easing). US bond markets didn’t take notice. Yields even regained slightly ground rising between 2.5 bps (2-y) and 4.2 bps (30)y). German yields showed a similar pattern adding between 2.0 bps (2-y) and 3.9 bps (30-y). Spreads of France and peripheral intra-EMU bonds versus Bunds mostly narrowed slightly (about 2 bps). A new French election poll (Toluna Harris Interactive) still indicated the lead for the Rassemblement National (33%) followed by the Left Alliance (26%). President Macron’s group apparently drew some more support than in previous polls (21%). European equities (EuroStoxx50 +1.27%) outperformed the US (S&P 500 -0.25%). Still, the euro lost against the dollar with EUR/USD drifting to low 1.07 area (close 1.0702). The Bank of England left its policy rate unchanged in a 7-2 voting balance. Despite recent sticky core/services inflation, several members who currently still voted for an unchanged decision labelled their assessment ‘finely balanced’, suggesting they were moving closer to a rate cut. Gilts outperformed Bunds and Treasuries with the UK curve steeping (2-y -3 bps, 30-y +1.4 bps). Money markets again discount a 60% change of an August BoE 25 bps cut which is almost fully discounted for September. Sterling lost some modest ground, with EUR/GBP drifter further away from the 0.84 support area (close 0.8455).
Asian equities mostly showed modest losses as US (tech) stock yesterday failed to hold on to opening gains. US yields are little changed. The dollar eases marginally after yesterday’s rebound (EUR/USD 1.0715, DXY 105.54). Later today, the US and EMU PMI releases will provide an update on the EMU and US economies. For EMU a modest further improvement (composite index) is expected (52.5 from 52.2). However, both the survey outcome and the market reaction might be affected by the uncertainty on the outcome of the French elections. We see recent lows for the German 10-y yield (2.36%) and the 10-y EMU swap (2.70%/2.68% area) to provide decent support, even in case of a disappointing release. After recent softer US data, also keep an close eye at the US measure. After a strong rebound last month a setback to 53.5 from 54.5 is expected. A negative surprise might push money markets to fully discount a scenario of a double Fed rate cut in September and December. This morning, UK May retail sales (after a poor April reading) rebounded more than expected (2.9% M/M, 1.3% Y/Y). Sterling gains modest ground after the release (EUR/GBP 0.846). However, price data probably are more important to shape BoE governors’ assessment rather than volatile (retail sales) data. UK PMI’s are scheduled for release later today.
News & Views
Japanese inflation accelerated in May from April in most gauges, though slightly less so than expected. The headline figure picked up from 2.5% to 2.8%, breaking with a two-month decline. The series excluding fresh food (the Bank of Japan’s preferred measure) rose from 2.2% to 2.5%. Core CPI (ex. fresh food and energy) decelerated from 2.4% to 2.1%. Services inflation, with close ties to wage growth, eased from 1.7% to 1.6% though in what perhaps may disappoint the Bank of Japan seeking for a (domestic) consumption-driven sustainable return of inflation to 2%. However, the result of the spring wage negotiations (shunto) still have to filter through in Japanese consumer’s wages. These will come on top of the government’s income tax rebate and could support spending going forward. It makes the July meeting – with a new quarterly report - still a live one from a market point of view. There’s currently a 50% chance priced in for a 10 bps rate hike. The Japanese yen this morning trades stoic after closing at a new 34-y low yesterday around USD/JPY 158.9. Previous FX interventions level just north of 160 are coming dangerously close …
… which brings us to yesterday’s decision of the US Treasury department to add Japan to its “monitoring list” for foreign-exchange practices. It didn’t label the country as a currency manipulator though. Japan was put on the list not so much because of the FX interventions (which fell outside the scope of the report due to timing) but because of the large bilateral trade and current account surpluses Japan has with the US. The report on the matter said that such operations should be reserved for very exceptional circumstances only and that Japan has been transparent about it. The other countries to stay on the list included China, Germany, Malaysia, Singapore, Taiwan and Vietnam.
Graphs
GE 10y yield
The ECB cut its key policy rates by 25 bps at the June policy meeting. A more bumpy inflation path in H2 2024, the EMU economy gradually regaining traction and the Fed’s higher for longer US strategy make follow-up moves difficult. Markets are coming to terms with that. For the time being, though, the political narrative dominates. After hitting a new YtD top at 2.7%, the German 10-yr yield corrected lower on safe haven bids.
US 10y yield
The Fed is seeking more evidence than just one slower-than-expected (May) CPI is providing. Upgraded inflation forecasts and a higher neutral rate complicate the exact timing of a first cut further. June dots suggest one move in 2024 followed by four more next year. Markets are positioned more aggressively, turning the recent low in yields into a technical support zone. The US 10-y yield is testing the downside of the 4.2/4.7% trading range.
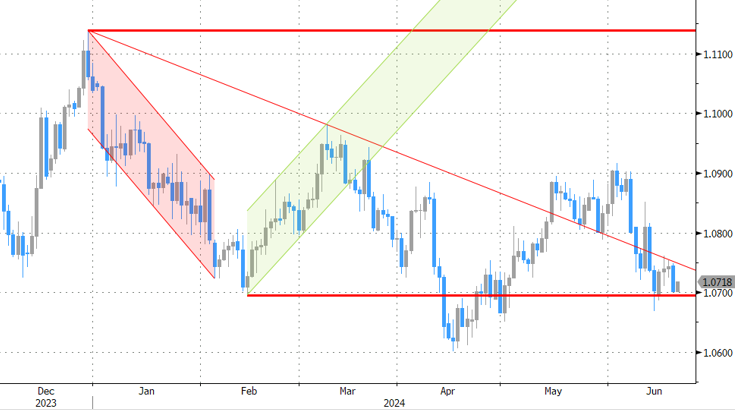
EUR/USD
EUR/USD is trapped in the 1.06-1.09 range. The desynchronized rate cut cycle with the ECB exceptionally taking the lead, strong US May payrolls and a swing to the right in European elections pulled the pair away from 1.09 resistance. The Fed meeting balanced the weaker than expected US CPI outcome. Euro fragility makes a return to the 1.06 downside more likely than not.
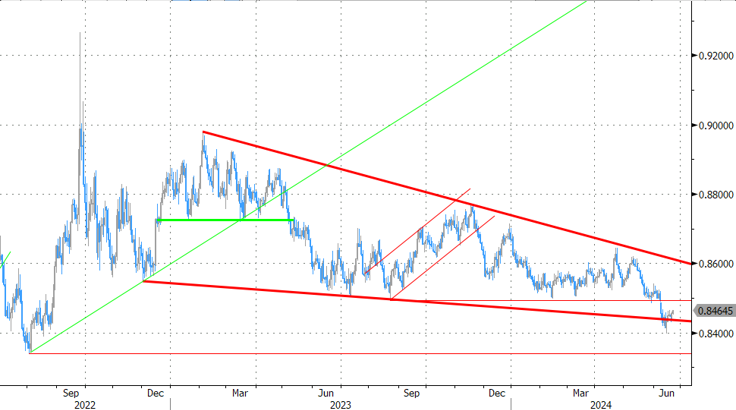
EUR/GBP
Debate at the BOE is focused at the timing of rate cuts. May headline inflation returned to 2%, but core measures weren’t in line with inflation sustainably returning to target any time soon. Still some BoE members at the June meeting appeared moving closer to a rate cut. This might cap further sterling gains. At the same time, the euro remains vulnerable to political event risk going into the France elections. EUR/GBP 0.8400 recently showed a solid support.
Happy Triple Witching Day
The Swiss National Bank (SNB) cut its rate by another 25bp yesterday. The latest uptick in inflation didn’t bother the Swiss policymakers who considered that inflation remains in check in Switzerland. They preferred to give the economy – especially the Swiss exporter and families with mortgages - the additional support they needed. The market reaction was immediate, the euro-franc rallied above 0.95 level and the USDCHF immediately jumped back above its 200-DMA and the major 38.2% Fibonacci level on this year’s rebound, and hence returned to the positive trend. Even though we shall see short-term buying waves due to safe haven demand, the franc will likely remain under the pressure of a dovish SNB stance in the longer run and we could see one more rate cut before the year ends if inflation remains under control. The lower rates and a softer franc fueled appetite in Swiss equities as well. The SMI index gained 0.56%.
In the UK, a rate cut was not on the menu of the Brits on Thursday, but the accompanying statement was ‘finely balanced’, more dovish than expected and revived the expectation that the Bank of England (BoE) could announce a rate cut as early as in August. And because the market was pricing a rate cut not before November before the meeting, yesterday’s decision sent Cable to 1.2654. There is one more hurdle to an August cut, and it’s the BoE’s new member Claire Lombardelli who could be more ‘hawkish’ and may prevent the dovish camp from reaching the 5 voters needed to secure a cut. Right now, we are at 2.
Anyway, the more dovish than expected BoE statement, and a softer sterling boosted appetite in FTSE 100. A further advance in oil prices certainly helped. US crude tested the $82pb resistance as the EIA data showed that US oil inventories declined 2.5-mio barrel last week. European stocks on the continent were also better bid. The Stoxx 600 jumped almost 1% and the French CAC 40 gained more than that after France’s first government bond sale since Macron called snap election saw a healthy demand. Investors are worried but not devastatingly worried about the outcome of the upcoming snap election that could offer Marine Le Pen’s National Rally a majority in the Parliament. Mood in Europe is slightly better at the end of this week than it was by the end of last week.
For once, US stocks didn’t follow up on the European session gains despite soft data that was released there. Yet, the US building permits fell and housing started fell more than5% in May Philadelphia Fed’s manufacturing index eased unexpectedly in June. Plus, a $21bn TIPS auction saw strong demand. Alas, appetite wasn’t there. The US 2-year yield jumped to 4.75%, the 10-year yield recovered to 4.27% and the S&P500 fell – after hitting a fresh record. Some believe that yesterday’s selloff was motivated by soft data – that came in too soft to cheer up investors. To me, yesterday’s reluctance to flock into the US stocks had more to do with investors psychology. Nasdaq 100 flirted with the 19980 level this week. We are very, very close to the 20’000 super-psychological level, and investors may be – but just may be – thinking that the tech rally – which is the only reason we see the major US indices renew record after record – is now overstretched, and that the valuations have gone well ahead of themselves and that it could be time to take a pause, and maybe put some of the profits in pocket.
Today, it’s the triple witching day, about $5.5 trillion index futures, options, stock options and ETFs will expire at the same time. Given that we are at psychologically crucial, irrationally high, and mathematically overstretched levels, we could see surprise turns and twists in positioning.
A last word for the FX. The US dollar index jumped yesterday despite soft economic data. The selloff in major currencies like the franc and the pound helped lifting appetite in the US dollar. The EURUSD returned to 1.07 and rebounded from that level. We will unlikely see the same selloff we did before last weekend as the French political risks are better understood and better digested by now. The USDJPY, however, is on an unstoppable rise yet again, since the Bank of Japan (BoJ) decided not to soften its bond purchases at last week’s meeting. That, combined to a softer than expected core CPI figure and weaker-than-expected PMI data, fueled the JPY bears and sent the USDJPY above 159 this morning. We are now disquietingly close to 160, a level that previously saw the BoJ intervene to stop the bleeding.