Sample Category Title
Week Ahead – RBA, SNB and BoE Next to Secide, CPI and PMI Data Also on Tap
- It will be another central-bank-heavy week with the RBA, SNB and BoE
- None are expected to cut but there’s room for surprises
- Retail sales will be the highlight in the United States
- Plenty of other data also on the way, including flash PMIs and UK CPI
RBA is in a pickle
The Reserve Bank of Australia will keep the central bank theme going on Tuesday when it meets for its June policy decision. Like their global peers, RBA policymakers had been hoping that their job was going to get a lot easier this year. But a muddy economic picture and sticky inflation have complicated the policy path.
Inflation has been gradually edging higher all year, with the monthly CPI reading ticking up to 3.6% y/y in April, reversing some of the sharp drop seen in 2023. Meanwhile, the labour market appears to be tightening again. However, doubts about the strength of the broader economy have deterred policymakers from hiking rates. GDP grew by just 0.1% in the first three months of the year.
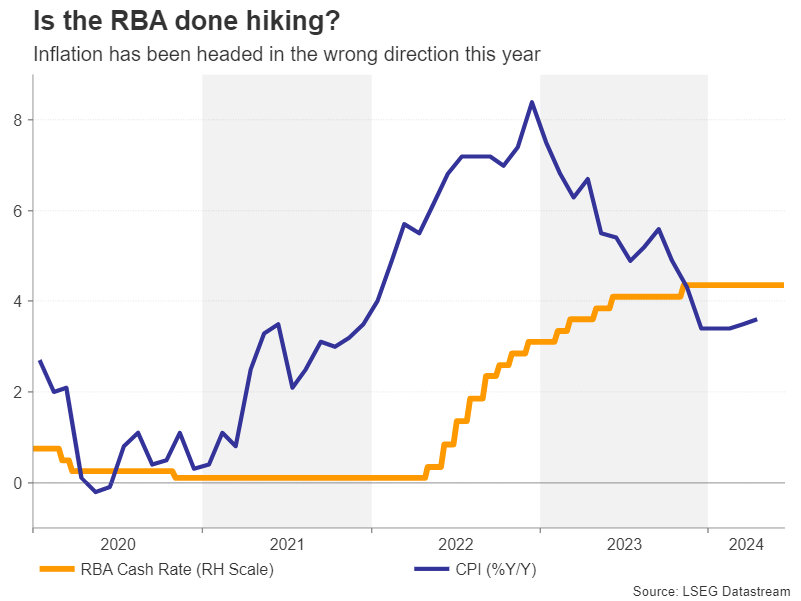
A rate hike was considered at the May meeting, but ultimately, policymakers judged the risks to the inflation forecasts to be balanced. The June statement will likely strike a similar tone, with the cash rate expected to remain on hold.
However, although investors have in recent weeks priced out any probability of a rate increase, the inflation trend in Australia remains more worrisome than in other countries and it may be too soon to rule out a hike. Nonetheless, any policy shift is unlikely before the August meeting when new economic projections will be available. The timing of how long it will take for inflation to fall back within the RBA’s 2-3% target band will be crucial to future rate decisions.
In the meantime, any reactions in the Australian dollar might be short-lived amid the lingering fog over the interest rate outlook both domestically and in the United States.
Will the SNB cut again?
The Swiss National Bank took many investors by surprise when it cut rates back in March, becoming the first major central bank to do so in this cycle. Markets see around a two-thirds probability of a follow-up 25-basis-point cut on Thursday when the SNB convenes for its quarterly gathering.
However, the recent data does not point to any urgency to ease policy so soon after the last move. GDP grew more than expected in Q1 and inflation quickened to 1.4% in April, staying unchanged in May.
The SNB has an inflation target of 0-2.0% and when adding the weaker Swiss franc into the equation, policymakers can certainly afford to wait before cutting again. Outgoing president, Thomas Jordan, even warned as much in recent remarks, citing the exchange rate as the likely source of inflation risks being skewed to the upside.
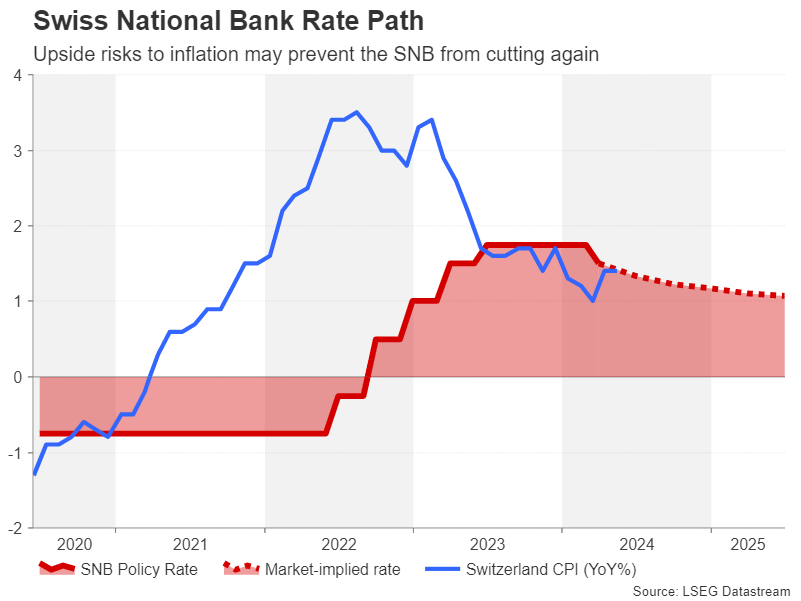 Should the SNB keep rates unchanged at 1.50% and cast doubt on the prospect of a September cut, the franc could extend its latest rebound attempt against the US dollar.
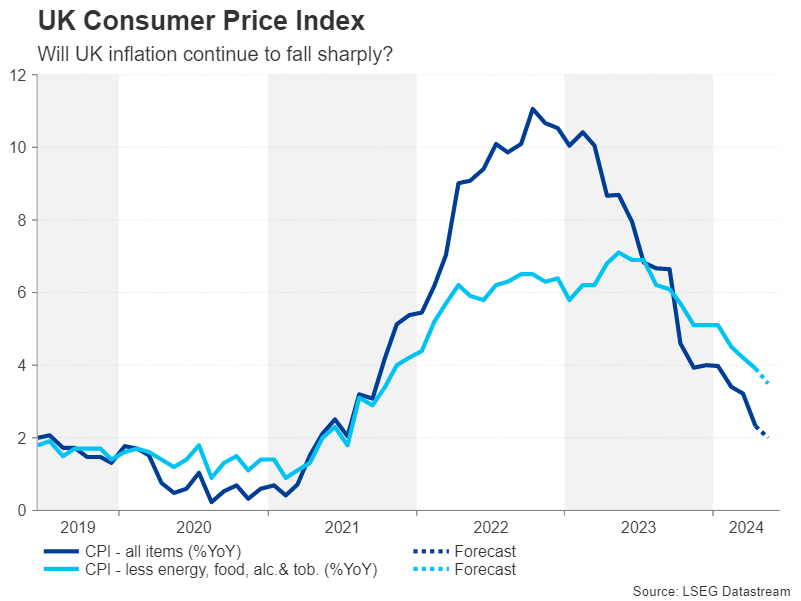
BoE: avoiding a political storm
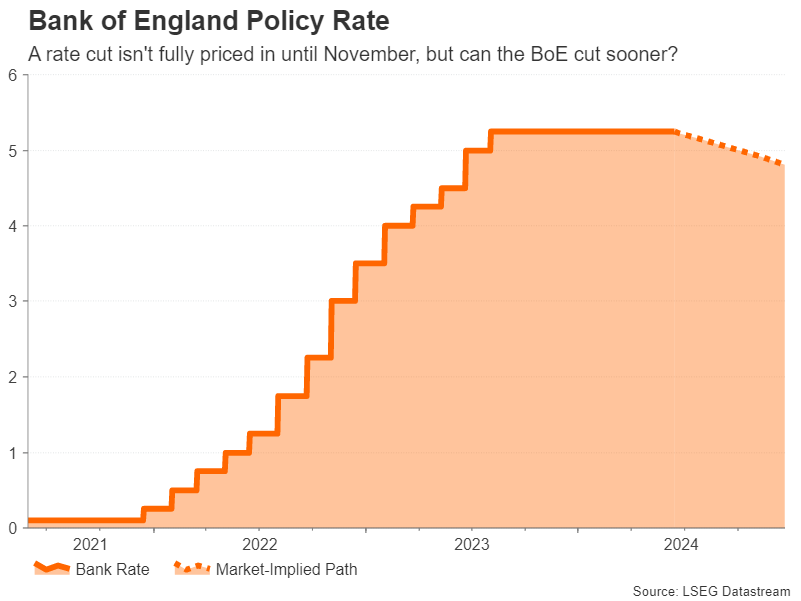
The Bank of England will deliver the final policy decision of the week hours after the SNB, and it looks set to be a non-event. The ongoing general election campaign in the UK means that the Bank will not say or do anything that could sway voters towards any political persuasion.
This might actually come as a relief for policymakers who need more time to assess the inflation picture. Although UK CPI plunged to 2.3% y/y in April, wage growth has remained sticky at 6.0% y/y, while services inflation has not subsided much from its peak. Yet, the jobs market is clearly softening, with the unemployment rate rising for the fourth straight month in March.
In August, not only will there likely be a new government in Downing Street with a new economic agenda, but the Bank will also have access to updated forecasts. Hence, policymakers might not even tweak their statement in June, turning the spotlight to the incoming data.
The CPI numbers for May are due on Wednesday, to be followed on Friday by retail sales figures for the same month, as well as the flash PMI estimates for June.
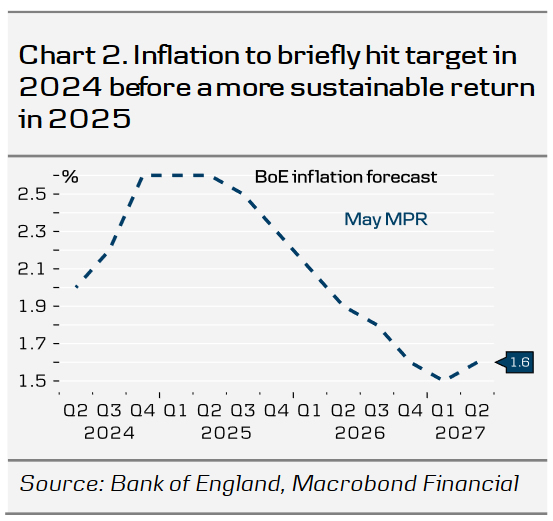
Investors have currently assigned odds of about 40% for a cut in August, while a 25-bps reduction isn’t fully priced in until November. But markets may be underestimating the BoE’s eagerness to begin the easing cycle and should headline CPI drop below 2% in May, hopes of a summer rate cut will get a boost.
For sterling, however, soft data and dovish soundbites post the July 4 election may only have a limited impact if expectations for a September cut by the Fed also grow. Moreover, if investors view an early BoE cut as simply bringing forward the timing of one and not a shift to a more aggressive easing path, the pound’s broader outlook might not change much.
US retail sales in focus after wild week
It’s been a confusing week for Fed watchers as a soft CPI report was followed by a hawkish Fed meeting. For the dollar, its rollercoaster ride started a few days earlier from the hot jobs report. But perhaps the most telling in all this is where Treasury yields ended after all the excitement died down – at two-and-a-half-month lows.
In a nutshell, market expectations have been back and forth between one and two rate reductions for some time now and so the new dot plot signalling just one cut in 2024 wasn’t much of a gamechanger. Crucially, Fed Chair Powell left the door open to a September cut if there’s further progress on lowering inflation before then. In addition, Fed officials pencilled in more cuts for 2025 than in the March dot plot.
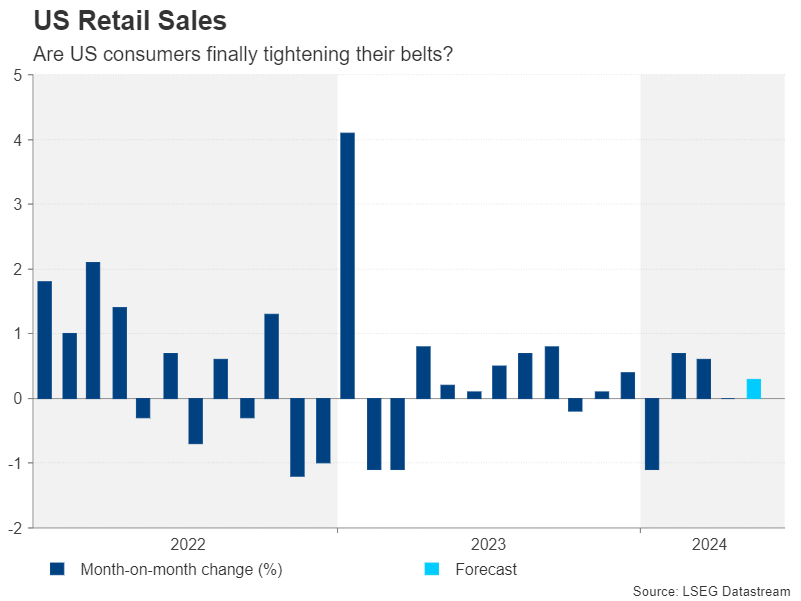
But the pendulum could still swing either way and Tuesday’s retail sales numbers could therefore spoil the current optimism if they show that consumer spending accelerated in May. Forecasts are for a reading of 0.3% m/m versus 0.0% in April.
Other data out of the US next week are mostly second-tier releases. They include the New York Fed and Philly Fed manufacturing gauges on Monday and Thursday, respectively, industrial production on Tuesday, building permits and housing starts on Thursday, and the S&P Global PMIs and existing home sales on Friday.
Euro hoping for a calmer week
Another currency experiencing some volatility over the past few days has been the euro. After the gains of the far right in the European Parliament election last weekend and French President Macron’s shock announcement of a snap election, a dollar selloff briefly came to the aid of the sliding euro. In the coming week, the euro’s best bet for some support will be Friday’s flash PMI figures.
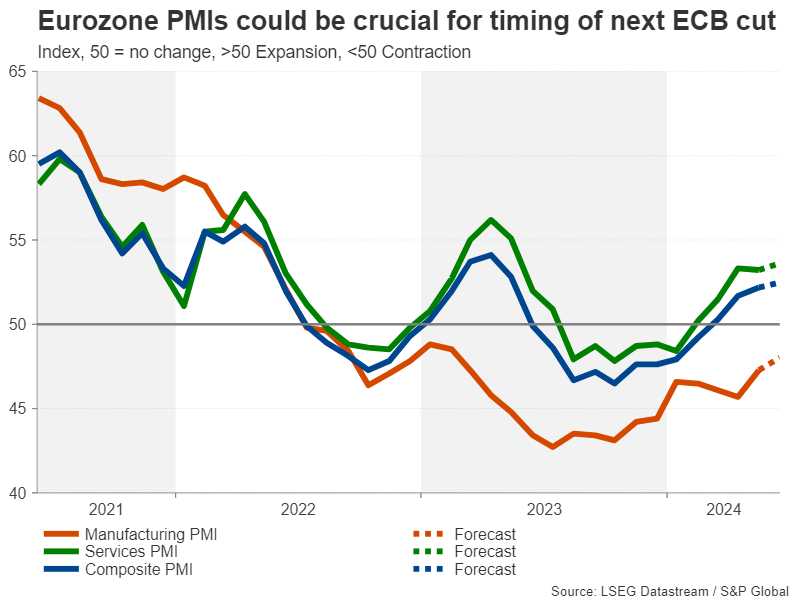
An upbeat set of surveys for June could bolster the single currency as a strengthening economic recovery would dash expectations of another rate cut by the ECB in the near term. Investors will also be watching quarterly wage data on Monday, the final CPI estimates for May on Tuesday, as well as Germany’s ZEW economic sentiment index due the same day.
Japanese CPI and New Zealand GDP eyed too
In Japan, May inflation numbers out on Friday will be the focal point for the yen. Tuesday’s trade figures and the flash PMIs might also attract some attention.
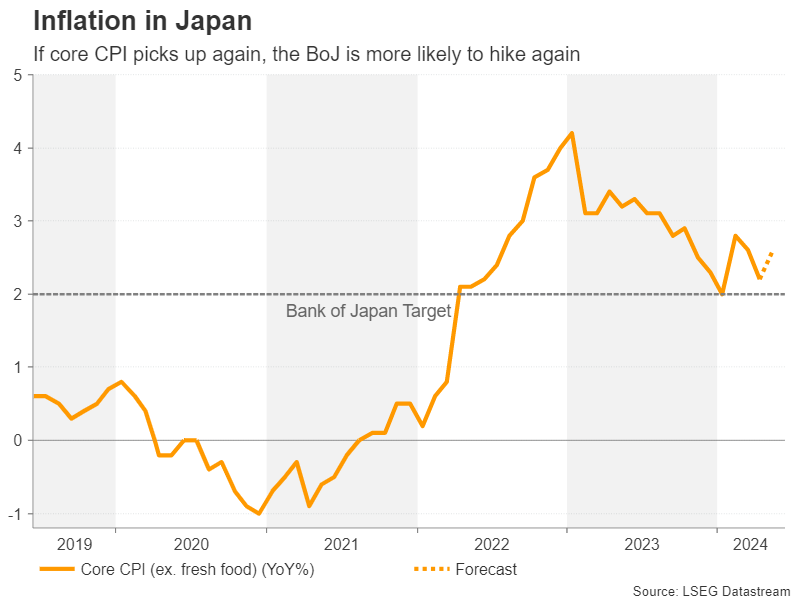
The Bank of Japan decided this week to delay any decision on tapering its bond purchases until the July meeting. The cautious stance pulled the yen lower, but there might be some good news for the beleaguered currency from the CPI report. The core figure is expected to rise back up to 2.6% y/y in May from 2.2%, potentially adding to the case for the BoJ to further wind down its stimulus policies.
Elsewhere, the first quarter GDP print will be the highlight for the New Zealand dollar on Thursday, while at the start of the week, China’s monthly data dump that includes industrial output and retail sales figures will set the market mood on Monday.
RBA Preview: Comforts and Confidence
The RBA Board is expected to leave the cash rate unchanged at next week’s meeting. The recent data-flow will provide some comfort that restrictive policy is bringing inflation back under control, but the path is still uncertain. Vigilance remains the order of the day until the RBA becomes more confident of achieving a sustained return to sub-3% inflation.
The Reserve Bank Board meets on June 17-18. We expect it to again leave the official cash rate unchanged, repeating the view that restrictive policy is bringing inflation back towards target but that uncertainty around the timeframe means it needs to remain vigilant to upside risks.
At its May meeting, the Board assessed that demand was coming back in to line with supply quite quickly. Updates since then have continued to support this ‘rebalancing’ view.
The most important update – and part of the rationale behind the RBA Board’s new meeting schedule – has been the March quarter national accounts. This provides a comprehensive view of the wider economy, including overall growth, the mix and strength of demand and some key metrics for gauging domestic cost pressures.
Growth all but stalled in the first quarter of 2024, annual GDP gains slowing to just 1.1%yr with weakness centred on the consumer. That result was in line with the RBA’s expectations, its forecasts from the May Statement on Monetary Policy having GDP growth slowing to 1.2%yr by the June quarter.
The detail did carry some surprises, particularly around the consumer, but the impact here looks to be mixed from the RBA’s perspective. Spending was a little firmer than expected in the quarter with significant upward revisions, relating to estimates of outbound tourism spending by Australians, lifting the growth profile over the last year. The combination of sharp rises in the cost of living, higher interest rates and surging tax payments is still weighing heavily but not quite as heavily as previously indicated, annual growth running at 1.3%yr rather than around flat.
Our view is that these changes have only limited implications for the RBA.
Firstly, they relate to history and so are already reflected in measured inflation.
Secondly, the revised spending profile means households have been saving much less, the implied run-down of buffers carried over from the pandemic meaning there is less scope to use these funds to sustain spending going forward (we estimate around 45% of this notional reserve has now been run down, compared to about 20% previously).
And lastly, the upward revisions centre on spending abroad and are therefore less relevant for assessing the extent to which demand is pushing up against supply constraints and contributing to domestic inflation pressures. If that demand starts getting redirected locally, it would be a different story but so far, this does not look to be the case (indeed both anecdotes from customers and recent reads from our Westpac Card Tracker suggest demand has weakened noticeably again in the June quarter).
The other detail from the March quarter national accounts update would have been broadly as hoped. In particular, productivity is continuing to show signs of improvement with productivity-adjusted measures of domestic labour costs also turning. Annual growth in nominal non-farm unit labour costs (the effective cost of labour once both wage costs and productivity are taken into account) slowed from 6.8%yr to 5.7%yr and has been tracking a 2.9% annualised pace over the last two quarters. The improvement in non-mining sectors has been particularly promising. This is broadly consistent with inflation in domestically-driven segments like the market services sector slowing to around a 3.5% annual pace.
Other developments over the last month would also be giving the RBA more comfort on this front. Wages growth is showing clearer signs of having peaked at just over 4%yr, with the Fair Work Commission’s decision to lift minimum wage and award rates by 3.75% this year – down from an average increase of 5.75% last year – supporting the view that growth will continue to cool (the RBA’s May forecasts has wage growth moderating to 3.4%yr in 2025).
The labour market more broadly is also showing a gradual moderation with a desirable mix from the RBA’s point of view. Employment growth has eased back to be in line with population growth, meaning participation and unemployment rates are holding about flat. However, there is clearer evidence of slack emerging around hours worked and underemployment – employers look to be responding to slower demand with adjustments in loading rather than headcount. That is the ideal mix for achieving a ‘soft landing’ that contains wage growth and inflation but avoids the additional damage associated with job losses.
The other major development since the RBA Board’s May meeting has been the Federal Budget. This is also likely to be broadly ‘a wash’ for policy although there may be some wrinkles around how various cost-of-living measures are expected to impact.
The combined effect of both Federal and state government cost-of-living measures will accentuate the decline in headline inflation over the second half of the year. We now expect annual inflation to drop into the RBA’s 2-3% target range, ending the year at 2.9%yr. Much of this will reverse as temporary energy bill relief rolls off, and there is some risk of spill-over effects to wider demand slowing the pace of disinflation elsewhere.
However, these risks seem low given the consumer frame of mind and are likely to be offset by the anchoring effects of lower headline CPI reads. Consumer sentiment remains very weak. Responses to specific questions on tax cuts also indicate that consumers are likely to put any ‘windfall’ income gains towards rebuilding depleted savings buffers rather than spending. Sub-3% headline inflation reads will also help anchor inflation expectations at lower levels both via perceptions and the impact on a range of prices and wages that are indexed to the CPI.
As always, there will be many other considerations for the RBA Board, but June’s meeting is likely to be framed in much the same way as May’s. That was in the context an upside surprise to inflation that saw the Board consider an additional rise but opt to leave rates unchanged and adopt a more vigilant approach to assessing further risks. Those risks are still primarily around the path of actual inflation, suggesting the Bank is unlikely to relax until we get more quarterly CPI updates.
As such, the last six weeks would have given the RBA some comfort that other aspects of the economy were evolving as expected or hoped, and that other upside risks were not materialising. But it will be looking for a bit more evidence around inflation before it can relax, let alone be confident enough about hitting its inflation target that it can start to shift its stance.
Bank of England Preview – Laying the Groundwork for an August Cut
- We expect the Bank of England (BoE) to keep the Bank Rate unchanged at 5.25% on 20 June, which is in line with consensus and current market pricing.
- Overall, we expect the MPC to stick to its current communication, priming the markets for a forthcoming start to a cutting cycle. We expect the first 25bp cut in August.
- We expect a muted market reaction but see the balance of risk skewed to a move higher in EUR/GBP as the BoE tends to err on the dovish side.
We expect the Bank of England (BoE) to keep the Bank Rate unchanged at 5.25% on 20 June, which is in line with consensus and current market pricing. We expect the vote split to be 7-2, with the majority voting for an unchanged decision and Ramsden and Dhingra voting for a cut. Note, this meeting will not include updated projections or a press conference following the release of the statement.
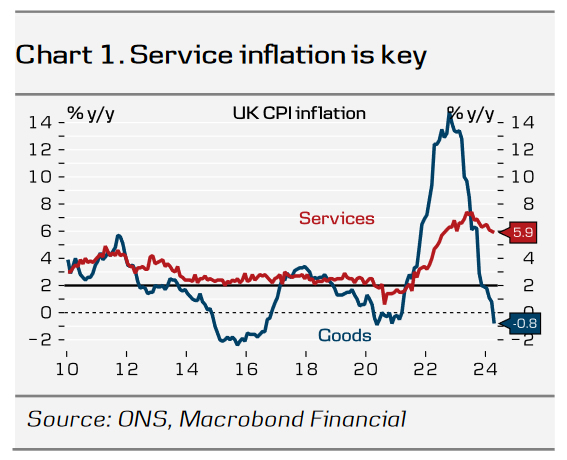
Overall, we expect the MPC to stick to previous guidance, priming the markets for a forthcoming start to a cutting cycle. We expect them to retain much of its wording in terms of forward guidance, repeating that "monetary policy could remain restrictive even if Bank Rate were to be reduced, given that it was starting from an already restrictive level" and "the Committee will keep under review for how long Bank Rate should be maintained at its current level". Since the last monetary policy decision in May, data has overall been slightly stronger than expected. Activity picked up in Q1 with the economy growing 0.6% q/q (vs BoE forecast of 0.4%), although the pickup is largely due to net exports with private consumption growth remaining more muted. Service inflation remained elevated at 5.9% in April with underlying momentum still strong and wage growth remains elevated underpinned by the recent rise in the National Living Wage. While inflation data for the month of May is released on Wednesday, the day before the meeting, we do not expect this to affect the immediate policy decision in June but will prove important in terms of guidance.
UK election. Since the announcement of a UK snap election, all speeches from MPC members have been cancelled. We do not expect the election to have an impact on the immediate policy action. In the base case of Labour election win, we will most likely not see a budget accompanied by an OBR forecast until in September, which will then be formally incorporated into BoE forecasts.
BoE call. We expect the BoE to deliver the first cut of 25bp in August. Subsequently, we expect quarterly cuts through 2024 and 2025. Markets are pricing 45bp for the remainder of the year with the first 25bp cut fully priced by November.
FX. In our base case we expect a muted reaction in EUR/GBP but see the balance of risk skewed to a move higher as the BoE tends to err on the dovish side. With risks to both growth and inflation tilted to the topside, this leaves a more challenging backdrop for an impending BoE cutting cycle. By extension and combined with the political uncertainty in France, this also acts as a downside risk to our EUR/GBP forecast of 0.88 in 6-12 months.
Weekly Focus – Political Uncertainty on the Rise in Europe
This week was dominated by events in the US. The FOMC kept policy rate unchanged at its Wednesday meeting as widely expected. The median of the updated dot plot now signals only one cut for this year, but it remains a close call. While four members expect no cuts, seven members lean towards one cut, and eight members still foresee two cuts. Overall, the updated projections continue to signal nine cuts by end-2026, unchanged from the March update, albeit that cuts have been postponed. We still expect Fed to cut rates twice this year, in September and December. Read more on Research US - Fed Review: We still see cuts starting in September, 12 June.
The FOMC meeting followed a softer-than-expected CPI print. Both headline and core inflation surprised to the downside in May, at 0.0% m/m and 0.2% m/m in seasonally adjusted terms. Overall, underlying inflation momentum continues to moderate in the US, as also confirmed by PPI data this week. Headline producer prices unexpectedly declined in May compared to previous month, and core prices stagnated. In euro area, inflation initially decelerated faster than in the US but the latest prints have been less convincing, see Global Inflation Watch - The Fed welcomes easing supercore inflation, 12 June.
Political uncertainty is on the rise in France. While the European Parliamentary election itself was not a market mover, the shock announcement by President Emmanuel Macron on Sunday to call snap election has spooked the markets. Macron's Renaissance party suffered a massive defeat to Le Pen's RN party, and Macron's approval rating is at its lowest since 2018. The first round of the snap election will be held on 30 June and the second round on 7 July, and Le Pen's RN party is expected to make significant gains. The party's victory could derail reforms while also adding further friction to intra-EU relations. Reflecting this rising uncertainty, risk sentiment soured this week despite US yields declining on the back of the soft CPI print. European equities underperformed and euro depreciated versus the dollar and the Scandies.
Next week is again a busy one on the central bank front. Early on Monday morning, the PBOC will announce the key policy rate on the 1-year medium-term lending facility. The PBOC has signalled it prefers not to widen the rate spread to the US, which could lead to further depreciation pressure on renminbi. Hence, it is likely they will wait with the next cut until the Fed has kicked off its rate cutting cycle. The RBA will follow suit with a rate decision on Tuesday and is widely expected to leave the key rate unchanged. Similarly, we expect no changes on monetary policy by the SNB and the BoE on Thursday.
On data front, the week kicks off with the monthly batch of China macro data for May. A key focus will be on retail sales and whether China has any luck spurring more consumption with the new trade-in scheme of old for new consumer goods. In the euro area, the focus will be on the final release of May HICP data on Tuesday as well as the ZEW index from Germany. The highlight of the week will be the flash June PMIs due on Friday. The composite PMI has now been above 50 for three months in a row and we expect this to be the case also in June. In the US, we get May retail sales and industrial production data on Tuesday, and similarly to Europe, also the flash PMIs on Friday.
EUR/USD: Extends Steep Fall as Political Uncertainty Sours the Sentiment
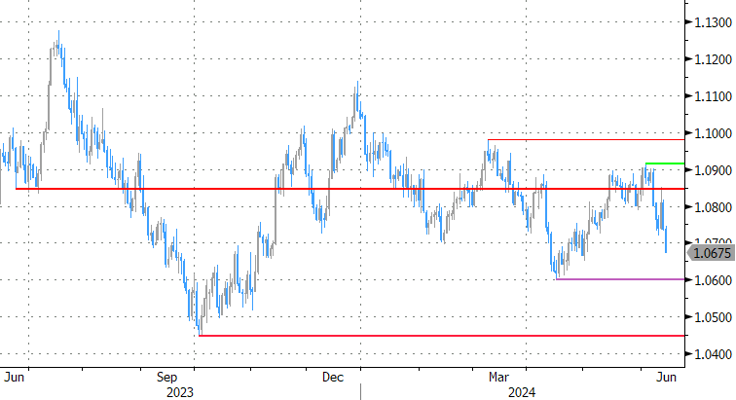
EURUSD extends sharp fall into second straight day and trading near the lowest in 1 ½ month low on Friday.
Fresh risk aversion on growing political uncertainty in France, with tremors hitting the whole euro-bloc, put the single currency under strong pressure.
The pair lost 1.1% of its value in just two days, raising prospects for further weakness on deteriorating fundamental environment and bearish technical picture.
Two massive bearish daily candles (Thu/Fri) weigh, along with surge through daily cloud and close well below cloud base and Thursday’s bearish engulfing.
The pair is on track for the second consecutive weekly loss, with long upper shadows of the last two weekly candles, pointing to increased offers.
Strong negative momentum and MA’s in full bearish setup, also contribute to scenario.
Partial profit-taking should be anticipated after recent heavy losses, though upticks are expected to be limited, due to very negative sentiment and offer better selling levels.
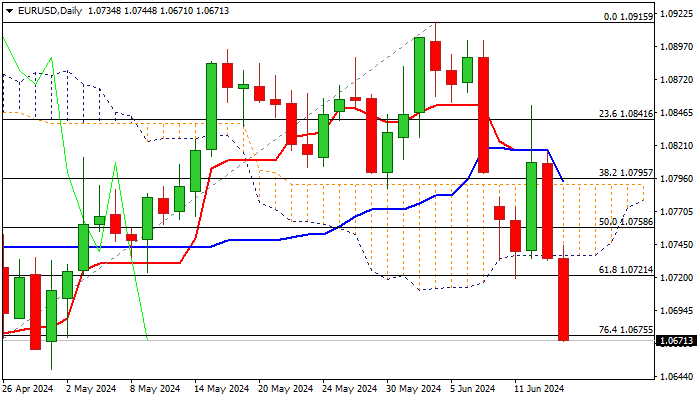
Daily cloud base (1.0737) should ideally cap upticks.
Res: 1.0720; 1.0737; 1.0774; 1.0785.
Sup: 1.0649; 1.0624; 1.0601; 1.0526.
Sunset Market Commentary
Markets
Outright risk-off from the start of trading today. French President Macron’s parliamentary election bet culminated in the current risk climate. The French president’s approval rating hit an air pocket and his Renaissance party is burnt. Nobody, stretching from left to right on the political aisle wants to join forces with the stigmatized French president going into the elections. It only raises the odds of a strong showing for the extremes. French FM Le Maire warned that a victory by the new left-wing alliance would lead to the country’s EU exit as its programme would cause an economic collapse. Risk aversion was already visible in weaker stock markets, an ailing euro and rising sovereign credit spreads. Today, basis swap risk added another layer with markets scrambling for USD liquidity. That’s a common phenomenon in global financial crises, but likely a first time just because of the European election risk. In any case, it pushed EUR/USD below the 1.07 barrier for the first time since early May. The race to the YTD low at 1.0601 remains on. EUR/GBP touched 0.84 before rebounding to 0.8430 in the current environment and with next week’s Bank of England meeting looming as (GBP) event risk. European stock markets lose another 1%-2% with the French CAC 40 underperforming (-2.36%). That makes a cumulative 6% for the week. The 10-yr French/swapspread breached 40 bps (41 currently) for the first time since H2 2012. German Bunds are back as preferred safe haven asset with German yields dropping over 10 bps across the curve, massively outperforming US Treasuries. US yields shed 1.4 bps (2-yr) to 3.2 bps (30-yr). Today’s eco calendar was empty with University of Michigan consumer confidence due later today. ECB President Lagarde is scheduled to speak after European close but already sparred with the press. For the moment she stuck with the tune that the disinflationary path will be bumpy in H2 meaning that policy rates aren’t on a pre-set path mower.
News & Views
The Bank of England/Ipsos quarterly inflation attitudes survey showed expected inflation over the coming year at 2.8% down from 3% in May. Current inflation was seen at 5.5% from 6% (headline inflation in fact was 2.3% in April, core 3.9%). The median answer for inflation in the longer term was unchanged at 3.1%. With respect to the future path on interest rates, 34% expected higher rates over the next 12 months. 42% (from 41%) expect rates to go down. Regarding the impact of interest rates on their personal situation, 24% of respondents assessed it would be better if interest rates were to ‘go up’, up from 23%. 31% of respondents said it would be better if interest rates were to ‘go down’. Asked to assess the way the Bank of England is ‘doing its job to set interest rates to control inflation’, the net satisfaction balance, was -4%, up from -5% in February 2024. Inflation expectations are important input when the BoE meets next Thursday. On Wednesday, the May UK CPI data also are still scheduled for release.
The Swedish disinflation process slowed in May. CPIF inflation (with a fixed interest rate, preferred measure of the Riksbank) increased 0.2% M/M and 2.3% Y/Y (unchanged from April), but a further decline of -0.1%M/M to 2.1% was expected. Core CPIF (excluding energy) even reaccelerated to 0.8 % M/M and 3% Y/Y (0.4% M/M and 2.9% Y/Y expected). Transportation services (6%), accommodation services (+11.2%), package holidays (19.7%) and food (0.5%) recorded price rises. At the same time, overall inflation was dampened by a sharp decline in electricity (-13.3%) and fuel prices (-2.9%). In its March monetary policy report, the Riksbank expected CPIF inflation to return to 2% by the middle of this year and to hold near that level. The Riksbank meets next on June 27, with a new monetary policy report (including new forecasts) at its disposal. As there are indications that at least part of the jump in services inflation in May might have been due to one-offs, it probably won’t profoundly change the RB’s inflation assessment. The RB might thus maintain guidance on two additional rate cuts later this year. After a protracted EUR/SEK decline since early May, the rise of the krone this week slowed. There was no sustained reaction to the May CPI data (EUR/SEK 11.27). EUR/SEK 11.15 and especially the 11.00 area are important support levels.
Graphs
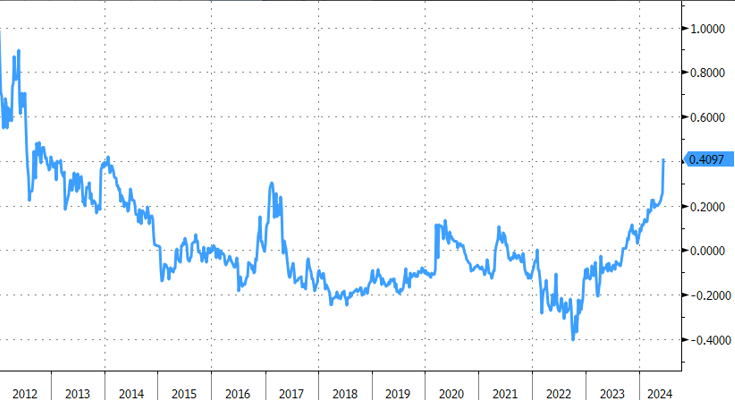
Cac40: French/EU political risk exhibit A
10yr OAT/swapspread: French/EU political risk exhibit B
EUR/USD: French/EU political risk exhibit C
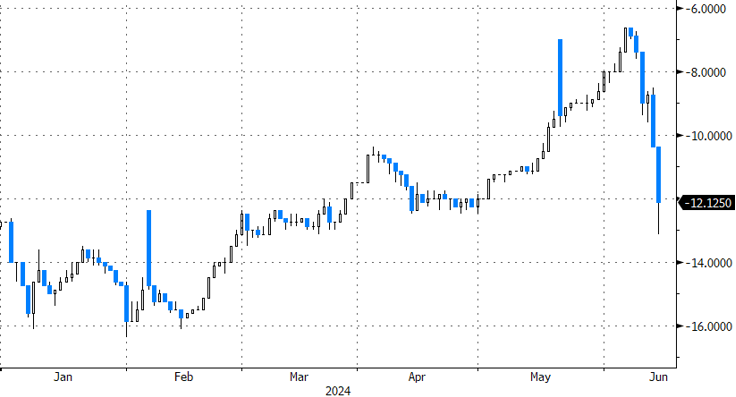
EUR/USD basisswap (Estr v sofr, 3y): French/EU political risk exhibit D
Fed’s Mester urges caution despite positive inflation data
Cleveland Fed President Loretta Mester expressed cautious optimism in an CNBC interview today, acknowledging the positive trend in the latest May CPI data. "It is welcome to see that inflation is moving back down again," Mester stated.
However, she stressed the need for sustained improvement, adding, "I would want to see a few more months of good inflation data: inflation coming down, the short-run inflation expectations starting to move down."
Mester emphasized that before considering rate cuts, it is crucial to observe consistent data across multiple indicators. "And then you need to start thinking about, 'OK, this might be the right panoply of data, and portfolio of data — what's going on in the labor market, what's going on in inflation — to move rates down,'" she said.
USD/JPY Mid-Day Outlook
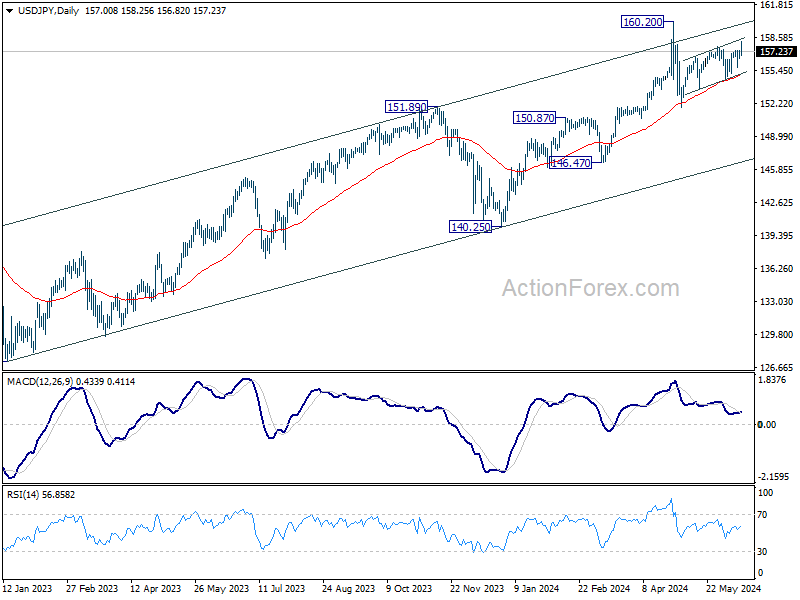
Daily Pivots: (S1) 155.84; (P) 156.61; (R1) 157.49; More...
Intraday bias in USD/JPY stays on the upside at this point. Choppy rise from 151.86 would continue to retest 160.20 high but strong resistance could be seen there to limit upside. On the downside, below 156.57 minor support will turn intraday bias neutral first.

In the bigger picture, a medium term top should be formed at 160.20. As long as 55 W EMA (now at 147.77) holds, fall from 160.20 is seen as correcting the rise from 140.25 only. However, sustained break of 55 W EMA will argue that larger correction is possibly underway, and target 146.47 support next.
USD/CHF Mid-Day Outlook
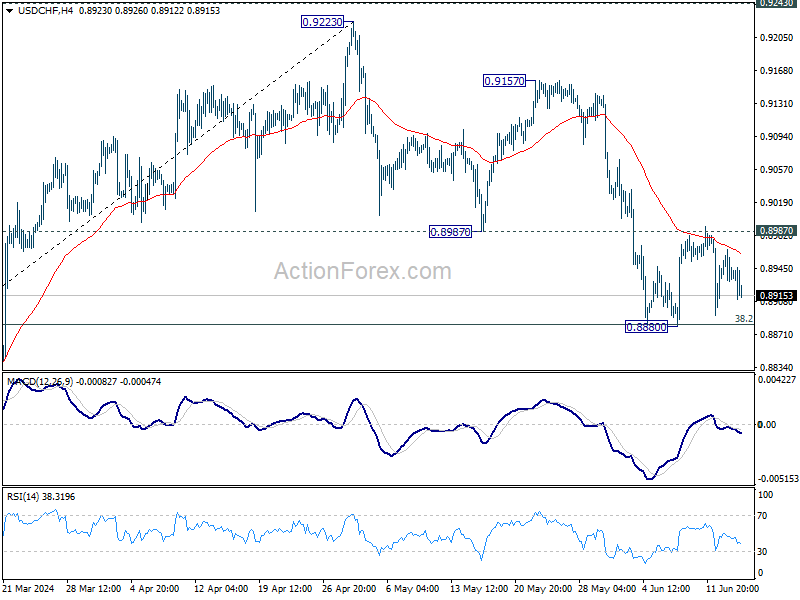
Daily Pivots: (S1) 0.8921; (P) 0.8945; (R1) 0.8962; More….
Range trading continues in USD/CHF and intraday bias remains neutral. On the downside, sustained break of 0.8883 fibonacci level will carry larger bearish implications and bring deeper decline. On the upside, firm break of 0.8987 support turned resistance will argue that correction from 0.9223 has completed, after drawing support from 0.8883 fibonacci level. Intraday bias will be back on the upside for 0.9157/9223 resistance zone.
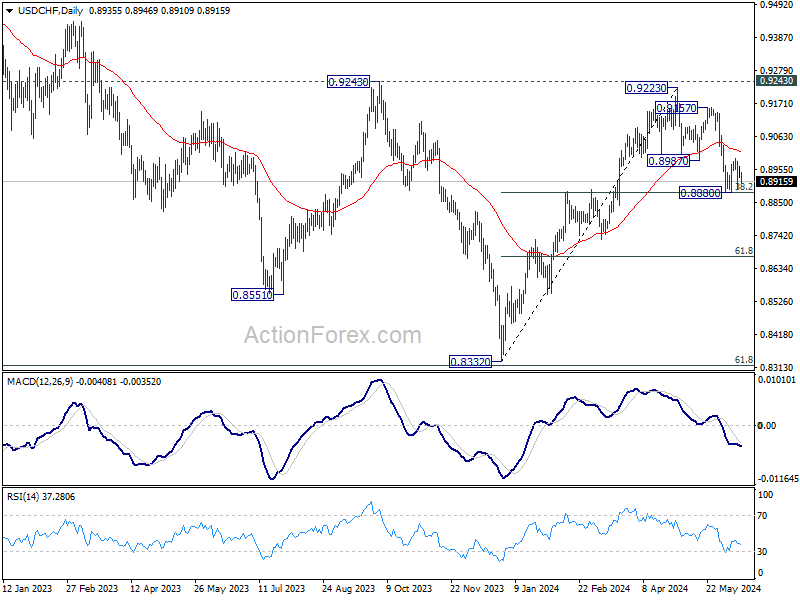
In the bigger picture, price actions from 0.8332 medium term bottom are tentatively seen as developing into a corrective pattern to the down trend from 1.0146 (2022 high). Rejection by 0.9243 resistance, followed by sustained break of 38.2% retracement of 0.8332 to 0.9223 at 0.8883 will strengthen this case, and maintain medium term bearishness. However, decisive break of 0.9243 will argue that the trend has already reversed and turn medium term outlook bullish for 1.0146.
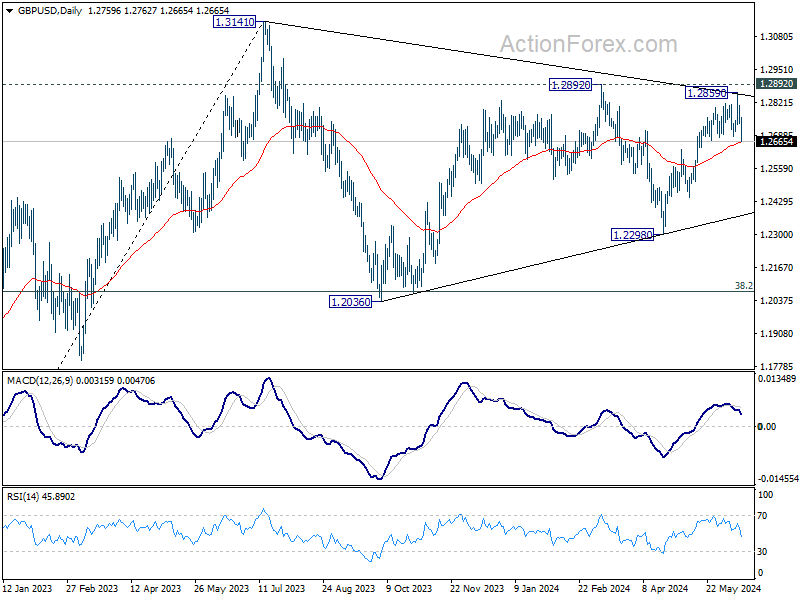
GBP/USD Mid-Day Outlook
Daily Pivots: (S1) 1.2732; (P) 1.2770; (R1) 1.2802; More...
GBP/USD's break of 1.2687 support argues that rise from 1.2298 might have completed at 1.2859, on bearish divergence condition in 4H MACD. Intraday bias is back on the downside fro 1.2633 resistance turned support first. Firm break there will target 1.2445 and below. For now, risk will be on the downside as long as 1.2859 resistance holds, in case of recovery.
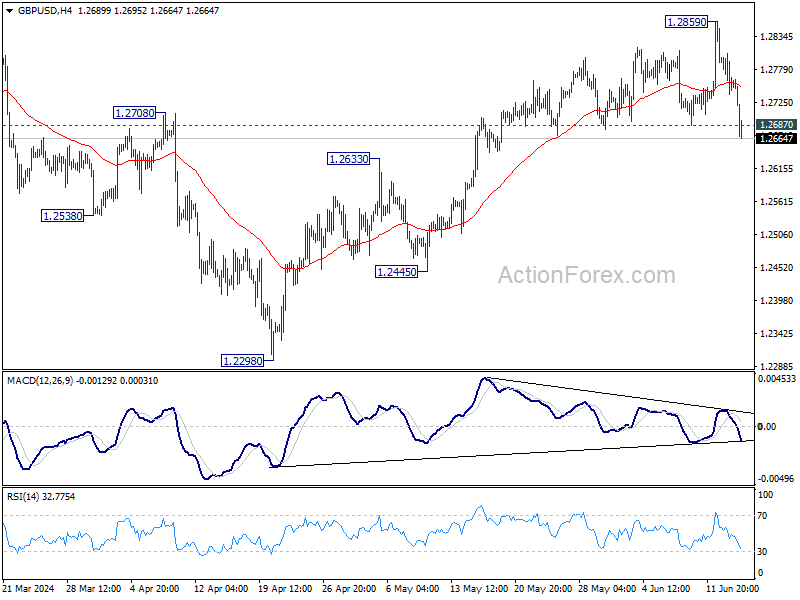
In the bigger picture, price actions from 1.3141 medium term top are seen as a corrective pattern. Fall from 1.2892 is seen as the third leg which might have completed already. Break of 1.2892 resistance will argue that larger up trend from 1.0351(2022 low) is ready to resume through 1.3141. Meanwhile, break of 1.2445 support will extend the corrective pattern with another decline instead.