Sample Category Title
EUR/GBP Daily Outlook
Daily Pivots: (S1) 0.8408; (P) 0.8425; (R1) 0.8452; More...
Intraday bias in EUR/GBP remains neutral and some more consolidations could be seen above 0.8396 temporary low. But outlook will remain bearish as long as 0.8482 support turned resistance holds. Below 0.8396 will resume larger down trend to 0.8376 projection level next.
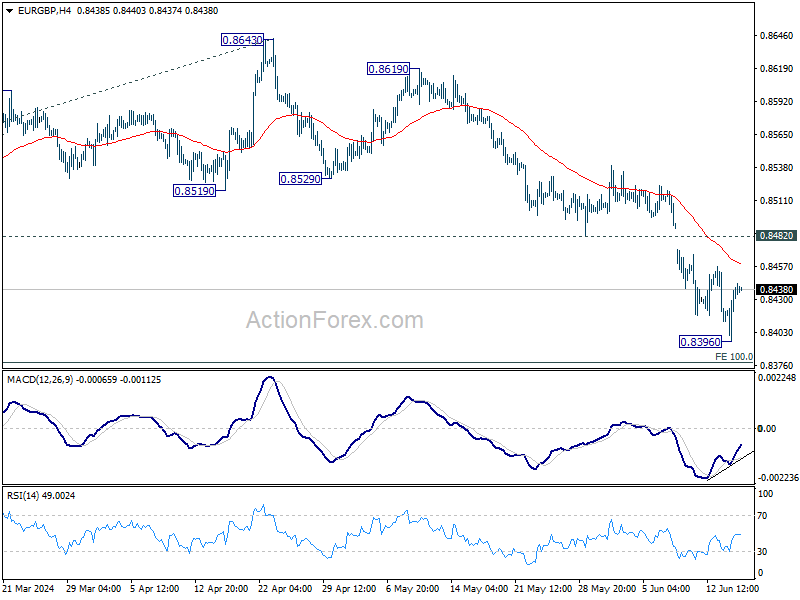
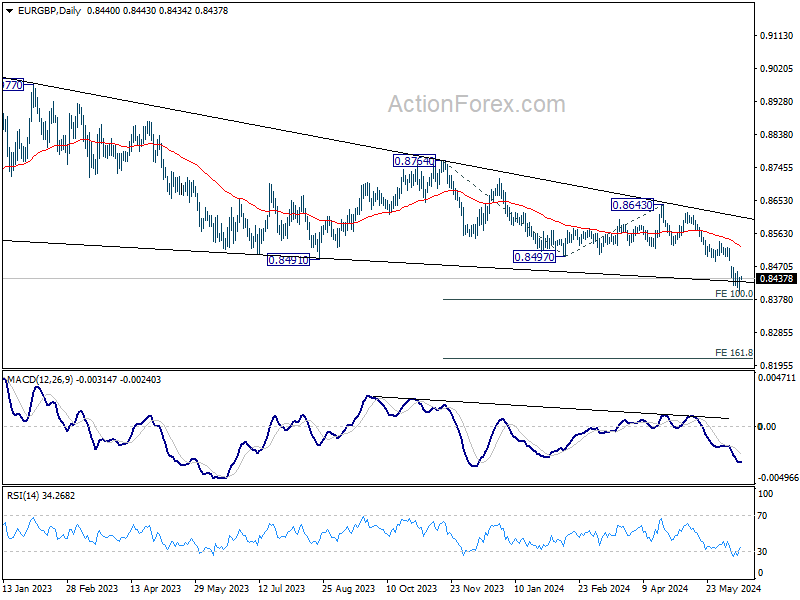
In the bigger picture, down trend from 0.9267 (2022 high) is in progress. Next target is 100% projection of 0.8764 to 0.8497 from 0.8643 at 0.8376. Sustained break there will target 161.8% projection at 0.8211 next. For now, outlook will remain bearish as long as 0.8643 resistance holds, even in case of stronger rebound.
Weekend Digest and a Quiet Start to the Week
In focus today
It will be a quiet start to the week on the data front. From Sweden, we get the Riksbank's Business Survey. Overnight, the Reserve Bank of Australia (RBA) is widely expected to leave monetary policy unchanged. Markets price in the first rate cut only for May 2025.
French politics will continue to be in focus this week. On Tuesday 18 June at 10:00 CEST we will host a webinar on the French election and the impact on markets (in Danish).
On Thursday, Norges Bank, the BoE, and the SNB will announce their monetary policy decisions. We expect all three central banks to keep rates unchanged, at 4.50%, 5.25%, and 1.50%, respectively. On Friday, we watch for June PMIs from the euro area and the US.
Economic and market news
What happened over the weekend
In France, on Friday markets were left spooked by the prospects of an uncertain French election outcome. A poll showing support for both the left- and right-wing coalitions was interpreted as continued uncertainty about French public finances, since both sides have large unfunded spending plans. This sent yield spreads lower with the DE10Y-FR10Y down 10bps. Then, over the weekend cracks started to appear in the left wing "Popular Front" alliance as far-left party leader Mélenchon removed critics and opponents of the alliance from his party's list of candidates. This resulted in members of other parties in the alliance questioning whether they could work with Mélenchon due to his "undemocratic" methods. However, on Sunday Mélenchon regained some of the coherence of the left-wing alliance by saying he would not insist on running as candidate for the prime minister of the alliance - which has previously been a key dividing factor in the alliance.
In geopolitics, the overall message from the G7 meeting in Italy, which ended Saturday, was a continued tough-on-Russia stance. Leaders agreed to a USD 50bn loan for Ukraine set to arrive towards the end of the year, while threatening further sanctions on Chinese entities that are supporting the war effort.
In China, the PBOC kept its one-year MLF loan rate unchanged at 2.50%, as widely expected. May industrial output came in slightly lower than expected at +6.0% y/y (cons.: 5.6%), while retail sales surprised to the upside at 3.7% y/y (cons.: 3.0%). The market reaction was mostly muted, though Chinese blue-ship stocks edged slightly higher.
What happened on Friday
Swedish inflation came in higher than expected as the CPI increased 0.2% m/m (cons.: -0.1%) in May. The main contributors were volatile food and flight prices, while service inflation had a setback. Overall, we see the factors contributing to this month's increase as temporary and maintain our Riksbank call with the next cut in September, followed by a 25bp cut every quarter bringing the policy rate to 2.25% at the end of 2025.
US consumers were much gloomier than expected as the flash University of Michigan consumer sentiment survey printed at 65.6 (cons.: 72.0). The market reaction was muted, however.
Market movements
Equities: Global equities ended lower on Friday, capping off a week dominated by political chaos in France and a US disinflationary environment that bolstered faith in Federal Reserve cuts, despite a slightly hawkish Summary of Economic Projections (SEP). Given the US's dominating size, equities still finished higher last week, driven by cyclical outperformance. In essence, US tech was the only game in town, while Europe and financial sectors significantly underperformed. Last week alone, tech outshone financials by a remarkable 8%. In the US on Friday, the Dow was down by 0.2%, S&P 500 decreased by 0.04%, Nasdaq increased by 0.1%, and Russell 2000 fell by 1.6%. Asian markets are trending lower this morning together with US futures. European futures are on the rise.
FI: It has been a very volatile week after the EU parliamentary elections and President Macron calling for a snap election for the French parliament after his party suffered a significant election loss and the nationalist party lead by Marine Le Pen won the EU parliamentary election. The 10Y spread between France and Germany widened almost 30bp during last week to reaching 80bp. This is similar to the level we saw ahead of the presidential election in 2016-2017, when Marine Le Pen argued for a"“Frexi"”. However, Le Pen stated during the weekend that she does not want to create a chaotic situation and the risk of Frexit seems very limited.
FX: EUR crosses remained heavy under pressure during Friday's session driven by uncertainty in European politics, most notably against the CHF and the USD. The news that the left-wing parties have formed an alliance to challenge Macron is likely the reason for the growing anxiety in the market about political uncertainty. USD/JPY edged slightly higher following the BoJ's decision to reduce bond purchases, which was interpreted as dovish. Later this week we look forward to the Norges Bank, Swiss National Bank and Bank of England meeting on Thursday.
Not So Cheery
Last week was brilliant for the major US indices but gloomy elsewhere. The S&P500 was slightly down on Friday, but the index posted its best weekly advance in a month on the back of a surprise easing in CPI figures and a not-too-hawkish Federal Reserve (Fed) statement. Nasdaq, on the other hand, closed last week having renewed record every session. The AI rally was fruitful.
Elsewhere than AI however, things were less cheery. SPDR’s energy sector fund for example continued to diverge negatively last week and fell around 3% over the course of the week as the negative divergence of the financials became more evident. The Russell 2000 fell to the lowest levels since May and US crude is consolidating near $78pb. It looks like the positive momentum is dying out.
And beyond the US, sentiment is gloomy: stocks in the Chinese CSI 300 fell below their 200-DMA and extended losses to more than 5% since the May peak. The latest data showed that home prices there slid at a faster pace in May despite all the efforts that the Chinese government puts in to stop the bleeding and industrial production slowed significantly more than expected, as well, during the same month. The People’s Bank of China (PBoC) is expected to maintain its rates unchanged this week, but some economists at Bloomberg believe that the week could bring a 10bp cut in China to prop things up.
Japanese stocks took a dive this morning to lowest levels in more than two weeks; even the Bank of Japan’s (BoJ) accommodative stance couldn’t cheer up investors on Friday.
Stocks in Europe lost 3% during the course of last week as the French election jitters ended in tears for the French CAC 40 which tumbled more than 6% compared to the previous Friday’s close. As a result, in only one week time, the French stocks lost all their 2024 gains, slipped below a major Fibonacci level – which is the 38.2% retracement on last October to this year rally, and are now in the bearish consolidation zone. And there is only more political turmoil ahead of us. The weekend hasn’t been about relaxing and enjoying a fresh glass of rosé in France. Thousands of people took the streets to show their opposition to the far right’s rise – but Marine Le Pen’s party is still seen amassing more than 30% of the votes in the upcoming legislative elections. And because conservative policies never bode well with investment prospects, we will likely see French markets under a continued pressure this week. The spread between the French and German 10-year yield spiked past 80bp, the highest since the debt crisis that hit the Eurozone more than a decade ago.
In this context, the US big technology companies don’t only offer a beautiful dream but also act as a safe haven to investors who don’t necessarily want to deal with the political and geopolitical tensions around the world. The US dollar also gain momentum to the upside on safe haven inflows. The dollar index successfully held ground at the major 38.2% Fibonacci support on ytd rebound, has brushed off the post-April weakness and looks ready to extend gains toward the upside. The EURUSD tanked below 1.0670 on Friday and is trying to hold on near the 1.07 level, but the French political turmoil and the widening yield gap remain supportive of further losses in the single currency. An extension of the selloff toward the 1.05 level wouldn’t be overstretched. In Japan, the USDJPY has no reason to reverse losses given the BoJ’s reluctant stance regarding any policy normalization. It looks like Japan will never have a normal monetary policy ever again. In the UK, Cable also kicks off the week on a negative note.
The week will be interesting for the UK. The latest British inflation numbers are due on Wednesday and the Bank of England (BoE) decision is due on Thursday. Inflation may have eased to the 2% in May in Britain, right to the BoE’s policy target, but the BoE is not expected to cut rates before the July general election, and inflation is seen rebounding toward 2.5% in the second half, anyway. But a sufficiently soft inflation read and a sufficiently soft BoE statement could fuel the expectation of a cut in September - and one more in December, and encourage the sterling bears to push Cable into a medium term bearish consolidation zone, as well. The 1.2645 is the key Fibonacci support that should distinguish between the continuation of the actual positive trend and a bearish reversal.
Else, the Reserve Bank of Australia (RBA) will also give its latest policy verdict tomorrow and is expected to maintain the rates unchanged and keep its relatively cautious stance regarding inflation. The AUDUSD remains in the positive trend, supported by a relatively hawkish RBA and the reflation inflows, but the bulls could rapidly get caught on the wrong side of the trade if we see a slide below the 0.6580 level.
EUR/AUD Daily Outlook
Daily Pivots: (S1) 1.6143; (P) 1.6181; (R1) 1.6212; More...
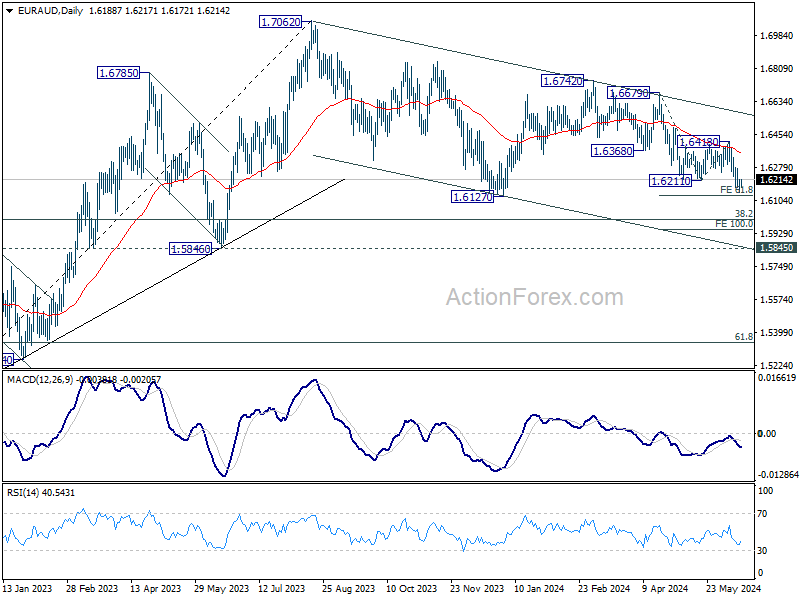
Intraday bias in EUR/AUD is turned neutral first with current recovery. Some consolidations could be seen above 1.6148. But outlook will stay bearish as long as 1.6418 resistance holds. Firm break of 61.8% projection of 1.6679 to 1.6211 from 1.6418 at 1.6129 will pave the way to 100% projection at 1.5950.
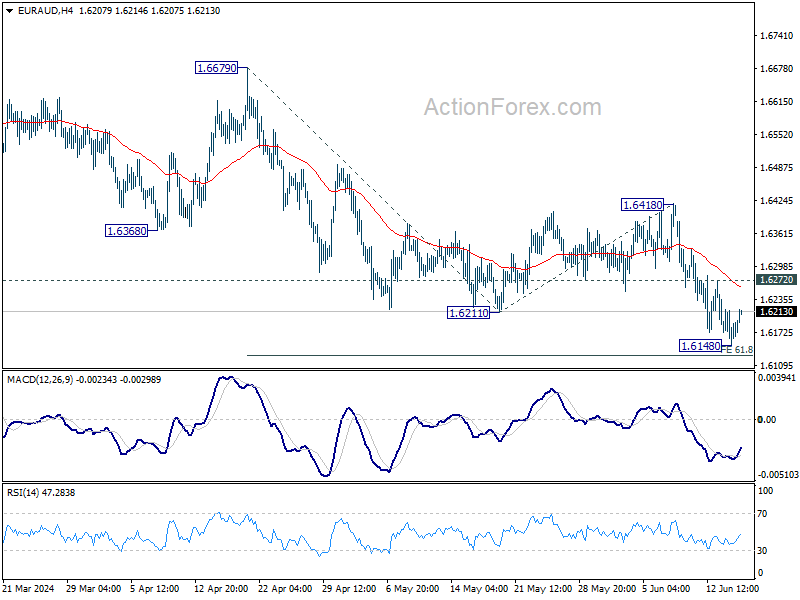
In the bigger picture, fall from 1.7062 medium term top is seen as a correction to the up trend from 1.4281 (2022 low). In case of deeper fall, strong support is expected around 1.5846 and 38.2% retracement of 1.4281 to 1.7062 at 1.6000 to bring rebound. Break of 1.7062 is in favor as a later stage.
Euro Finds Stability, Markets Anticipates Turbulent Week Ahead
The forex markets are pretty steady in Asian session today, with Euro stabilizing from its previous sharp sell-off. Meanwhile, Dollar and Yen are posting modest gains. In contrast, commodity currencies showed less resilience, and Swiss Franc surrendered some of its recent strong gains. British Pound demonstrated mixed performance. A noticeable characteristic of today's market is the low activity level, with most major currency pairs and crosses stuck inside last Friday's trading range.
This subdued activity may continue throughout the rest of Monday. However, the market is expected to become more volatile in the coming days due to several key economic events. Meetings of the RBA, SNB and BoE are scheduled, each with the potential for market-moving surprises. Additionally, BoJ and BoJ will release their meeting minutes. Economic data releases, including inflation figures, retail sales, and PMI data from major economies, will also contribute to the market dynamics.
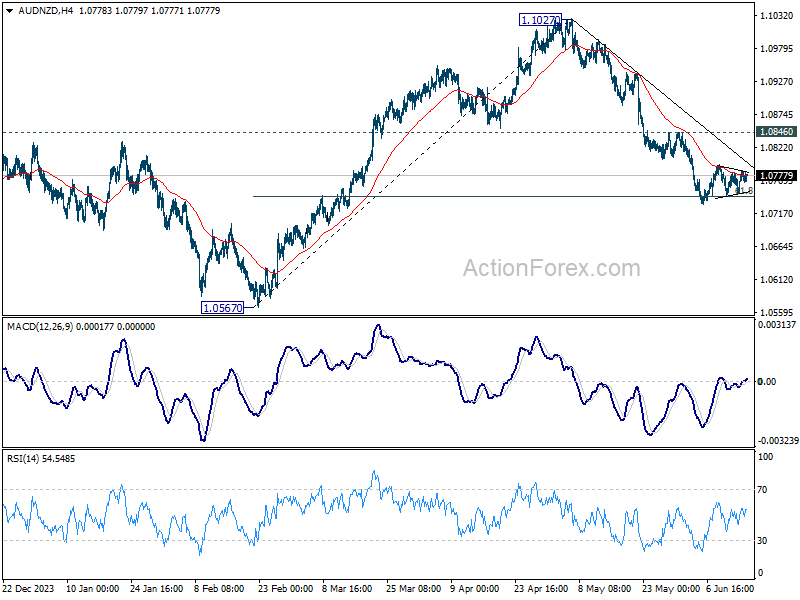
Technically, AUD/NZD continues to draw support from 61.8% retracement of 1.0567 to 1.1027 at 1.0743, but lacks momentum for sustainable rebound yet. While more hawkish than expected RBA could push AUD/NZD higher, outlook will continue to stay bearish as long as 1.0846 resistance holds. Meanwhile, in case of fall resumption on more dovish than expected RBA, sustained trading below 1.0743 will pave the way back to 1.0567 low.
In Asia, at the time of writing, Nikkei is down -2.16%. Hong Kong HSI is up 0.06%. China Shanghai SSE is down -0.55%. Singapore Strait Times is down -0.81%. Japan 10-year JGB yield is down -0.006 at 0.932.
Fed's Kashkari points to late-year rate cut
Minneapolis Fed President Neel Kashkari indicated in a CBS interview over the weekend that any interest rate cut is likely be towards the end of the year.
Kashkari emphasized the necessity of gathering "more evidence" to ensure inflation is on a downward trend toward Fed's target of 2%.
"We're in a very good position right now to take our time, get more inflation data, get more data on the economy, on the labor market, before we have to make any decisions on cutting interest rates," he added.
If a rate cut is to occur, it would likely be towards the end of the year, aligning with the median forecast.
NZ BNZ services falls to 43, unprecedented contraction
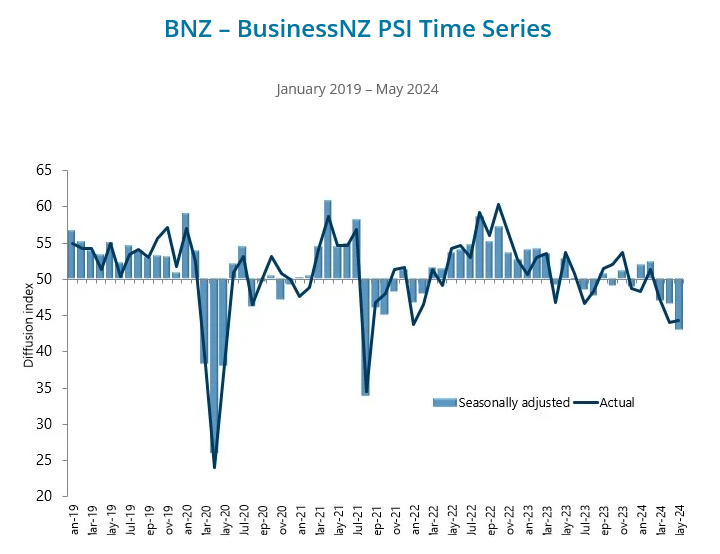
New Zealand's BusinessNZ Performance of Services Index dropped significantly from 46.6 to 43.0 in May, marking the lowest level of activity for a non-COVID lockdown month since the survey's inception in 2007.
BusinessNZ Chief Executive Kirk Hope described the May result as "as bad as it can get" for the sector, with contraction levels surpassing those seen during the Global Financial Crisis of 2008/09.
Examining the details, key metrics reveal a stark downturn. Activity/sales fell from 46.0 to 40.9, employment dropped from 47.0 to 46.0, new orders/business decreased from 46.6 to 42.6, stocks/inventories declined from 46.2 to 42.4, and supplier deliveries slid from 47.5 to 46.1.
The proportion of negative comments in May (65.4%) remained similar to April (66.3%), indicating persistent concerns about the economic downturn.
BNZ's Senior Economist Doug Steel noted, "the speed of decline is as worrisome as its size over the past three months. There is weak and then there is very weak. Overall, this tells of a services sector in reverse, at pace."
China's industrial production up 5.6% yoy in May, misses exp 6.0% yoy
China's industrial production increased by 5.6% yoy in May, falling short of the expected 6.0% yoy and slowing from April's 6.7% yoy. Despite this overall slowdown, the equipment and high-tech manufacturing sectors showed robust growth, with outputs rising 7.5% yoy and 10% yoy, respectively.
Fixed asset investment grew by 4.0% year-to-date yoy, slightly below the anticipated 4.2%. Within this sector, property development investment notably declined by -10.1%, reflecting ongoing challenges in China's real estate market.
On a positive note, retail sales rose by 3.7% yoy, surpassing the expected 3.0%. This indicates resurgence in the consumer sector, which could provide a buffer against the broader economic slowdown.
Intense week ahead: RBA, SNB, BoE, CPI, retail sales, PMIs and more
The upcoming week promises to be exceptionally busy for global financial markets, with three central bank meetings, the release of minutes from two others, and a plethora of important economic data across major economies.
RBA is set to hold its policy meeting on Tuesday, with widespread expectations that it will maintain official cash rate at 4.35%. A recent Reuters poll, which surveyed 43 economists, unanimously anticipates RBA to keep rates steady, with a near 90% consensus projecting no change for the next quarter too. However, expectations are leaning towards a 25 bps rate cut in the fourth quarter. Currently,The bar for another rate hike by RBA appears high for now. Given the current economic climate, RBA is likely to maintain its flexible stance of "not ruling anything in or out," thereby keeping market participants alert and prepared for any shifts, while continuing to address still-elevated inflation levels by holding interest rate at current level for longer.
SNB faces a more complex decision. Earlier this month, SNB President Thomas Jordan highlighted the inflationary risks associated with the depreciation of Swiss Franc, which could be addressed by market intervention. This would typically suggest a cautious approach with unchanged interest rates. However, the Franc's strong rally last week—spurred by the political crisis in France and ongoing uncertainty in the EU—might provide SNB enough room to consider a second rate cut this year to 1.25%.
Looking towards BoE, while the path towards policy easing is evident, the timing of the first rate cut is not expected this June, especially with the general election looming on July 4. A Reuters poll indicates that most economists foresee the first rate cut occurring in August, with predictions of a total of two 25 bps reductions by the end of 2024, bringing Bank Rate down from 5.25% to 4.75%. A significant number also anticipate a more aggressive cut totaling 75bps. This meeting's focus will be on whether additional Monetary Policy Committee members will join Dave Ramsden and Swati Dhingra in voting for a rate cut.
In terms of central bank communications, BoJ and BoC will publish their meeting minutes, providing further insight into their respective policy discussions. ECB is also set to release its monthly economic bulletin.
On the data front, the week is loaded with key releases: CPI data from the UK and Japan; retail sales figures from Canada, the UK, and the US; and PMIs from Australia, Japan, the Eurozone, the UK, and the US. Additionally, Germany's ZEW economic sentiment index and New Zealand's GDP data will be closely watched too.
Here are some highlights for the week:
- Monday: New Zealand BNZ services index; Japan machine orders; China industrial production, retail sales, fixed asset investment; Swiss SECO economic forecasts; Canada housing start; US Empire state manufacturing index.
- Tuesday: RBA rate decision; Eurozone CPI final; German ZEW economic sentiment; US retail sales, industrial production, business inventories.
- Wednesday: Japan trade balance, BoJ minutes; UK CPI, PPI; Eurozone current account; US NAHB housing index; BoC summary of deliberations.
- Thursday: New Zealand GDP; Swiss trade balance, SNB rate decision; ECB monthly bulletin; BoE rate decision; US jobless claims, Philly Fed survey, housing starts and building permits.
- Friday: Japan CPI, PMIs; UK retail sales, PMIs; Eurozone PMIs; Canada retail sales; US PMIs, existing home sales.
EUR/AUD Daily Outlook
Daily Pivots: (S1) 1.6143; (P) 1.6181; (R1) 1.6212; More...
Intraday bias in EUR/AUD is turned neutral first with current recovery. Some consolidations could be seen above 1.6148. But outlook will stay bearish as long as 1.6418 resistance holds. Firm break of 61.8% projection of 1.6679 to 1.6211 from 1.6418 at 1.6129 will pave the way to 100% projection at 1.5950.
In the bigger picture, fall from 1.7062 medium term top is seen as a correction to the up trend from 1.4281 (2022 low). In case of deeper fall, strong support is expected around 1.5846 and 38.2% retracement of 1.4281 to 1.7062 at 1.6000 to bring rebound. Break of 1.7062 is in favor as a later stage.
Economic Indicators Update
| GMT | Ccy | Events | Actual | Forecast | Previous | Revised |
|---|---|---|---|---|---|---|
| 22:30 | NZD | Business NZ PSI May | 43 | 47.1 | 46.6 | |
| 23:01 | GBP | Rightmove House Price Index M/M Jun | 0.00% | 0.80% | ||
| 23:50 | JPY | Machinery Orders M/M Apr | -2.90% | -3.10% | 2.90% | |
| 02:00 | CNY | Industrial Production Y/Y May | 5.60% | 6.00% | 6.70% | |
| 02:00 | CNY | Retail Sales Y/Y May | 3.70% | 3.00% | 2.30% | |
| 02:00 | CNY | Fixed Asset Investment YTD Y/Y May | 4.00% | 4.20% | 4.20% | |
| 07:00 | CHF | SECO Economic Forecasts | ||||
| 12:15 | CAD | Housing Starts Y/Y May | 241K | 240K | ||
| 12:30 | USD | Empire State Manufacturing Index Jun | -13 | -15.6 |
EUR/USD Could Recover If It Clears This Resistance
Key Highlights
- EUR/USD seems to be finding bids near the 1.0675 level.
- A connecting bearish trend line is forming with resistance at 1.0760 on the 4-hour chart.
- GBP/USD trimmed gains and tested the 1.2660 support zone.
- USD/JPY spiked above 158.00 before correcting lower.
EUR/USD Technical Analysis
The Euro started a fresh decline from well above 1.0800 against the US Dollar. EUR/USD declined below the 1.0750 support before the bulls appeared.
Looking at the 4-hour chart, the pair tested the 1.0665 zone. It settled below the 100 simple moving average (red, 4-hour) and the 200 simple moving average (green, 4-hour). A low was formed at 1.0667 and the pair is now consolidating losses.
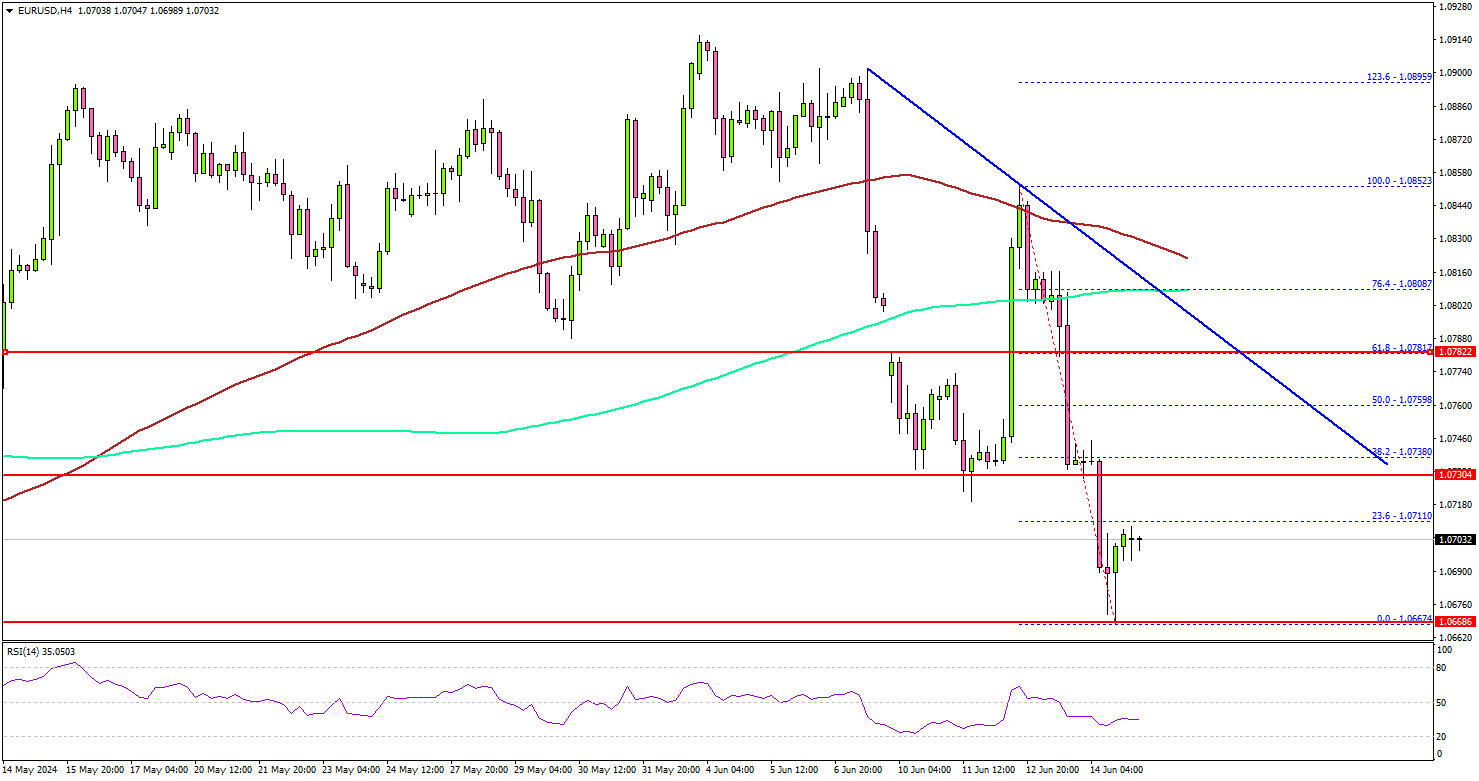
It seems to be finding bids near the 1.0675 level. It is trading close to the 23.6% Fib retracement level of the downward move from the 1.0852 swing high to the 1.0667 low.
The first major resistance is near the 1.0730 level. There is also a connecting bearish trend line forming with resistance at 1.0760. A clear move above the 1.0760 resistance might send it toward the 1.0800 level. Any more gains might call for a move toward the 1.0850 level in the near term.
If not, the pair might dip again. Immediate support is near the 1.0680 level. The next major support is near the 1.0665 zone. A downside break and close below the 1.0665 support zone could open the doors for a larger decline. In the stated case, the pair could decline toward the 1.0620 level.
Looking at GBP/USD, the pair extended gains toward the 1.2840 resistance zone before there was a pullback to the 1.2660 support zone.
Economic Releases
- NY Empire State Manufacturing Index for June 2024 – Forecast -13.0, versus -15.6 previous.
China’s industrial production up 5.6% yoy in May, misses exp 6.0% yoy
China's industrial production increased by 5.6% yoy in May, falling short of the expected 6.0% yoy and slowing from April's 6.7% yoy. Despite this overall slowdown, the equipment and high-tech manufacturing sectors showed robust growth, with outputs rising 7.5% yoy and 10% yoy, respectively.
Fixed asset investment grew by 4.0% year-to-date yoy, slightly below the anticipated 4.2%. Within this sector, property development investment notably declined by -10.1%, reflecting ongoing challenges in China's real estate market.
On a positive note, retail sales rose by 3.7% yoy, surpassing the expected 3.0%. This indicates resurgence in the consumer sector, which could provide a buffer against the broader economic slowdown.
NZ BNZ services falls to 43, unprecedented contraction
New Zealand's BusinessNZ Performance of Services Index dropped significantly from 46.6 to 43.0 in May, marking the lowest level of activity for a non-COVID lockdown month since the survey's inception in 2007.
BusinessNZ Chief Executive Kirk Hope described the May result as "as bad as it can get" for the sector, with contraction levels surpassing those seen during the Global Financial Crisis of 2008/09.
Examining the details, key metrics reveal a stark downturn. Activity/sales fell from 46.0 to 40.9, employment dropped from 47.0 to 46.0, new orders/business decreased from 46.6 to 42.6, stocks/inventories declined from 46.2 to 42.4, and supplier deliveries slid from 47.5 to 46.1.
The proportion of negative comments in May (65.4%) remained similar to April (66.3%), indicating persistent concerns about the economic downturn.
BNZ's Senior Economist Doug Steel noted, "the speed of decline is as worrisome as its size over the past three months. There is weak and then there is very weak. Overall, this tells of a services sector in reverse, at pace."
Fed’s Kashkari points to late-year rate cut
Minneapolis Fed President Neel Kashkari indicated in a CBS interview over the weekend that any interest rate cut is likely be towards the end of the year.
Kashkari emphasized the necessity of gathering "more evidence" to ensure inflation is on a downward trend toward Fed's target of 2%.
"We're in a very good position right now to take our time, get more inflation data, get more data on the economy, on the labor market, before we have to make any decisions on cutting interest rateshe added.
If a rate cut is to occur, it would likely be towards the end of the year, aligning with the median forecast.
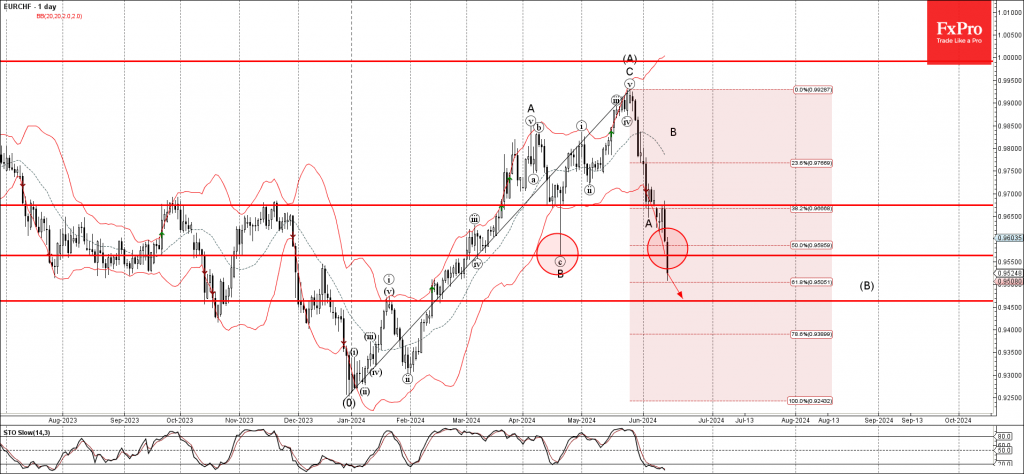
EURCHF Wave Analysis
- EURCHF broke key support level 0.9565
- Likely to fall to support level 0.9450
EURCHF recently broke below the key support level 0.9565, which stopped wave B in April, as can be seen from the daily EURCHF chart below.
The breakout of the support level 0.9565 coincided with the breakout of the 50% Fibonacci correction of the previous upward impulse from December.
Given the strongly bullish Swiss franc sentiment seen across the FX markets today, EURCHF can be expected to fall further to the next support level 0.9450, target for the completion of the active correction (B).