Sample Category Title
EUR/USD Mid-Day Outlook
Daily Pivots: (S1) 1.0666; (P) 1.0705; (R1) 1.0743; More....
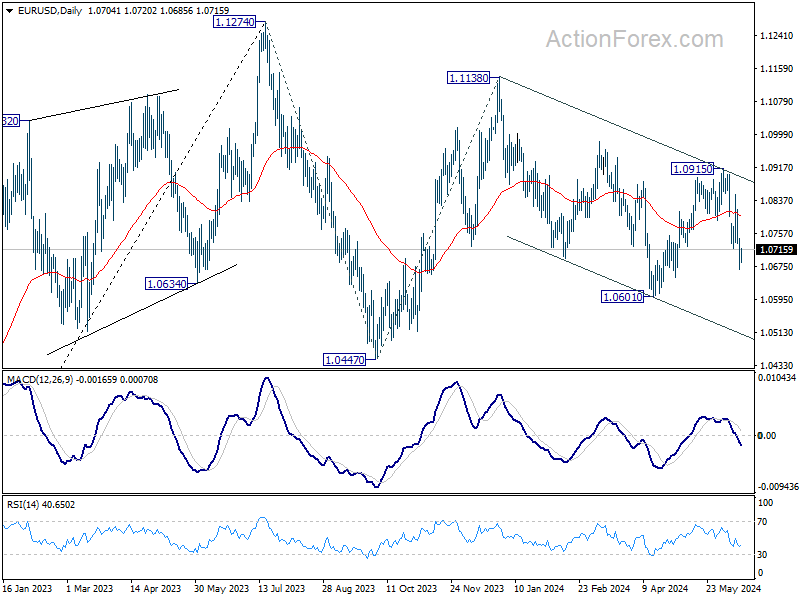
Intraday bias in EUR/USD remains on downside for the moment. Fall from 1.0915 is seen as another leg in the larger corrective pattern. Deeper decline would be seen to 1.0601 low first. Firm break there will target channel support at 1.0510 next. On the upside, above 1.0744 minor resistance will turn intraday bias neutral again first.
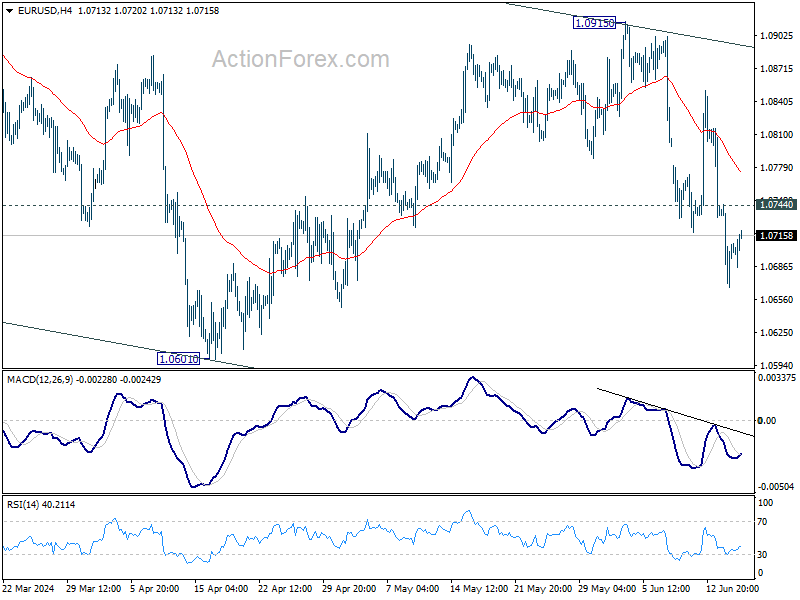
In the bigger picture, price actions from 1.1274 are viewed as a corrective pattern that's still in progress. Break of 1.0601 will target 1.0447 support and possibly further to 100% projection of 1.1274 to 1.0447 from 1.1138 at 1.0311. For now, this will remain the favored case as long as 1.0915 resistance holds, in case of rebound.
GBP/USD Mid-Day Outlook
Daily Pivots: (S1) 1.2640; (P) 1.2702; (R1) 1.2748; More...
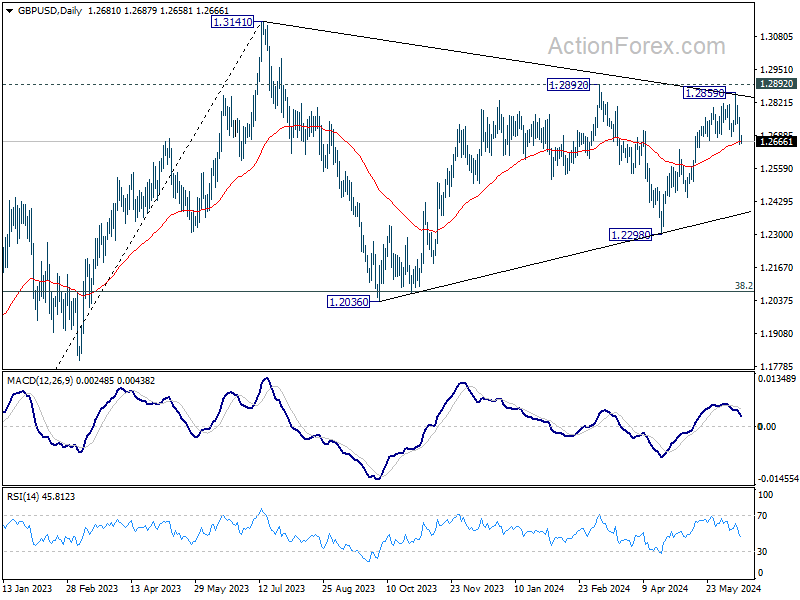
Intraday bias in GBP/USD remains on the downside at this point. Fall from 1.2859 short term top would target 1.2633 resistance turned support first. Firm break there will argue that whole rise from 1.2298 has completed, and target 1.2445 and below. On the upside, above 1.2737 minor resistance will turn intraday bias neutral first. But for now, risk will be on the downside as long as 1.2859 resistance holds, in case of recovery.
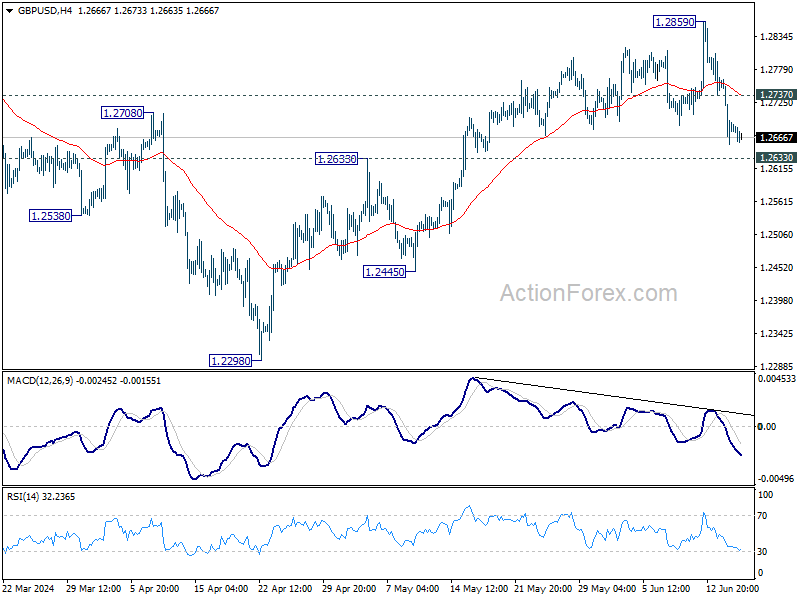
In the bigger picture, price actions from 1.3141 medium term top are seen as a corrective pattern. Fall from 1.2892 is seen as the third leg which might have completed already. Break of 1.2892 resistance will argue that larger up trend from 1.0351(2022 low) is ready to resume through 1.3141. Meanwhile, break of 1.2445 support will extend the corrective pattern with another decline instead.
USD/CHF Mid-Day Outlook
Daily Pivots: (S1) 0.8876; (P) 0.8921; (R1) 0.8946; More….
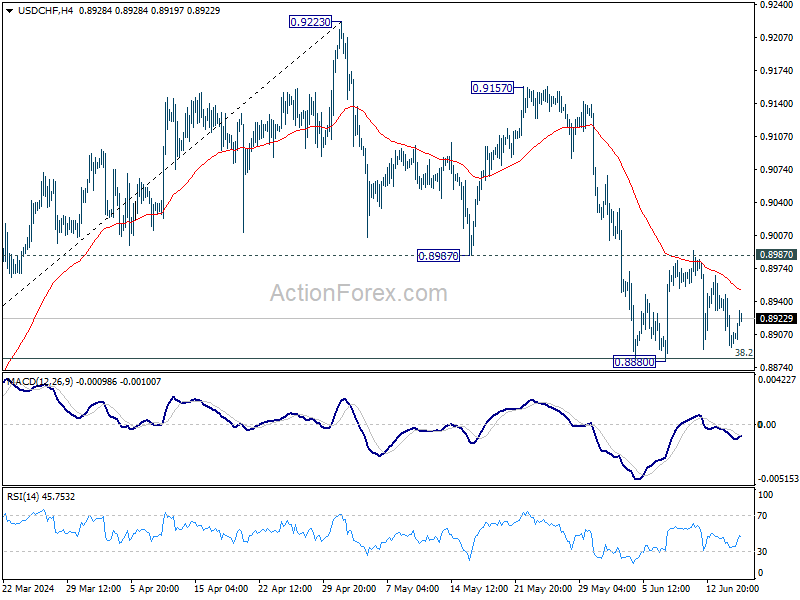
USD/CHF is still bounded in range above 0.8880 and intraday bias stays neutral. On the downside, sustained break of 0.8883 fibonacci level will carry larger bearish implications and bring deeper decline. On the upside, firm break of 0.8987 support turned resistance will argue that correction from 0.9223 has completed, after drawing support from 0.8883 fibonacci level. Intraday bias will be back on the upside for 0.9157/9223 resistance zone.
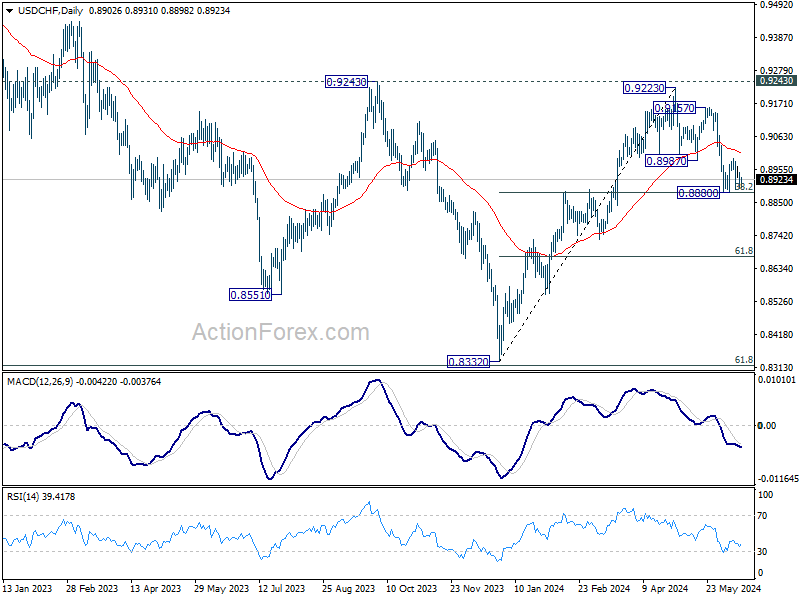
In the bigger picture, price actions from 0.8332 medium term bottom are tentatively seen as developing into a corrective pattern to the down trend from 1.0146 (2022 high). Rejection by 0.9243 resistance, followed by sustained break of 38.2% retracement of 0.8332 to 0.9223 at 0.8883 will strengthen this case, and maintain medium term bearishness. However, decisive break of 0.9243 will argue that the trend has already reversed and turn medium term outlook bullish for 1.0146.
USD/JPY Mid-Day Outlook
Daily Pivots: (S1) 156.73; (P) 157.50; (R1) 158.23; More...
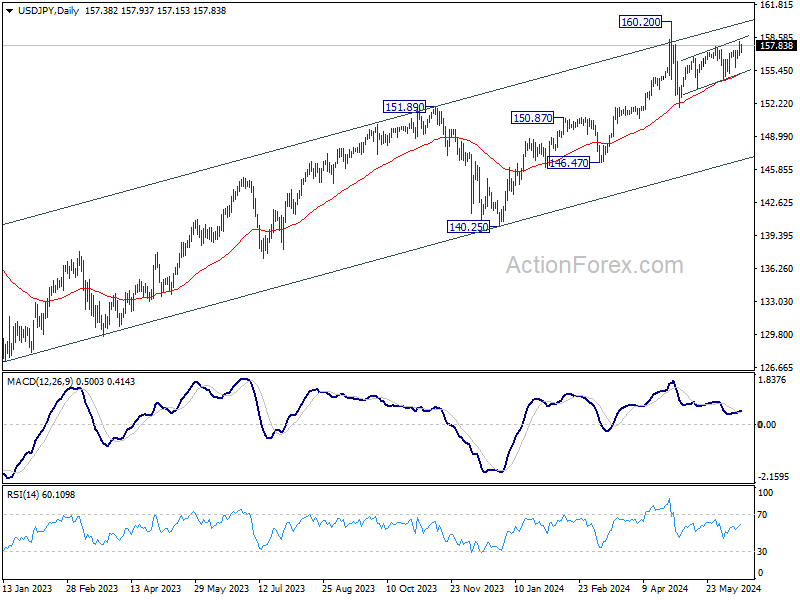
Intraday bias in USD/JPY remains neutral for the moment. Further rally would remain in favor as long as 154.53 support holds. Break of 158.25 will resume the choppy rise from 151.86 towards 160.20 high. But upside should be limited there, at least on first attempt.
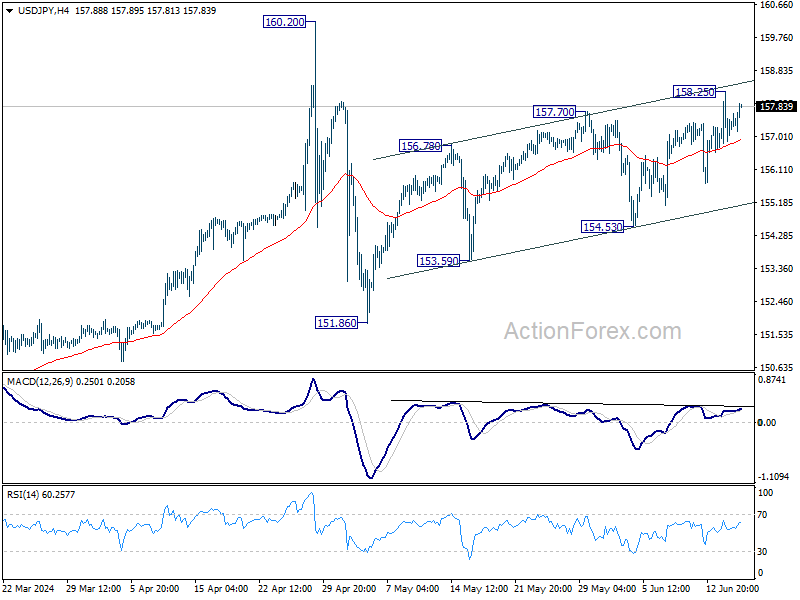
In the bigger picture, price actions from 160.20 medium term top are seen as a corrective pattern to rise from 150.25 only. Another rally is still expected at a later stage through 160.02 to resume the larger up trend. However, decisive break of 150.87 will argue that larger correction is possibly underway, and target 146.47 support next.
AUD/USD Mid-Day Report
Daily Pivots: (S1) 0.6590; (P) 0.6617; (R1) 0.6643; More...
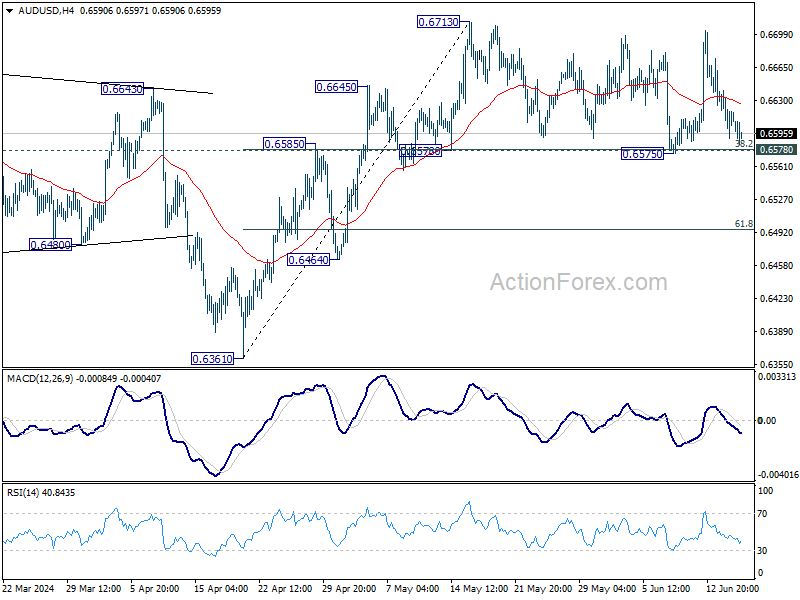
No change in AUD/USD's outlook and intraday bias stays neutral. Further rally is in favor with 0.6578 cluster support (38.2% retracement of 0.6361 to 0.6713 at 0.6579) intact. On the upside, firm break of 0.6713 will resume whole rise from 0.6361 to 0.6870 resistance next. However, sustained break of 0.6578 will dampen this bullish view, and bring deeper fall to 61.8% retracement at 0.6495.
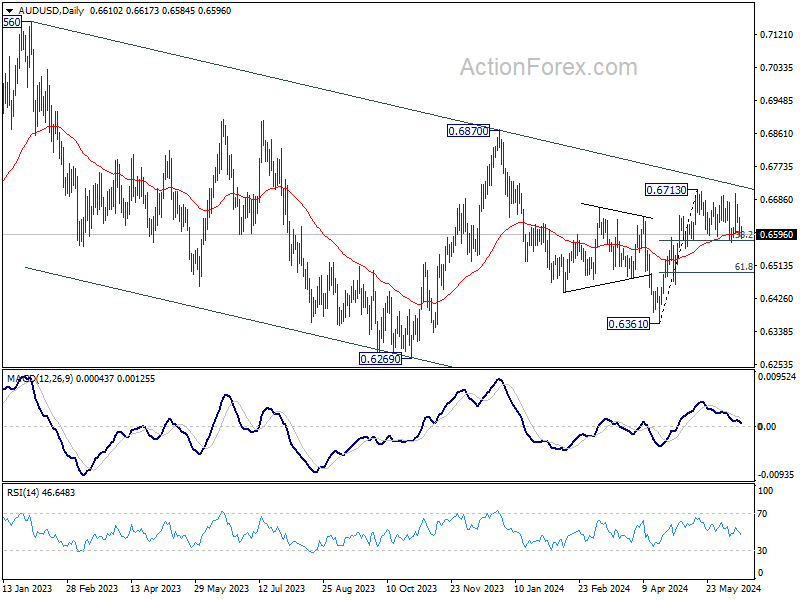
In the bigger picture, price actions from 0.6169 (2022 low) are seen as a medium term corrective pattern to the down trend from 0.8006 (2021 high). Fall from 0.7156 (2023 high) is seen as the second leg, which could have completed at 0.6269 already. Rise from there is seen as the third leg which is now trying to resume through 0.6870 resistance.
Aussie Weakens as Market Eyes Upcoming RBA Rate Decision
Australian Dollar declines broadly today, as markets brace for the upcoming RBA rate decision. With the cash rate expected to hold steady at 4.35%, speculation is rife about RBA's future monetary policy direction. Although the central bank maintains an open stance on rate adjustments, indicating that hikes are still possible, market consensus suggests that further increases are unlikely due to the subdued consumption climate. That's the base case until second-quarter CPI data presents significant upside surprises, which would make the next meeting in August live. Meanwhile, predictions for a rate cut are being deferred. While some economists anticipate a possible rate cut as early as the fourth quarter, others foresee this moving into the early next year.
In broader currency market movements, New Zealand Dollar also showed weakness, but this trend extended to Yen and Swiss Franc, suggesting that these shifts are not tied to changes in risk sentiment. On a more positive note, Euro is on a recovery path, while Dollar, Canadian Dollar, and British Pound are appearing slightly stronger.
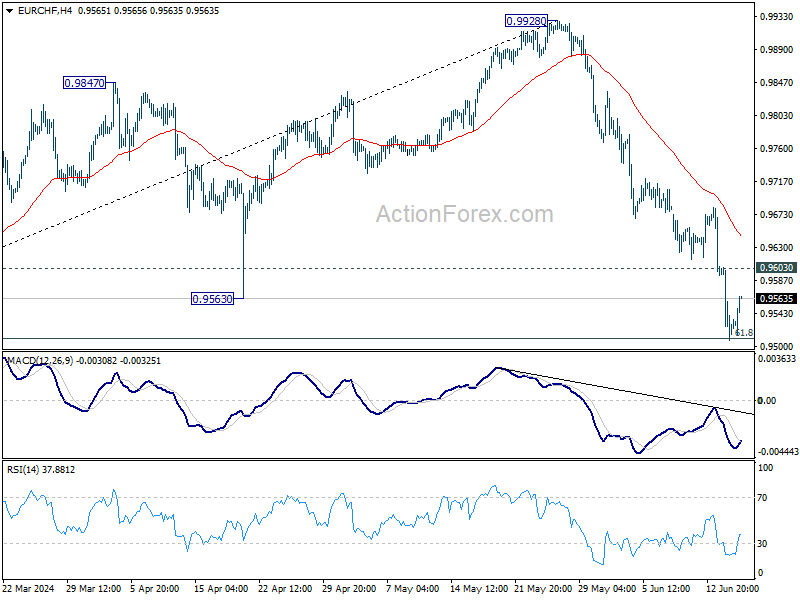
From a technical analysis perspective, several key resistance levels in Euro pairs are being closely watched to determine if Euro's recovery can sustain and extend. These include 1.0744 minor resistance in EUR/USD, 0.8482 resistance in EUR/GBP, and 0.9603 minor resistance in EUR/CHF. Break of these levels might not necessarily signal a full reversal for Euro. But it would at least indicate that the recent selling climax is over, setting the stage for more stable, consolidative trading in the near term.
In Europe, at the time of writing, FTSE is down -0.16%. DAX is up 0.12%. CAC is up 0.27%. UK 10-year yield is up 0.046 at 4.106. Germany 10-year yield is u 0.069 at 2.432. Earlier in Asia, Nikkei fell -1.83%. Hong Kong HSI fell -0.02%. China Shanghai SSE fell -0.55%. Singapore Strait Times fell -0.81%. Japan 10-year JGB yield fell -0.0064 to 0.932.
ECB's Lane confidence on inflation, cautions on interpreting data noise
ECB's Chief Economist Philip Lane expressed "a lot, a fair amount of confidence" today that Eurozone inflation is on track to return to 2% target by the latter half of next year.
In his remarks, Lane highlighted the importance of judiciously interpreting incoming economic data, emphasizing the need to "differentiate the noise and the signal."
Lane's confidence stems from anticipated "muted" cost pressures in the coming year. However, he underscored the critical need for a reduction in "domestic services inflation momentum" as a necessary condition for achieving the inflation targets.
SECO slightly upgrades Swiss economic forecasts, but below-average growth persists
The State Secretariat for Economic Affairs said that Swiss economic forecasts remain largely unchanged, with growth expected to stay below average this year. The Expert Group on Business Cycles projects a modest growth rate of 1.2% for the Swiss economy in 2024, slightly up from March forecast of 1.1%.
Challenges such as low capacity utilisation in industrial production and high financing costs are likely to curb investments. However, exports will provide some support, aided by the recent depreciation the Swiss Franc. More significantly, growth will be driven by private consumption, buoyed by rising employment and a stable inflation rate, which is expected to average 1.4% for the current year, a slight decrease from the March forecast of 1.5%.
Looking ahead, GDP growth for 2025, adjusted for sporting events, is projected to reach 1.7%, with inflation at 1.1%. Both were unchanged from prior forecasts.
NZ BNZ services falls to 43, unprecedented contraction
New Zealand's BusinessNZ Performance of Services Index dropped significantly from 46.6 to 43.0 in May, marking the lowest level of activity for a non-COVID lockdown month since the survey's inception in 2007.
BusinessNZ Chief Executive Kirk Hope described the May result as "as bad as it can get" for the sector, with contraction levels surpassing those seen during the Global Financial Crisis of 2008/09.
Examining the details, key metrics reveal a stark downturn. Activity/sales fell from 46.0 to 40.9, employment dropped from 47.0 to 46.0, new orders/business decreased from 46.6 to 42.6, stocks/inventories declined from 46.2 to 42.4, and supplier deliveries slid from 47.5 to 46.1.
The proportion of negative comments in May (65.4%) remained similar to April (66.3%), indicating persistent concerns about the economic downturn.
BNZ's Senior Economist Doug Steel noted, "the speed of decline is as worrisome as its size over the past three months. There is weak and then there is very weak. Overall, this tells of a services sector in reverse, at pace."
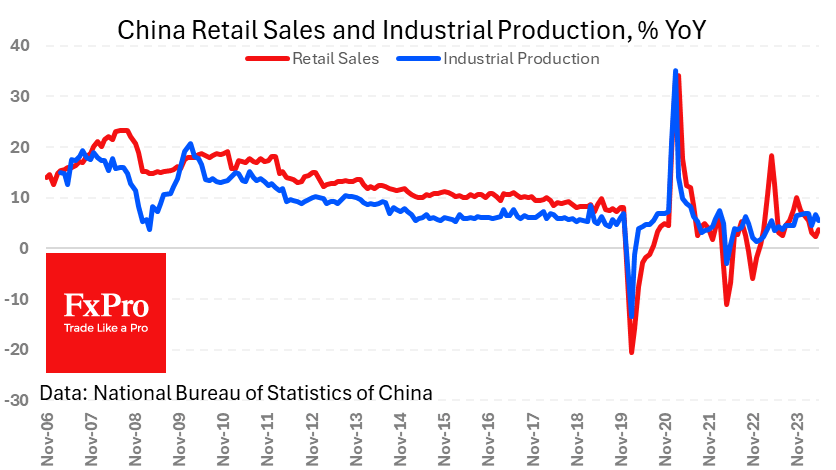
China's industrial production up 5.6% yoy in May, misses exp 6.0% yoy
China's industrial production increased by 5.6% yoy in May, falling short of the expected 6.0% yoy and slowing from April's 6.7% yoy. Despite this overall slowdown, the equipment and high-tech manufacturing sectors showed robust growth, with outputs rising 7.5% yoy and 10% yoy, respectively.
Fixed asset investment grew by 4.0% year-to-date yoy, slightly below the anticipated 4.2%. Within this sector, property development investment notably declined by -10.1%, reflecting ongoing challenges in China's real estate market.
On a positive note, retail sales rose by 3.7% yoy, surpassing the expected 3.0%. This indicates resurgence in the consumer sector, which could provide a buffer against the broader economic slowdown.
AUD/USD Mid-Day Report
Daily Pivots: (S1) 0.6590; (P) 0.6617; (R1) 0.6643; More...
No change in AUD/USD's outlook and intraday bias stays neutral. Further rally is in favor with 0.6578 cluster support (38.2% retracement of 0.6361 to 0.6713 at 0.6579) intact. On the upside, firm break of 0.6713 will resume whole rise from 0.6361 to 0.6870 resistance next. However, sustained break of 0.6578 will dampen this bullish view, and bring deeper fall to 61.8% retracement at 0.6495.
In the bigger picture, price actions from 0.6169 (2022 low) are seen as a medium term corrective pattern to the down trend from 0.8006 (2021 high). Fall from 0.7156 (2023 high) is seen as the second leg, which could have completed at 0.6269 already. Rise from there is seen as the third leg which is now trying to resume through 0.6870 resistance.
Economic Indicators Update
| GMT | Ccy | Events | Actual | Forecast | Previous | Revised |
|---|---|---|---|---|---|---|
| 22:30 | NZD | Business NZ PSI May | 43 | 47.1 | 46.6 | |
| 23:01 | GBP | Rightmove House Price Index M/M Jun | 0.00% | 0.80% | ||
| 23:50 | JPY | Machinery Orders M/M Apr | -2.90% | -3.10% | 2.90% | |
| 02:00 | CNY | Industrial Production Y/Y May | 5.60% | 6.00% | 6.70% | |
| 02:00 | CNY | Retail Sales Y/Y May | 3.70% | 3.00% | 2.30% | |
| 02:00 | CNY | Fixed Asset Investment YTD Y/Y May | 4.00% | 4.20% | 4.20% | |
| 07:00 | CHF | SECO Economic Forecasts | ||||
| 12:15 | CAD | Housing Starts Y/Y May | 265K | 241K | 240K | 241K |
| 12:30 | USD | Empire State Manufacturing Index Jun | -6 | -13 | -15.6 |
Gold Price Outlook: Bears Take Early Control as US Dollar Index (DXY) Rises
- Gold surrendered Friday’s gains as a retest of $2300 gains momentum.
- US dollar index (DXY) rises but faces stern resistance at 105.63.
- Geopolitics remains on the back burner for now, but risks remain.
Fundamental Overview and Week Ahead
Gold prices began the week on the backfoot, with a slight gap to the downside at the open. This has seen the precious metal falter to trade below the $2320 heading into the European open. A quiet weekend on the Geopolitical front also added downward pressure on gold prices as any safe haven appeal has, at least for now, disappeared.
Last week saw some real whipsaw price action as markets first digested the potential of “higher rates for longer’ before the PPI data which followed painted a different picture.Following the PPI data however, the prospect of two rate cuts from the US Federal Reserve remains on the table.
US Federal Reserve Interest Rate Probabilities
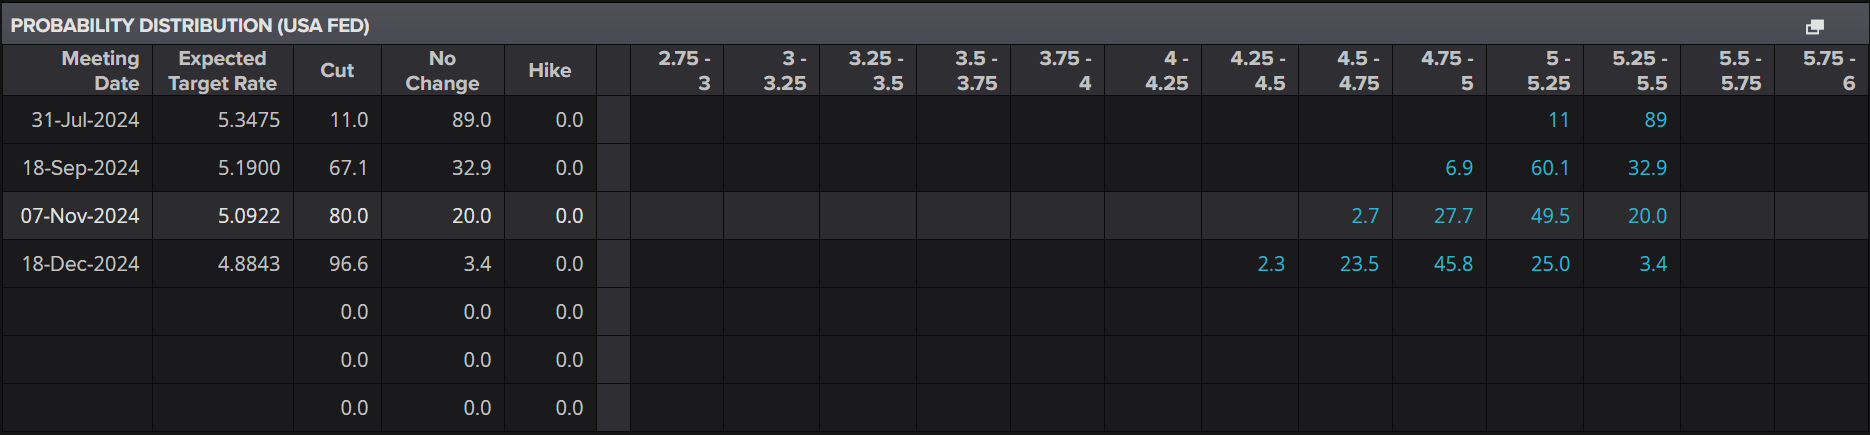
Source: LSEG Eikon
The US Dollar for its part has started the week on the front foot. The US Dollar Index (DXY) advanced on Friday toward the May 9 high before a pullback to end the day below the key resistance area at 105.63.
US Treasury yields remain supported suggesting that the potential of ‘higher rates for longer’ continues to linger on the minds of market participants. This in turn is also hampering gold prices as market participants opt for US Treasuries thereby driving flows away from the precious metal.
US Dollar Index (DXY) Daily Chart,Jun 17, 2024
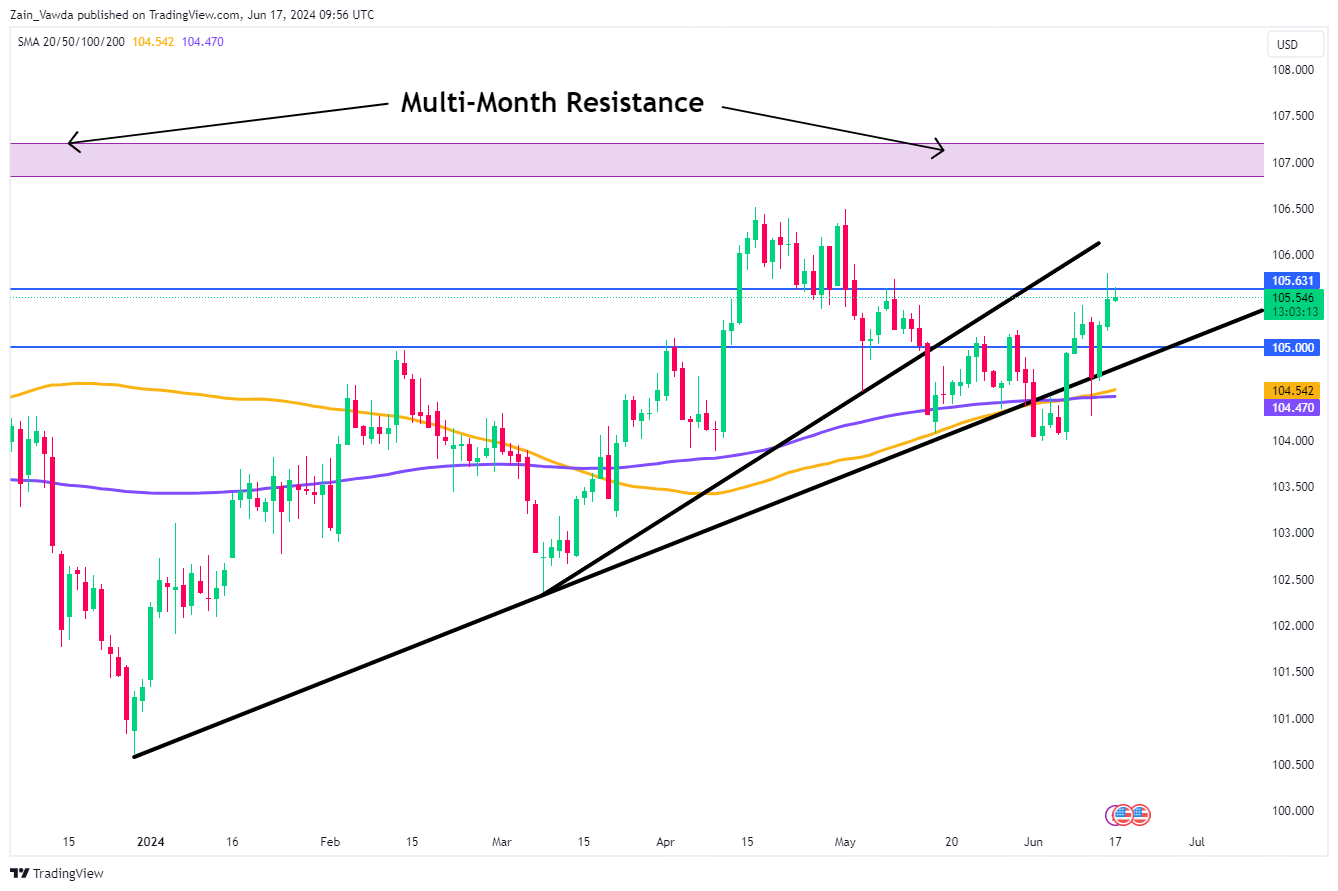
Source: TradingView.com (click to enlarge)
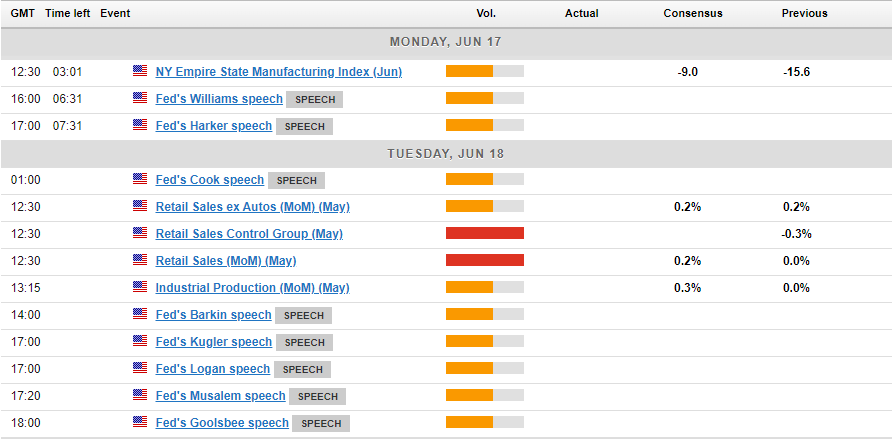
The Week Ahead: Central Banks, Geopolitics and Fed Policymakers
Looking ahead to the rest of the week, US data may take a backseat. We have four Central Bank meetings scheduled from Australia, UK , Norway and Switzerland. Given the volatile political developments in France and the heavy European Central Bank calendar the US dollar story may be relegated to spectator status this week.
We do have US retail sales data for May due out on Tuesday and anything but a significant beat or miss is unlikely to have a major impact on market movements. Federal Reserve Policymakers are scheduled to speak this week with the Fed’s Williams and Harker set to kick things off on Monday. Market participants will no doubt be keeping an eye on the comments and the tone of policymakers following the PPI release and Fed meeting last week. The week is rounded off by the S&P global PMI data on Friday, which in a similar vein to the retail sales data is unlikely to have a major or lasting impact on market moves.
On the Geopolitical front, developments in the Middle East are ongoing with news this morning that Israeli Prime Minister Benjamin Netanyahu has dissolved his war cabinet. As more news of this filters through, the next steps taken by Israel could prove to be key. Escalation remains the biggest risk to markets as market participants weigh the impacts of a wider war in the Middle East. Any increase in tensions, particularly with Hezbollah on the Lebanese border could see the safe haven appeal return and gold rise back toward the $2400 mark.
Gold (XAU/USD) Technical Outlook
Looking at Gold from a technical perspective, and the precious metal is coming off its best week in four. A bullish engulfing candle off a key support area adds further confluence that a rise in gold prices may be on the horizon.
Dropping down to the daily time frame and things get a bit more tricky. On the Daily we appear to have printed a head and shoulder pattern with the neckline resting around 2320-2325 (see chart below).
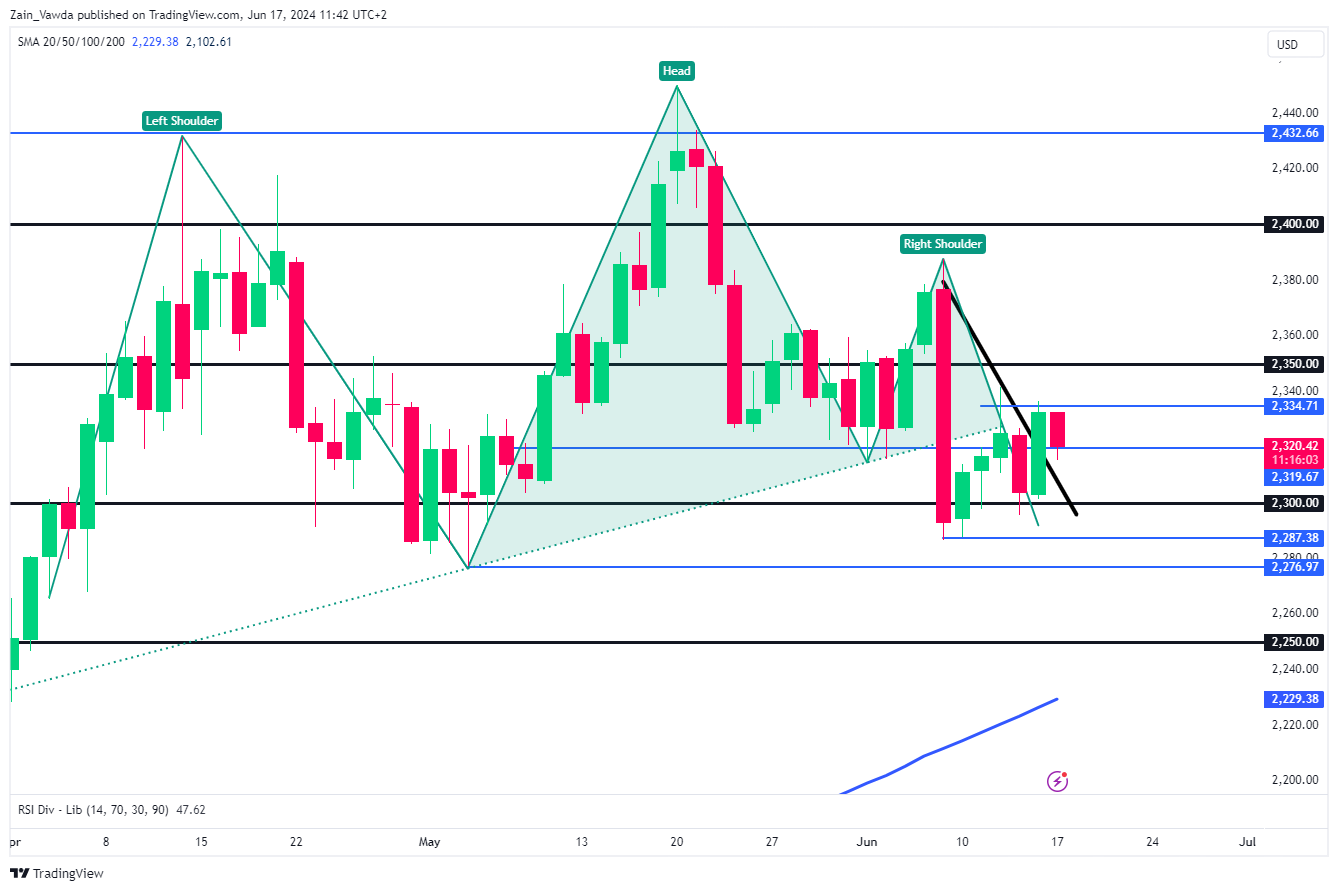
Source: TradingView.Com (click to enlarge)
On the H4 time frame, price of the precious metal has been range bound for the since last Tuesday. The range between 2333 and 2300 remains pertinent and could come back into play early this week.
Gold (XAU/USD) H4 Chart – June 17, 2024
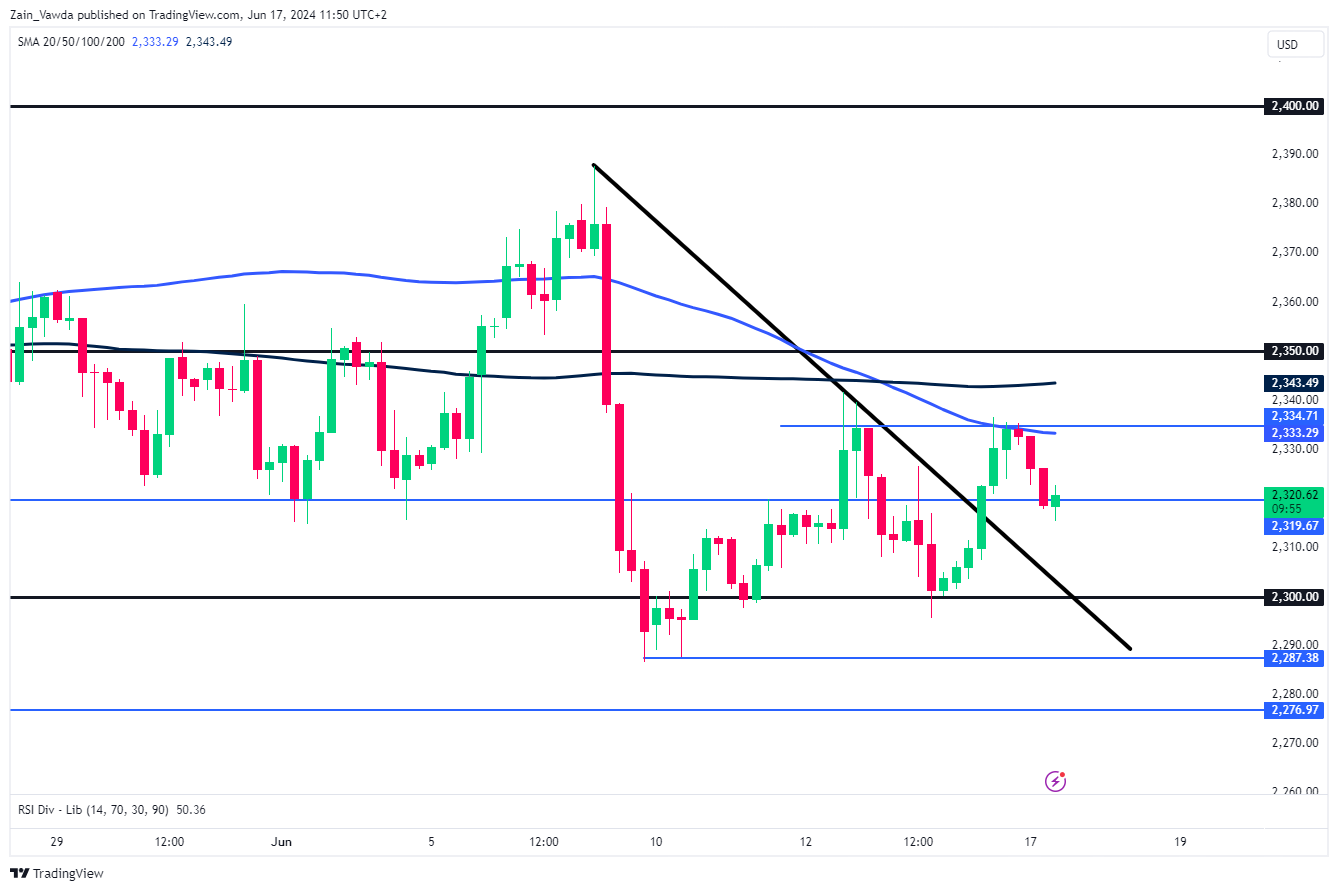
Source: TradingView.Com (click to enlarge)
Key Levels to Consider:
Support:
-2300 (Psychological Level)
-2287
-2276
Resistance:
-2333
-2350
-2400 (Psychological Level)
Australian Dollar Drifting Ahead of RBA Decision
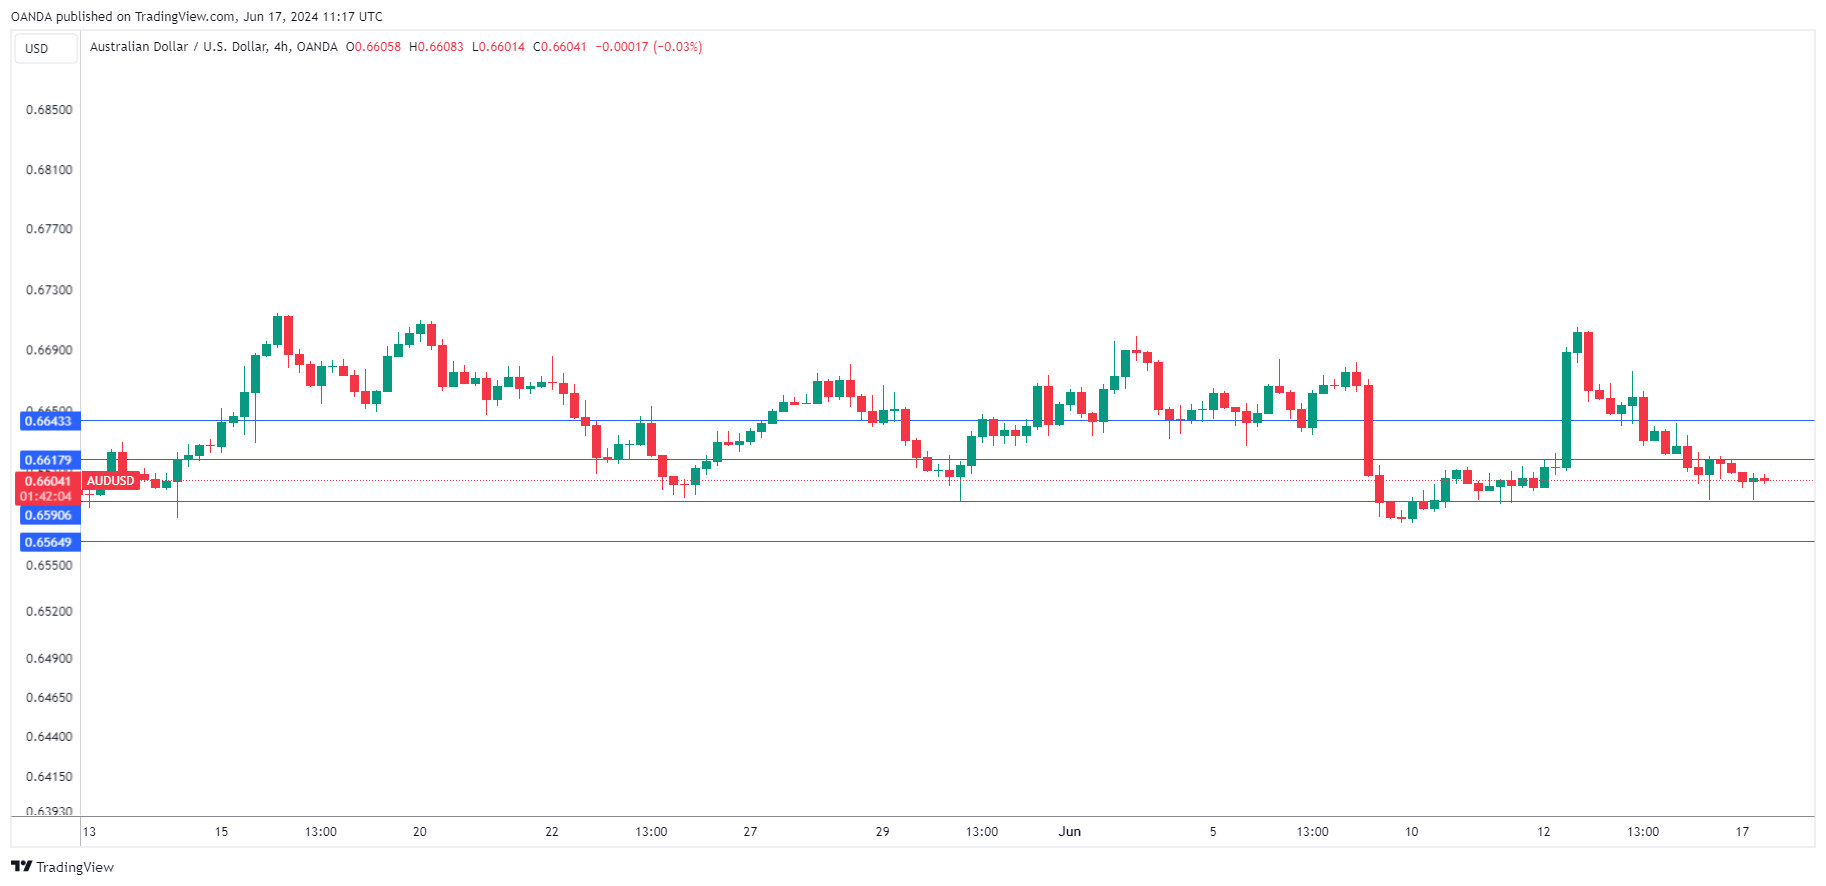
The Australian dollar is steady on Monday. AUD/USD is trading at 0.6605 in the European session, down 0.14% on the day. Last week, the Australian dollar rose as much as 1.8% but pared most of these gains.
RBA expected to hold rates
The Reserve Bank of Australia will deliver its rate announcement early Tuesday and is widely expected to hold rates for a fifth straight time. All four major Australian banks expect the RBA to stay on the sidelines. The RBA has kept rates at a 12-year high of 4.35% and doesn’t feel confident enough to start lower rates due to sticky inflation. First-quarter inflation was stronger than expected, rising 3.6% y/y. This was down from 4.1% in Q4 2023 but above the market estimate of 3.4%.
The RBA has maintained a hawkish hold stance and Governor Bullock reiterated last week that the central bank could raise rates if inflation does not fall as expected. A rate hike is an unlikely scenario, given that the economy has been weakening, but the fact that a rate hike is on the table means that a rate cut is not around the corner and could be delayed until 2025.
Besides sticky inflation, another factor which complicating plans to lower rates is the tight Australian labor market. Unemployment is under 4% and swelling immigration means that job vacancies remain tight.
In the US, the UoM consumer sentiment index fell for a third successive month to 65.6 in June. This was down from 69.1 in May and shy of the market estimate of 72. Inflation expectations remained unchanged at 3.3%, another signal that inflation remains sticky and the Fed will have a tough time bringing inflation down to the 2% target.
AUD/USD Technical
- AUD/USD is testing resistance at 0.6617. Above, there is resistance at 0.6643
- 0.6590 and 0.6564 are the next support level
US 500 Index Eases After the Climb to New High
- US 500 index calms near the 261.8% Fibonacci extension level
- RSI and Stochastics are flattening
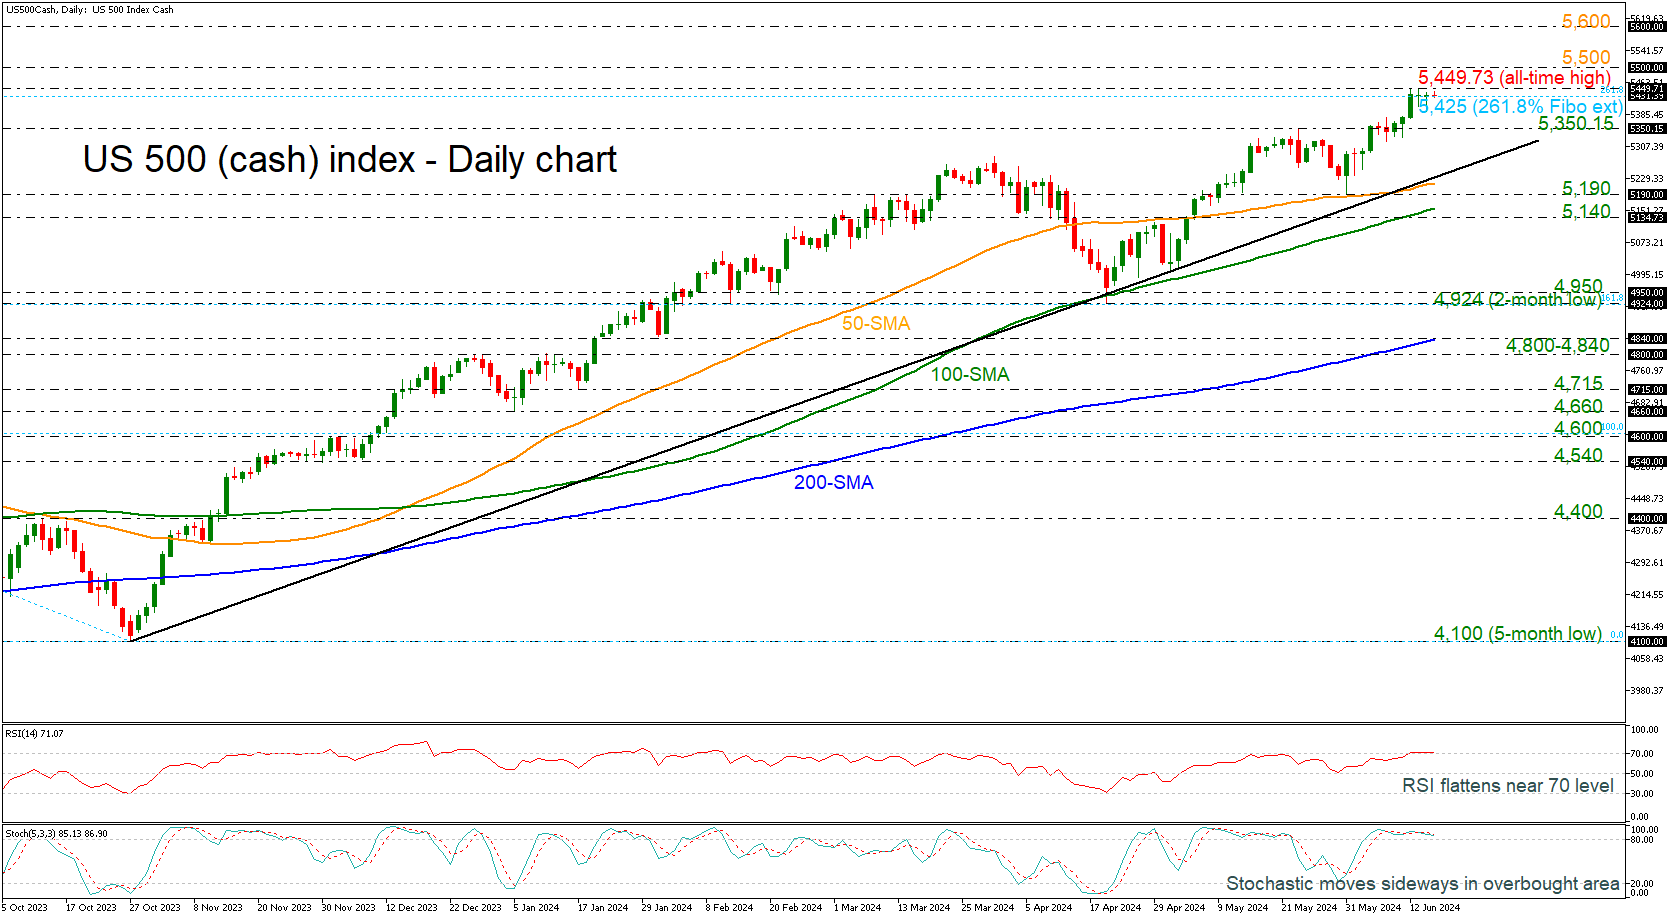
The US 500 (cash) index has been moving with weak momentum over the last couple of sessions after the surge towards a new record peak of 5,449.73, holding near the 261.8% Fibonacci extension level of the up leg from 4,924 to 4,100 at 5,425.
The market is looking overstretched as the technical oscillators are moving horizontally near their overbought territories. The RSI is flattening around its 70 area, while the stochastic oscillator posted a bearish crossover within its %K and %D lines above the 70 level, indicating a potential downside retracement.
Moving higher, traders would pay attention to the next uncharted round numbers such as 5,500 and 5,600.
Alternatively, a bearish correction could drive the market towards the immediate 5,350.15 support level ahead of the long-term ascending trend line at 5,300. Below these lines, the 50-day simple moving average (SMA) at 5,217 and the support region of 5,140-5,190, which encapsulates the 20-day SMA, may halt negative movements.
Summarizing, the index looks neutral in the very short-term view, but the broader outlook is still strongly positive.
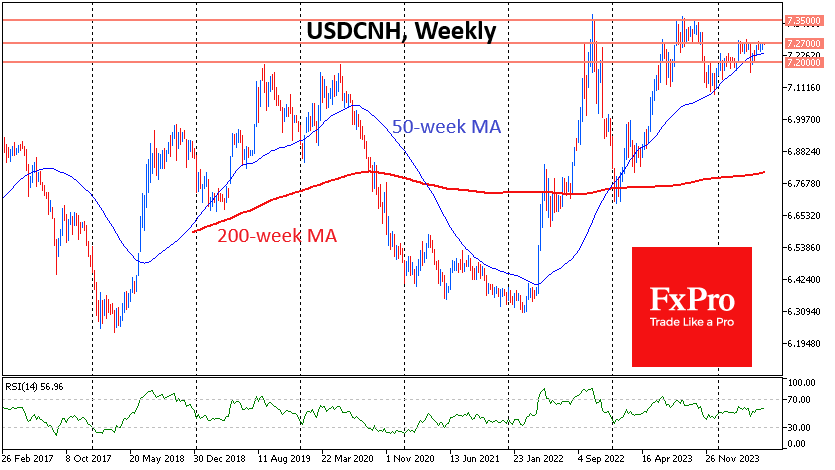
USDCNH Hits the Ceiling
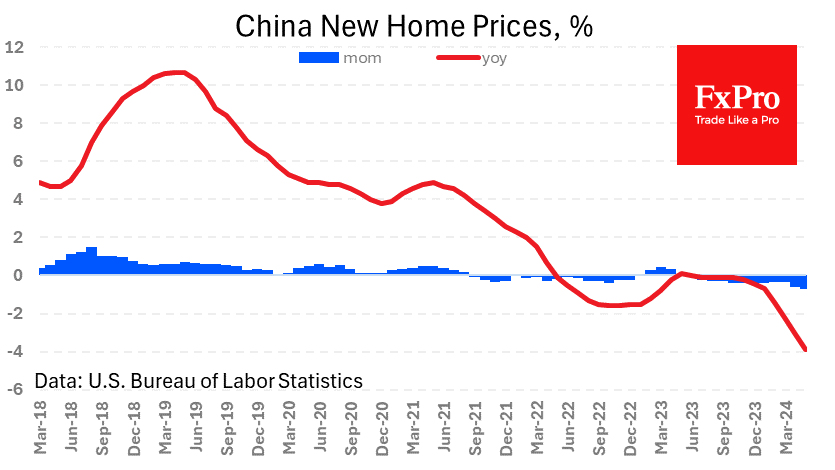
China’s housing price decline is gaining momentum. New home prices for May fell 0.71% vs. 0.58% and 0.34% in the previous two months. The year-over-year decline increased to 3.9%, with back-to-back slides over the 12 months. China has repeatedly announced measures to support the property market, but they have been limited, failing to reverse the trend. The problems in the housing market are very toxic for stocks as housing prices and sales volumes drag down property developers and banks, sucking liquidity out of the financial system.
The other bad news was the slowdown in industrial production growth to 5.6% from 6.7% a month earlier, worse than the expected 6.2%. The slowing trend in China’s industrial growth has been in place since the peak in February. China’s industrial production can be seen as a leading indicator of the global economy, and the fresh data raises the risk of a recession in developed economies before the end of the year. Fixed asset investment is also losing momentum, falling to 4.0% against a peak of 4.5% in March and an expected 4.2%.
Retail sales, on the other hand, strengthened growth and beat expectations. The year-to-date gain to May was 3.7% vs. 2.3% previously and 3.0% expected. It cannot be ruled out that this is only a temporary surge, and its positive effect is unlikely to be global.
These data and statistical reports last week failed to lift renminbi volatility. The USDCNH pair seems to have found its ceiling just below 7.27, having been turning downwards from there since the end of March. That said, the downside momentum is getting smaller and smaller, preparing us for a new floor. Next, which seems to be more important for the Chinese authorities, is 7.35. From here, USDCNH was actively sold from August to November last year, and there was a powerful reversal in November 2022. The yuan will be able to sag to this level if there is still a pullback from risks and towards the dollar in global markets. But it will probably take an economic crisis to overcome it.
Technically, it is now more comfortable to be bullish in USDCNH as the previous 2019-2020 global “ceiling” below 7.20 this year works as a “floor”.