Sample Category Title
Gold’s Rise Might be a Trap
Gold is adding on Friday, and it appears that a flight to defensive assets, rather than the risk appetite that drove the price earlier this year, is behind it.
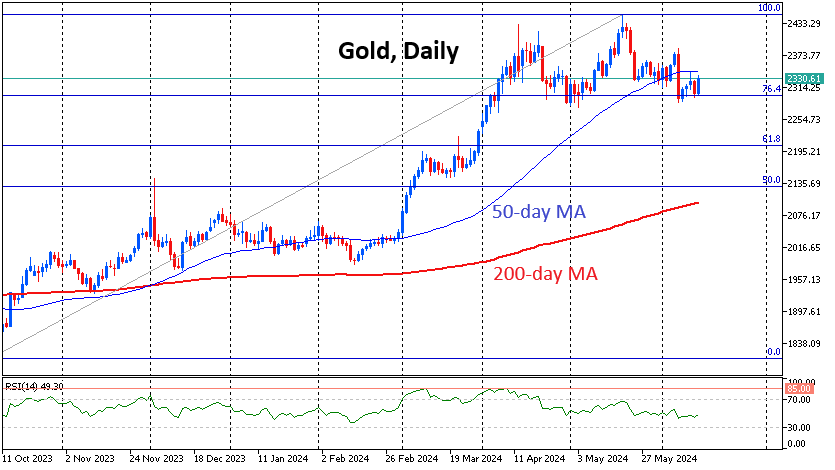
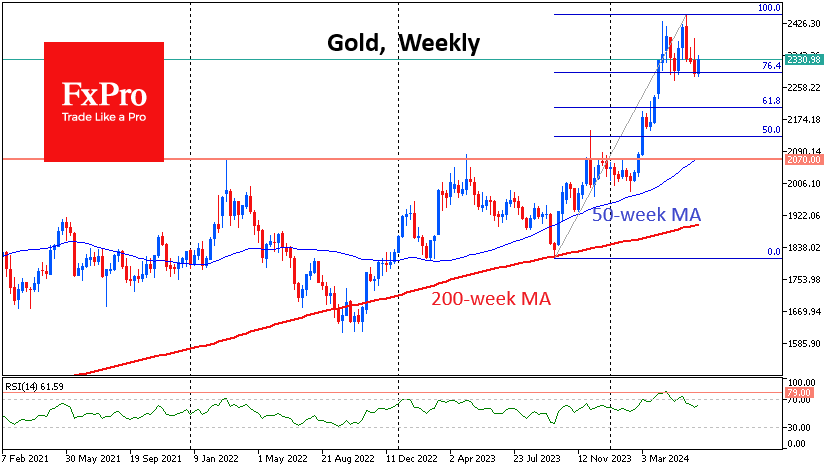
Since the start of the week, gold has twice pushed off support at $2300, where the round price level and the 76.4% retracement level from the rise from the bottom in October to the peak in May combine. The Bulls are getting additional temporary reinforcement because this same level was already successfully defended early last month.
But this support looks extremely fragile and unreliable. Firstly, last Friday, Gold went over 4% from peak to bottom, on high volumes and with a horrendous amplitude falling under the 50-day moving average. All other dynamics of this week may well be considered as consolidation of liquidity by bears for a new blow to the metal. This thesis is reinforced by the fact that this 50-day average is already actively working as resistance.
Secondly, the dollar has been rising since last Friday, as if switching into a “buy on the downturn” mode. The dollar index has pushed back from its 200-day moving average since the beginning of the month. And a rising dollar with attractive bond interest yields makes dollar bonds an effective competitor to gold.
Third, stocks are falling. Separate from the short-squeeze-backed gains in individual stocks in the Nasdaq100 and S&P500, there is noticeable heaviness in the Dow Jones and Russell 2000 indices, not to mention the 5% loss by the French CAC40 for the week. Politics was back to spooking the markets as we heard of new barrages of trade wars and the risks of increased protectionism.
Over the past decade and a half, this is not the first episode of a simultaneous thrust into gold while trouble brews. However, in 2008, 2011 and 2020, the initial rise in the value of an ounce against a background of falling stocks and a rising dollar quickly reversed into a collapse in the gold price.
It is worth keeping a close eye on how events in the currency and stock market unfold. And if the risk-off continues, buying gold will be as dangerous as picking up pennies in front of a train.
Forex and Cryptocurrency Forecast
EUR/USD: Hawkish Sentiments of the Fed
As expected, the key day of last week was Wednesday, 12 June. After the publication of inflation data in the USA, the dollar came under strong pressure. Fresh figures showed that in May, the overall inflation rate (CPI) in annual terms decreased to 3.3% compared to the expected 3.4%. On a monthly basis, the indicator dropped from 0.3% to 0% against the forecast of 0.1%. The Core Consumer Price Index (Core CPI), which does not take into account food and energy prices, was 0.2% (m/m) compared to April, which was below the forecast of 0.3%. Annually, this index grew by 3.4%, showing the slowest growth rate in the last three years (previous value 3.6%, forecast 3.5%).
This cooling of inflation increased market participants' expectations that the Fed might lower the interest rate twice this year, with the first stage of monetary policy easing occurring as early as September. As a result, the Dollar Index (DXY) fell from 105.3 to 104.3, and EUR/USD soared by more than 100 points, reaching a local high of 1.0851.
However, the bears' joy regarding the dollar was short-lived. The results of the FOMC (Federal Open Market Committee) meeting of the US Federal Reserve returned the DXY to its starting point. The key interest rate was predictably left unchanged at 5.50%. At the same time, the new median forecast of FOMC members showed that the regulator confidently expects only one rate cut in 2024. Recall that in March, the Fed predicted three cuts in 2024 and three in 2025. Now, 15 out of 19 Fed leaders expect at least one or two cuts this year (7 for 25 basis points, 8 for 50 basis points), while the remaining 4 forecast the start of easing (QE) no earlier than 2025. Currently, CME Group's FedWatch indicates almost a 70% probability of the start of QE at the September FOMC meeting.
Fed Chair Jerome Powell noted at the post-meeting press conference that the US labour market remains generally strong, although not overheated. The US economy continues to grow at a confident pace. According to him, further actions will depend on the balance of risks at each meeting. The Fed does not intend to allow a labour market collapse as a means of reducing inflation. If the economy remains resilient and inflation stable, the Fed is ready to maintain the current rate level for as long as necessary. If the labour market weakens or inflation falls faster than expected, the US central bank is ready to respond with a rate cut. At the same time, Powell noted that the regulator needs to see more "good data" to be confident in the sustainable movement of inflation towards the target level of 2.0%. Additionally, he warned markets against excessive expectations regarding the supposed monetary policy easing, adding that a single rate cut of 25 basis points will not have a significant impact on the economy.
Powell's rather hawkish rhetoric was reinforced by the publication of new medium-term economic forecasts presented by the Fed following the meeting. Thus, the regulator raised the inflation forecast for 2024 to 2.6% from 2.4%, and for 2025 to 2.3% from 2.2%. The Fed hopes to return inflation to the target 2.0% only in 2026. The US GDP growth forecast remained unchanged throughout the forecast horizon – at 2.1% in 2024-2026. The Fed also kept the unemployment forecast in the US at 4.0% in 2024, increasing it to 4.2% from 4.1% in 2025, and to 4.1% from 4.0% in 2026.
Besides this hawkish revision of the US central bank's economic forecasts, the dollar's further strengthening was facilitated by its role as a safe-haven currency. The future of the euro remains in question against the backdrop of political uncertainty in the Eurozone. On Sunday, 9 June, the results of the European Parliament elections, which shocked many, were announced: in Germany, France, and Belgium, far-right parties won while ruling parties suffered defeats. In France, President Emmanuel Macron's party garnered only 14.5% of the votes, resulting in the dissolution of the National Assembly and the appointment of early elections. Some market participants believe that political risks may send EUR/USD to the 1.0600 area or even lower in the coming weeks.
The weakening of the euro will also be facilitated by the fact that the European Central Bank has already begun a cycle of rate cuts. On Thursday, 6 June, the ECB Governing Council cut the key interest rate by 25 basis points to 4.25%. Since September 2023, inflation in the Eurozone has decreased by more than 2.5%, allowing the regulator to take such a step for the first time in a long while. Additionally, fresh macroeconomic data show that the target level of 2.0% may be achieved quite soon. For instance, the German CPI, the locomotive of the European economy, published on Wednesday, 12 June, showed a decline from 0.5% to 0.1% (m/m). ECB representative Bostjan Vasle stated on Thursday that "further rate cuts are possible if the disinflation process continues."
The last chord of the past week saw EUR/USD at 1.0702. As for the forecast of analysts for the near future, as of the evening of 14 June, 60% of their votes were given for the pair's decline, 20% for its rise, and 20% remained neutral. As for technical analysis, 100% of trend indicators and oscillators on D1 sided with the dollar, all coloured red, although 20% of the latter are in the oversold zone. The nearest support for the pair lies in the 1.0670 zone, followed by 1.0600-1.0620, 1.0560, 1.0495-1.0515, 1.0450, 1.0370. Resistance zones are in the areas of 1.0740, then 1.0780-1.0810, 1.0865-1.0895, 1.0925-1.0940, 1.0980-1.1010, 1.1050, 1.1100-1.1140.
In the coming week, on Tuesday, 18 June, it will be known what is happening with inflation (CPI) in the Eurozone, and statistics on the US retail market will also be released. On Wednesday, 19 June, it will be a holiday in the United States: the country celebrates Juneteenth. On Thursday, 20 June, the number of initial jobless claims in the US will be known, and the Philadelphia Fed Manufacturing Index will also be published. And at the very end of the workweek, on Friday, 21 June, a whole series of preliminary business activity (PMI) data will be received in various sectors of the German, Eurozone, and US economies. The publication of the Fed's Monetary Policy Report on the same day will also attract considerable interest.
GBP/USD: What Will the Bank of England Decide on 20 June?
In autumn 2023, the BoE concluded that its monetary policy should remain tight for a prolonged period until inflation confidently stabilises at the target level of 2.0%. Based on this, despite a decrease in price pressure, at its meeting on 8 May, the Bank of England's Monetary Policy Committee (MPC) decided by a majority vote (seven to two) to keep the key interest rate at the previous level of 5.25%. (Two MPC members voted for a reduction to 5.0%).
According to the country's Office for National Statistics (ONS), since November 2022, the Consumer Price Index (CPI) has fallen from 11.1% to 2.3% – the lowest level since July 2021. The British central bank expects this figure to return to the target level in the near future but to increase slightly to around 2.5% in the second half of the year due to rising energy prices. Additionally, according to the May forecasts, CPI will be 1.9% in two years (Q2 2026) and 1.6% in three years (Q2 2027).
British inflation expectations for the near future have also decreased to the lowest level in almost three years, indicating a return to historically average levels. In May, the country's residents on average expected consumer prices to rise by 2.8% over the next 12 months, compared to a forecast of around 3% in February. This is stated in the results of the British central bank's quarterly survey.
Data on business activity (PMI) published in the first week of June indicated that the economy in the United Kingdom is relatively well. Activity in the manufacturing sector rose to 51.2 from 49.1 earlier. Some slowdown was shown by the PMI for the services sector – from 55.0 to 52.9, and the composite PMI – from 54.1 to 53.0. However, despite this, all these indicators remain above the 50.0 mark, separating growth from a slowdown in activity.
Certain concerns are raised by the UK labour market. Statistics published in early June showed a spike in jobless claims – by 50.4K in May after 8.4K the previous month. This is the largest monthly increase since the first COVID lockdowns. Before the pandemic, the last such spike was during the 2009 recession. Moreover, the unemployment rate for the February-April 2024 period rose to 4.4%. Of course, historically, this is a low level, but it is the highest in three years.
The next Bank of England meeting will be held on Thursday, 20 June. Analysts generally forecast that the interest rate will remain unchanged at 5.25%. This forecast is supported by the slowdown in inflation decline rates. Additionally, there is a significant increase in UK wages (+6.0%), which could push prices up. This, in turn, reduces the likelihood of the British central bank transitioning to a softer monetary policy in the near future. The start of QE may be delayed until September or later.
The BoE's tight monetary policy creates prerequisites for future demand for the pound. Meanwhile, last week, GBP/USD was driven by overseas data. On US inflation data, it broke through the upper boundary of the 1.2700-1.2800 channel and rose to 1.2860, then, following the FOMC meeting results, it fell and broke through the lower boundary, dropping to 1.2656. The week ended at 1.2686.
The median forecast of analysts for the near term is somewhat similar to the forecast for the previous pair. In this case, 50% of specialists voted for dollar strengthening, 25% for a northern trajectory, and 25% remained neutral. As for technical analysis on D1, the picture is also mixed. Trend indicators are evenly split 50:50 between red and green. Among oscillators, 60% point south (a quarter signal oversold), 20% look north, and the remaining 20% remain neutral. In case of further pair decline, support levels and zones are 1.2575-1.2600, 1.2540, 1.2445-1.2465, 1.2405, 1.2300-1.2330. In case of pair growth, resistance will be encountered at 1.2760, 1.2800-1.2820, 1.2865-1.2900.
Besides the mentioned Bank of England meeting on 20 June, including its interest rate decision and subsequent press conference, it is necessary to note Wednesday, 19 June, when fresh consumer inflation (CPI) data for the UK will be released. Friday, 21 June, also promises to be interesting. On this day, retail sales volumes and preliminary business activity (PMI) indicators in various sectors of the UK's economy will be known.
USD/JPY: BoJ Changed Nothing but Promised Changes in the Future
Unlike the Bank of England, the Bank of Japan (BoJ) meeting has already taken place, and its results were announced last Friday, 14 June. The yen's weakness in recent months has negatively impacted Asian currencies. In March, the central bank made its first move – raising the rate for the first time since 2007 (since 2016, it had kept it at a negative level of -0.1%). The regulator also abandoned the targeting of 10-year government bond yields. Investors closely watched the Japanese central bank for hints on whether it would further unwind monetary stimulus.
But for now, the BoJ decided not to change its accommodative monetary policy, maintaining the current pace of bond purchases at around 6 trillion yen ($38 billion) per month. However, it promised to present a plan for their gradual reduction at the next meeting in July. "We decided to subsequently reduce the volume of our purchases [within one to two years] to ensure more free formation of long-term interest rates in financial markets," the central bank statement said. At the same time, the regulator announced that it would gather market participants' opinions before making a specific decision.
The deposit rate for commercial banks was also left unchanged – officials unanimously voted to keep it in the range of 0.0%-0.1%, as expected. From this, experts once again concluded that the BoJ would not rush to tighten its quantitative easing (QT) monetary policy.
The French bank Societe Generale believes that given the pressure from the government due to the weak yen, the most likely scenario will be a reduction in bond purchases starting in August, with their purchases decreasing every three months and reaching zero by November 2025. Additionally, according to Societe Generale economists, the BoJ may raise the discount rate in September this year.
Of course, USD/JPY could not ignore such events of the past week as the US CPI figures and the Fed meeting: its fluctuation range exceeded 240 points (155.71 at the low, 158.25 at the high). However, the five-day result was not so impressive: starting at 156.75, it ended at 157.37.
Experts' forecasts for the near term look like this: not a single vote was given for the pair's southern movement and yen strengthening, while the remaining votes were evenly split: 50% pointed north, and 50% remained neutral. As for technical analysis, all trend indicators on D1 are coloured green. The nearest support level is in the 156.80-157.05 zone, followed by 156.00-156.10, 155.45, 154.50-154.70, 153.10-153.60, 151.85-152.15, 150.80-151.00, 149.70-150.00, 148.40, 147.30-147.60, 146.50. The nearest resistance lies in the 157.70 area, followed by 158.25-158.60, 160.00-160.20.
No significant economic statistics releases for Japan are scheduled for the upcoming week.
CRYPTOCURRENCIES: The Present and Future of Bitcoin Depend on the USA
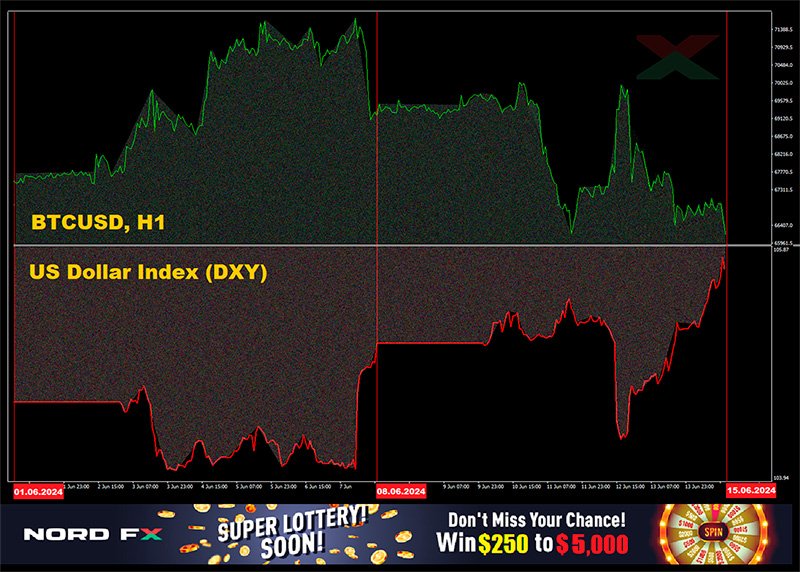
In the absence of independent drivers, the crypto market has recently followed the dollar, which in turn follows the Fed, which follows the macro statistics from the USA. BTC/USD is like scales, with the main cryptocurrency on one side and the US dollar on the other. The dollar became heavier – bitcoin became lighter, and vice versa. On Friday, 7 June, strong statistics on the US labour market were released – the dollar became heavier, bitcoin lighter. On Wednesday, 12 June, it turned out that inflation in the USA was decreasing – the dollar weakened, bitcoin became heavier. And in the evening, the Fed calmed the markets regarding the interest rate – and the scales swung back. Just look at the BTC/USD and Dollar Index (DXY) charts – the inverse correlation leaves no doubt.
In recent days, the flagship of the crypto market has lost about 7% in price. And the reason for this is the aforementioned monetary policy of the US Fed. Enthusiasm was not added by the fact that bitcoin-ETF inflows broke a 19-day streak. On 11 June alone, industry funds lost almost $65 million. The reasons are the same. They can be supplemented by the upcoming summer holiday season – a period of correction and lull in financial markets.
Traders note that recently, "digital gold" has been trading in a narrow range between $66,000 and $72,000. One of the popular market participants considers the lower mark an ideal entry point, while entry at the upper boundary of the range, in his words, carries high risk. MN Capital founder and analyst Michael van de Poppe does not rule out that pressure from sellers will persist in the near future. In such conditions, bitcoin may correct to $65,000 and even lower. However, van de Poppe does not expect a deep price drop. According to him, a large amount of liquidity is concentrated around the $60,000 area. This suggests that this level now acts as a strong support area, and positive dynamics can be supported by geopolitical instability.
According to surveys, more than 70% of the crypto community believe that BTC is on the verge of further growth. For instance, trader Captain Faibik is confident that bitcoin is preparing to break through the "expanding wedge" technical analysis pattern. According to him, breaking its upper boundary will open the path for the cryptocurrency to rise above $94,000. Trader Titan of Crypto, in turn, expects bitcoin to reach $100,000 this summer. The growth prospects of BTC are also indicated by the activity of large investors. According to industry representatives, whales are actively entering long positions on bitcoin. Cryptoquant CEO Ki Young Ju clarified that the $69,000 level has become particularly attractive for large investors.
New Binance CEO Richard Teng, who replaced Changpeng Zhao, believes that bitcoin will soon exceed $80,000. Teng associates the potential new high with the work of spot BTC-ETFs, which have strengthened trust in the asset. The Binance CEO also allows for the legalisation of cryptocurrency if Donald Trump is elected President of the United States. Declaring himself the "crypto president," Trump said in May that the USA should lead the global crypto industry.
However, at present, cryptocurrency regulation measures are in the stage of development and implementation, which restrains investments. According to experts, current investments should be considered test cases. It should also be noted that spot ETFs have attracted significant liquidity only in the USA – there is no similar interest in most countries.
According to billionaire Mark Cuban, the attitude towards cryptocurrencies will be a key difference between US presidential candidates Donald Trump and Joe Biden, although neither understands this issue. "Do you really think [Trump] understands anything about cryptography other than making money from selling NFTs?" Cuban asked. And he answered himself: "Neither of [the candidates] understands. But I've said many times that Biden will have to choose between [SEC Chair] Gary Gensler and crypto-voters, otherwise it could cost him the White House."
According to Bitfinex crypto exchange analysts, bitcoin's price could rise to $120,000-125,000 within a few months to half a year. Similar figures are named by BitGo crypto trust company CEO Mike Belshe. In his opinion, by the end of 2024, the first cryptocurrency will cost $125,000-135,000, and one of the catalysts will be the high level of US government debt. "Our macroeconomic climate continues to confirm the need for bitcoin. Undoubtedly, US government debt is out of control. [...] This situation supports the idea that bitcoin is the gold of the new generation," Belshe said.
He also noted that the US dollar is losing its position as the world reserve currency due to US foreign policy. The BitGo CEO believes that the country uses the dollar as a weapon and a means of manipulation. "Thus, the US debt crisis is one, foreign policy and sanction control is two. And BRICS offers alternative payment systems. [...] This is the story of why bitcoin exists," he concluded.
At the time of writing this review on the evening of Friday, 14 June, BTC/USD is trading at $65,800. The total crypto market capitalisation is $2.38 trillion ($2.54 trillion a week ago). Bitcoin's capitalisation has reached a solid $1.30 trillion, which, as experts warn, reduces the effect of future inflows. Pessimists say the asset is already "overheated," and to reach $125,000, its capitalisation must almost double. In their opinion, such a colossal influx during the overbought period is unlikely, so one should expect a correction and subsequent consolidation. The possibility of such an outcome is also hinted at by the Bitcoin Fear & Greed Index: over 7 days, it fell from 77 to 70 points and moved from the Extreme-Greed zone to the Greed zones.
EUR/USD Weekly Outlook
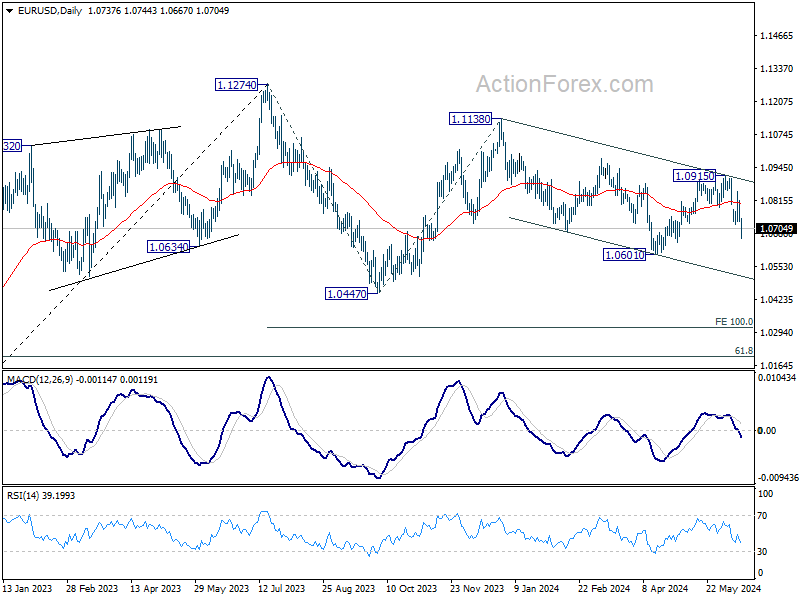
Euro's strong decline last week suggests that rebound from 1.0601 has already completed as a correction to 1.0915. Initial bias stays on the downside this week for retesting 1.0601 low first. Firm break there will target channel support at 1.0510 next. On the upside, above 1.0744 minor resistance will turn intraday bias neutral again first.
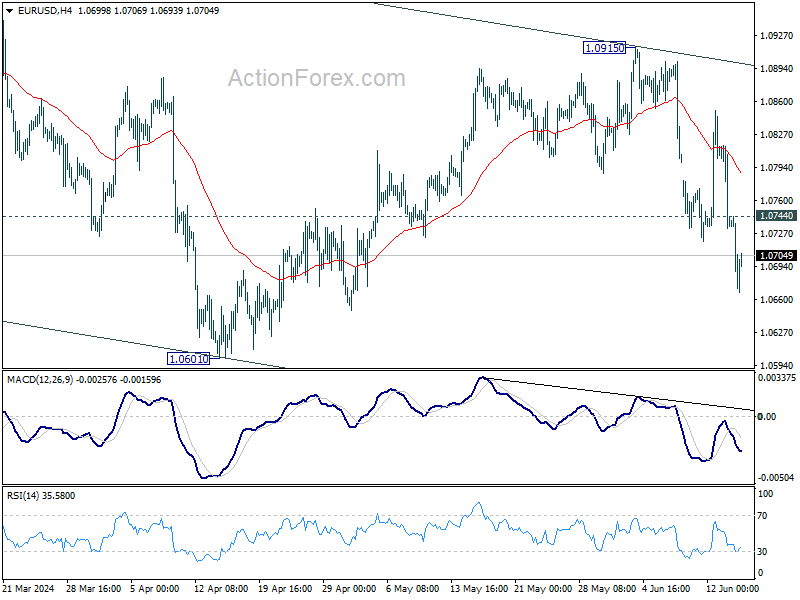
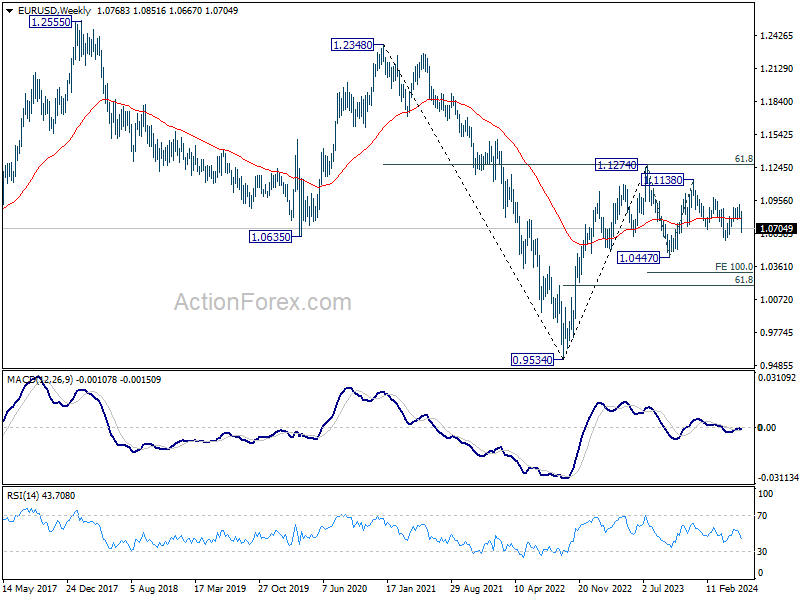
In the bigger picture, price actions from 1.1274 are viewed as a corrective pattern that's still in progress. Break of 1.0601 will target 1.0447 support and possibly further to 100% projection of 1.1274 to 1.0447 from 1.1138 at 1.0311. For now, this will remain the favored case as long as 1.0915 resistance holds, in case of rebound.
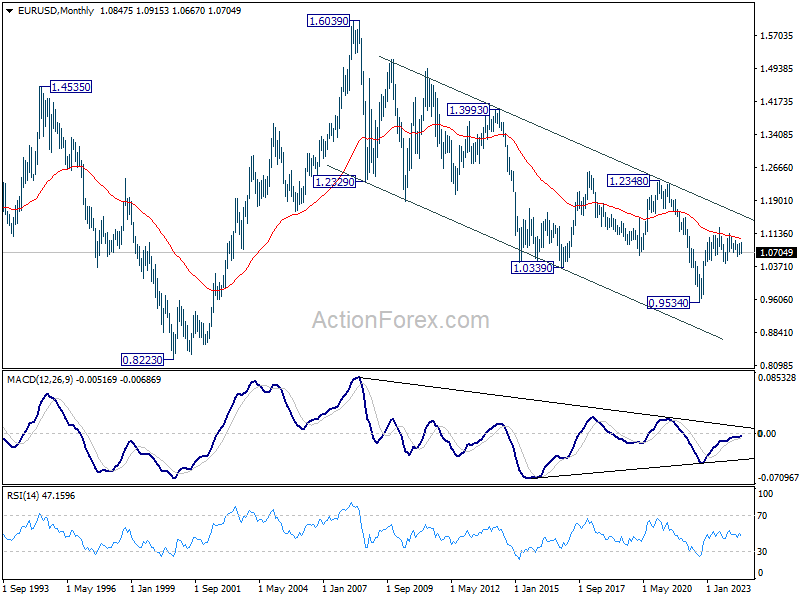
In the long term picture, a long term bottom is in place at 0.9534 (2022 low). But considering that upside is still capped below 55 M EMA (now at 1.1030), there is no sign of trend reversal yet. Down trend from 1.6039 (2008 high) could resume at a later stage if current selloff picks up momentum.
USD/JPY Weekly Outlook
USD/JPY's choppy rise from 151.86 resumed by breaching 157.70 resistance last week. Initial bias stays mildly on the upside this week. Further rally could be seen to retest 160.20 high. But upside should be limited there, at least on first attempt. On the downside, below 156.57 minor support will turn intraday bias neutral first.
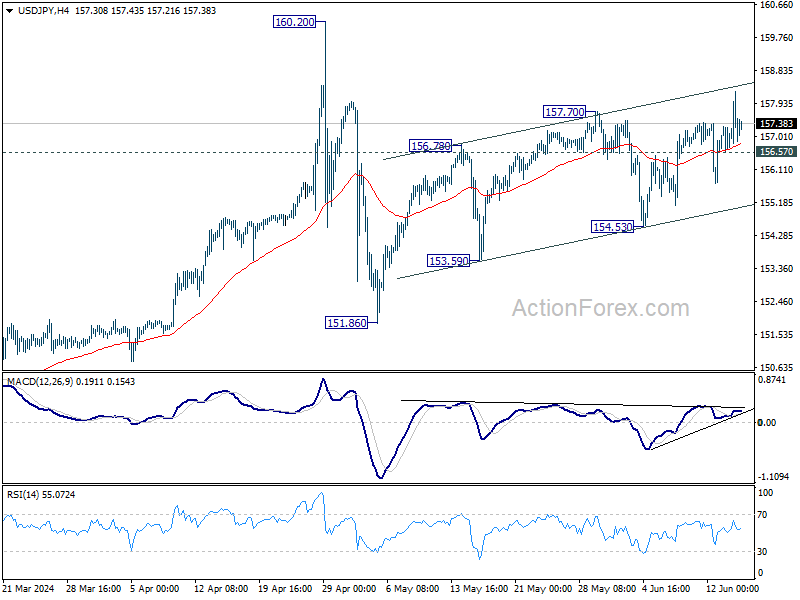
In the bigger picture, price actions from 160.20 medium term top are seen as a corrective pattern to rise from 150.25 only. Another rally is still expected at a later stage through 160.02 to resume the larger up trend. However, decisive break of 150.87 will argue that larger correction is possibly underway, and target 146.47 support next.
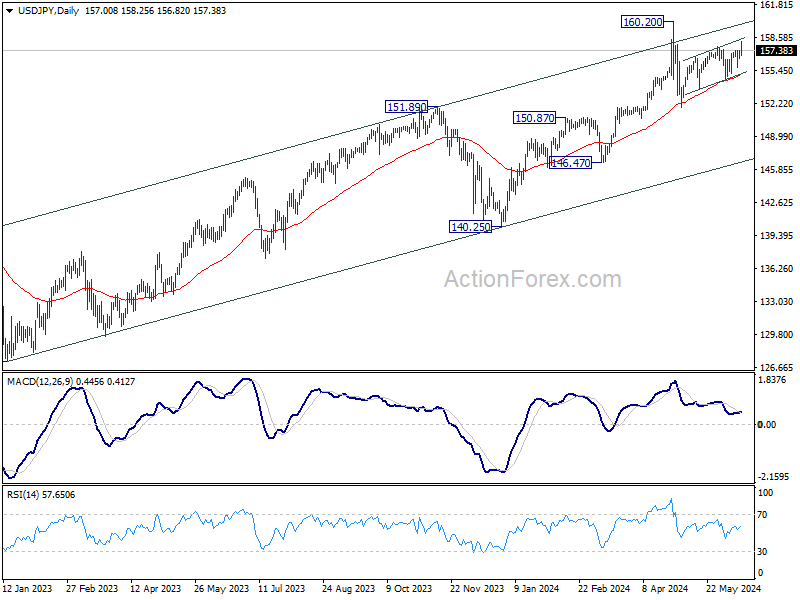
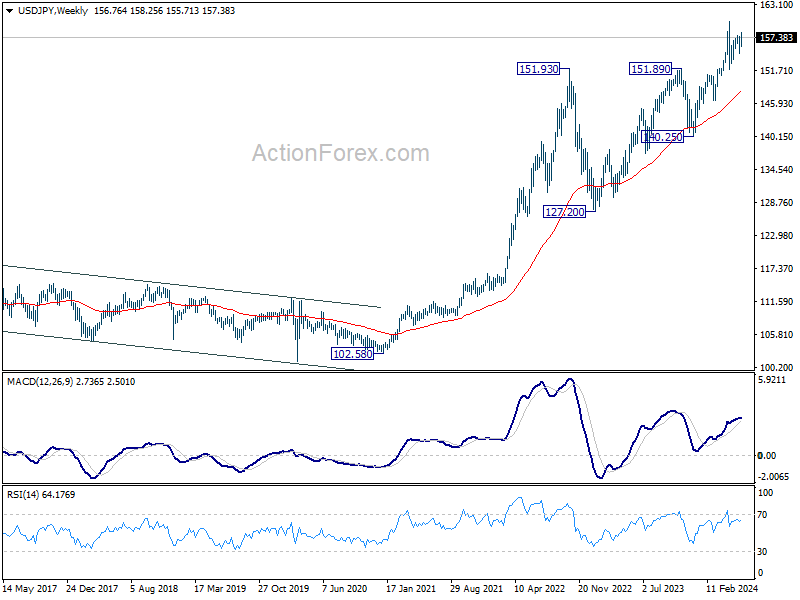
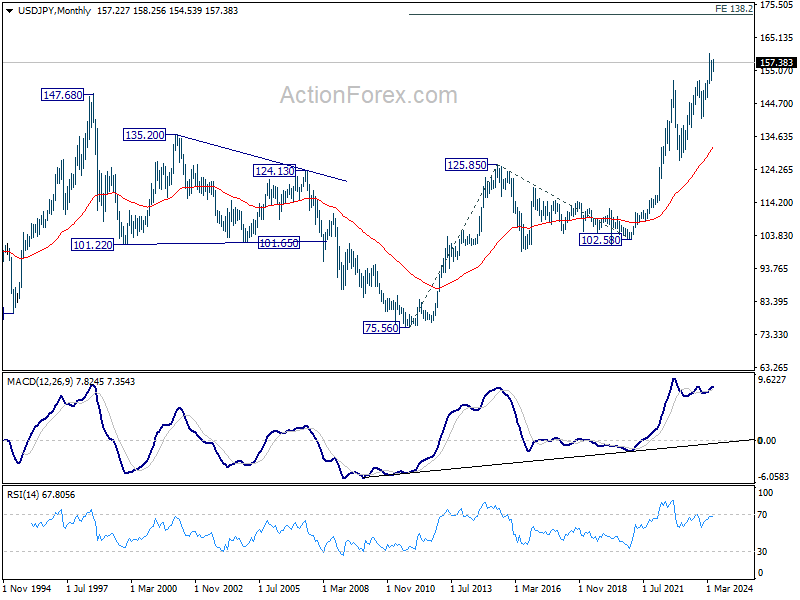
In the long term picture, as long as 140.25 support holds, up trend from 75.56 (2011 low) is still in progress. Next target is 138.2% projection of 75.56 (2011 low) to 125.85 (2015 high) from 102.58 at 172.08.
GBP/USD Weekly Outlook
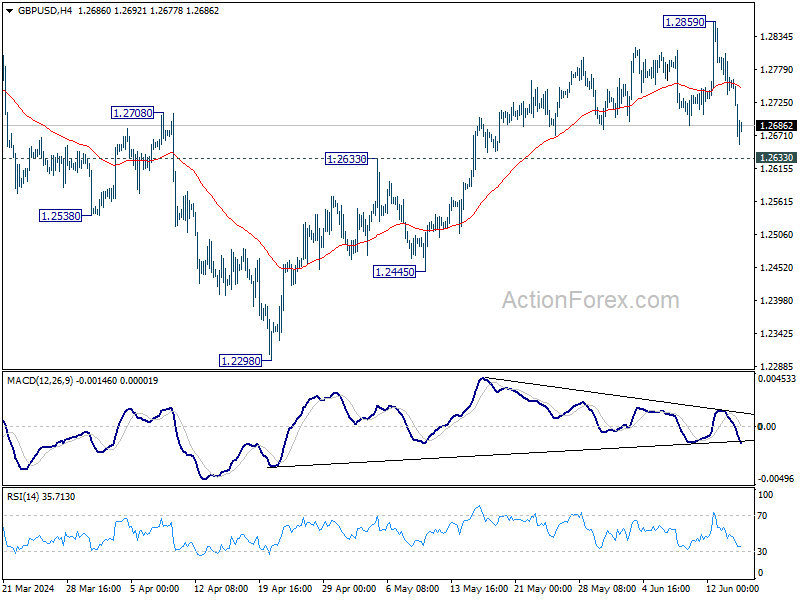
GBP/USD edged higher to 1.2859 last week, but subsequent decline argues that rise from 1.2298 has completed already, on bearish divergence condition in 4H MACD. Initial bias remains on the downside this week for 1.2633 resistance turned support first. Firm break there will target 1.2445 and below. For now, risk will be on the downside as long as 1.2859 resistance holds, in case of recovery.
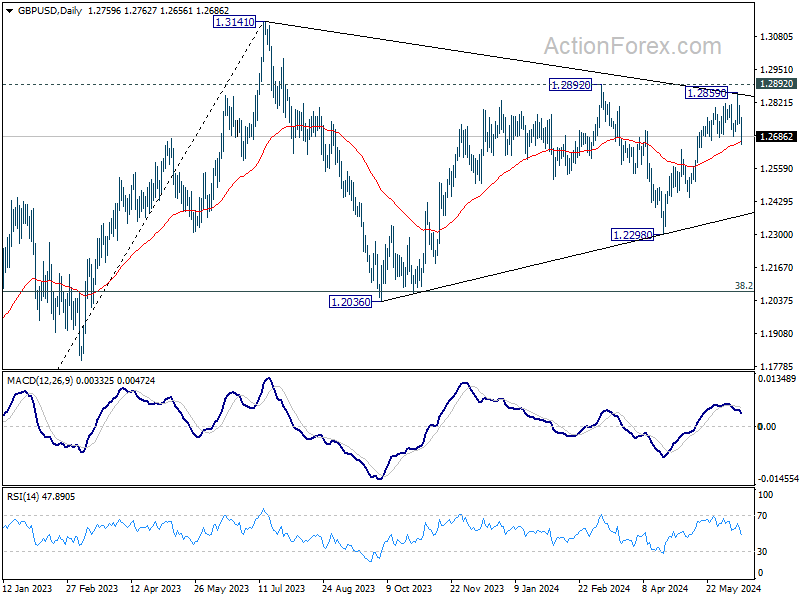
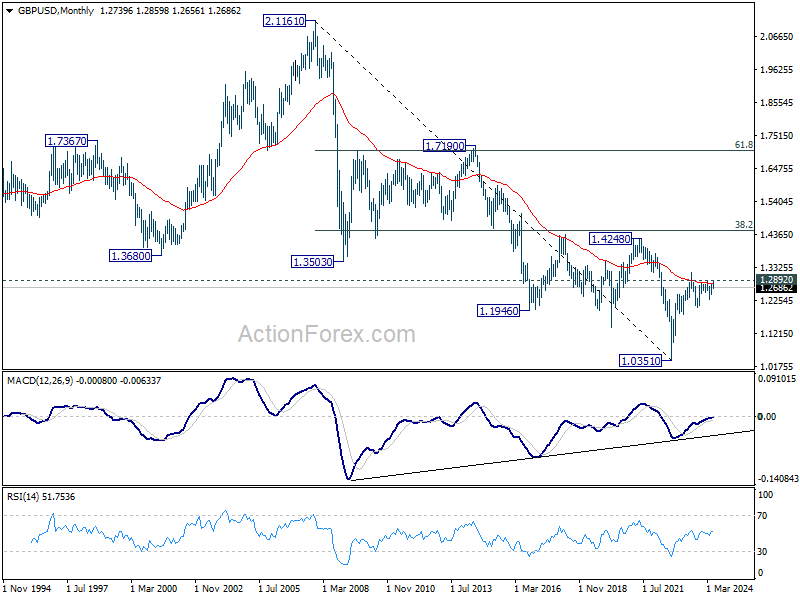
In the bigger picture, price actions from 1.3141 medium term top are seen as a corrective pattern. Fall from 1.2892 is seen as the third leg which might have completed already. Break of 1.2892 resistance will argue that larger up trend from 1.0351(2022 low) is ready to resume through 1.3141. Meanwhile, break of 1.2445 support will extend the corrective pattern with another decline instead.
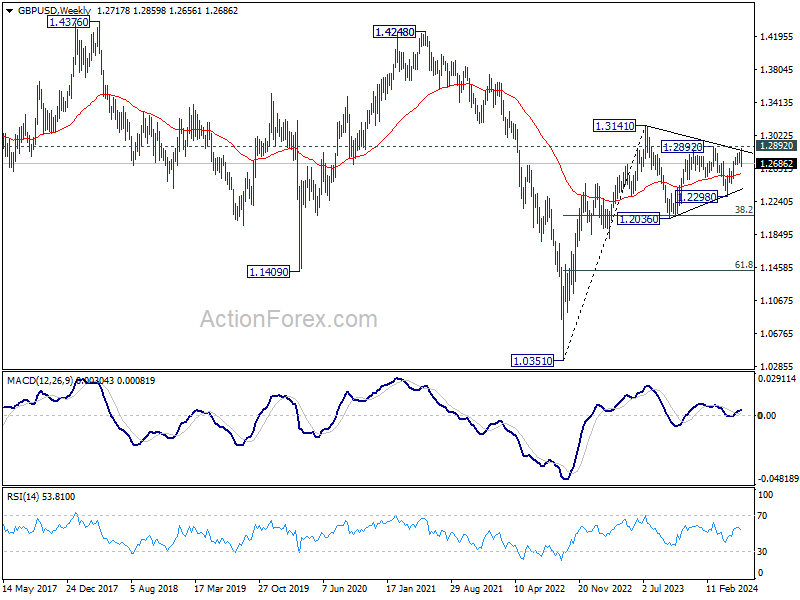
In the long term picture, a long term bottom should be in place at 1.0351 on bullish convergence condition in M MACD. But momentum of the rebound from 1.3051 argues GBP/USD is merely in consolidation, rather than trend reversal. Range trading is likely between 1.0351/4248 for some more time.
USD/CHF Weekly Outlook
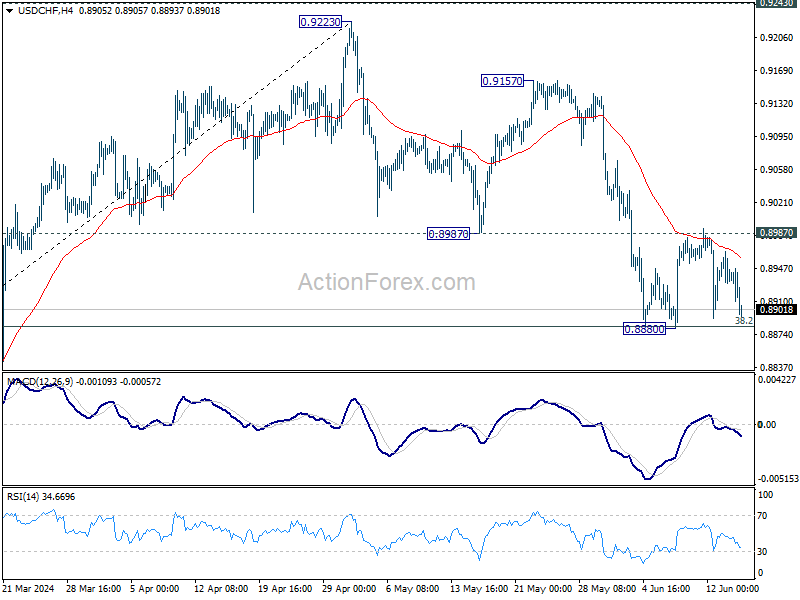
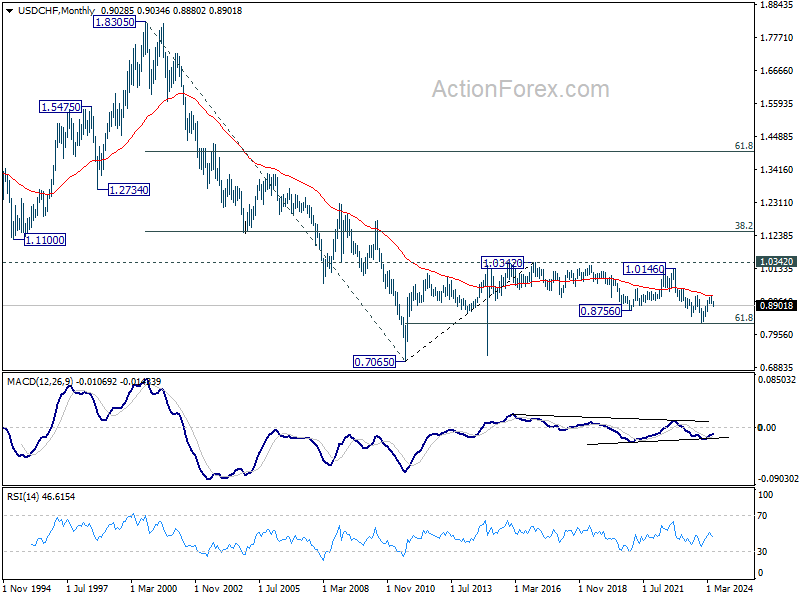
USD/CHF was supported by 0.8883 fibonacci level and recovered. But upside was capped by 0.8987 support turned resistance. Initial bias stays neutral this week first. On the downside, sustained break of 0.8883 fibonacci level will carry larger bearish implications and bring deeper decline. On the upside, firm break of 0.8987 support turned resistance will argue that correction from 0.9223 has completed, after drawing support from 0.8883 fibonacci level. Intraday bias will be back on the upside for 0.9157/9223 resistance zone.
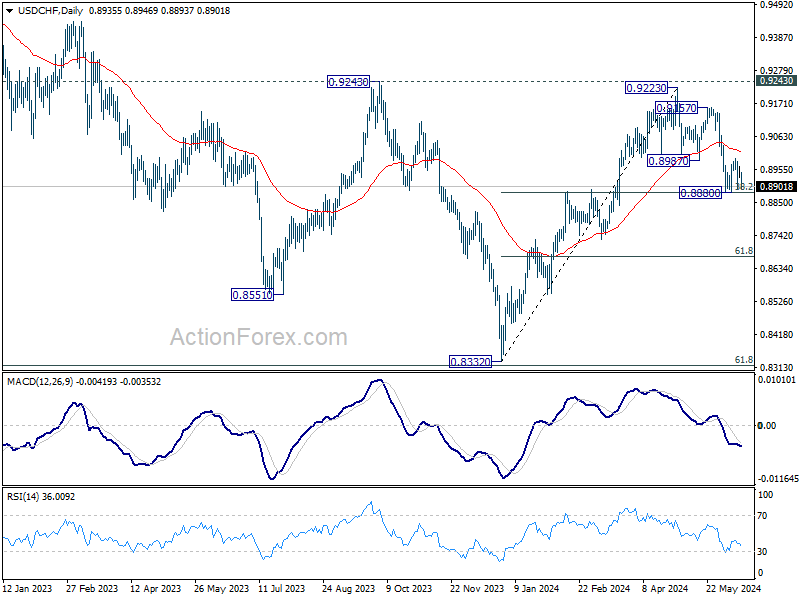
In the bigger picture, price actions from 0.8332 medium term bottom are tentatively seen as developing into a corrective pattern to the down trend from 1.0146 (2022 high). Rejection by 0.9243 resistance, followed by sustained break of 38.2% retracement of 0.8332 to 0.9223 at 0.8883 will strengthen this case, and maintain medium term bearishness. However, decisive break of 0.9243 will argue that the trend has already reversed and turn medium term outlook bullish for 1.0146.
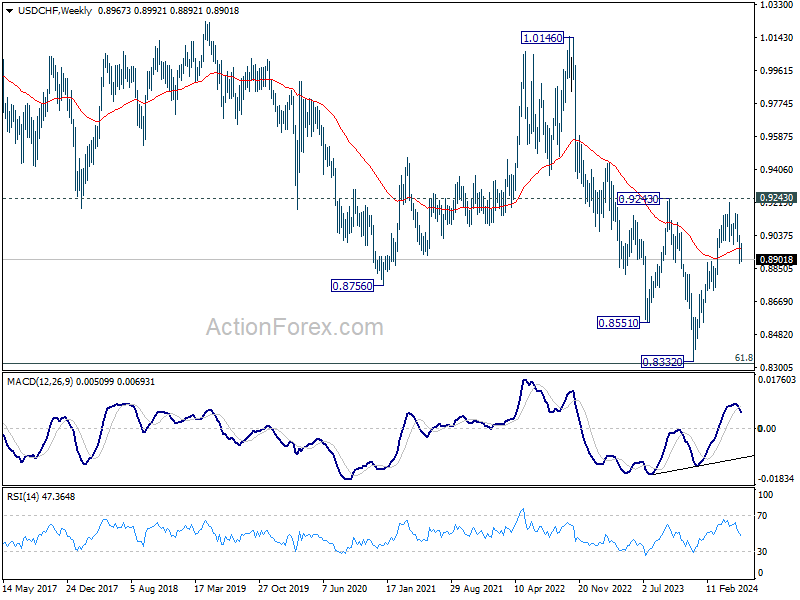
In the long term picture, price action from 0.7065 (2011 high) are seen as a corrective pattern to the multi-decade down trend from 1.8305 (2000 high). Strong rebound from 61.8% retracement of 0.7065 to 1.0342 (2016 high) will start the third leg as a medium term rally. But there will be no sign of long term reversal until firm break of 38.2% retracement of 1.8305 to 0.7065 at 1.1359.
AUD/USD Weekly Report
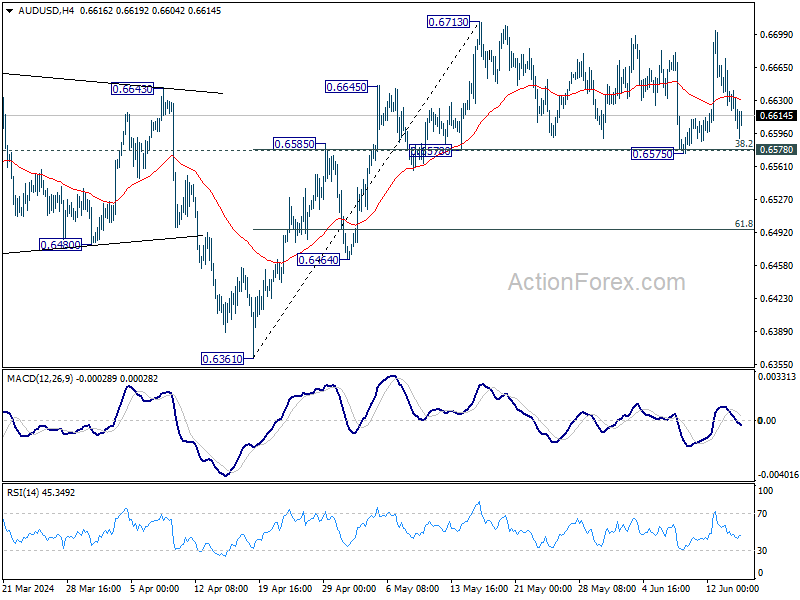
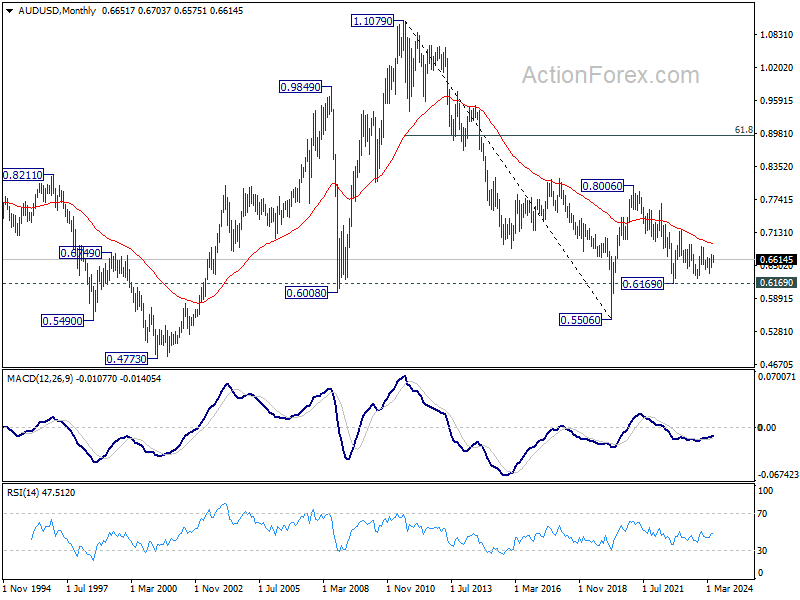
AUD/USD stayed in range of 0.6575/6713 last week and outlook is unchanged. Initial bias remains neutral this week first. Further rally is in favor with 0.6578 cluster support (38.2% retracement of 0.6361 to 0.6713 at 0.6579) intact. On the upside, firm break of 0.6713 will resume whole rise from 0.6361 to 0.6870 resistance next. However, sustained break of 0.6578 will dampen this bullish view, and bring deeper fall to 61.8% retracement at 0.6495.
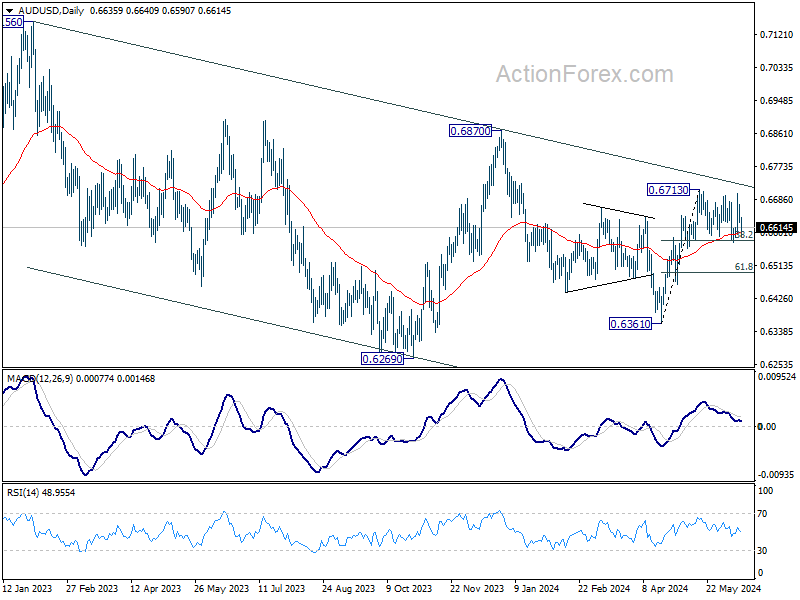
In the bigger picture, price actions from 0.6169 (2022 low) are seen as a medium term corrective pattern to the down trend from 0.8006 (2021 high). Fall from 0.7156 (2023 high) is seen as the second leg, which could have completed at 0.6269 already. Rise from there is seen as the third leg which is now trying to resume through 0.6870 resistance.
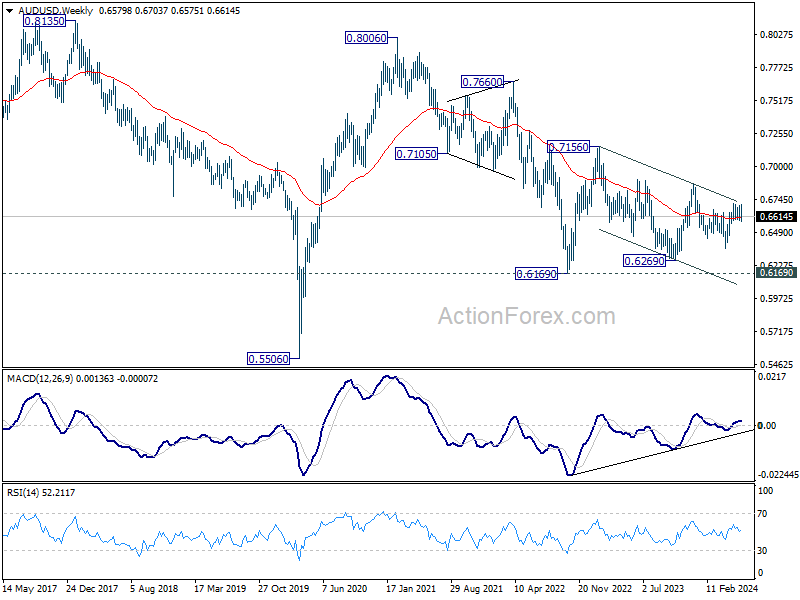
In the long term picture, the down trend from 1.1079 (2011 high) should have completed at 0.5506 (2020 low) already. It's unsure yet whether price actions from 0.5506 are developing into a corrective pattern, or trend reversal. But in either case, fall from 0.8006 is seen as the second leg of the pattern. Hence, in case of deeper decline, strong support should emerge above 0.5506 to bring reversal.
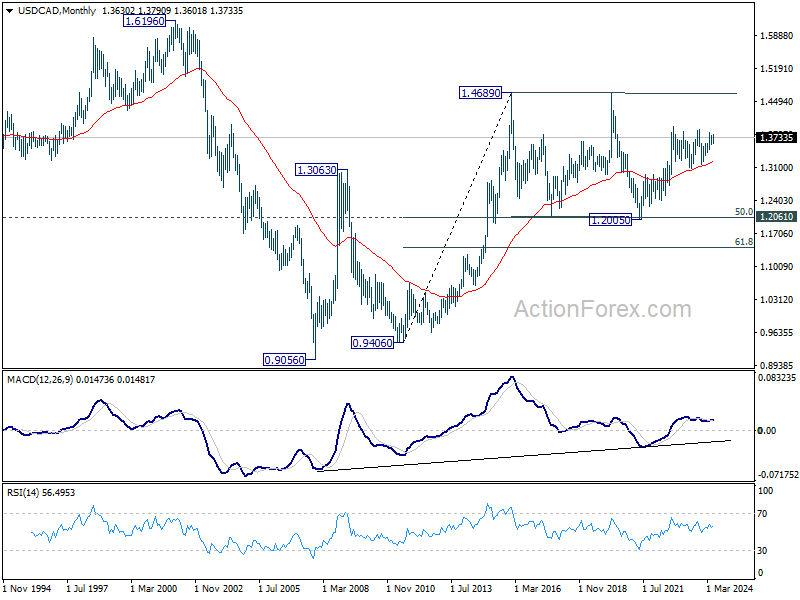
USD/CAD Weekly Outlook
USD/CAD edged higher to 1.3790 last week but retreated since then. Intraday bias remains neutral this week first. Corrective fall from 1.3845 should have completed already. Further rally is expected as long as 1.3662 support holds. Break of 1.3790 will target a retest on 1.3845 first. Nevertheless, break of 1.3662 will turn bias to the downside to extend the corrective pattern from 1.3845 with another falling leg.
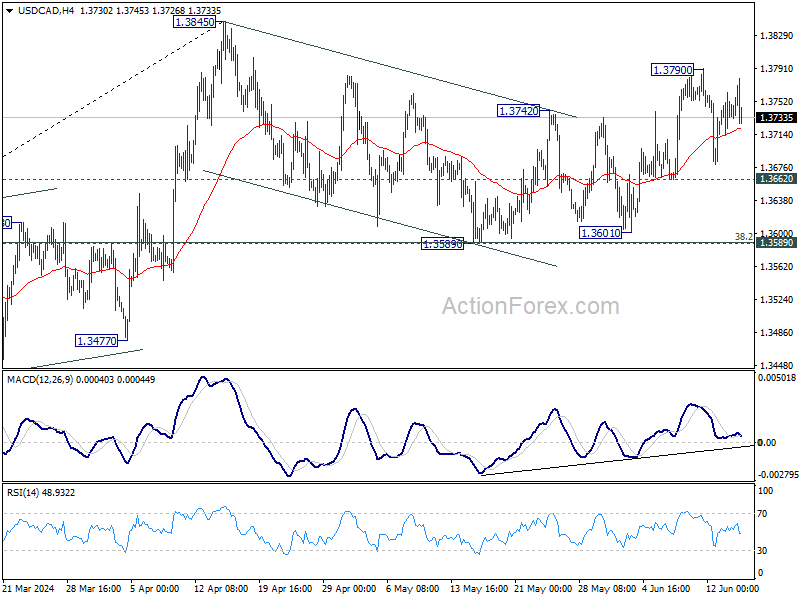
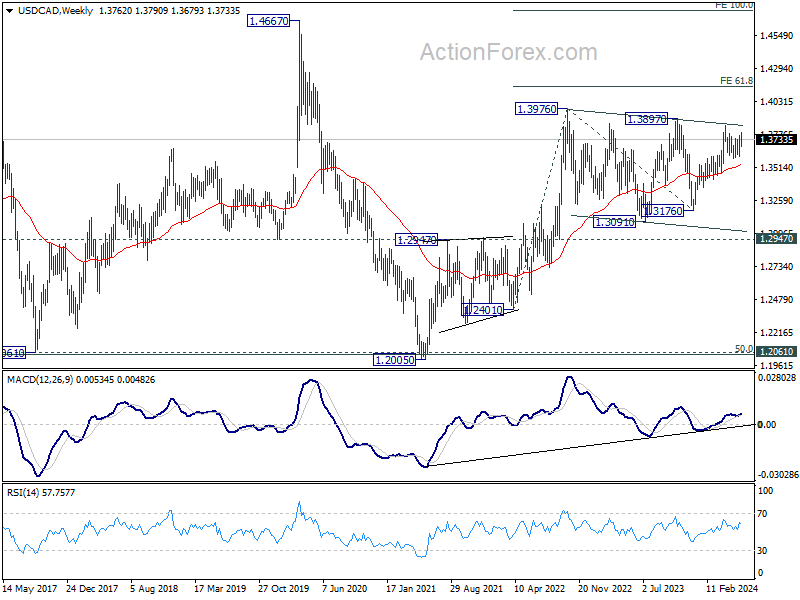
In the bigger picture, price actions from 1.3976 (2022 high) are viewed as a corrective pattern. In case of another fall, strong support should emerge above 1.2947 resistance turned support to bring rebound. Firm break of 1.3976 will confirm up resumption of whole up trend from 1.2005 (2021 low). Next target is 61.8% projection of 1.2401 to 1.3976 from 1.3176 at 1.4149.
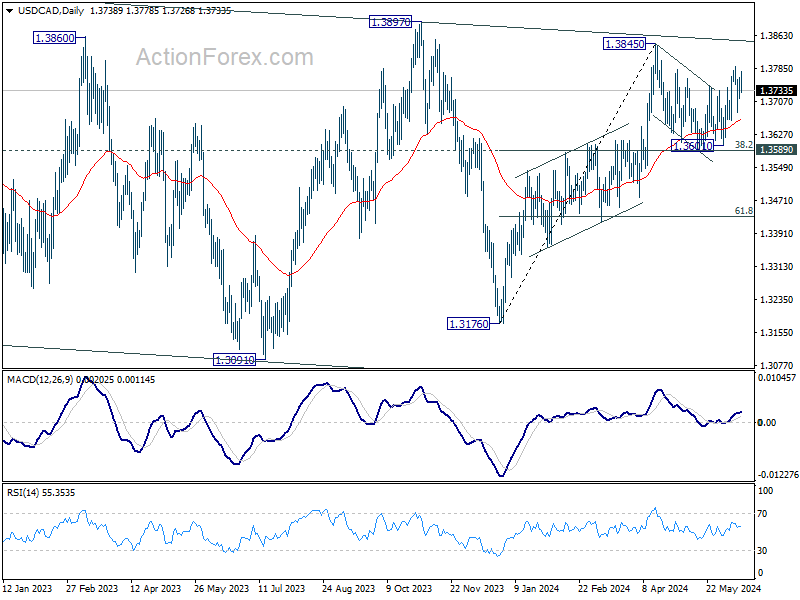
In the longer term picture, price actions from 1.4689 (2016 high) are seen as a consolidation pattern, which might have completed at 1.2005. That is, up trend from 0.9506 (2007 low) is expected to resume at a later stage. This will remain the favored case as long as 1.2947 resistance turned support holds.
GBP/JPY Weekly Outlook
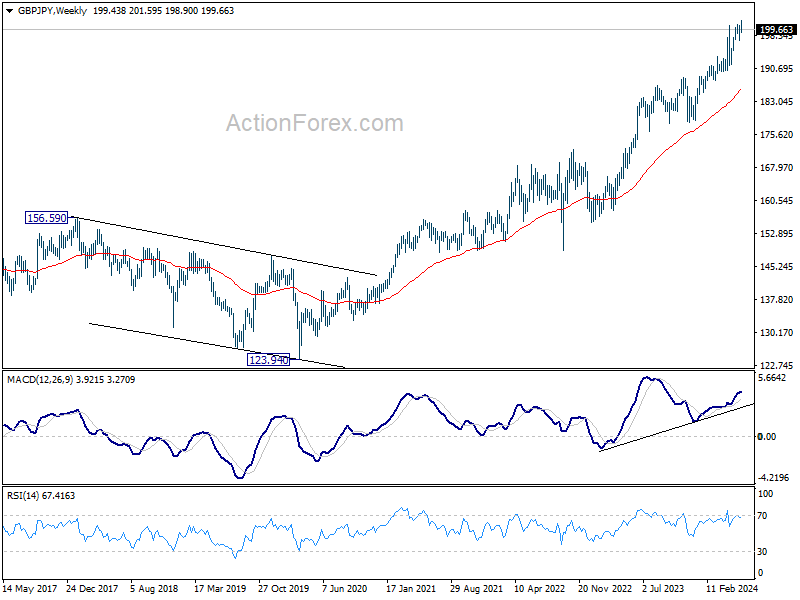
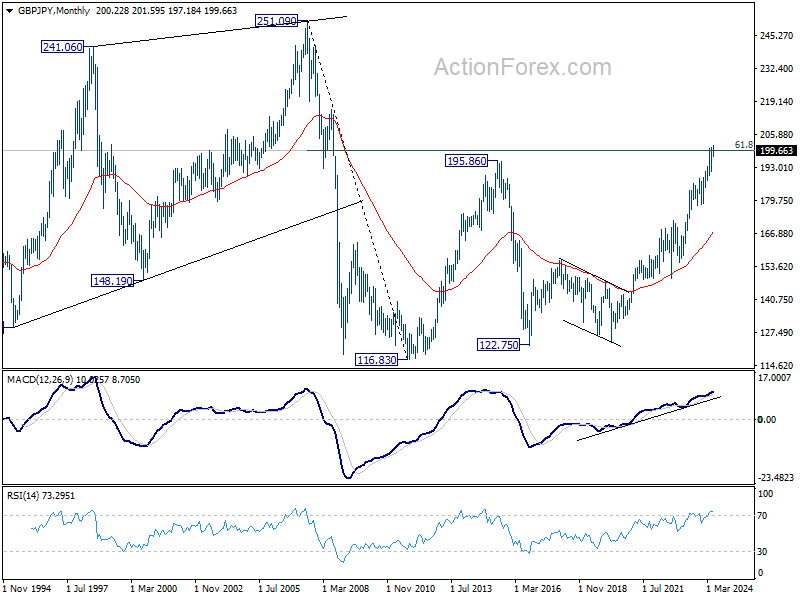
GBP/JPY's up trend resumed last week and edged higher to 201.59, but retreated notably since then. Initial bias is turned neutral this week first. Further rally is expected as long as 197.18 support holds. However, considering bearish divergence condition in 4 H MACD, firm break of 197.18 will confirm short term topping, and turn bias back to the downside for 191.34 support instead.
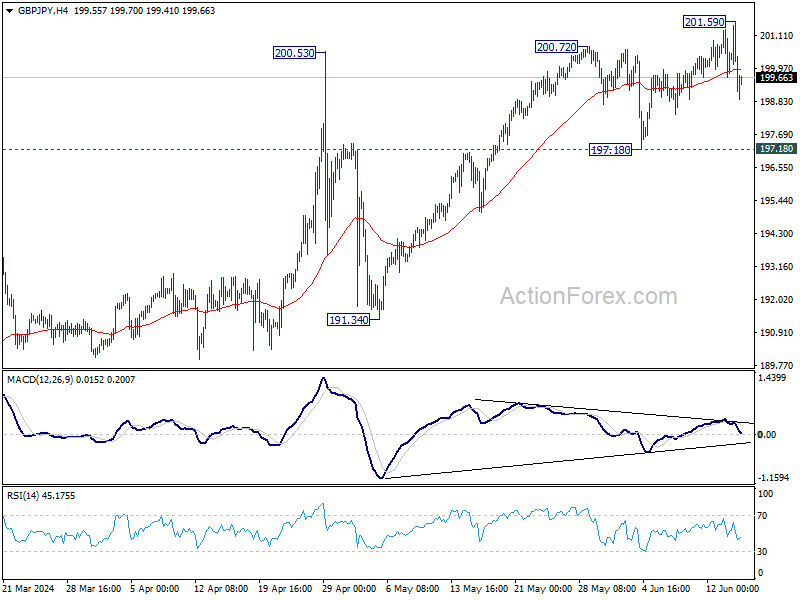
In the bigger picture, as long as 188.63 resistance turned support holds, long term up trend is expected to continue. Next target is 100% projection of 155.33 to 188.63 from 178.32 at 211.62.
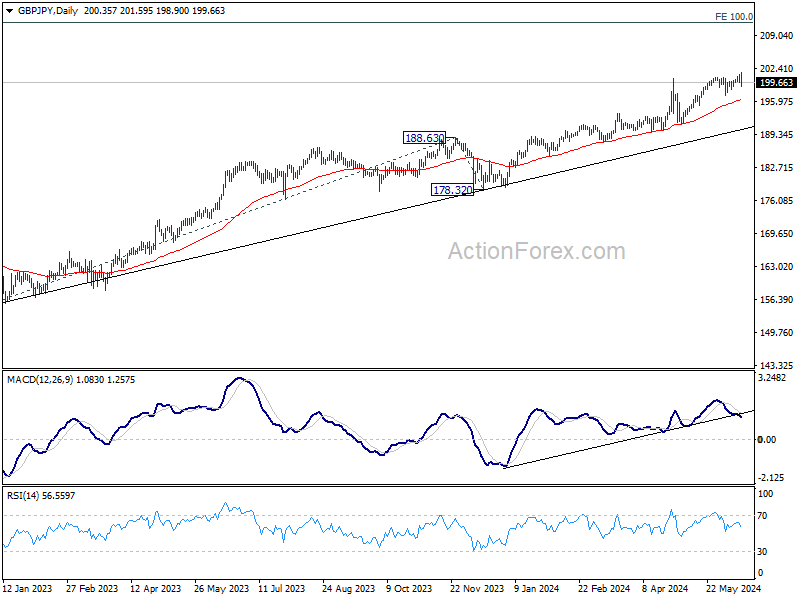
In the longer term picture, rise from 122.75 (2016 low) is seen as the third leg of the pattern from 116.83 (2011 low). Focus is now on 61.8% retracement of 251.09 (2007 high) to 116.83 at 199.80. Decisive break there would pave the way back to 251.09 in the long term.