
Sample Category Title
EUR/USD Mid-Day Outlook
Daily Pivots: (S1) 1.0709; (P) 1.0763; (R1) 1.0793; More....
Intraday bias in EUR/USD continues today and intraday bias stays on the downside for 1.0601 support. Firm break there will resume whole decline from 1.1138, as the third leg of the pattern from 1.1274, and target channel support at 1.0510. On the upside, above 1.0744 minor resistance will turn intraday bias neutral again first.
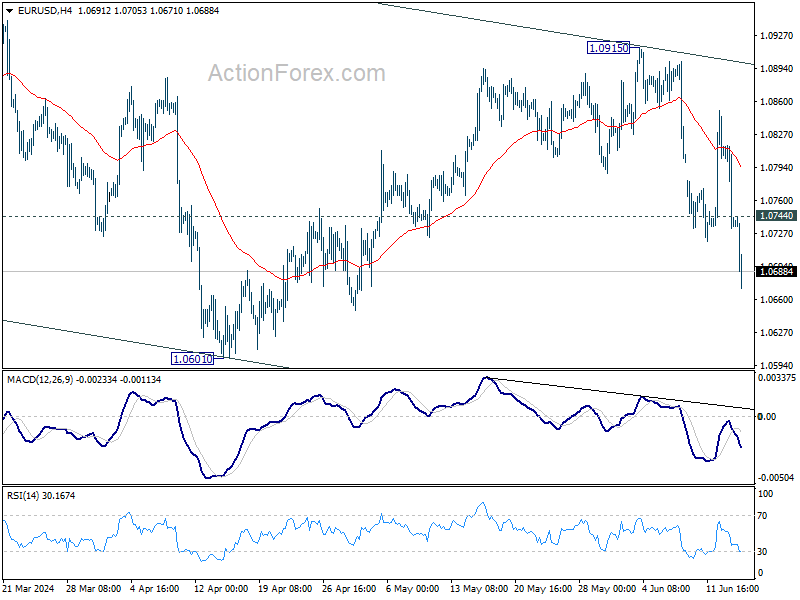
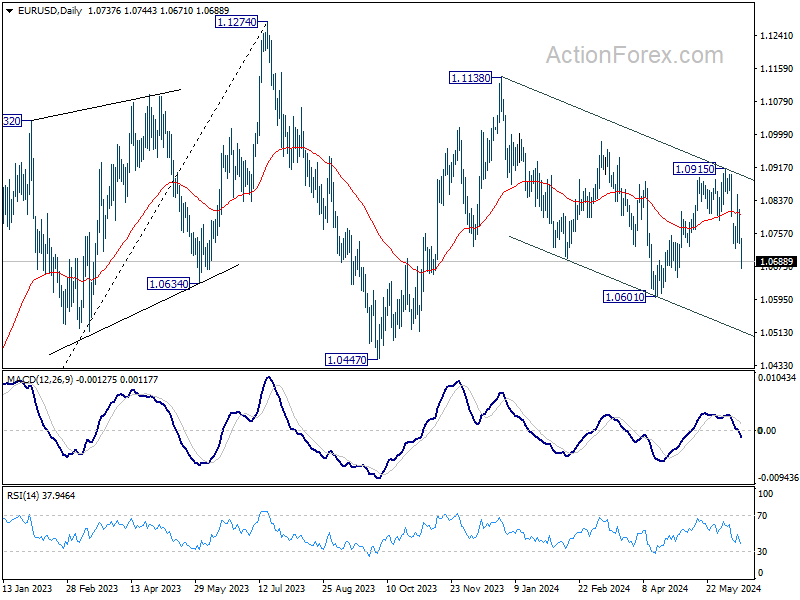
In the bigger picture, price actions from 1.1274 are viewed as a corrective pattern, which might still be in progress. Break of 1.0601 will target 1.0447 support and possibly below. Nevertheless, on the upside, firm break of 1.1138 will argue that larger up trend from 0.9534 (2022 low) is ready to resume through 1.1274 high.
Euro Resumes Decline as French Bond Risk Premium Surges Amid Political Turmoil
Euro is once again capturing market attention today as this week's significant selloff resumes. The steep decline has been driven by rising political tensions in France, as the snap parliamentary election called by President Emmanuel Macron has heightened investor anxiety, particularly as left-wing parties coalesce against him. There is a growing concern among market participants that the far-right, led by Marine Le Pen's National Rally, could secure a victory and promote a high-spending agenda, exacerbating France's already substantial debt burden.
This political uncertainty has triggered safe-haven flows towards German bonds, resulting in a drop in German benchmark yields while French yields have remained steady. Consequently, the spread between French and German borrowing costs is on course for its largest weekly increase since Eurozone debt crisis in 2011, and hit the highest level in four years. French stock market, represented by CAC 40, has also suffered, reaching its lowest level since January.
In parallel, Yen has managed to recover from its post-BoJ losses. BoJ Governor Ueda attempted to reassure markets by confirming that bond purchase tapering would commence in July, with the reduction expected to be "significant." However, Ueda stressed the importance of maintaining flexibility to ensure market stability. Meanwhile, he also suggested that interest rate adjustments could be possible in July based on upcoming economic and price data.
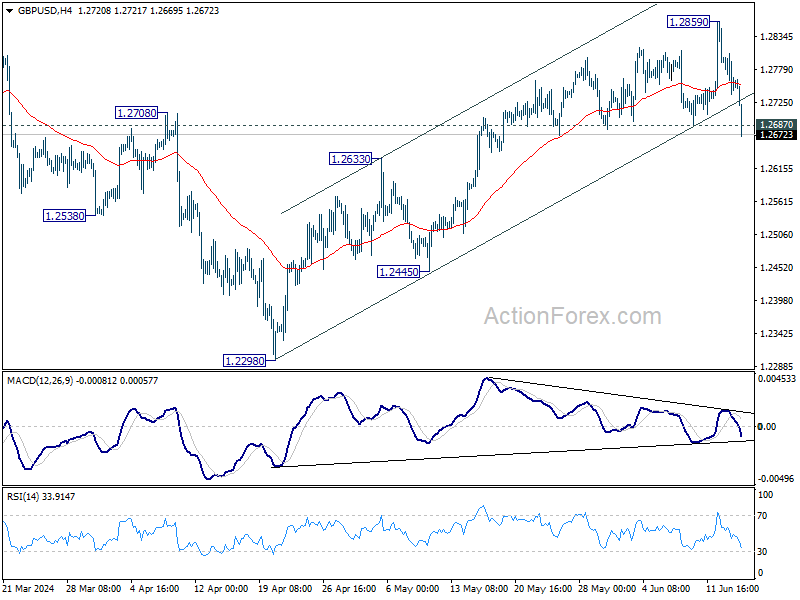
Technically, GBP/USD's break of 1.2687 support argues that rise from 1.2298 might have completed at 1.2859, on bearish divergence condition in 4H MACD. Firm break of 1.2633 resistance turned support will pave the way to 1.2445 next.
As the GBP/USD continues its decline, it will also be crucial to monitor whether AUD/USD breaks 0.6575 support and whether USD/CAD surpasses 1.3790 resistance, which would confirm underlying strength in Dollar.
In Europe, at the time of writing, FTSE is down -0.04%. DAX is down -1.18%. CAC is down -2.17%. UK 10-year yield is down -0.0589 at 4.070. Germany 10-year yield is down -0.104 at 2.370. Earlier in Asia, Nikkei rose 0.24%. Hong Kong HSI fell -0.94%. China Shanghai SSE rose 0.12%. Singapore Strait Times fell -0.81%. Japan 10-year JGB yield fell -0.0339 to 0.938.
Eurozone exports rises 14.0% yoy, imports up 1.8% yoy in Apr
Eurozone goods exports rose 14.0% yoy to EUR 247.6B in April. Goods imports rose 1.8% yoy to EUR 232.5B. Trade balance showed EUR 15.0B surplus. Intra-Eurozone trade rose 5.8% yoy to EUR 222.89B.
In seasonally adjusted term, goods exports rose 3.1% mom to EUR 245.3B. imports rose 2.3% mom to EUR 225.9B. Trade balance reported EUR 19.4B surplus, above expectation of EUR 17.0B. Intra-Eurozone trade rose 1.5% mom to EUR 217.7B.
BoJ holds interest rates, prepares for bond purchase reduction plan in next month
BoJ left uncollateralized overnight call rate unchanged at 0-0.10% as widely expected. In addition, BoJ will continue its asset purchase program until the end of June. The central bank, by an 8-1 majority vote, has also decided to reduce its JBG purchase amounts afterward.
The detailed plan for the reduction in JGB purchases, which will cover the next one to two years, is set to be determined by at next meeting. Apparently, BoJ would likely to have access to the new economic and price output report before laying out the plan.
BoJ is optimistic about Japan's economic prospects, projecting that the economy will grow at a rate above its potential growth rate. Core CPI is expected to increase through fiscal 2025 due to factors such as the waning effects of government economic measures. Furthermore, underlying inflation is predicted to gradually rise as the output gap improves and medium-to long-term inflation expectations climb.
NZ BNZ manufacturing falls to 47.2 in 15th month of contraction
New Zealand's BusinessNZ Performance of Manufacturing Index dropped from 48.8 to 47.2 in May, marking the sector's 15th consecutive month of contraction.
Looking as some details, production plummeted from 50.3 to 44.5, indicating a sharp return to contraction. Employment showed a slight decline from 50.9 to 50.6. New orders fell further from 45.4 to 44.4, maintaining their contraction for the 21st straight month. Finished stocks rose from 50.7 to 52.4, but deliveries fell from 48.1 to 45.2.
Despite the decline in the overall index, the proportion of negative comments decreased to 63.5% from 69% in April and 65% in March. Most negative feedback highlighted the general economic slowdown and the current recessionary pressures.
EUR/USD Mid-Day Outlook
Daily Pivots: (S1) 1.0709; (P) 1.0763; (R1) 1.0793; More....
Intraday bias in EUR/USD continues today and intraday bias stays on the downside for 1.0601 support. Firm break there will resume whole decline from 1.1138, as the third leg of the pattern from 1.1274, and target channel support at 1.0510. On the upside, above 1.0744 minor resistance will turn intraday bias neutral again first.
In the bigger picture, price actions from 1.1274 are viewed as a corrective pattern, which might still be in progress. Break of 1.0601 will target 1.0447 support and possibly below. Nevertheless, on the upside, firm break of 1.1138 will argue that larger up trend from 0.9534 (2022 low) is ready to resume through 1.1274 high.
Economic Indicators Update
| GMT | Ccy | Events | Actual | Forecast | Previous | Revised |
|---|---|---|---|---|---|---|
| 22:30 | NZD | Business NZ PMI May | 47.2 | 48.9 | 48.8 | |
| 03:23 | JPY | BoJ Interest Rate Decision | 0.10% | 0.10% | 0.10% | |
| 04:30 | JPY | Tertiary Industry Index M/M Apr | 1.90% | 0.40% | -2.40% | -2.30% |
| 04:30 | JPY | Industrial Production M/M Apr F | -0.90% | -0.10% | -0.10% | |
| 09:00 | EUR | Eurozone Trade Balance (EUR) Apr | 19.4B | 17.0B | 17.3B | 17.2B |
| 12:30 | CAD | Manufacturing Sales M/M Apr | 1.10% | 1.30% | -2.10% | |
| 12:30 | CAD | Wholesale Sales M/M Apr | 2.40% | 2.50% | -1.10% | -1.30% |
| 12:30 | USD | Import Price Index M/M May | -0.40% | 0.10% | 0.90% | |
| 14:00 | USD | Michigan Consumer Sentiment Index Jun P | 73 | 69.1 |
EURUSD in a Dramatic Downfall
- EURUSD corrects sharply down to 1½-month low; gives up previous gains
- Technical signals remain bearish; support expected near 1.0650-1.0660
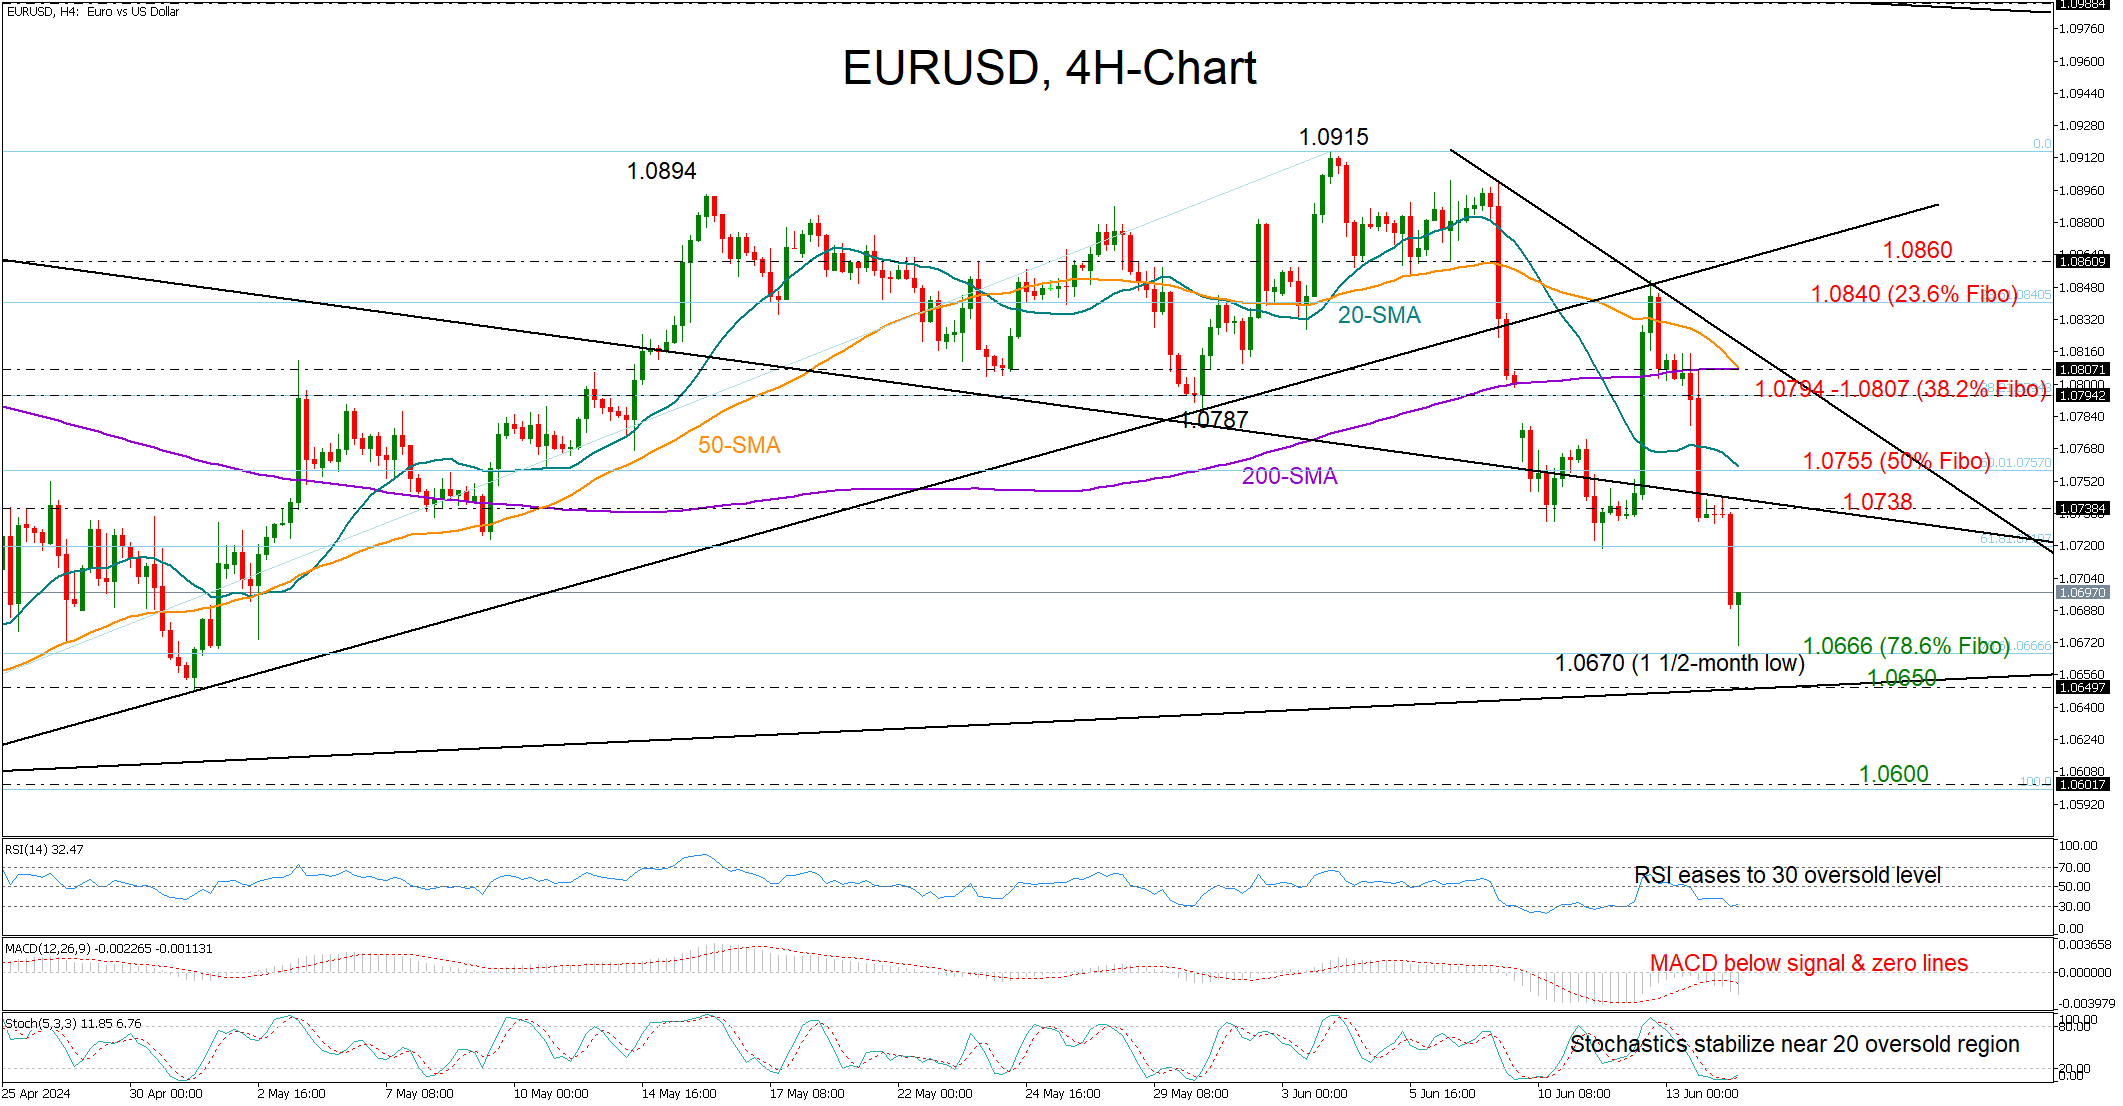
EURUSD continued to sink for the second consecutive day on Friday, reversing entirely its post-US CPI upturn and trimming a significant portion of its April-June uptrend to trade at a 1½-month low of 1.0670.
The sharp selling started after the bulls failed to climb above the support-turned-resistance trendline at 1.0850 and the 200-period simple moving average (SMA), while lower, the rejection near the former resistance line at 1.0745 motivated more downside today, putting the pair back on a bearish trajectory.
Both the RSI and the stochastic oscillator are positioned in the oversold territory, increasing optimism for some stability in the coming sessions as the 78.6% Fibonacci retracement of its previous uptrend is nearby at 1.0666. The tentative support trendline, which connects the lows from 2023 and 2024, is also within a short distance at 1.0650 and near May’s low. If the bears breach the latter, the door will open for the 1.0600 level again.
On the upside, the 1.0738-1.0755 constraining zone, which includes the 20-period SMA and the 50% Fibonacci level, could prevent a bullish continuation towards the 1.0794-1.0800 region. Even higher, the 23.6% Fibonacci of 1.0840 could renew selling pressures, blocking the way up to 1.0860.
In brief, EURUSD returned to bearish territory and could be at risk of losing more if the 1.0666-1.0650 support does not place a strong footing under the price.
German DAX: Torpedoed by Rising Geopolitical Risk Premium in Eurozone
- The rising power and influence of the EU’s far-right political parties have spooked European financial markets.
- A poll has indicated prominent French far-right National Rally party is leading by a significant margin over the incumbent President Macron’s party for the upcoming 1st round of the French legislative election on 30 June.
- The rapidly rising yield spread of the French and German 10-year government yields has triggered a reflexive negative feedback loop into the German DAX.
The rising popularity of the far-right political parties in the European Union has translated into a reckoning force to behold after they gained a significant foothold of votes in the European Parliament elections last Sunday, 9 June.
French President Macron’s centrist party has lost heavily to the far-right National Rally party led by Le Pen, a prominent leader of the far-right camp in the EU election which prompted Macron to call for a localized French legislative snap-election that is expected to be held in two rounds; the first round of voting starts on 30 June 2024 followed by the second round on 7 July 2024.
According to a poll conducted by Elabe on Thursday, 13 June, Le Pen’s far-right National Rally would win the first round of the French legislative election with 31%, a significant margin over Macron’s party that would come in third with 18%.
These poll results have further spooked European financial markets as policies advocated by French far-right political parties tend to favour looser fiscal policies that drive up the budget deficit and could negatively impact French economic growth in the medium term to long term.
Bond vigilantes are back in full force
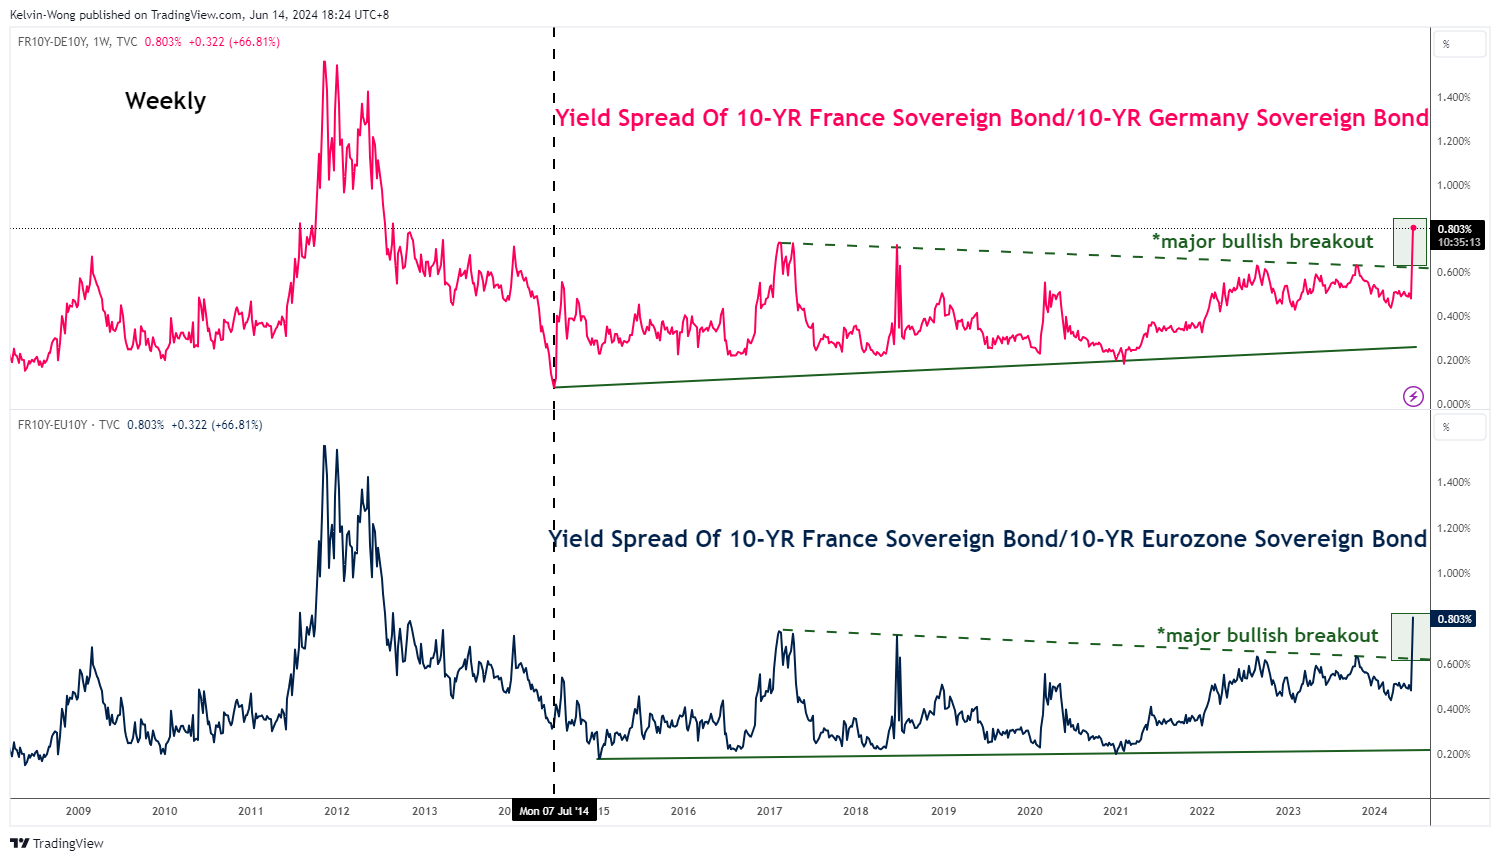
Fig 1: Yield spread of 10-year French & German government bonds as of 14 Jun 2024 (Source: TradingView, click to enlarge chart)
The bond vigilantes have already punished this potential upcoming lack of fiscal spending discipline in France. French sovereign bonds sold off, driving their yields over Germany and Eurozone government bonds to the highest level in almost 12 years.
The spread between the French and German 10-year government bond yields has widened to 81 basis points (bps) intraday at this time of the writing after a major bullish breakout from a basing formation, the most since August 2012 (see Fig 1).
The rout has also spread to the German stock market
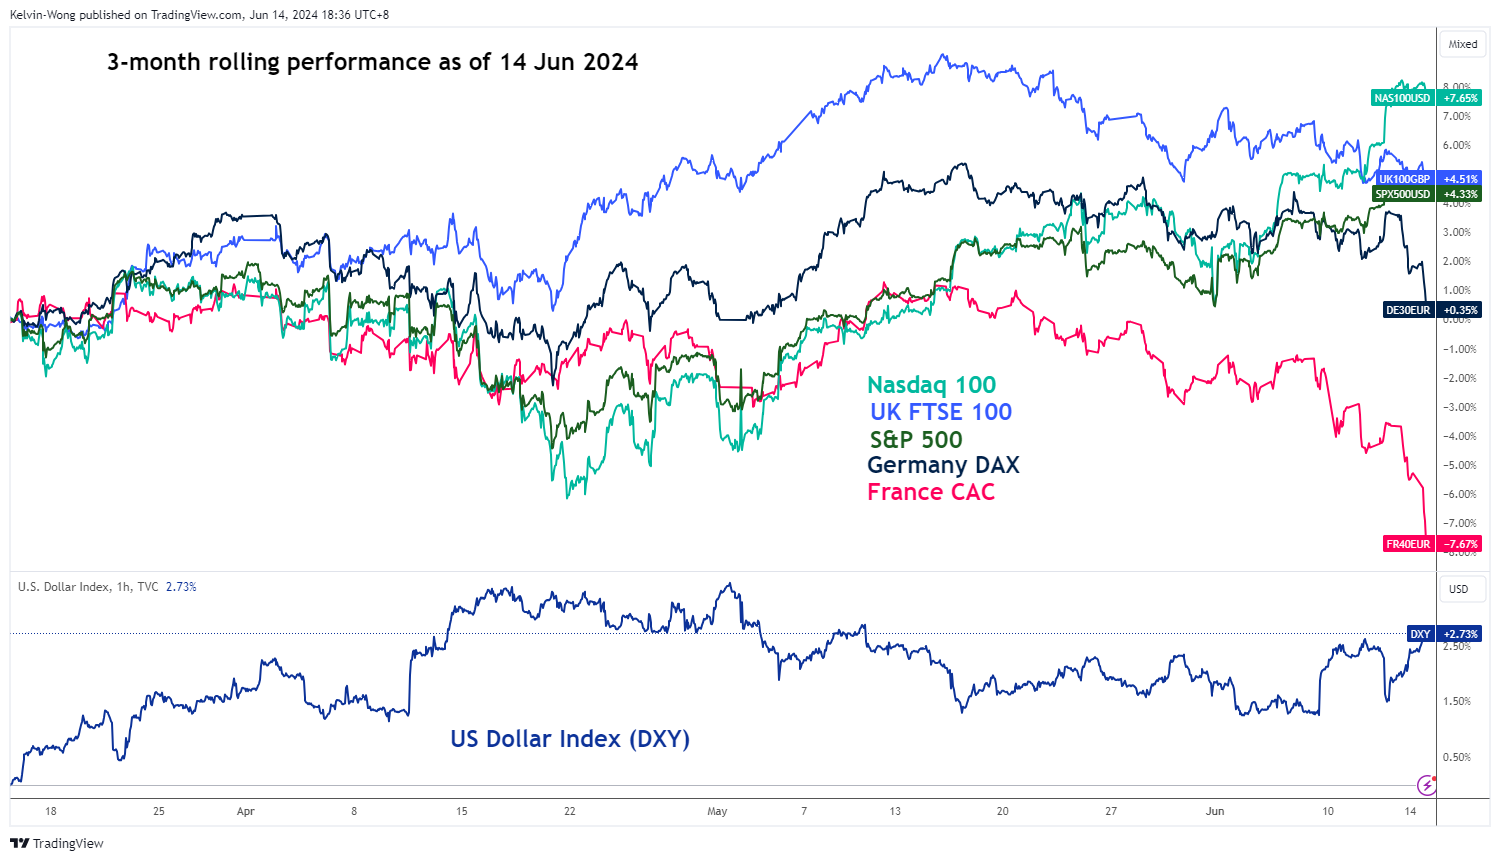
Fig 2: 3-month rolling performances of CAC 40 & DAX with US Dollar Index of 14 Jun 2024 (Source: TradingView, click to enlarge chart)
The French benchmark stock index, the CAC 40, has tumbled by 7.9% on a three-month rolling performance basis as of Friday, 14 June, a stark underperformance against the UK FTSE 100, the US S&P 500, and Nasdaq 100.
Given that France is one of the anchor economies in the European Union and Eurozone, any significant negative adverse movement in the French stock market is likely to trigger a similar cascading reflexive effect on other European stock markets, even the “mighty German DAX” has not been spared as its earlier positive performance in the past three months has dwindled to almost zero now (see Fig 2).
German DAX medium-term uptrend has been damaged
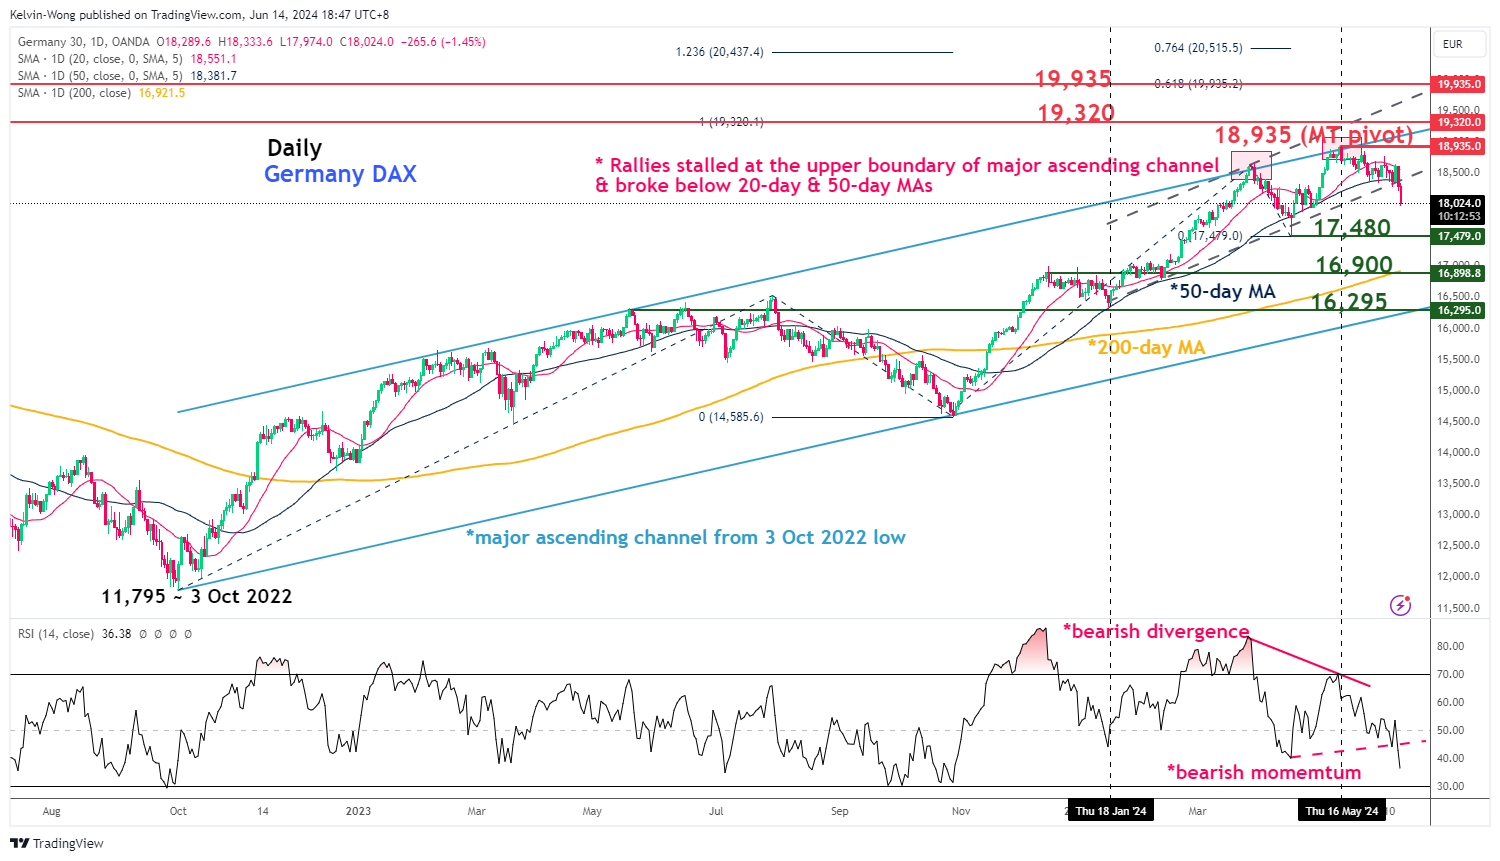
Fig 3: Germany DAX medium-term & major trends as of 14 Jun 2024 (Source: TradingView, click to enlarge chart)
The price actions of the Germany DAX CFD Index have staged a daily close below its 50-day moving average and the lower boundary of its medium-term ascending channel from the 18 January 2024 low.
In addition, a bearish momentum condition has been flagged by the daily RSI momentum indicator. Overall, these bearish elements have suggested that the bears are now in control where the Index is likely to shape a potential multi-week corrective decline sequence within its major uptrend phase that is still intact since its 3 October 2022 low of 11,795 (see Fig 3).
If the 18,935 key medium-term pivotal support is not surpassed to the upside, further weakness may prevail to expose the next medium-term supports at 17,480 and 16,900 (also the 200-day moving average).
On the other hand, a clearance with a daily close above 18,935 invalidates the bearish tone to see the continuation of the impulsive up move sequence for the next medium-term resistances to come in at 19,320 and 19,935.
NZ Dollar Slips on Soft Manufacturing Data
The New Zealand dollar is sharply lower on Friday. NZD/USD is down 0.61%, trading at 0.6130 in the European session at the time of writing.
New Zealand manufacturing PMI misses estimate
New Zealand’s manufacturing sector contracted for a 14th straight month in May. The manufacturing PMI fell to 47.2, down from 48.9. New orders have contracted for 21 consecutive months and production decelerated in May. Manufacturers expressed pessimism about New Zealand’s economic slowdown.
The New Zealand economy has been struggling. The past two quarters showed negative growth, indicating a recession, and GDP has contracted in five of the past six quarters. The Reserve Bank of New Zealand is under pressure to lower interest rates which are currently at 5.5% and provide some relief to businesses and households.
The problem for the central bank is that inflationary pressures remain high and are only falling slowly. The consumer price index rose 4.0% y/y in the March quarter, down from 4.7% in Q4 2023 but well above the upper band of the RBNZ’s 1% to 3% target range. The RBNZ meets next on July 10th and is expected to hold rates for an eight consecutive time.
US PPI softer than expected
In the US, producer prices were softer than expected in May. PPI fell by 0.2%, below the April reading of 0.5% and lower than the market estimate of 0.1%. Yearly, PPI ticked lower to 2.2%, down from a revised 2.3% in March and below the market estimate of 2.5%.
The soft PPI data comes on the heel of the May CPI report which also decelerated. The decline in these two inflation reports have raised expectations of a September rate cut, with a 61% of a quarter-point cut currently, compared to 46% just a week ago, according to CME’s FedWatch.
NZD/USD Technical
- NZD/USD is testing support at 0.6140. Below, there is support at 0.6065
- 0.6178 and 0.6253 are the next resistance lines
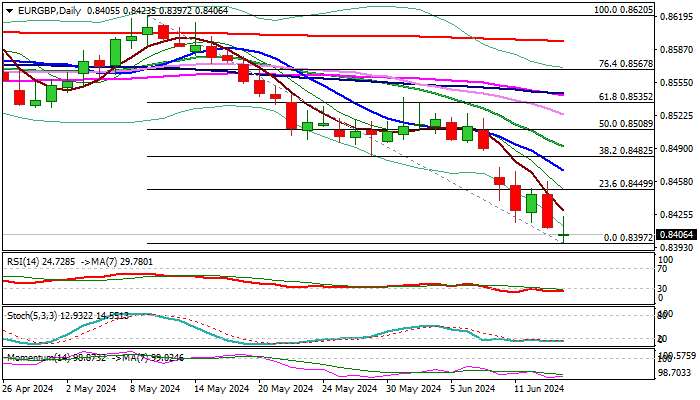
EUR/GBP: At New Multi-Month Low But Bears May Pause on Oversold Conditions
EURGBP hits new multi-month low (the lowest since early Aug 2022) on Friday and is on track for the biggest weekly loss since the first week of January, after starting to trade this week with gap lower, weighed by growing political uncertainty in France.
Bears cracked psychological 0.8400 support and eye target at 0.8339 (2 Aug 2022 low), but oversold daily studies suggest that consolidation / limited correction may precede.
Upticks should be capped under falling 10DMA (0.8468) to keep larger bears intact.
Only stronger bounce which would fill this week’s gap, would put bears on hold and allow for stronger correction.
Res: 0.8423; 0.8450; 0.8468; 0.8492.
Sup: 0.8397; 0.8339; 0.8276; 0.8211.
XTIUSD: Bearish and Bullish Scenarios, Key Levels, and Market Insights
Bearish Scenario: Sell below 77.50/77.81 with TP1: 77.36, TP2: 76.91, TP3: 76.26, and TP4: 76.00, with S.L. above 78.53 or at least 1% of account capital.
Bullish Scenario: Buy above 78.70 with TP1: 79.00 and TP2: 79.90, with S.L. below 78.00 or at least 1% of account capital. Apply trailing stop.
Fundamental Analysis:
The price of crude oil marked a significant drop on Wednesday following a substantial increase in crude inventories reported by the U.S. International Energy Agency (IEA) after hitting a key selling zone on May 30.
Subsequently, in a recent report, the IEA indicated that it believes oil demand will peak in early 2029 at around 106 million bpd, after projecting a peak for 2030. This report was supported by a similar one published by OPEC, which led to a recovery in prices on Thursday, a move that was almost completely discounted shortly after.
This optimism is supported by the seasonality of crude oil, where the summer months tend to be bullish due to increased fuel demand driven by higher travel and tourism.
However, there is still a bearish price trend, given the current higher supply, with countries like Russia reporting that their oil production in May exceeded the quotas agreed upon by the OPEC+ alliance.
Additionally, after the Fed left a perspective of higher rates for a longer period with just one rate cut, it is inferred that higher interest rates hinder economic growth, which in turn negatively impacts oil demand, a current driver that can keep prices under pressure.
Technical Analysis:
XTIUSD
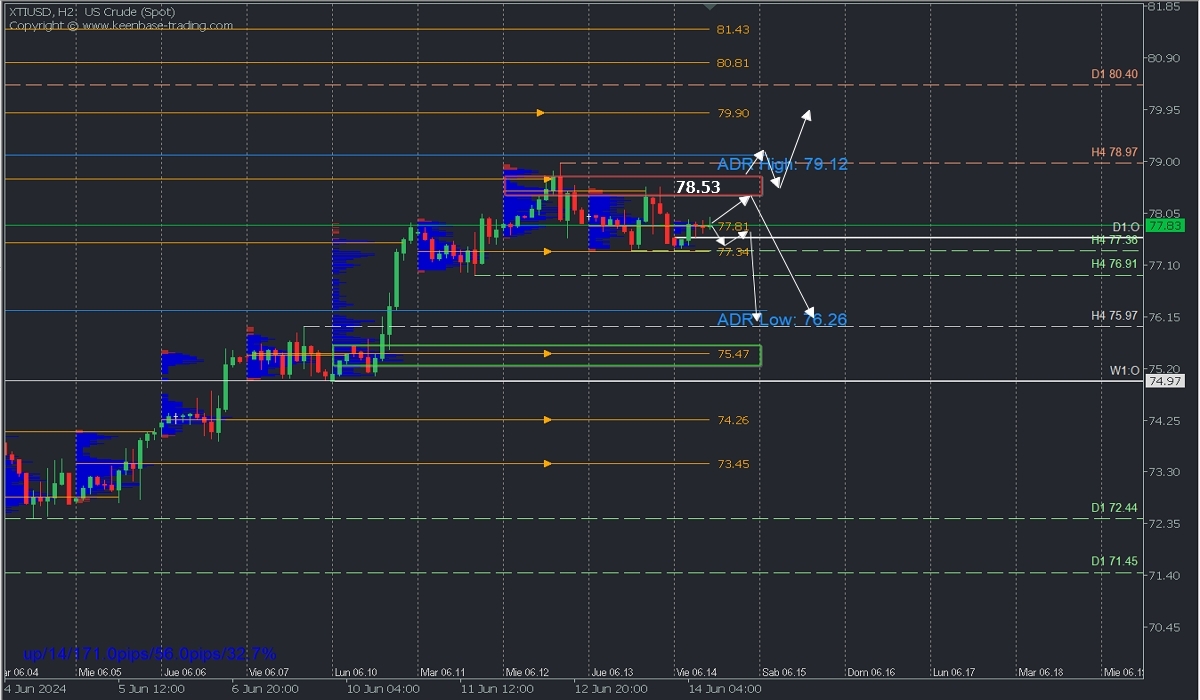
- Average Daily Range High (ADR High): 79.12
- Average Daily Range Low (ADR Low): 76.26
- Supply Zones (Sells): 78.46
- Demand Zones (Buys): 77.34
The price rally shows signs of exhaustion after forming a failure below the 78.97 resistance and creating a supply zone between 78.53 and 78.68, where the price is expected to rise to seek liquidity during the European morning before a new price decline is anticipated.
The continuation of the bearish price trend should follow two basic patterns:
1. Stay below the indicated supply zone marked with a red rectangle.
2. Decisively break, at least on a second touch, the demand zone around 77.34, opening the possibility to continue bearish towards 76.91 and the average daily range low at 76.26 intraday, the support at 75.97, and the demand zone around 75.47.
The anticipated bearish scenario will activate with the price below 77.81, the POC of the early sessions, and the break of the 77.36 support.
This scenario will be invalidated if the quotations decisively break the supply zone around 78.53, indicating a bullish continuation towards 79.00 and more extended to the supply zone at 79.90.
*Uncovered POC (Point of Control): POC = Point of Control: This is the level or zone where the highest volume concentration occurred. If there was a prior bearish movement from it, it is considered a sell zone and forms a resistance zone. Conversely, if there was a prior bullish movement, it is considered a buy zone, usually located at lows, thus forming support zones.
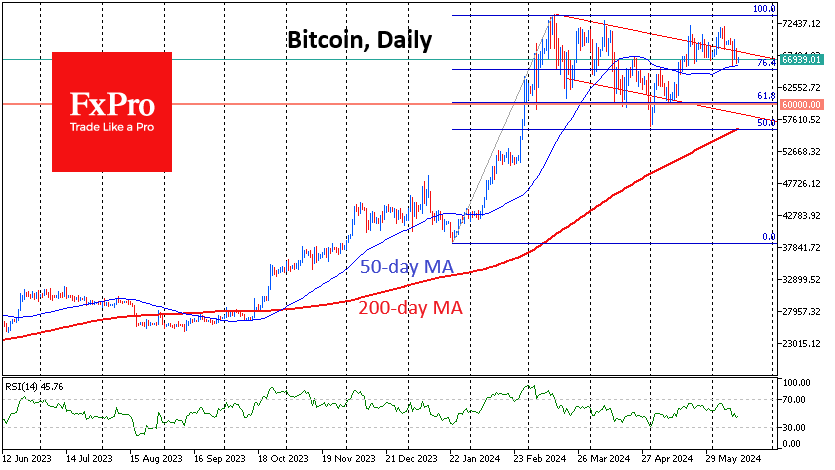
Crypto Bears in Charge
Market picture
Crypto market capitalisation fell 0.5% to $2.44 trillion as Thursday’s growth attempt failed to gain traction due to a new wave of dollar strength. Risk demand is gradually diminishing, forming a sequence of declining intraday highs. However, horizontal support remains in the 2.42 trillion area, where the market also stabilised from May 17th to 20th.
Bitcoin has pulled back below $67K, losing 0.7% in 24 hours. It continues to test the strength of the 50-day moving average, but it doesn’t find enough reason to dive lower. Such persistent testing of the lows sets the bears up for quick success with their next target at $60K.
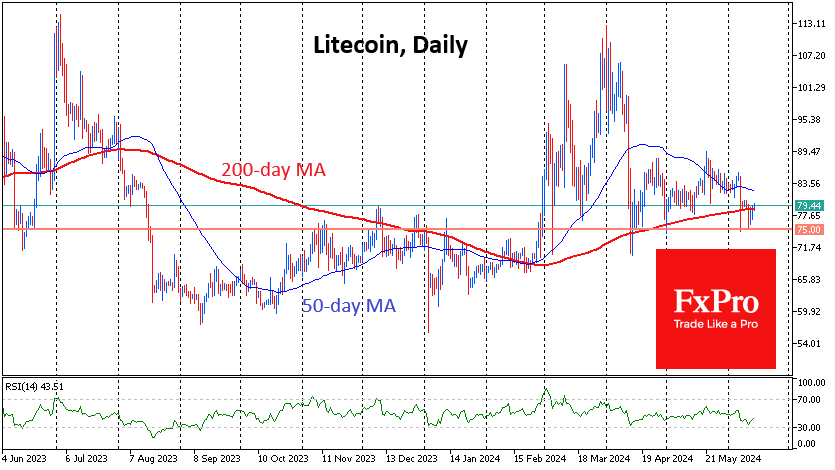
Litecoin is trying to cling to the 200-day moving average near $79.4. There has been support around $75 since March, which has been actively playing the role of resistance from November to January. A failure below promises to be a significant trend reversal signal, with next supports near $67 and $60.
News background
JPMorgan questioned the sustainability of the inflow of funds into spot bitcoin-ETFs. According to the bank’s experts, “the high rate of BTC both in relation to the cost of its mining and to the price of gold” may lead to a slowdown in investment growth.
According to on-chain analyst Ali Martinez, the reduced profitability of bitcoin mining due to the April halving has triggered a “wave of capitulation” by miners. Thus, it has simply not been profitable for most miners to mine Bitcoin lately.
Terraform Labs and its co-founder Do Kwon will pay the SEC $4.47bn after settling the ecosystem collapse. Terraform Labs will cease operations and hand over management of the network to the community.
MicroStrategy will place $500 million in eight-year convertible unsecured notes to “acquire additional bitcoins and fund general corporate purposes.”
The Block estimated that funds distributed through airdrops have exceeded $4bn since the beginning of the year. The top three largest airdrops were Jupiter, StarkNet, and Notcoin. Based on the number of tokens issued and average quotes in the following months, each project distributed about $1 bn. Airdrops from Wormhole, Ether follow them.fi, Friend.Tech, and Wen.
Australian authorities have banned the use of cryptocurrencies for online casino gambling. Companies that do not comply with the rules face fines of more than A$230K.
NZD/USD Exchange Rate Falls from Nearly 5-Month High
The NZD/USD exchange rate has dropped from its highest level in nearly five months. On Wednesday, following the release of US inflation data, the NZD/USD rate exceeded 0.6220 for the first time since 15 January 2024.
However, today the rate has fallen approximately 1.3% from Friday’s peak, suggesting that the market's reaction to the US inflation news was overly emotional.
According to Reuters:
→ Fed Chair Jerome Powell indicated a readiness to keep rates steady until clearer economic signals suggest a need for cuts.
→ Traders have reduced the likelihood of a Fed rate cut at the September meeting.
Meanwhile, the Reserve Bank of New Zealand does not plan to cut rates at all in 2024. According to Trading Economics, any rate cuts are unlikely before mid-2025.
Thus, the policies of the two central banks are balanced, and the current drop from nearly a 5-month high may be a return to a more balanced valuation after an emotional surge into overbought territory.
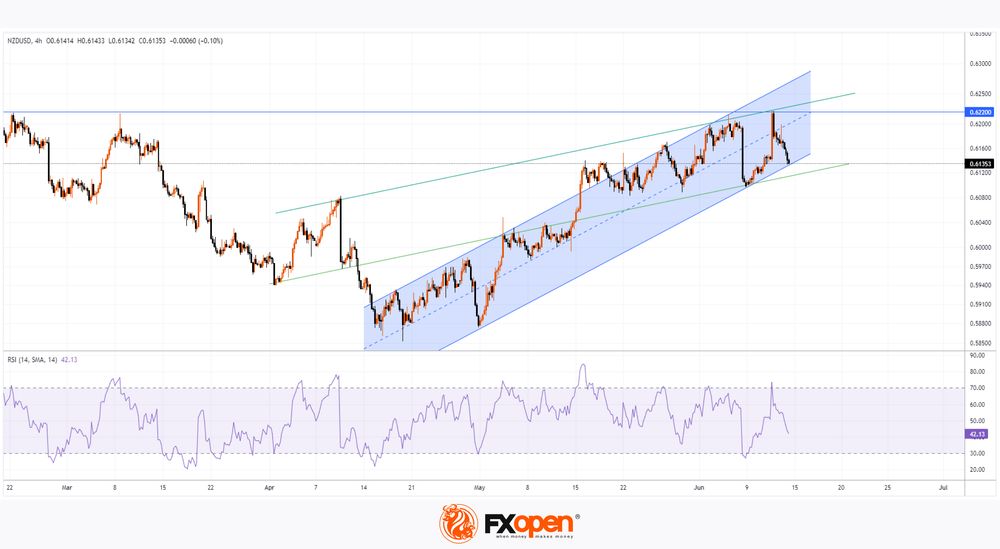
The RSI indicator supports this view.
Further technical analysis of the NZD/USD chart provides more valuable insights:
→ Since mid-April, the market has been in an ascending channel (shown in blue);
→ The June peak appears to be a false breakout of the April-March highs;
→ This week, the price failed to reach the upper boundary of the channel and fell sharply to the lower boundary – a bearish sign.
The lower boundary may provide support after Thursday's decline, but if this only leads to a weak rebound, the channel could become more vulnerable to a bearish breakout.
Trade over 50 forex markets 24 hours a day with FXOpen. Take advantage of low commissions, deep liquidity, and spreads from 0.0 pips. Open your FXOpen account now or learn more about trading forex with FXOpen.
This article represents the opinion of the Companies operating under the FXOpen brand only. It is not to be construed as an offer, solicitation, or recommendation with respect to products and services provided by the Companies operating under the FXOpen brand, nor is it to be considered financial advice.
Market Analysis: GBP/USD and EUR/GBP Poised For More Losses
GBP/USD failed to climb above 1.2860 and trimmed all gains. EUR/GBP is declining and trading below the 0.8410 support level.
Important Takeaways for GBP/USD and EUR/GBP Analysis Today
- The British Pound is showing bearish signs below 1.2800.
- There is a key bearish trend line forming with resistance near 1.2765 on the hourly chart of GBP/USD at FXOpen.
- EUR/GBP is declining and showing bearish signs below 0.8460.
- There is a major declining channel forming with support at 0.8410 on the hourly chart at FXOpen.
GBP/USD Technical Analysis
On the hourly chart of GBP/USD at FXOpen, the pair started a fresh decline from the 1.2860 zone. As mentioned in the previous analysis, the British Pound struggled to extend gains and declined below the 1.2800 support level against the US Dollar.
There was a clear move below the 61.8% Fib retracement level of the upward move from the 1.2706 swing low to the 1.2860 high. The pair even settled below the 1.2765 level and the 50-hour simple moving average.

The pair tested the 1.2740 support zone and the 76.4% Fib retracement level of the upward move from the 1.2706 swing low to the 1.2860 high.
It is now consolidating losses above the 1.2740 level. On the upside, the GBP/USD chart indicates that the pair is facing resistance near 1.2765 and a connecting bearish trend line. The next major resistance is near the 50-hour simple moving average at 1.2780.
A close above the 1.2780 resistance zone could open the doors for a move toward 1.2825. Any more gains might send it toward 1.2860. If not, the pair could resume its decline below 1.2740. On the downside, there is a key support forming near 1.2710.
If there is a downside break below the 1.2710 support, the pair could accelerate lower. The next major support is near the 1.2690 zone, below which the pair could test 1.2650. Any more losses could lead the pair toward the 1.2550 support.
EUR/GBP Technical Analysis
On the hourly chart of EUR/GBP at FXOpen, the pair struggled to gain pace for a move above 0.8520. The Euro settled below 0.8490 and started a fresh decline against the British Pound.
There was a clear move below the 0.8470 pivot level. The EUR/GBP chart suggests that the pair settled below the 50-hour simple moving average and 0.8460. A low is formed near 0.8412 and the pair is now consolidating losses.

Immediate resistance is near the 50% Fib retracement level of the downward move from the 0.8457 swing high to the 0.8412 low at 0.8435 and the 50-hour simple moving average.
The next major resistance could be near the 76.4% Fib retracement level of the downward move from the 0.8457 swing high to the 0.8412 low at 0.8445. A close above the 0.8445 level might accelerate gains. In the stated case, the bulls may perhaps aim for a test of 0.8470. Any more gains might send the pair toward the 0.8490 level.
Immediate support sits near 0.8410. There is also a major declining channel forming with support at 0.8410. The next major support is near 0.8380. A downside break below the 0.8380 support might call for more downsides. In the stated case, the pair could drop toward the 0.8350 support level.
Trade over 50 forex markets 24 hours a day with FXOpen. Take advantage of low commissions, deep liquidity, and spreads from 0.0 pips. Open your FXOpen account now or learn more about trading forex with FXOpen.
This article represents the opinion of the Companies operating under the FXOpen brand only. It is not to be construed as an offer, solicitation, or recommendation with respect to products and services provided by the Companies operating under the FXOpen brand, nor is it to be considered financial advice.