Sample Category Title
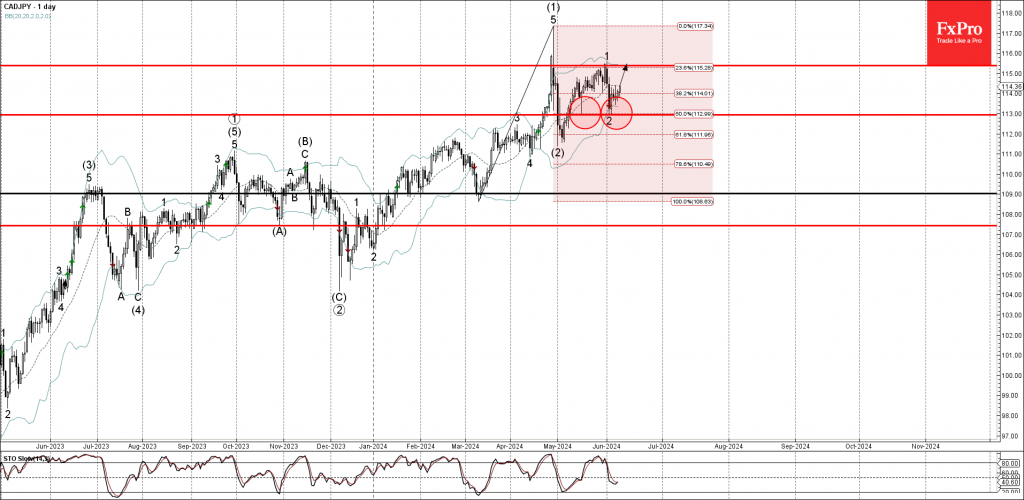
CADJPY Wave Analysis
- CADJPY reversed from key support level 113.00
- Likely to rise to resistance 115.40
CADJPY currency pair recently reversed up from the key support level 113.00 (that reversed the pair with the daily Hammer in the middle of May, as can be seen below).
The support level 113.00 was strengthened by the lower daily Bollinger Band and by the 50% Fibonacci correction of the previous upward impulse from March.
Given the predominant daily uptrend and the bearish yen sentiment, CADJPY be expected to rise further to the next resistance 115.40, top of the previous wave 1.
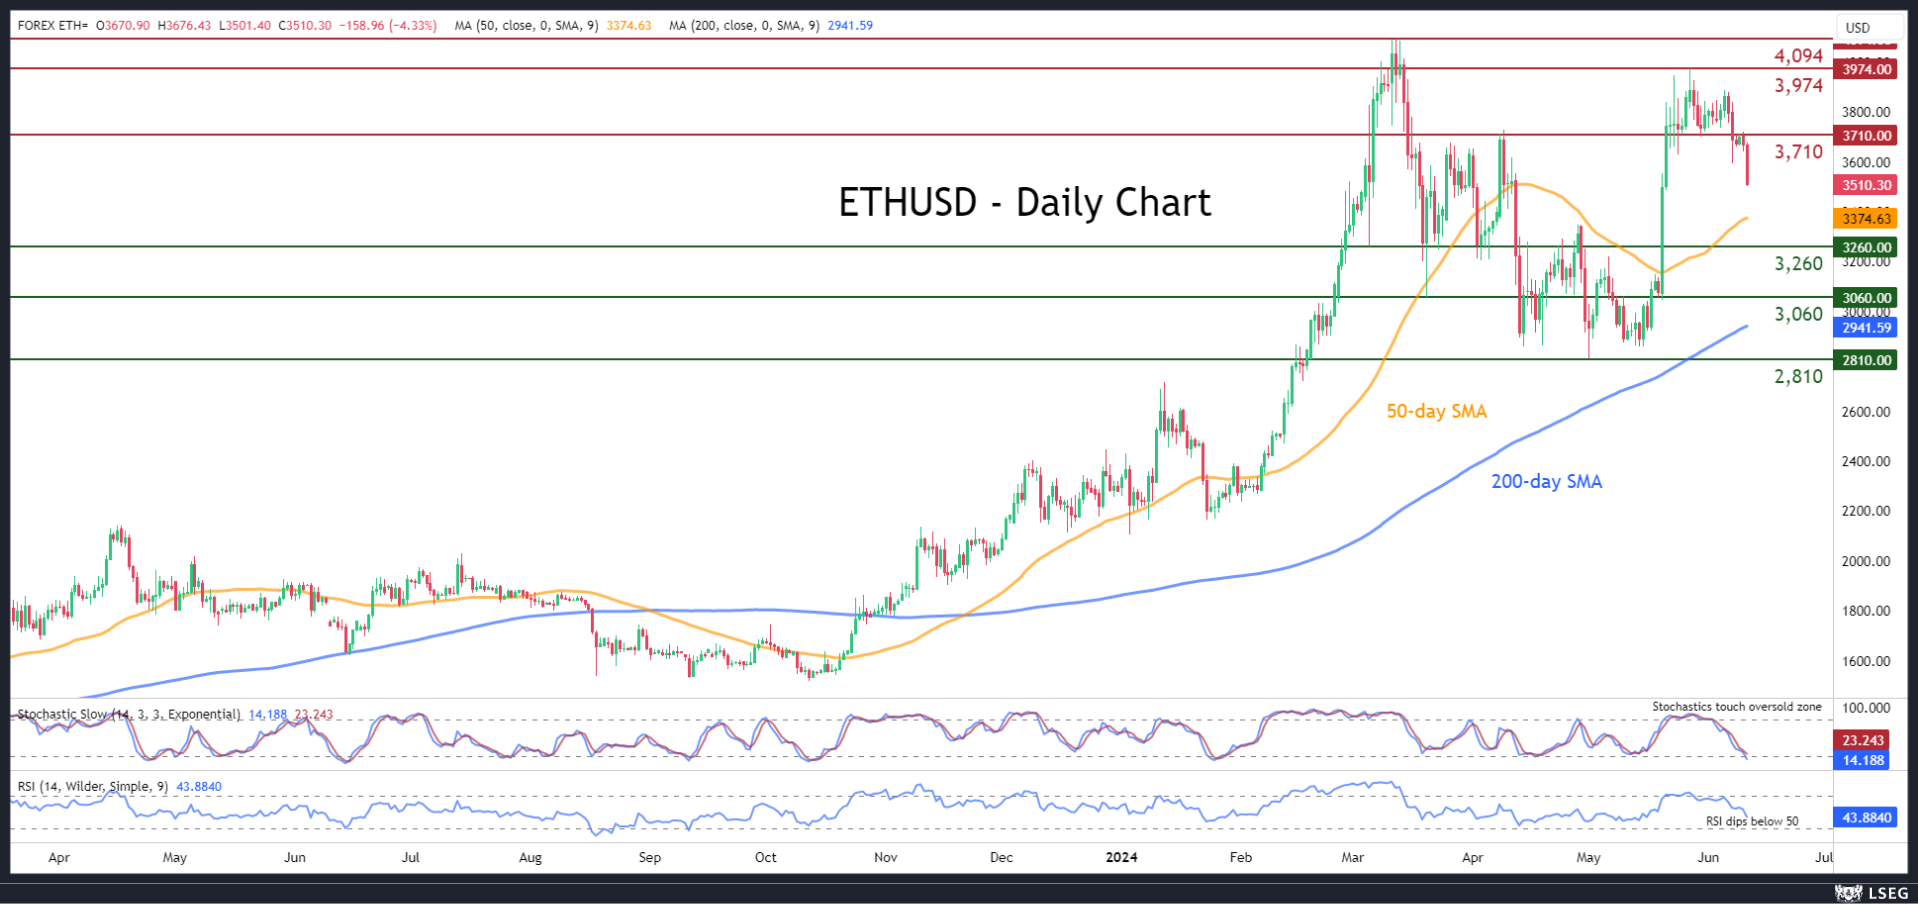
ETHUSD Declines Sharply Towards 50-day SMA
- ETHUSD posted 2-month high following ETF approval
- But retraced lower after a consolidation period
- Momentum indicators drop to negative territories
ETHUSD (Ethereum) experienced a strong rally in May, advancing to its highest levels since mid-March. However, after a period of rangebound trading, the price inched lower as the short-term oscillators retreated to their negative zones.
Should the pullback extend, initial support could be found at the March-April support of 3,260. Slicing through that barrier, the price might test the March bottom of 3,060. Lower, the bears could attack the May low of 2,810.
On the flipside, if the price reverses back higher, the April resistance of 3,710 could prove to be the first barricade for the bulls to overcome. A break above that zone could open the door for the recent two-month peak of 3,974. Further advances could then come to a halt at the 2024 peak of 4,094, which is also a more than two-year high.
Overall, ETHUSD has been experiencing a strong pullback in the past few sessions on the back of a stronger-than-expected NFP report. Moving forward, a test of the 50-day simple moving average (SMA) could decide whether the downside correction could deepen.
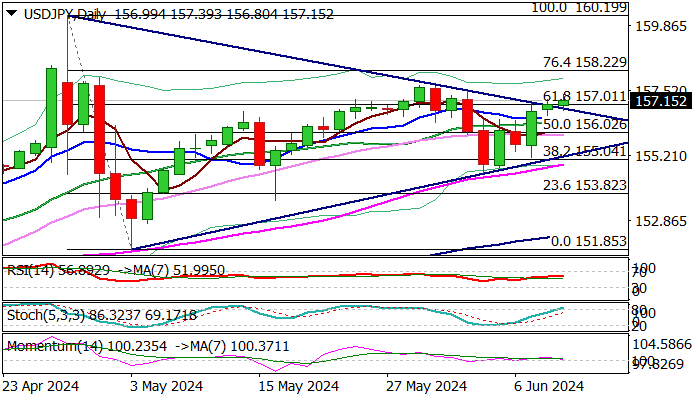
USD/JPY: Remains Constructive and Eyes US Inflation and Fed Verdict for Fresh Direction Signals
USDJPY remains constructive and probing above 157 barrier (the upper borderline of triangular consolidation and Fibo 61.8% of 160.19/151.85 bear-leg), but ranges are narrowing ahead of key releases this week – US inflation report and Fed rate decision, both due on Wednesday.
The dollar stands at the front foot following stronger than expected US jobs data, which adds to talks about further delay in Fed’s first rate cut, with bets gradually moving from September to November’s policy meeting.
US May CPI numbers and Fed dot plots will be in focus for fresh direction signals, with prevailing expectations for a hawkish scenario, which will keep the dollar inflated.
On the other hand, the Bank of Japan’s policymakers meet on Friday and may provide more details about QE tapering plan, as the central bank is expected to keep rates unchanged this time, but with growing expectations for a rate hike in July and total increase by 25 basis points by the end of the year.
More hawkishness from BoJ, along with their readiness to intervene again, if necessary, to support its national currency, may provide some support to yen.
Technical studies on daily chart are mixed, as MA’s remain in bullish configuration, positive momentum is fading and stochastic is overbought.
Expect initial positive signal on sustained break above 157.00 which would provide fresh boost to the price and expose targets at 157.70 (May 29 lower top) and 158.22 (Fibo 76.4% of 160.19/151.85).
Failure to clear 157 pivot would make the downside more vulnerable and risk test of first lower pivots at 156.10 (daily Tenkan-sen) and 155.76 (daily cloud top).
Res: 157.70; 158.22; 159.00; 160.19.
Sup: 156.83; 156.40; 156.10; 155.76.
Will Bank of Japan Hint at a July Hike?
- Investors see decent chance for BoJ hike in July
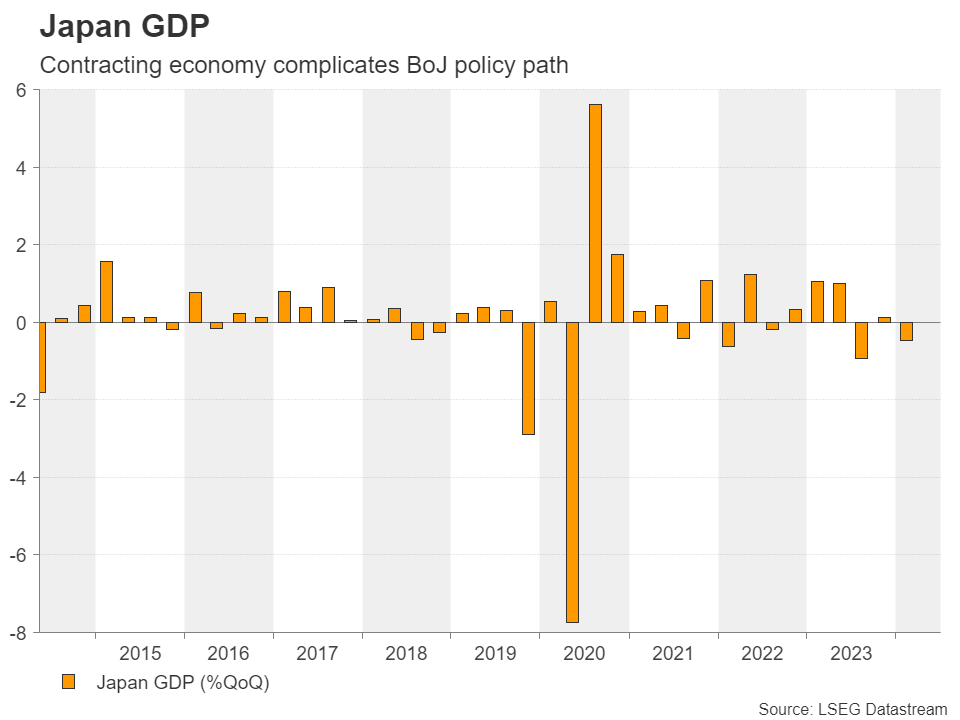
- But struggling economy complicates the policy outlook
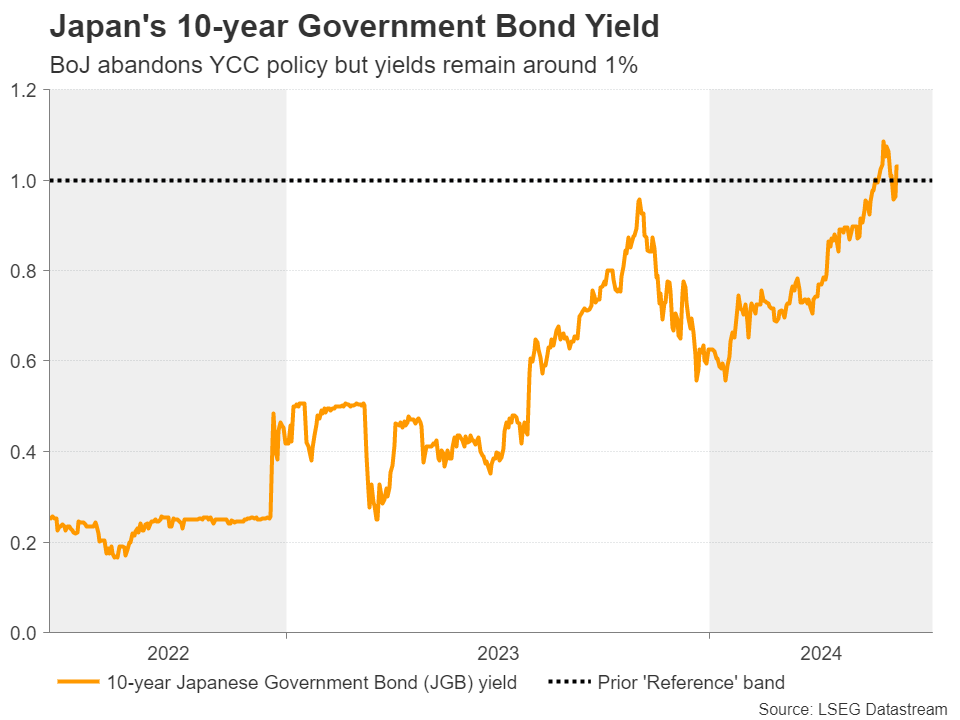
- Report on bond buying sets the hawkish bar even higher
- The Bank decides on Friday at 03:00 GMT
Obstacles in the road for the next BoJ hike
At its latest gathering on April 26, the Bank of Japan (BoJ) decided to keep the range for its benchmark rate unchanged between 0% and 0.1% as was widely expected. Policymakers upgraded their inflation projections, but they did not signal a reduction of their bond purchases, nor did they signal a strong intention to raise interest rates again soon. This resulted in a weakening yen and two intervention episodes by Japanese authorities in the following days.
Since then, data showed the world’s fourth largest economy contracted by more than expected in Q1, and inflation slowed in April, with the BoJ’s core CPI dropping below 2%. Although the Tokyo CPIs pointed to an acceleration on consumer prices in May, the struggling economy seems to be putting obstacles in the road for the next rate hike.
Yes, wage growth rebounded strongly in April, which brought real wages closer to entering expansionary territory, but this was largely expected after the strong pay hikes agreed during the spring wage negotiations.

Traders still assign decent chance for July hike
Investors are still assigning a decent 67% probability for another 10bps hike in July, which means that there is ample room for disappointment should the Bank appear less hawkish than expected when it meets on Friday.
On top of that, Nikkei cited unnamed sources saying that the Bank will consider whether to scale back its 6trn yen in monthly Japanese Government Bond (JGB) purchases. The key part here is “will consider whether”, which means that they could decide not to reduce their purchases, at least not at this gathering.
Will disappointment lead to another intervention?
This combined with absent signals about a hike next month could push the yen lower to test once again its recent lows against the US dollar, and perhaps trigger a new round of intervention.
For the yen to stage a meaningful recovery, the Bank of Japan needs, not only to announce a reduction in its monthly bond purchases, but also to provide strong signals that a rate hike is on the cards.
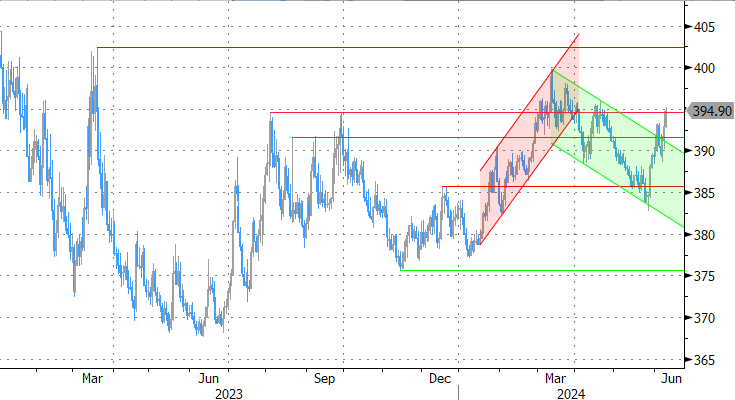
Dollar/yen remains in uptrend mode
From a technical standpoint, dollar/yen has been in a recovery mode since June 5, when it hit support at the crossroads of the 154.50 barrier and the 50-day exponential moving average (EMA).

In the bigger picture, the pair is still in an uptrend mode, which means that the bulls could add to their long positions without hesitation if the BoJ disappoints once again. A break above the high of May 29 at around 157.70 may allow advances towards the round figure of 160.00, near where Japanese authorities decided to intervene back on April 29.
For the outlook of dollar/yen to turn bearish, the price may need to drop below the key support territory of 151.85. That zone supported the pair on May 3, and offered strong resistance back in October 2023.
Sunset Market Commentary
Markets
Euro weakness remains name of the game in the wake of French President Macron’s snap election call as his coalition got whacked in EU elections. ECB comments played a role as well. EUR/USD set a new sell-off low around 1.0730 from starting levels near 1.0775. Macron’s proposal to join forces on the center(-left/right) aisle of the political specter to boost changes at the June 30 ballot fell in deaf man’s ears. The extreme-right on the contrary does seem to be readying that same strategy as Le Pen’s Rassemblement National wouldn’t mind teaming up with Reconquête. Simultaneously, there were rumors that President Macron would resign though these were later denied by a person close to Macron. The President is set to hold a press conference to set out his campaign. The return of European political risk premia lifted credit spreads for a second session straight. The 10-yr OAT/swapspread hit 38 bps intraday for the first time since early 2014. The level compares to 25 bps last Friday. The weaker European credits feel the contagion. The 10-yr BTP/swapspread widened for example from 112 bps to 122 bps. Spanish (54 bps) and Belgian (36 bps) widened only 3 bps with the likely shift to a more orthodox fiscal policy helping BGB’s outperform following this weekend’s national and regional elections. ECB Villeroy sounded somewhat more dovish than some of his colleagues. He confirmed that there was no preset rate path for the second half of the year but labelled further rate cuts as the decisive orientation. This contrasts somewhat with others calling for a restrictive monetary policy before raising the victory flag on inflation. ECB chief economist Lane said that last week’s rate cut was timely and that more cuts are possible if enough progress to the 2% target is made. The front end of the German yield curve outperforms significantly today with German yields sliding up to 7.2 bps (2-yr). Market positioning played a role as well as markets reduced the probability of a September ECB rate cut to only 50% yesterday after Lagarde suggested that the policy rate cut could be kept stable for consecutive policy meetings.
EUR/GBP extended losses from 0.8460 to 0.8420. A disappointing labour market report - admittedly with more stubborn wage pressure – only triggered a kneejerk response in GBP. UK Gilts nevertheless rallied with the front end underperforming as well. UK yields lost 5.4 bps (2-yr) to 1.7 bps (30-yr). The same reasoning goes for the Bank of England as market positioning recently turned much more hawkish (only rate cut only discounted by November).
News & Views
Czech inflation was unchanged in May from April (0% M/M). After an unexpected up-tick from 2% to 2.9% Y/Y last month, inflation declined back to 2.6% Y/Y. The Czech Statistical Office reported rather insignificant moves in most divisions of the consumer basket, often offsetting each other. Prices of goods decreased by 0.2% M/M and prices of services increased 0.2% M/M. Compared to the same month last year prices of goods in total and of services respectively went up by 0.9% Y/Y and 5.3%. The Czech national Bank (CNB) said that annual inflation was just 0.1 ppt higher in May than in its spring forecast. This small positive difference was mainly driven by volatile food prices. Growth in administered prices was also somewhat stronger than forecasted. Significantly lower growth in fuel prices and a further slight drop in core inflation (2.5% vs 2.7% forecast) had the opposite effect. The CNB maintains its assessment that inflation will be close to the 2% target this year. The Czech 2-y swap yield declined 7 bps as markets still ponder whether the CNB will cut rates by 25 or 50 bps later this month, with the former still seen as more likely. the krone weakened from EUR/CZK 24.65 to 24.73.
Sentiment among US small businesses improved in May to the strongest level Ytd. The confidence index of the National Federation of Independent Businesses (NFIB) rose from 89.7 to 90.5. Even so, the index holds below the historical average for the 29th month. The uncertainty index rose nine points to 85, the highest level since November 2020. On the positive side, owners’ plans to hire improved from 12% to 15%. A net of 28% (from 26%) also plans price hikes. On a downbeat note, 6% of owners reported that financing was their top problem, up from 4% in April and the highest level since June 2010. 22% of owners still reported that inflation was their single most important problem in operating their business, unchanged from April and the top business problem among owners. The balance of expected profit trends (-30%) remains deeply negative and deteriorated further.
Graphs
10-yr OAT/swapspread rises to highest level since early 2014 in the run-up to French elections
EUR/HUF arrives at potentially pivotal level in determining next MNB policy move
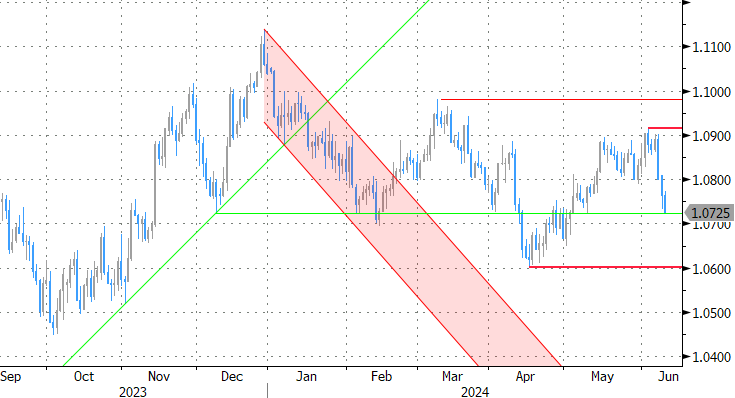
EUR/USD: no saving the euro for now. EU political risk gets embedded in FX rate
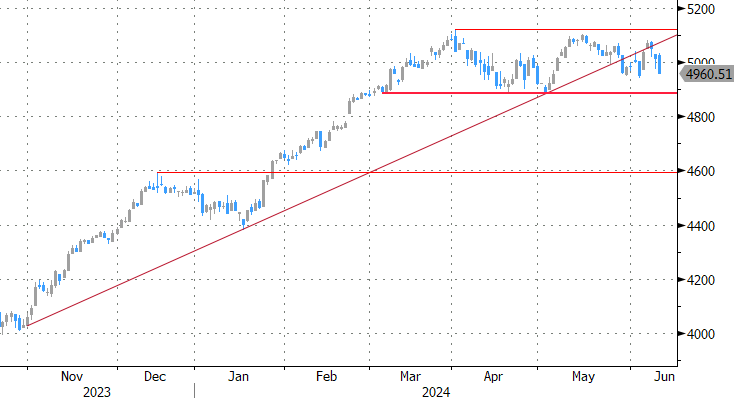
EuroStoxx50: deteriorating EU risk sentiment pulls index lower within sideways Q2 trading range
US: Small Business Optimism Index Improves in May
NFIB's Small Business Optimism Index rose 0.8 points to 90.5 in May, beating market expectations for a flat reading of 89.7.
Half of the ten subcomponents improved on the month, three deteriorated, and two remained unchanged. The improving categories included expectations for the economy to improve (up 7 point to -30%), expectations for credit conditions to ease (up 2 points to -7%), and plans for capital expenditures in the next six months (up 1 point to 23%). The declining categories were related to the net share of firms reporting higher current and expected earnings, with the former down 3 points to -30% and the latter down 1 point to -13%.
The net share of businesses planning to increase employment increased for a second consecutive month, rising by 3 points to 15%. The share of firms with unfilled job openings rose 2 points to 42%. Quality of labor concerns edged higher with 20% of business owners identifying this as their top business problem, but it continued to come second to inflation concerns which were unchanged in May.
The net share of firms currently increasing employee compensation fell 1 point to 37%, while the net share planning to do so over the next three months fell 3 points to 18%. The share of businesses 'raising' average selling prices was unchanged at 25% while the share of those 'planning’ to raise average selling prices rose 2 points to 28%.
Key Implications
Small business confidence improved for a second consecutive month in May, driven by increases in hiring and capital expenditure intentions. A modest plurality of small businesses continue to report that now is a good time to expand, and sentiment about the economic outlook has improved by 20 points over the past year. However, tight credit conditions continue to weigh on small business sentiment.
Despite lingering tightness in the labor market, wage pressures among small businesses eased in May. The net share of firms currently raising compensation is back around the upper bound of the pre-pandemic level, with the net share of firms raising prices following a similar trend. This should help to normalize inflation pressures over time. We won't have to wait long to see how May's sentiment may have translated to prices, with May's Consumer Price Index report coming tomorrow, followed by the Federal Reserve's policy decision later in the day.
EUR/USD Mid-Day Outlook
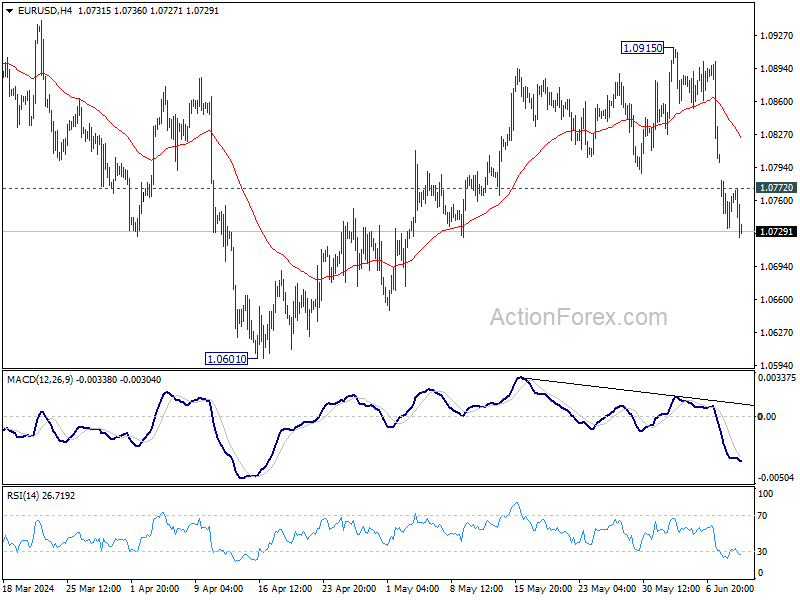
Daily Pivots: (S1) 1.0739; (P) 1.0760; (R1) 1.0787; More....
EUR/USD's fall from 1.0915 is in progress and intraday bias stays on the downside. This decline is seen as another falling leg of the corrective pattern from 1.1274. Further decline should be seen to retest 1.0601 support next. On the upside, above 1.0772 minor resistance will turn intraday bias neutral first. But risk will stay on the downside as long as 1.0915 resistance holds, in case of recovery.
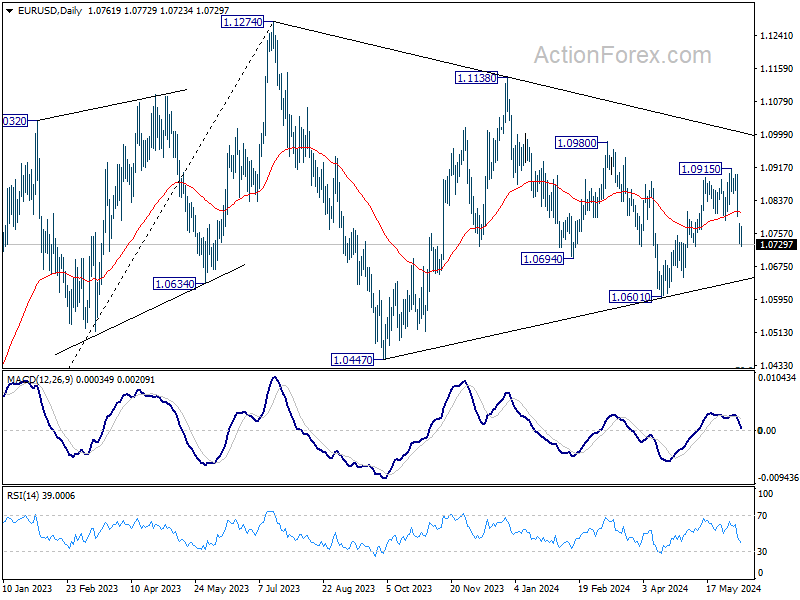
In the bigger picture, price actions from 1.1274 are viewed as a corrective pattern, which might still be in progress. Break of 1.0601 will target 1.0447 support and possibly below. Nevertheless, on the upside, firm break of 1.1138 will argue that larger up trend from 0.9534 (2022 low) is ready to resume through 1.1274 high.
GBP/USD Mid-Day Outlook
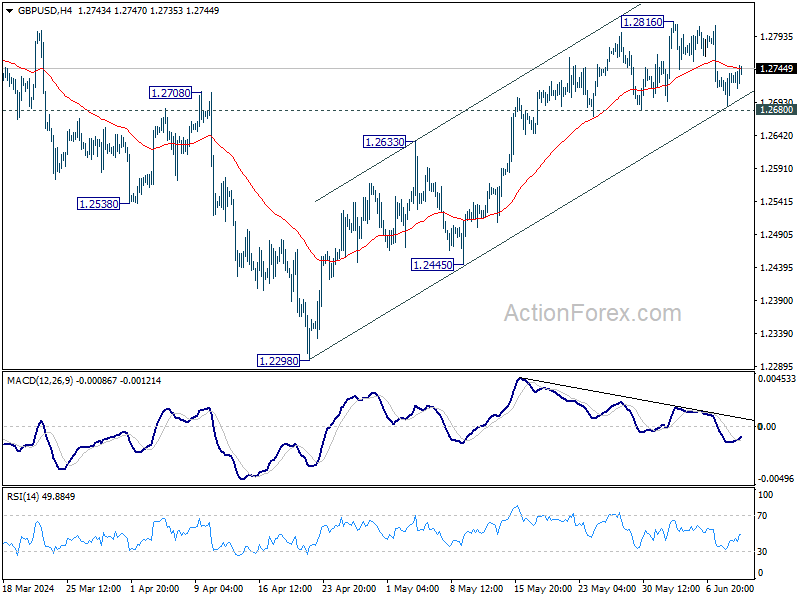
Daily Pivots: (S1) 1.2700; (P) 1.2719; (R1) 1.2749; More...
Intraday bias in GBP/USD stays neutral as sideway trading continues. Considering bearish divergence condition in 4H MACD, firm break of 1.2680 support will turn bias back to the downside for 55 D EMA (now at 1.2651) and possibly below. Nevertheless, break of 1.2816 will resume the rise from 1.2298 to 1.2892 resistance.
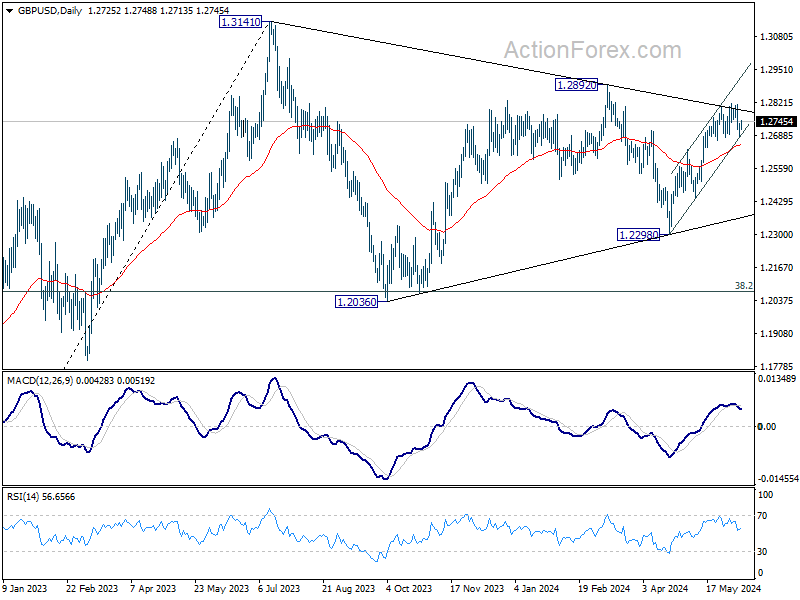
In the bigger picture, price actions from 1.3141 medium term top are seen as a corrective pattern. Fall from 1.2892 is seen as the third leg which might have completed already. Break of 1.2892 resistance will argue that larger up trend from 1.0351(2022 low) is ready to resume through 1.3141. Meanwhile, break of 1.2445 support will extend the corrective pattern with another decline instead.
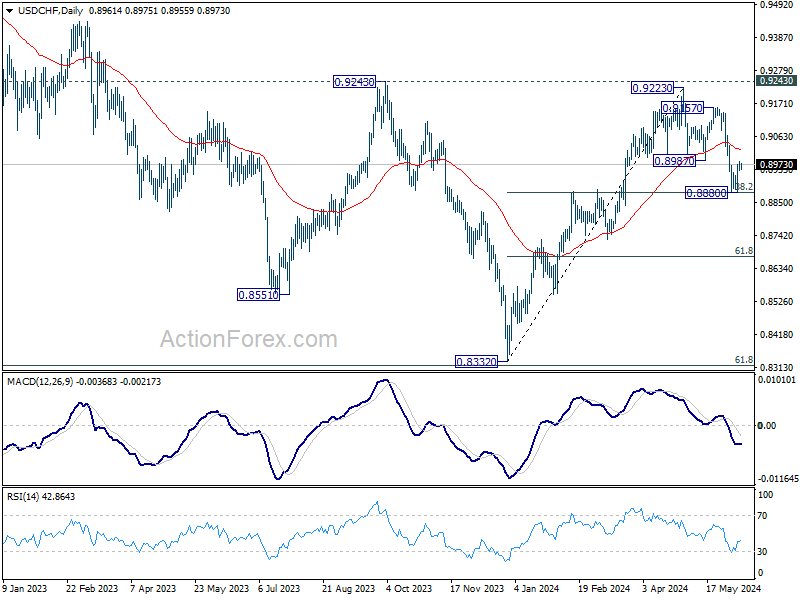
USD/CHF Mid-Day Outlook
Daily Pivots: (S1) 0.8952; (P) 0.8969; (R1) 0.8982; More….
USD/CHF is still bounded in range of 0.8880/8987 and intraday bias remains neutral. On the upside, firm break of 0.8987 support turned resistance will argue that correction from 0.9223 has completed, after drawing support from 0.8883 fibonacci level. Intraday bias will be back on the upside for 0.9157/9223 resistance zone. Nevertheless, sustained break of 0.8883 fibonacci level will carry larger bearish implications and bring deeper decline.
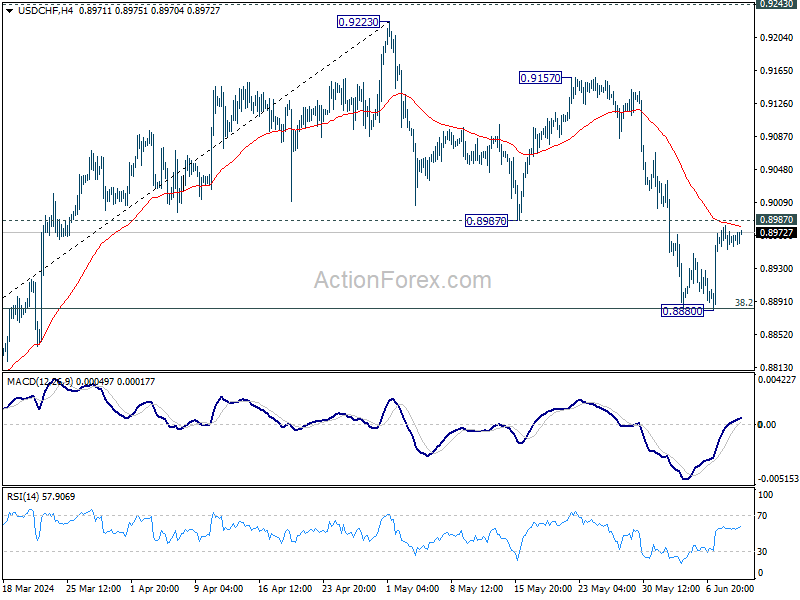
In the bigger picture, price actions from 0.8332 medium term bottom are tentatively seen as developing into a corrective pattern to the down trend from 1.0146 (2022 high). Rejection by 0.9243 resistance, followed by sustained break of 38.2% retracement of 0.8332 to 0.9223 at 0.8883 will strengthen this case, and maintain medium term bearishness. However, decisive break of 0.9243 will argue that the trend has already reversed and turn medium term outlook bullish for 1.0146.