Sample Category Title
GBPUSD Retreats from Almost 3-month High
- GBPUSD advances to its highest level since March 13
- But then reverses lower as rally got overstretched
- Momentum indicators ease but remain in positive zones
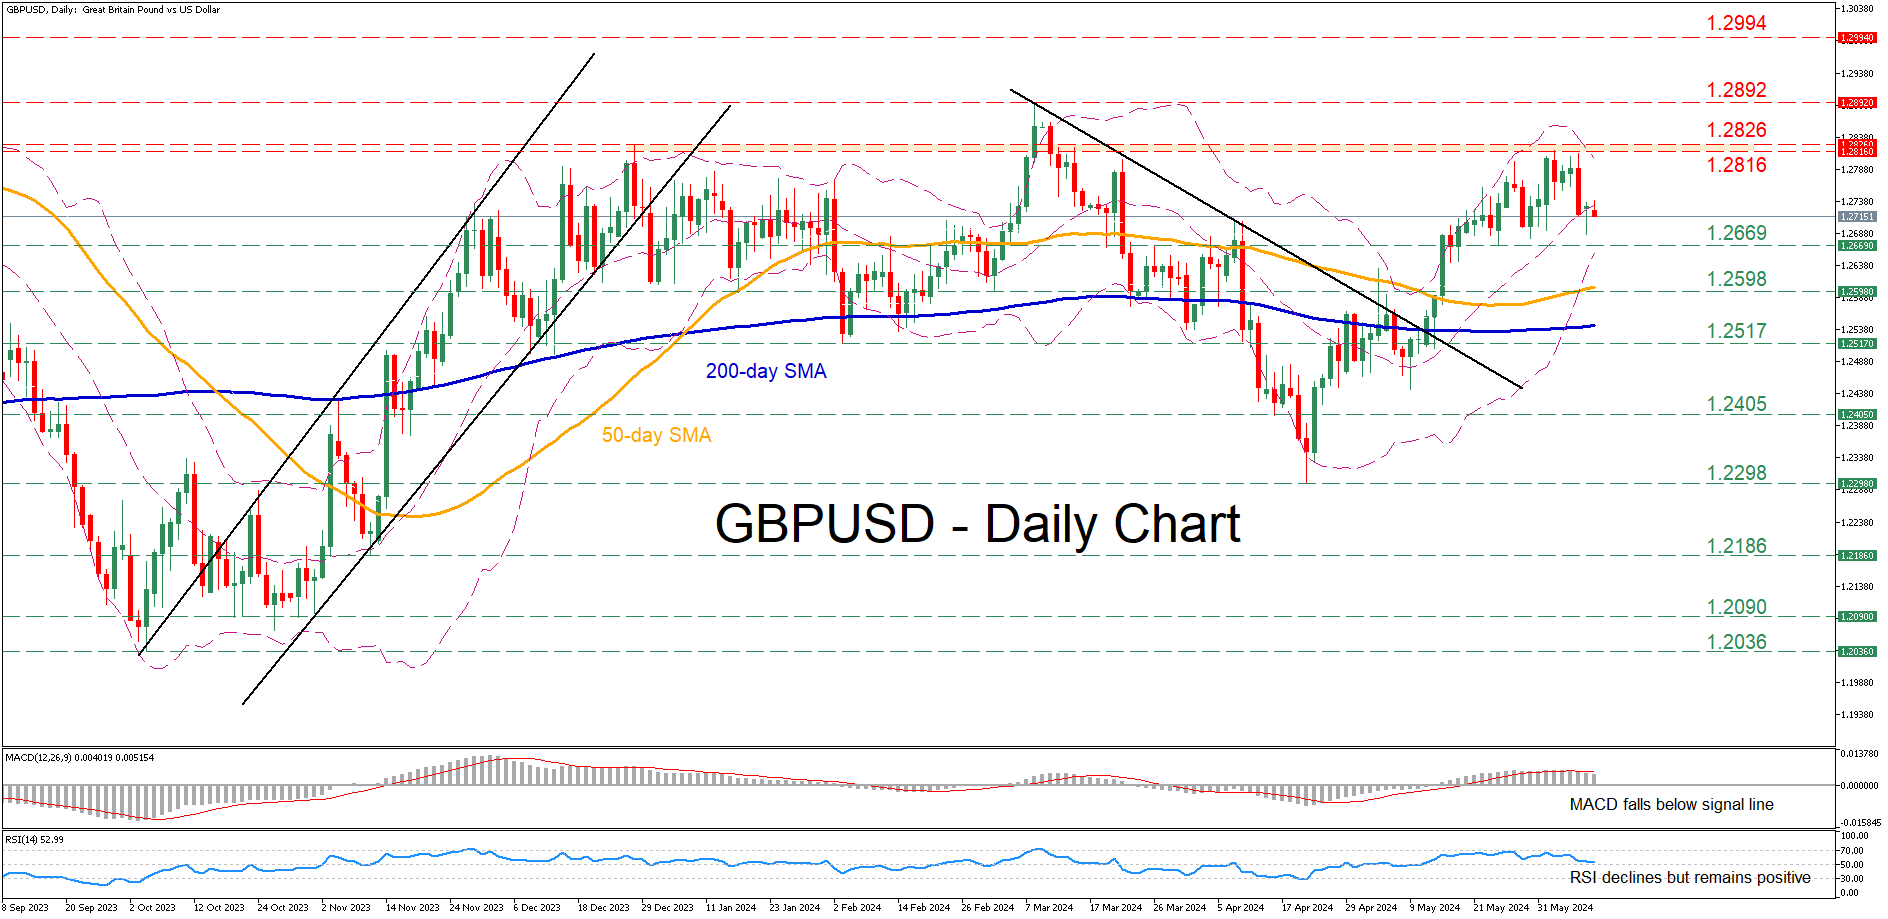
GBPUSD has been in a steady recovery following its bounce off the 2024 bottom of 1.2298, with the price violating both the 50- and 200-day simple moving averages (SMAs). In the near term, although the pair surged to an almost three-month high, it sustained some losses probably due to some profit taking.
Should the pullback extend, the recent support of 1.2669 could act as the first line of defence. Further retreats could cease around 1.2598, a region that held strong both in January and March. Sliding beneath that floor, the price could descend towards the February bottom of 1.2517.
If the bulls manage to erase the latest setback, immediate resistance could be found at the 1.2816-1.2826 range, defined by the most recent peak and the December 2023 high. A violation of that region could set the stage for the 2024 peak of 1.2892. Failing to halt there, the pair could storm towards the July 2023 resistance of 1.2994.
Overall, GBPUSD climbed to an almost three-month high last week before paring some gains. Nevertheless, a break below the 50-day SMA is needed for the short-term outlook to turn bearish.
ECB’s Lagarde Clearly Stated One Should Not Expect Rate Cuts at Predetermined Pace
Markets
It’s telling that core bonds do not gain when markets are in risk-off. German bunds underperformed US Treasuries yesterday with a political risk premium boosting yields between 0.2 (2-yr) and 6.8 bps (30-yr) higher. Far-right advanced (sharply) in the European parliamentary elections in many countries including Germany, Italy and France. In a direct consequence, the president of the latter announced snap parliamentary elections. It’s bound to keep political uncertainty lingering for the time being. Sovereign risk premia vs Germany’s 10-yr yield rose across the bloc with France underperforming peripheral countries. The euro didn’t forget about the 2012 debt/political crisis and proved very vulnerable. EUR/USD slipped below the 1.08 big figure to close at 1.0765. That’s off the intraday lows of 1.0733 though. EUR/GBP since mid-May hovered close to but above 0.85. Sterling lacked the strength for a sustained break lower but a weak euro yesterday eventually took care of it. The combo closed at the lowest level since August 2022 (0.8456). US yields added up to 4.3 bps at the long end of the curve. Yesterday’s $58 bn 3-yr auction raises the stakes for tonight’s $39bn 10-yr and Thursday’s $22bn 30-yr ones. Investor demand was mediocre at best with a below-average 2.43 bid-to-cover and the highest dealer takedown since December. The auction carried a 1.1 bp tail. European bourses ceded ground with the French CAC40 the obvious underperformer (-1.35%). Wall Street gapped lower at the open but managed to close in the green after recovering throughout the session.
In between this morning’s UK labour market report and tonight’s US auction, markets will probably trade cautious and without a clear direction ahead of the Fed policy meeting on Wednesday. We expect a solid floor under core/European bond yields. ECB’s Lagarde in an op-ed published this morning clearly stated one should not expect rate cuts at a predetermined pace. She didn’t exclude the possibility of having multiple meetings between one rate cut and another and vowed to keep policy restrictive (= policy rate above an increased (?!) neutral rate) for as long as needed. The British labour market data were mixed. Employment in the three months to April dropped a bigger-than-expected 139k after an already weak March number. The unemployment rate ticked higher to 4.4% vs 4.3% expected. Wage growth remained sticky but the gauge that excludes bonusses at least didn’t surprise to the upside this time around (6%). The figure including bonusses, however, did come in at a higher-than-expected 5.9%, matching the previous month’s upwardly revised figure. After falling of a cliff yesterday, EUR/GBP is recovering marginally to 0.846. We don’t think the move has strong legs though.
News & Views
The NY Fed’s May survey of consumer expectations were a mixed bag. They showed short-term inflation expectations (1-yr) declining slightly (3.3% to 3.2%) while remaining unchanged at the 3-yr horizon (2.8%) and rising from 2.8% to 3% on the 5-yr tenor. Labor market expectations were miscellaneous. Interestingly, households’ expectations for the stock market improved to a 3-yr high with households becoming also more optimistic about their financial situation a year from now. The share of respondents expecting to be financially the same or better off 12 months from now is 78.1%, the highest level since June 2021. Median expected growth in household income increased from 3%to 3.1%. Perceptions of credit access compared to a year ago were largely unchanged, while expectations about future credit access deteriorated.
Mexican president-elect Sheinbaum vowed to push through with proposed judicial reforms proposed by her predecessor, outgoing president Lopez Obrador. She wants them to be part of a first wave of legislation together with pension reforms for public workers, a ban on reelection to public office and assistance programs for woman and schoolchildren. The judicial reform would put judges elected by popular vote on the nation’s Supreme Court and other lower courts and is seen (by markets and opponents) as eroding checks on power. Ever since the Mexican presidential election earlier this month, Mexican assets have been underperforming. After the recent statements to push through, USD/MXN tested the recent tops around 18.50. This compares with pre-election levels of 17.
Graphs
GE 10y yield
The ECB cut its key policy rates by 25 bps at the June policy meeting. A more bumpy inflation path in H2 2024, the EMU economy gradually regaining traction and the Fed’s higher for longer US strategy make follow-up moves difficult. Markets are coming to terms with that. The German 10y yield set a new YtD top at 2.7%.
US 10y yield
The Fed in May acknowledged the lack of progress towards the 2% inflation objective, but Fed Chair Powell indicated that further tightening was unlikely. However, the FOMC Minutes still showed internal debate on whether policy is restrictive enough. Sticky inflation suggests any rate cut will be a tough balancing act while several policy makers hint at a higher neutral rate. The US 10-y yield is stuck in the 4.3/4.7% trading range.
EUR/USD
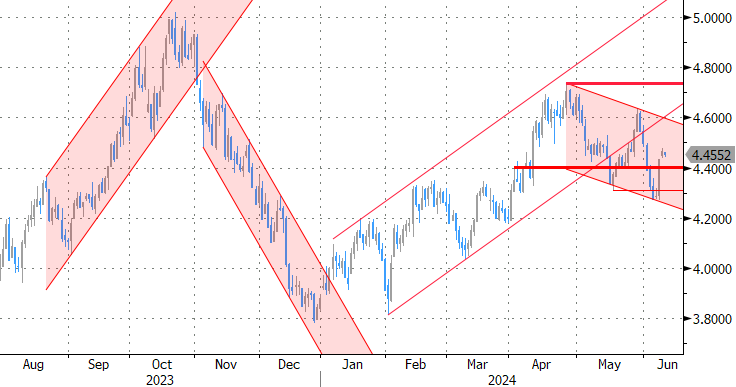
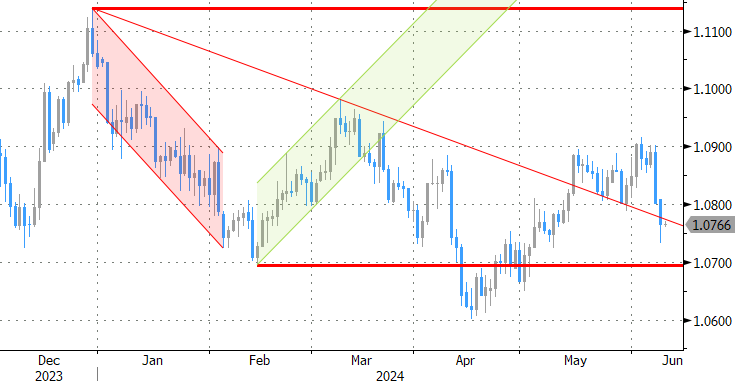
EUR/USD is stuck in the 1.06-1.09 range. The desynchronized rate cut cycle with the ECB exceptionally taking the lead, strong US May payrolls and a swing to the right in European elections pulled the pair away from 1.09 resistance. Focus turns to the US side of the story with May CPI inflation numbers and a more hawkish Fed looming on the horizon.
EUR/GBP
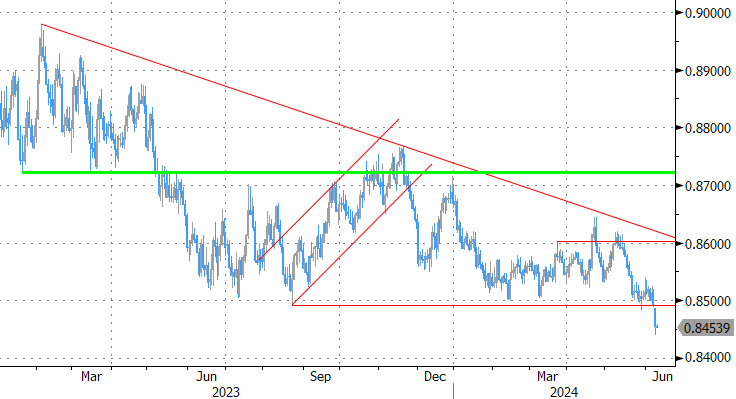
Debate at the Bank of England is focused at the timing of rate cuts. Slower than expected April disinflation and a surprise general election on July 4 suggest that a June cut in line with the ECB looks improbable. Sterling gained momentum with money markets now discounting a Fed-like scenario. EUR/GBP tested the 2023 & 2024 lows near 0.85. Euro weakness eventually pulled the trick after French president Macron called snap elections following a weak showing in EU elections.
EUR/USD Daily Outlook
Daily Pivots: (S1) 1.0739; (P) 1.0760; (R1) 1.0787; More....
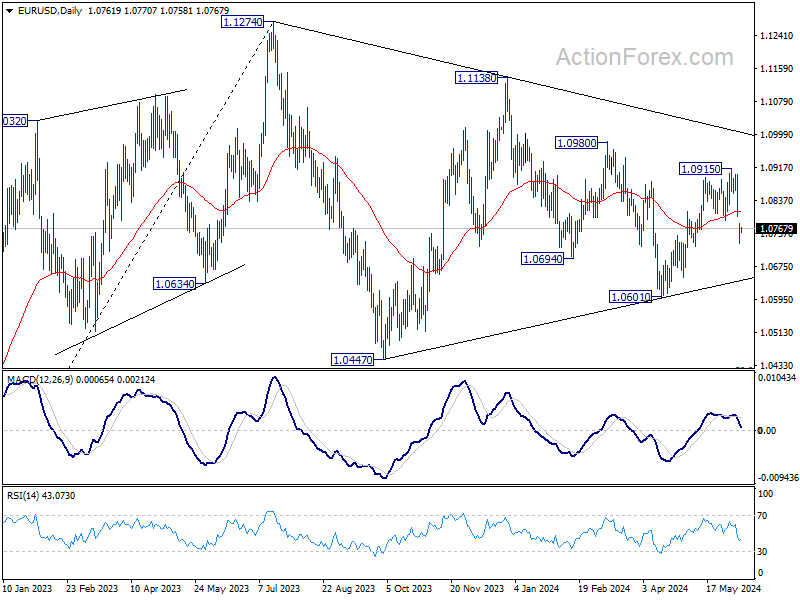
Intraday bias in EUR/USD remains neutral for the moment. Fall from 1.0915 is seen as another falling leg of the corrective pattern from 1.1274. Further decline could be seen to retest 1.0601 support next. On the upside, above 1.0780 minor resistance will turn intraday bias neutral first. But risk will be mildly on the downside as long as 1.0915 resistance holds, in case of recovery.
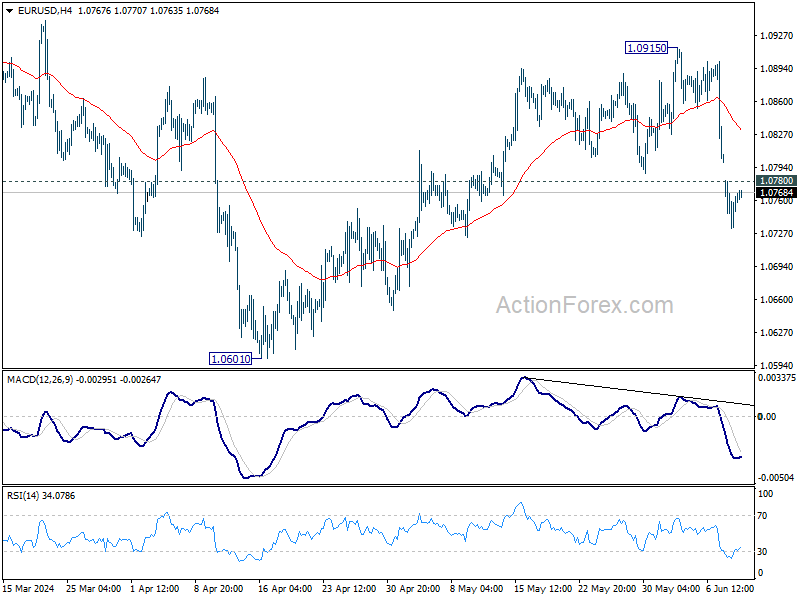
In the bigger picture, price actions from 1.1274 are viewed as a corrective pattern, which might still be in progress. Break of 1.0601 will target 1.0447 support and possibly below. Nevertheless, on the upside, firm break of 1.1138 will argue that larger up trend from 0.9534 (2022 low) is ready to resume through 1.1274 high.
GBP/USD Daily Outlook
Daily Pivots: (S1) 1.2700; (P) 1.2719; (R1) 1.2749; More...
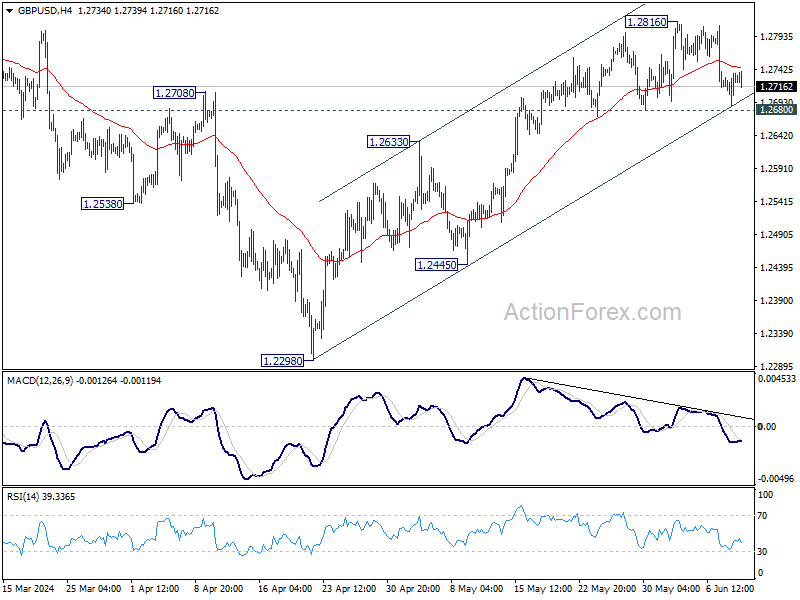
Range trading continues in GBP/USD and intraday bias stays neutral. . Considering bearish divergence condition in 4H MACD, firm break of 1.2680 support will turn bias back to the downside for 55 D EMA (now at 1.2651) and possibly below. Nevertheless, break of 1.2816 will resume the rise from 1.2298 to 1.2892 resistance.
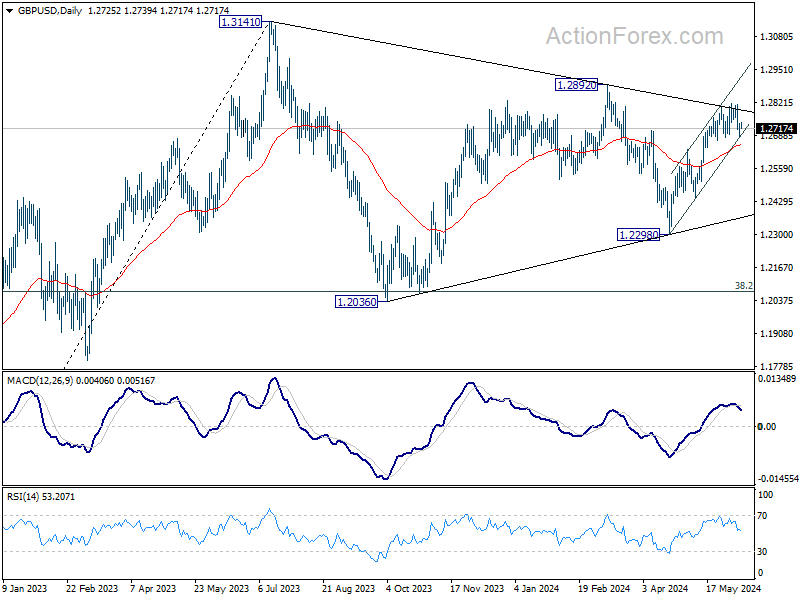
In the bigger picture, price actions from 1.3141 medium term top are seen as a corrective pattern. Fall from 1.2892 is seen as the third leg which might have completed already. Break of 1.2892 resistance will argue that larger up trend from 1.0351(2022 low) is ready to resume through 1.3141. Meanwhile, break of 1.2445 support will extend the corrective pattern with another decline instead.
USD/CHF Daily Outlook
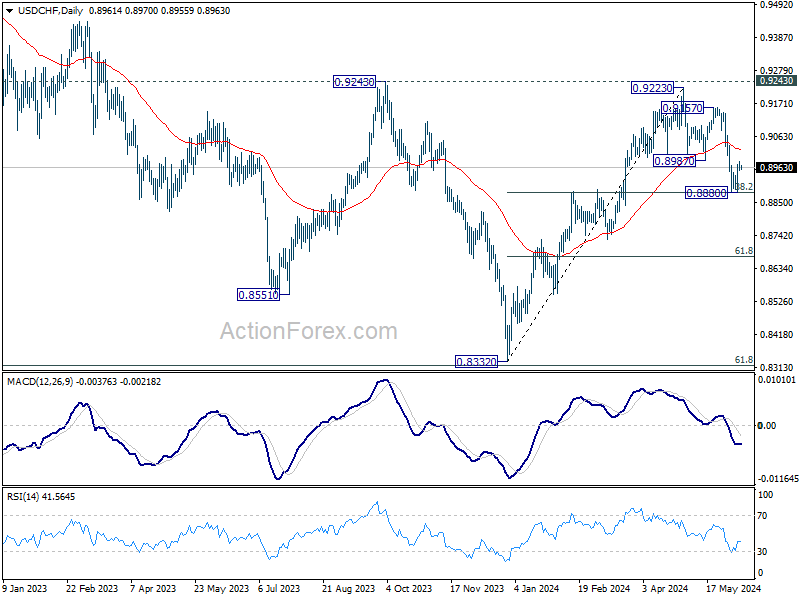
Daily Pivots: (S1) 0.8952; (P) 0.8969; (R1) 0.8982; More….
Intraday bias in USD/CHF remains neutral for the moment. On the upside, firm break of 0.8987 support turned resistance will argue that correction from 0.9223 has completed, after drawing support from 0.8883 fibonacci level. Intraday bias will be back on the upside for 0.9157/9223 resistance zone. Nevertheless, sustained break of 0.8883 fibonacci level will carry larger bearish implications and bring deeper decline.
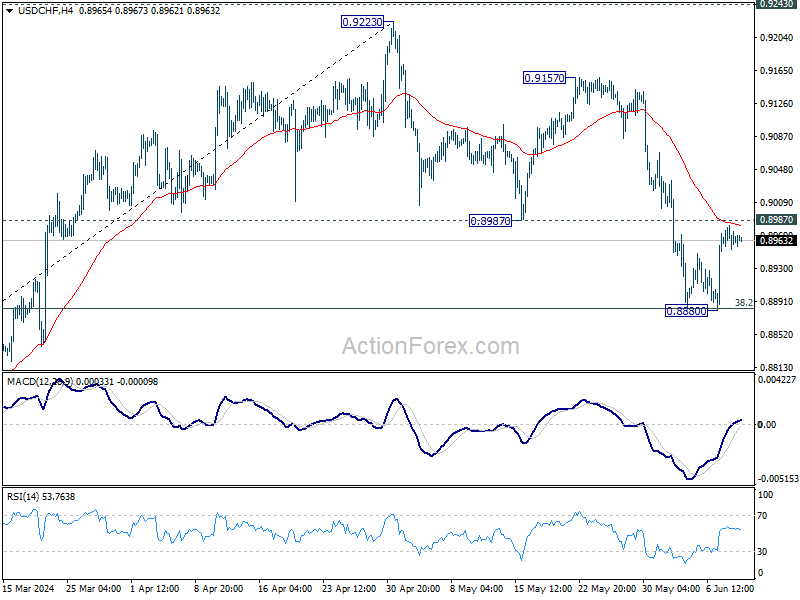
In the bigger picture, price actions from 0.8332 medium term bottom are tentatively seen as developing into a corrective pattern to the down trend from 1.0146 (2022 high). Rejection by 0.9243 resistance, followed by sustained break of 38.2% retracement of 0.8332 to 0.9223 at 0.8883 will strengthen this case, and maintain medium term bearishness. However, decisive break of 0.9243 will argue that the trend has already reversed and turn medium term outlook bullish for 1.0146.
USD/JPY Daily Outlook
Daily Pivots: (S1) 155.57; (P) 156.33; (R1) 157.52; More...
No change in USD/JPY's outlook and intraday bias stays neutral. On the upside, break of 157.70 will resume the whole rise from 151.86 and target 160.20 high. Nevertheless, break of 154.53 will turn bias to the downside for 151.86 support and possibly below, as the third leg of the corrective pattern from 160.20.

In the bigger picture, a medium term top might be formed at 160.20. As long as 55 W EMA (now at 147.77) holds, fall from 160.20 is seen as correcting the rise from 140.25 only. However, sustained break of 55 W EMA will argue that larger correction is possibly underway, and target 146.47 support next.

USD/CAD Daily Outlook
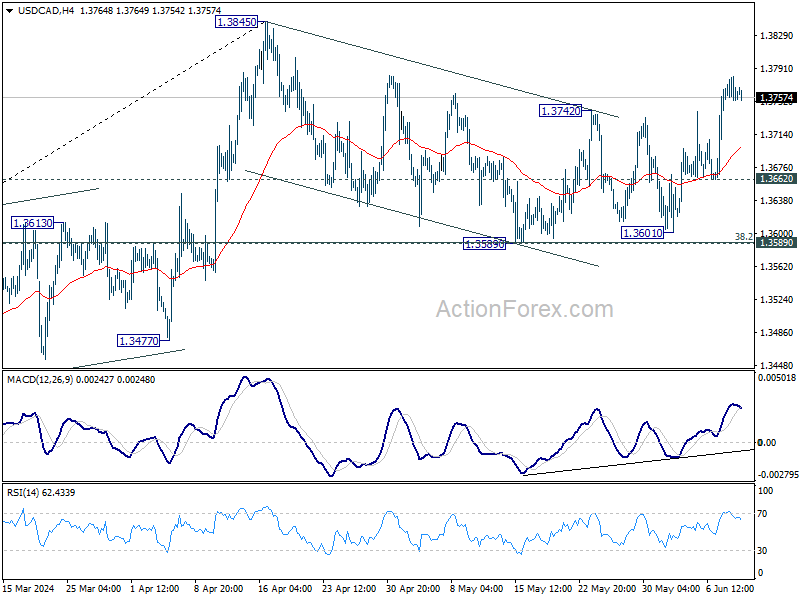
Daily Pivots: (S1) 1.3747; (P) 1.3764; (R1) 1.3775; More...
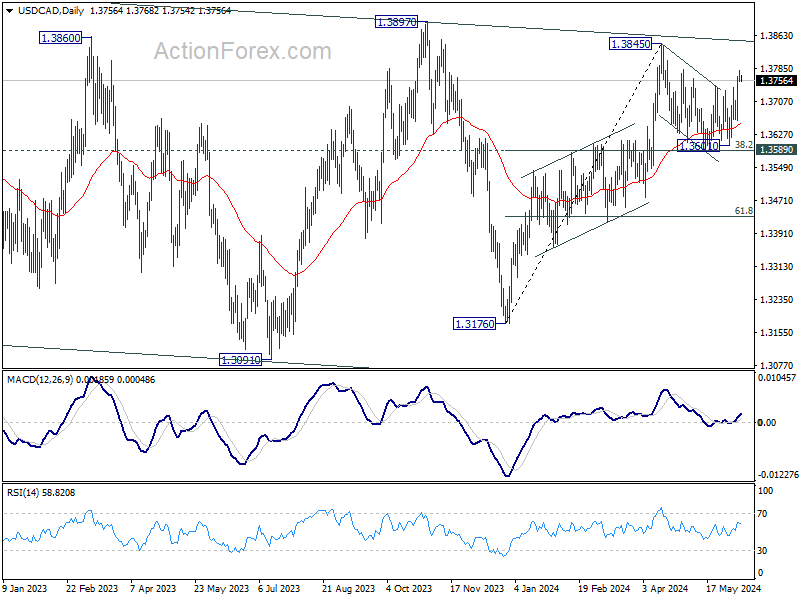
Intraday bias in USD/CAD remains mildly on the upside at this point. Correction from 1.3845 might have completed at 1.3589 already. Further rise would be seen to retest 1.3845 high. On the downside, break of 1.3662 support will extend the corrective pattern from 1.3845 with another falling leg instead.
In the bigger picture, price actions from 1.3976 (2022 high) are viewed as a corrective pattern. In case of another fall, strong support should emerge above 1.2947 resistance turned support to bring rebound. Firm break of 1.3976 will confirm up resumption of whole up trend from 1.2005 (2021 low). Next target is 61.8% projection of 1.2401 to 1.3976 from 1.3176 at 1.4149.
Widening Spreads, Falling Euro – The Fed Won’t Help Lift Sentiment
Unimpressive was to investors what Apple revealed about its AI plans at its Worldwide Developer conference yesterday. The company gave details regarding its partnership with Sam Altman’s OpenAI, they said that they will integrate ChatGPT into iPhones via Siri, they promised that many workloads will be done on-device (without need to share user data), and a ‘private cloud compute’ will be available if there is need for more computational power. And yet, none of it surprised or impressed investors. Apple shares declined nearly 2% yesterday. Cherry on top, Elon Musk said that he would ban Apple devices at the office if ChatGPT is integrated at the operating system level due to data security risks. Voila. The announcement from Apple didn’t go down smoothly the market’s throat yesterday.
Elsewhere, the S&P500 and Nasdaq both eked out small gains, and energy stocks recovered as oil jumped to $78pb following news that the US imposed fresh sanctions on Yemeni Houthis. I believe that the oil rally triggered by geopolitical news will see solid resistance within the $78/80pb band and that oil needs fundamentally supportive news – like softer monetary policies – to make a sustainable attempt above this resistance band.
Widening spreads, falling Euro
Mood in French streets were chaotic yesterday; imagine, people are supposed to be eating fine food and drinking good wine in beautiful coastal cities at this period of the year and not worry about whether Marine Le Pen’s far-right party will take over control. The CAC 40 sold off more than the European peers, the French 10-year yield spiked to the highest levels since November, the spread between the 10-year French and German yield spiked past 55bp and the EURUSD retreated to 1.0732, and is consolidating losses near 1.0770. Thanks Macron.
Political uncertainty and division are never welcome. And Le Pen securing 32% of the cake in the EU Parliament is not excellent news for France’s EU friendly reputation. But France has a history of being an important pillar of the EU and the French may take their responsibility and vote accordingly. Look, Britain never managed to strengthen its back after Brexit and French watch the show from the front seat. We will see how France will respond to Macron’s gambit – and I think France will be fine - but political turmoil in the next few weeks could lead to higher and wider spreads across EU yields and negatively impacting eurozone growth expectations and stock valuations. And the latest turmoil comes when the European Central Bank (ECB) is at a crossroads due to a renewed uptick in inflation. As such, grey clouds may be gathering for the SXXP near its peak level.
The Fed won’t help lift sentiment
The Federal Reserve (Fed) starts its two-day meeting today and is widely expected to trim its rate cutting projections for this year due to sticky inflation and still-tight jobs market. The US dollar index spiked past its 50-DMA following last Friday’s surprisingly strong jobs data, and is consolidating gains above this level ahead of tomorrow’s most important CPI data and the Fed announcement. Provided the economic data and the inflation trends, there is a greater chance that we hear a hawkish Fed statement than the contrary.
Macron Calling for French Snap Election Shakes Markets
In focus today
In the US, NFIB's small business optimism index is due for release for May. General sentiment has remained weak over the past few months, and also firms' price plans took a turn lower in the April survey.
In the UK, focus turns to the release of the official UK labour market report. With the sharp increase in national living and minimum wage age this will likely underpin wage pressures with wage growth excl. bonus expected to tick up to 6.1% 3m y/y.
Overnight we get Chinese CPI and PPI for May. Consensus is for a rise in CPI from 0.3% y/y to 0.4% y/y, which seems fair. It should not move markets. PPI is set to rise to -1.5% y/y up from -2.5% y/y. Higher metal prices lately is the main culprit for the expectations of easing producer price deflation.
Economic and market news
What happened yesterday
In France, markets reacted to the news about Emmanuel Macron calling for snap parliamentary election on Sunday. If the election results are similar to those of Sunday's European Parliament election, Macron will no longer able to push reforms like indexation of the retirement age, the uncertainty around French public finances has increased. The yield on the 10Y French government bonds widened 8bp vs. 10y German Bunds, to the widest level this year at 55bp. EUR/USD dropped to 1.0733 at some point yesterday the lowest rate since 9 May.
In the euro area, ECB president Lagarde said that ECB interest rates are not on a linear downward path, and that policymakers could at times wait more than one meeting before lowering rates again. We expect ECB to cut interest rates once more in 2024 at the December meeting. Markets are currently pricing 31bp of cuts by year end.
Further in the euro area the Sentix index came in at 0.3 (cons: -1.8, prior: -3.6), which was higher than expected. It was driven by improved future expectations. However, the assessment of the current situation is still weak, especially for the German economy.
Market movements
Equities: Global equities ascended yesterday, with US indices finishing near the day's peak, while European indices lagged due to the EP election results indicating a shift to the right and French PM Emmanuel Macron calling for a snap election.
It was not a classic macro-driven day, which was also visible in the sector rotation where consumer staples and financials underperformed. In the US, utilities were the top performers, while banks, particularly regional ones, were among the biggest losers on a day marked by higher yields at the long end of the curve. While we do''t want to overanalyse these signals, we need to take notice and we are aware of the extend run we have had in for instance the cyclical outperformance. In the US yesterday, Dow gained 0.2%, S&P 500 0.3%, Nasdaq 0.4%, and Russell 2000 0.3%.
Asian markets present a mixed picture this morning, with Japan on the rise and China leading declines. Likewise, US and European futures are mixed.
FI: European yields started off on a weak footing, led by underperformance of France and Italy, on the back of the EP election on Sunday. While Italian bonds recovered somewhat, the French underperformance was quite clear through the day as risk premium rose after Macron made the surprise move of calling for a National Assembly election later this month (first round). French bonds widened 8bp vs. 10y German Bunds, to the widest level this year at 55bp. Relatively to other names such as Portugal and Belgium, French bonds are now just 8bp and 4bp cheaper than those.
FX: The EUR sold off against the rest of the G10 currencies yesterday as the market digested the fall out of the EU parliamentary elections. EUR/USD extended the drop from Friday and fell firmly below 1.08.
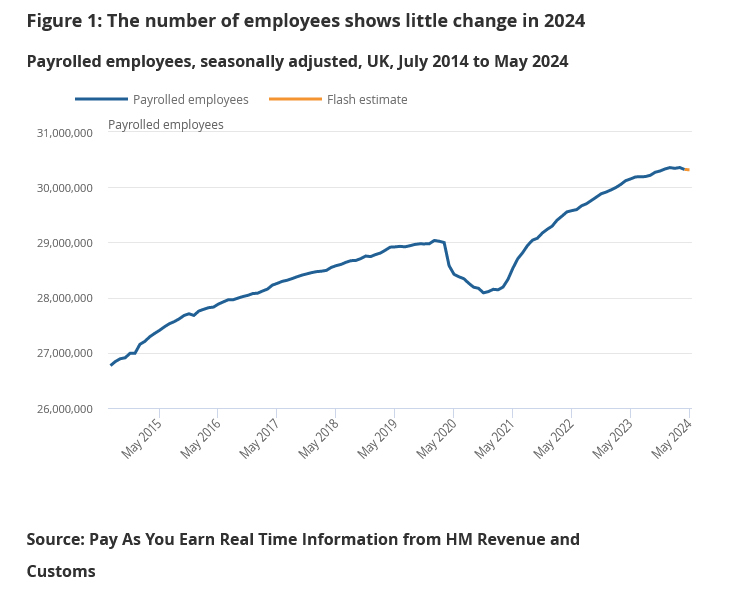
UK payrolled employment fell -3k in May, unemployment rate rises to 4.4% in Apr
UK payrolled employment fell slightly by -3k in May, following -85k monthly decline in April. Annual growth rate of payrolled employment slowed further from 0.7% yoy to 0.6% yoy. Annual growth in median pay was at 5.2% yoy, down sharply from April's 6.8% yoy. Claimant count jumped 50.4k, versus expectation of 10.2k.
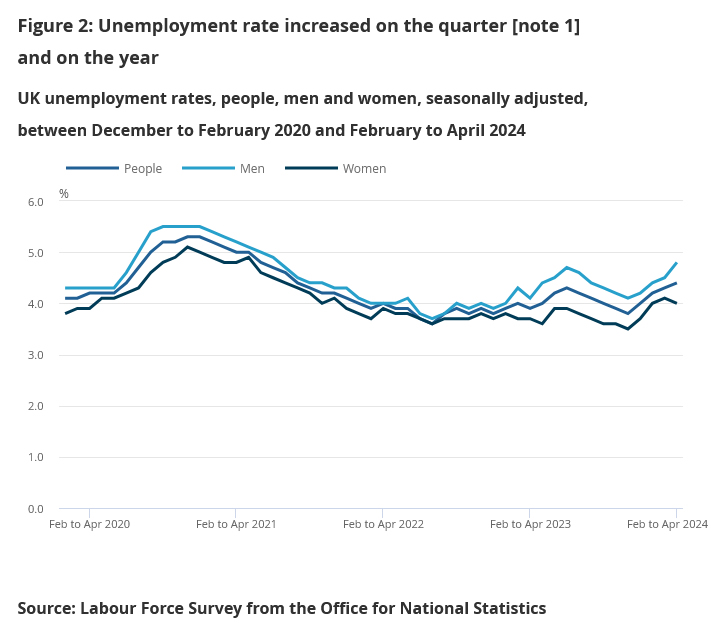
In the three months to April, unemployment rate rose to 4.4%, above expectation of 4.3%. Average earnings including bonus rose 5.9% yoy, above expectation of 5.7% yoy. Average earnings excluding bonus rose 6.0% yoy, matched expectations.