Sample Category Title
US Dollar Index Needs to Hold Above 104
- US dollar index pauses downleg near important support trendline
- Technical signals are uncertain; sellers wait below 104
The US dollar index is trading at an attractive level around the protective trendline that joins the lows from December 2023 and March 2024 near 104.00. The index could enter a new bullish phase, though the technical outlook cannot guarantee an immediate rebound.
Although the stochastic oscillator is near its 20 oversold level, the RSI keeps fluctuating below its 50 neutral mark and the MACD remains negatively charged below its red signal line. The price itself has yet to climb above its simple moving averages (SMAs,) adding to the negative risks.
A step below the 104.00 round level is expected to trigger the next bearish action, squeezing the price towards the 103.60 constraining territory. A continuation lower could stabilize around May’s support line at 103.18, while the 23.6% Fibonacci retracement of the September 2022-July 2023 downtrend could tackle steeper declines along with the long-term descending line drawn from September 2022 at 102.70.
Alternatively, the bulls might attempt to climb above the restrictive 20-day SMA at 104.54. The tentative descending trendline from May’s peak could limit bullish actions ahead of the 38.2% Fibonacci mark of 105.12. If the rally continues, the spotlight will fall on the 105.50 area.
Overall, despite the discouraging technical signals, the US dollar index might have another opportunity to rotate higher if the 104.00 floor holds.

ECB Review: Cutting and Keeping
Today, the ECB decided to cut its three main policy rates by 25bp, which leaves the key policy rate at 3.75%. This cut follows a 9-month period with unchanged policy rates on the back of the rapid hiking cycle since mid-2022. The rate cut was widely expected and thus focus was on the communication.
The updated staff projections showed inflation to hit 2% one quarter later (Q4 25) than at the time of the March meeting.
With the rate cut fully anticipated, some initial volatility was quickly replaced with markets trading in a tight range, with no commitment on the timing of the next policy rate cut, although the meeting with staff projections (September, December, March, and June) seems preferable with a lot more information provided.
We continue to look for the next policy rate cut in December in our baseline scenario, although we do not rule out a potential rate cut in September.
Acknowledging the progress – not confirming the dialling back phase
The ECB’s decision to cut rates was widely expected by market participants and did not come as a surprise. The decision itself was agreed by most GC members, except one member (Reuters sources reported this to be Holzmann). The staff projections showed an upward revision of growth and inflation this year with a direct reference to inflation still above 2% next year. Coupled with guidance of “keeping” the policy rates restrictive to bring inflation to the target, we maintain our call for the next policy rate cut to occur in December, contrary to market pricing and consensus among analysts who expect a September rate cut.
As discussed in COTW: staying restrictive - not yet entering the dialling back phase, we did not expect Lagarde to confirm that they have entered the dialling back phase, which in our reading would be a commitment to a string of policy rate cuts. When asked about it, she did ‘volunteer’ that we have entered the dialling back phase, although she pointed to a “strong likelihood” of this being the dialling back phase, but she would not confirm this. To us this means that the ECB does not want to pre-commit to a specific meeting or policy rate path. The ECB kept its meeting-by-meeting and data-dependent approach for its threetiered reaction function (inflation outlook, underlying inflation, and strength of the monetary policy). Markets are now pricing an additional 36bp of rate cuts by year-end (on top of today’s rate cut, which takes effect on Wednesday next week).
Staff projections show higher inflation and growth
The ECB expects the economy to continue its recovery as the manufacturing sector stabilises, exports pick up, and monetary policy will exert less of a drag on activity. The updated staff projections show higher inflation both this year and next year due to the persistent pressure from domestic inflation and elevated wage growth. HICP is now expected to average 2.5% in 2024 and 2.2% in 2025, which is 0.2pp. higher than the March projections in both years. Likewise, expectations for core inflation were revised up to 2.8% in 2024 and 2.2% next year from 2.6% and 2.1%, respectively. Lagarde noted that inflation will fluctuate around the current levels for the rest of the year before settling towards the 2% target next year.
The sticky expected inflation outlook is largely driven by the elevated wage growth. The ECB staff expect wage growth of 4.8% this year (previously 4.5%), 3.5% in 2025 (previously 3.6%), and 3.2% in 2026 (previously 3.0%). Lagarde noted that wages will remain elevated, but this is largely due to catching up with previous inflation, while the forward-looking wage tracker shows declining wage pressures. Rising economic activity also adds to inflationary pressures. The GDP growth expectation for 2024 was increased to 0.9% y/y from 0.6%, reflecting stronger-than-expected growth in Q1, as well as marginally higher future growth expectations. The ECB now sees balanced risks to the growth outlook in the short-term, which are changed from downside in March, while all expectations for 2026 were unchanged (see chart).
European Central Bank Kicks Off Its Rate Cut Cycle
Summary
- The European Central Bank (ECB) today joined the growing group of advanced economy central banks that have begun their monetary easing cycles, lowering its Deposit Rate by 25 bps to 3.75%.
- ECB policymakers cited the past drop of inflation and the improving inflation outlook as key factors behind their decision to lower interest rates. There were some elements of caution, however, as the ECB said domestic price pressures remain strong as wage growth is elevated, and revised up its near-term inflation forecasts.
- We view the ECB's statement as consistent with further rate cuts, albeit at a measured pace. The ECB said it will continue to follow a “data-dependent and meeting-by-meeting approach” in determining its interest rate decisions.
- Over the rest of 2024, our base case is for the ECB to pause in July before cutting rates again in September, October and December. However, we suspect ECB policymakers would prefer to see a return to an overall downward trend in wage growth and domestic inflation to be fully comfortable in lowering interest rates further, and thus view the risks as tilted toward lesser easing.
European Central Bank Kicks Off Its Rate Cut Cycle
The European Central Bank (ECB) today joined the growing group of advanced economy central banks (including the Swiss National Bank, Riksbank and Bank of Canada) that have begun their respective monetary policy easing cycles. The ECB lowered its benchmark interest rates by 25 bps, bringing its Deposit Rate to 3.75%, and offered several perspectives in support of its decision to ease monetary policy, saying:
- Inflation has fallen more than 2.5 percentage points since September 2023 (when the policy rate reached its peak), and the inflation outlook has improved markedly.
- Underlying inflation has also eased, and inflation expectations have declined at all horizons.
- Monetary policy has kept financing conditions restrictive. By dampening demand and keeping inflation expectations well anchored, this has made a major contribution to bringing inflation back down.
While clearly acknowledging the improving inflation situation, the ECB's announcement was balanced by some cautious and hawkish elements, saying domestic price pressures remain strong as wage growth is elevated, and that inflation is likely to stay above target well into next year. Indeed, near-term core inflation projections (CPI excluding food and energy) have been revised higher to 2.8% for 2024 (previously 2.6%) and to 2.2% for 2025 (previously 2.1%). The core inflation forecast for 2026 was unchanged at 2.0%. The ECB also raised its GDP growth forecast for 2024 to 0.9%, from 0.6% previously.
In terms of policy guidance, we view the ECB's statement as consistent with further rate cuts, albeit at a measured pace. The ECB said it will “keep policy rates sufficiently restrictive for as long as necessary to achieve” a timely return to the 2% inflation target. Use of “sufficiently” restrictive does, in our view, allow for some further reduction in interest rates given their currently elevated levels. The ECB added however that it “will continue to follow a data-dependent and meeting-by-meeting approach to determining the appropriate level and duration of restriction.” Finally, the ECB said it is not committing to a particular rate path.
Today's interest rate reduction was clearly signaled ahead of time by ECB policymakers and widely forecast, including by ourselves. Going forward, we have also forecast the ECB will hold rates steady in July before delivering another 25 bps rate cut in September. By the fourth quarter we expect Eurozone wage growth and underlying inflation may have slowed sufficiently for the ECB to deliver rate cuts at its October and December meetings, especially if the Federal Reserve begins lowering interest rates as well. If realized, that would see the Deposit rate lowered by a cumulative 100 bps this year to end 2024 at 3.00%.
We view today's announcement as very much consistent with the ECB keeping interest rates unchanged at its July meeting, while the optionality embodied in today's statement would allow for a resumption of rate cuts in September. That said, we view the risks around our ECB easing outlook for this year as tilted toward a lesser 75 bps of rate cuts, compared to our base case for a cumulative 100 bps of rate reduction. ECB policymakers are likely wary of the modest uptick in Eurozone wage growth reported for Q1, and the uptick of core inflation and particularly services inflation in May. Over the next few months ahead of the ECB's 12 September monetary policy announcement we will get CPI inflation data for June, July and August, and both the Q2 Indicator of Negotiated Wages along with Q2 compensation per employee (the most comprehensive wage measure) will be available in time for the September meeting. We suspect ECB policymakers would prefer to see a return to an overall downward trend in wage growth and domestic inflation to be fully comfortable in lowering interest rates further. Against that backdrop, a further interruption to the disinflation progress could put one of our expected September or October rate cuts at risk.
Sunset Market Commentary
Markets
After the Swiss National Bank (March), the Swedish Riksbank (May) and the Bank of Canada (yesterday), the ECB today is the next in line among central banks from developed economies to reduce policy restriction. It cut its policy rates by 25bps, bringing the deposit rate from 4.0% to 3.75%. ECB assesses that the dynamics of underlying inflation and the strength of monetary policy transmission after nine months of holding rates steady, justifies to moderate the degree of monetary policy restriction. However, despite the progress inflation, the ECB admits that domestic price pressures remain strong as wage growth is elevated with inflation likely holding above target well into next year. Staff projections even were upwardly revised both headline (2024 2.5% from 2.3%; 2025 2.2% from 2.0%) and core (2024 2.8% from 2.6%, 2025 2.2% from 2.1%) inflation. Forecasts were left unchanged for 2026 (1.9 % headline; 2.0% core). Growth is expected to pick up to 0.9% in 2024, 1.4% in 2025 and 1.6% in 2026. Looking forward, the ECB commits to keep rates sufficiently restrictive as necessary to bring inflation to 2.0% in a timely manner. In a data-dependent approach, the bank doesn’t commit to any particular rate path. The ECB continues to run-off of its APP portfolio and from H2 2024 will also reduce the PEPP portfolio by € 7.5 bln p/month as earlier announced. From a communication point of view, it wasn’t that easy to explain less policy restriction as inflation is expected to stay longer above target than initially expected and as wage growth remains elevated. This complicates the pace/timing of further steps. EMU/German yields rebounded up to 5 bps after the release of the policy statement and this rise was maintained during Lagarde’s press conference as the ECB Chair indicated that further easing needs the backing of data and that the ECB is not in in a phase of (automatically) dialing back. German yields currently rise between 6.0 bps (5-y) and 4.0 bps (30-y). Markets still see a 90% change of next step in September and about 70% of two additional cuts by the end of the year. US Treasuries outperform Bunts with yields adding about 1-2 bps across the curve. Jobless claims printed higher than expected at 229k and Q1 unit labour costs was substantially downwardly (4.0% from 4.7%) wiht markets looking forward to tomorrow’s US payrolls. The ECB decision had little impact on EMU equities. EuroStoxx 50 still holds a 0.65% again. EUR/USD dropped to the 1.0865 area going into the ECB decision, but again trades near 1.088 as the timing of further cuts stays (highly) conditional. The rebound of the euro also helped EUR/GBP to create some breathing space from the key 0.8490/8500 support area (currently 0.8520).
News & Views
British CFO’s in the Bank of England’s Decision Maker Panel (DMP) for May expect output prices to rise 3.9% (three-month smoothed average) in the year ahead. That’s slightly down from the 4% in the DMP’s previous edition. Consumer price inflation for the upcoming year is seen rising 3% in the three months to May, easing further from the 3.1% in April. The gauge for three-year ahead CPI dropped further from 2.7% to 2.6% and should be welcomed by the Bank of England as it suggests the risk of unanchored inflation expectations so far does not materialize. Firms reported 1.5% employment growth in May, slower than the 1.7% in April as well as the slowest pace since November 2021. Employment growth for the year ahead is anticipated at 1.3%, the same as in April. Expected year-ahead wage growth fell by 0.3 ppts to 4.5% on a three-month moving-average basis in May.
Sticking to the UK, the central bank said it allotted more than £19bn in its weekly repo operation on Thursday. That’s up from £17.2bn in the week before and the seventh straight week of record demand. The uptick is at least partially the result of the BoE’s quantitative tightening programme through which it reduces excess liquidity in the market. Contrasting with the ECB and the Fed, the BoE sets an annual QT target in September for the year ahead and effectively sells gilts if bond expiries alone are not enough to hit that mark. The Bank of England is moving the fastest of all three, currently holding £700bn of bonds compared to a peak of <£900bn in early 2022. While the huge uptake could be viewed as signs of emerging liquidity scarcity, other metrics (e.g. minimal market repo rate premium over the Bank Rate) offer no reason to worry just yet. Moreover, the shift is exactly what the central bank wants. Its governor Bailey end May revealed the aim to provide liquidity the traditional way through repo’s instead of (unconventional) QE in order to avoid interest rate risk.
Graphs
German 10-y yield holding above 2024 uptrend line as any further ECB cuts remain conditional on additional data confirmation.
EUR/USD holding near recent top, but no real test of 1.0916 resistance.
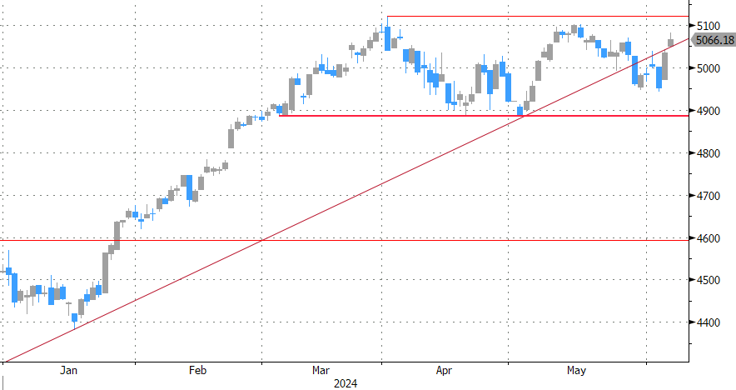
EuroStoxx 50 again nearing cycle top as markets ponder chances of (global) policy easing.
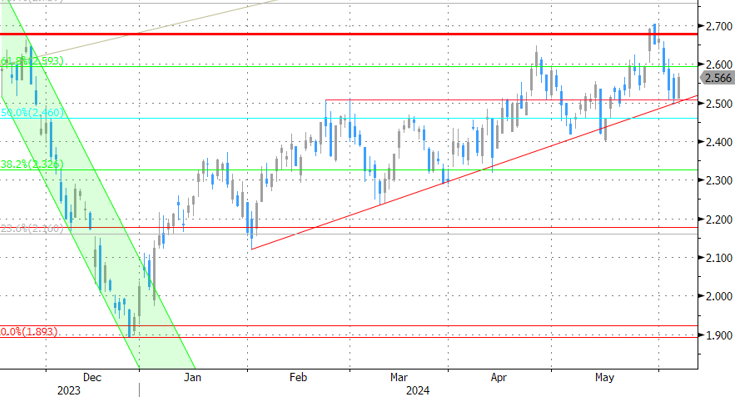
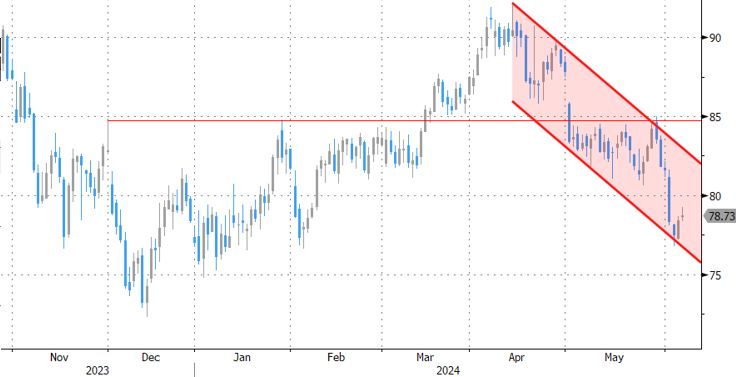
Brent oil ($ p/b) struggles even as OPEC+ sees reaction to its June 02 decision as not justified.
ECB Starts Cuts Earlier and May Move Faster Than Fed
The European Central Bank cut all three of its key interest rates by 25 points, which is in line with market expectations. The ECB has kept rates unchanged for the past nine months and tightened policy from July 2022 to September 2023, raising rates by a combined 450 basis points.
In May, overall eurozone inflation added 0.2 percentage points to 2.6%. However, that didn’t stop the ECB, which has been preparing markets for months for today’s move. However, the move to ease ECB policy is supported by other data.
Producer prices have been falling every month for the past six months, and in April were 5.7% lower than a year earlier. This decline creates room for final retail prices to fall.
The euro-region economy is also on the side of the doves at the ECB, as GDP for Q1 2024 added 0.3% after two quarters of contraction at 0.1% and is now higher by a modest 0.4% y/y. This weak performance allows for little fear of inflationary risks from strong domestic demand. Rather than the opposite, Europe needs mild stimulus to avoid slipping further into recession due to tight policy.
The fall in prices of a wide range of commodities makes it unnecessary to fear a return of 2022-style inflation. However, recent trends in container shipping prices make us wary of a possible repeat of the logistical problems seen in 2020-2021.
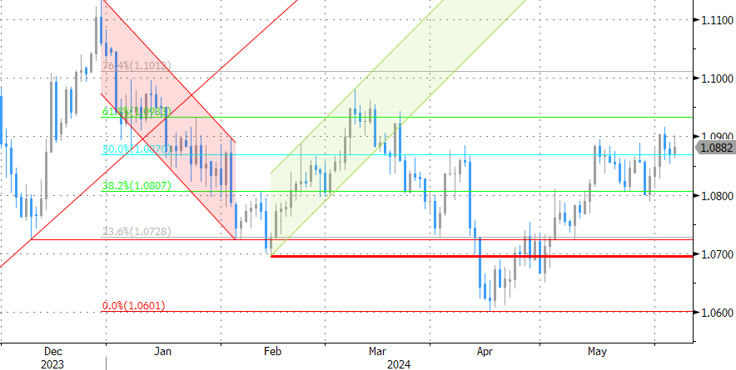
It is almost certain that the ECB is not done with rate cuts this year, but whether we see two more rate cuts or more depends on inflation data. Current trends in inflation and economic activity are setting us up for the ECB to “reduce monetary policy tightness” faster than the Fed. This could be an important pressure factor for EURUSD, preventing the single currency from moving up from the wide range of 1.05-1.10, where the pair has been predominantly trading since the beginning of 2023.
EUR/USD Mid-Day Outlook
Daily Pivots: (S1) 1.0851; (P) 1.0872; (R1) 1.0889; More…
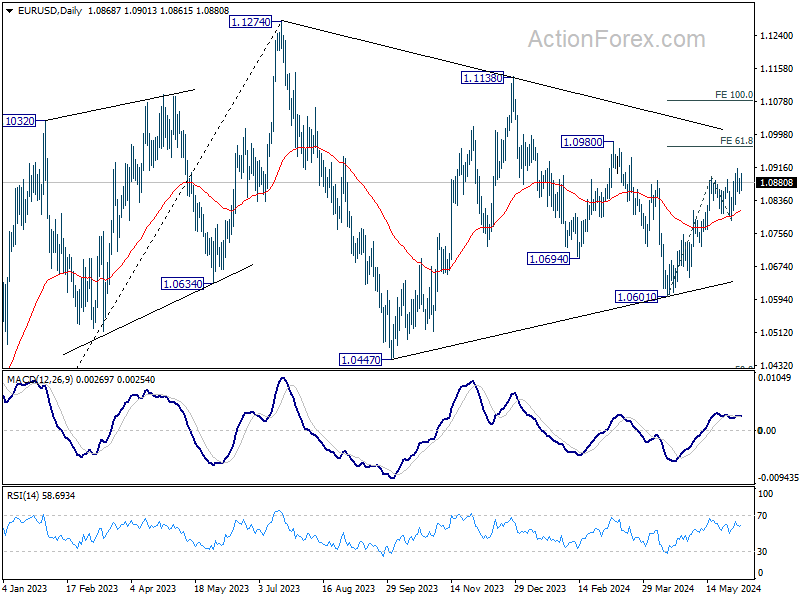
Intraday bias in EUR/USD remains neutral and outlook is unchanged. Further rally is expected as long as 1.0788 support holds. Break of 1.0915 will resume the rally from 1.0601 to 61.8% projection of 1.0601 to 1.0894 from 1.0788 at 1.0969. However, firm break of 1.0788 will turn bias back to the downside for deeper decline instead.
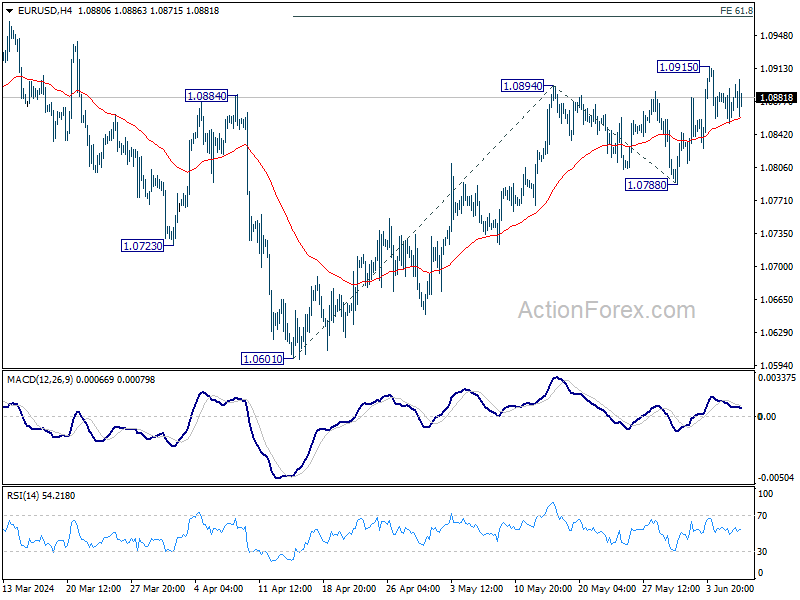
In the bigger picture, price actions from 1.1274 are viewed as a corrective pattern. Fall from 1.1138 is seen as the third leg and could have completed. Firm break of 1.1138 will argue that larger up trend from 0.9534 (2022 low) is ready to resume through 1.1274 high. On the downside, break of 1.0788 support will extend the corrective pattern instead.
Euro Holds Steady After ECB Rate Cut
Following ECB's decision to lower interest rates by 25 bps, a move that aligned with market expectations, Euro remained relatively steady within its near term trading range. ECB President Christine Lagarde, speaking at the post-meeting press conference, deliberately avoided providing explicit forward guidance, stating that ECB is not pre-committing to any particular rate path.
Lagarde also addressed the current inflation dynamics, acknowledging that price pressures are gradually subsiding, although wage inflation remains a concern. However, forward-looking indicators suggest that wage growth is likely to moderate over the course of the year. She projected that inflation would continue to hover around current levels for the remainder of this year and would begin to approach 2% target in the latter half of 2025.
In the broader forex markets, activity has been notably subdued, with most major currency pairs and crosses trading within the previous day's range. New Zealand Dollar, Australian Dollar, and Japanese Yen are currently the weaker performers, while Swiss Franc stands out as the strongest, followed by Euro and Dollar. The British Pound and Canadian Dollar are positioned in the middle of the pack.
In Europe at the time of writing, FTSE is up 0.28%. DAX is up 0.40%. CAC is up 0.29%. UK 10-year yield is down -0.0007 at 4.184. Germany 10-year yield is up 0.004 at 2.556. Earlier in Asia, Nikkei rose 0.55%. Hong Kong HSI rose 0.28%. China Shanghai SSE fell -0.54%. Singapore Strait Times rose 0.02%. Japan 10-year JGB yield fell -0..0394 to 0.966.
US initial jobless claims rises to 229k vs exp 215k
US initial jobless claims rose 8k to 229k in the week ending May 25, above expectation of 215k. Four-week moving average of initial claims fell -750 to 222k.
Continuing claims rose 2k to 1792k in the week ending May 25. Four-week moving average of continuing claims rose 3k to 1789k.
ECB cuts 25bps, inflation seen below 2% in 2026
ECB has lowered interest rates by 25 basis points as widely expected. Following the reduction, the main refinancing rate is now 4.25%, the deposit rate is 3.75%, and the marginal lending rate is 4.50%.
In its latest forecasts, the ECB projects economic growth to pick up to 0.9% in 2024, 1.4% in 2025, and 1.6% in 2026.
Inflation is expected to average 2.5% in 2024, 2.2% in 2025, and 1.9% in 2026. Core inflation is forecasted to average 2.8% in 2024, 2.2% in 2025, and 2.0% in 2026.
Notably, both headline and core inflation forecasts have been revised upward for 2024 and 2025.
Eurozone retail sales down -0.5% mom in Apr, EU falls -0.6% mom
Eurozone retail sales volume fell -0.5% mom in April, worse than expectation of -0.2% mom. Sales volume decreased for food, drinks, tobacco by 0.5%, for non-food products (except automotive fuel) by 0.1%, and for automotive fuel in specialised stores by 2.2%.
EU retail sales fell -0.6% mom. Among Member States for which data are available, the largest monthly decreases in the total retail trade volume were recorded in Latvia (-3.3%), Cyprus (-3.1%) and Denmark (-2.7%). The highest increases were observed in Slovakia (+2.4%), Bulgaria and Austria (both +1.9%) and Portugal (+1.7%).
BoJ's Nakamura warns of inflation risks, advocates maintaining current policy
BoJ board member Toyoaki Nakamura, known for his dovish stance, cautioned in a speech today that "inflation may not reach 2 per cent from fiscal 2025 onward" if households reduce spending, which would discourage companies from further price hikes.
Nakamura highlighted that domestic consumption has been sluggish recently. He also pointed to the uncertainty surrounding the sustainability of wage increases, noting that the impact of rising wages on prices has been weak too.
Given the current data, Nakamura stated that it is appropriate to keep monetary policy unchanged for the time being. He was the sole dissenter in the BoJ's decision to end eight years of negative interest rates and bond yield control in March.
EUR/USD Mid-Day Outlook
Daily Pivots: (S1) 1.0851; (P) 1.0872; (R1) 1.0889; More…
Intraday bias in EUR/USD remains neutral and outlook is unchanged. Further rally is expected as long as 1.0788 support holds. Break of 1.0915 will resume the rally from 1.0601 to 61.8% projection of 1.0601 to 1.0894 from 1.0788 at 1.0969. However, firm break of 1.0788 will turn bias back to the downside for deeper decline instead.
In the bigger picture, price actions from 1.1274 are viewed as a corrective pattern. Fall from 1.1138 is seen as the third leg and could have completed. Firm break of 1.1138 will argue that larger up trend from 0.9534 (2022 low) is ready to resume through 1.1274 high. On the downside, break of 1.0788 support will extend the corrective pattern instead.
Economic Indicators Update
| GMT | Ccy | Events | Actual | Forecast | Previous | Revised |
|---|---|---|---|---|---|---|
| 01:30 | AUD | Trade Balance (AUD) May | 6.55B | 5.50B | 5.02B | 4.84B |
| 05:45 | CHF | Unemployment Rate May | 2.40% | 2.30% | 2.30% | |
| 06:00 | EUR | Germany Factory Orders M/M Apr | -0.20% | 0.50% | -0.40% | |
| 08:00 | EUR | Italy Retail Sales M/M Apr | -0.10% | 0.30% | 0.00% | |
| 08:30 | GBP | Construction PMI May | 54.7 | 52.5 | 53 | |
| 09:00 | EUR | Eurozone Retail Sales M/M Apr | -0.50% | -0.20% | 0.80% | 0.70% |
| 12:15 | EUR | ECB Rate On Deposit Facility | 3.75% | 3.75% | 4.00% | |
| 12:15 | EUR | ECB Main Refinancing Operations Rate | 4.25% | 4.25% | 4.50% | |
| 12:30 | USD | Trade Balance (USD) Apr | -74.6B | -69.8B | -69.4B | -68.6B |
| 12:30 | USD | Initial Jobless Claims (May 31) | 229K | 215K | 219K | |
| 12:30 | USD | Nonfarm Productivity Q1 | 0.20% | 0.30% | 0.30% | |
| 12:30 | USD | Unit Labor Costs Q1 | 4.00% | 4.70% | 4.70% | |
| 12:30 | CAD | Trade Balance (CAD) Apr | -1.05B | -2.2B | -2.3B | |
| 12:45 | EUR | ECB Press Conference | ||||
| 14:00 | CAD | Ivey PMI May | 65.2 | 63 | ||
| 14:30 | USD | Natural Gas Storage | 89B | 84B |
GBP/USD Mid-Day Outlook
Daily Pivots: (S1) 1.2763; (P) 1.2779; (R1) 1.2803; More…..
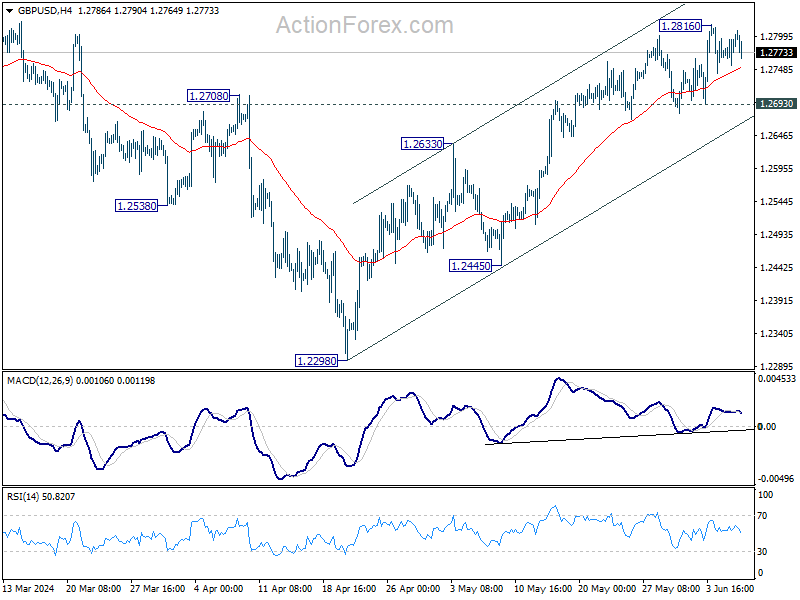
Outlook in GBP/USD remains unchanged and intraday bias stays neutral. As long as 1.2693 support holds, further rally is in favor. Above 1.2816 will resume the rally from 1.2298 to 1.2892 resistance next. On the downside, break of 1.2693 minor support will turn intraday bias to the downside for deeper pullback instead.
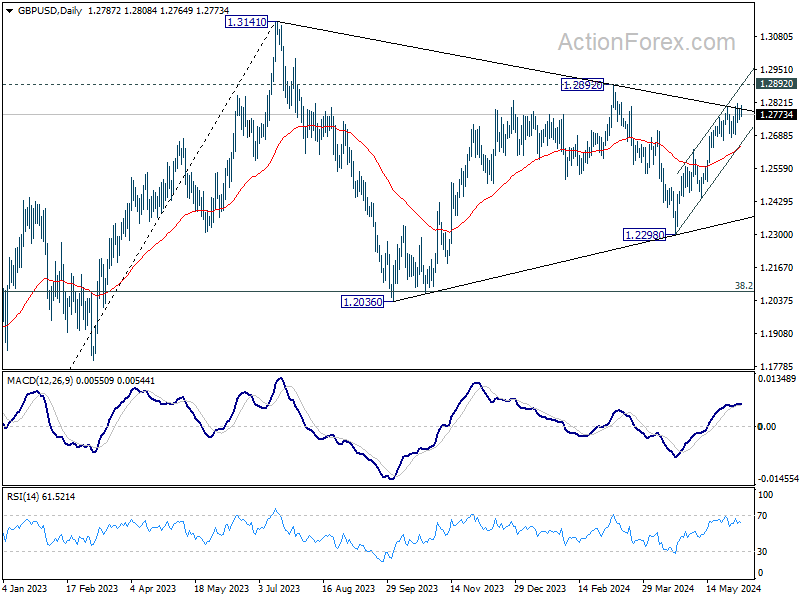
In the bigger picture, price actions from 1.3141 medium term top are seen as a corrective pattern. Fall from 1.2892 is seen as the third leg which might have completed already. Break of 1.2892 resistance will argue that larger up trend from 1.0351(2022 low) is ready to resume through 1.3141. Meanwhile, break of 1.2445 support will extend the corrective pattern with another decline instead.
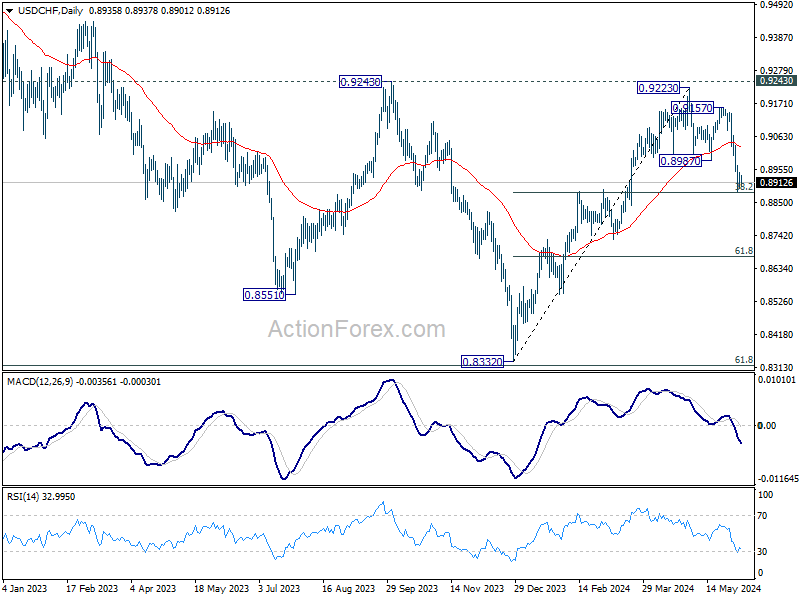
USD/CHF Mid-Day Outlook
Daily Pivots: (S1) 0.8901; (P) 0.8925; (R1) 0.8959; More….
Intraday bias in USD/CHF stays neutral and outlook is unchanged. Strong rebound from current level, followed by break of 0.8987 support turned resistance, will suggest that correction from 0.9223 has completed, and retain near term bullishness. However, sustained break of 0.8883 fibonacci level will carry larger bearish implications and bring deeper decline.
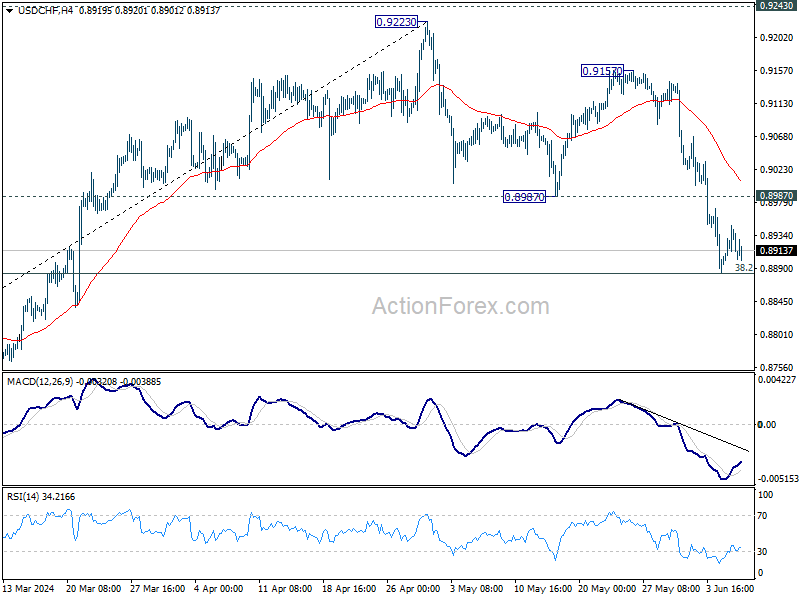
In the bigger picture, price actions from 0.8332 medium term bottom are tentatively seen as developing into a corrective pattern to the down trend from 1.0146 (2022 high). Rejection by 0.9243 resistance, followed by sustained break of 38.2% retracement of 0.8332 to 0.9223 at 0.8883 will strengthen this case, and maintain medium term bearishness. However, decisive break of 0.9243 will argue that the trend has already reversed and turn medium term outlook bullish for 1.0146.
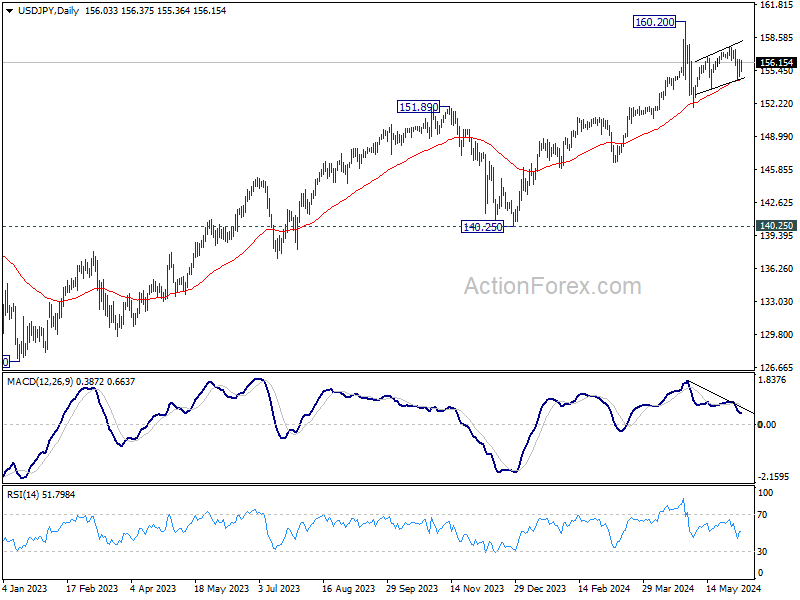
USD/JPY Mid-Day Outlook
Daily Pivots: (S1) 155.01; (P) 155.75; (R1) 156.86; More….
No change in USD/JPY's outlook as range trading continues. Risk will stay on the downside as long as 157.70 resistance holds. Fall from there is seen as the third leg of the corrective pattern from 160.20. On the downside, break of 154.53 will target 153.59 support first. Break there will pave the way to 151.86 support and below.
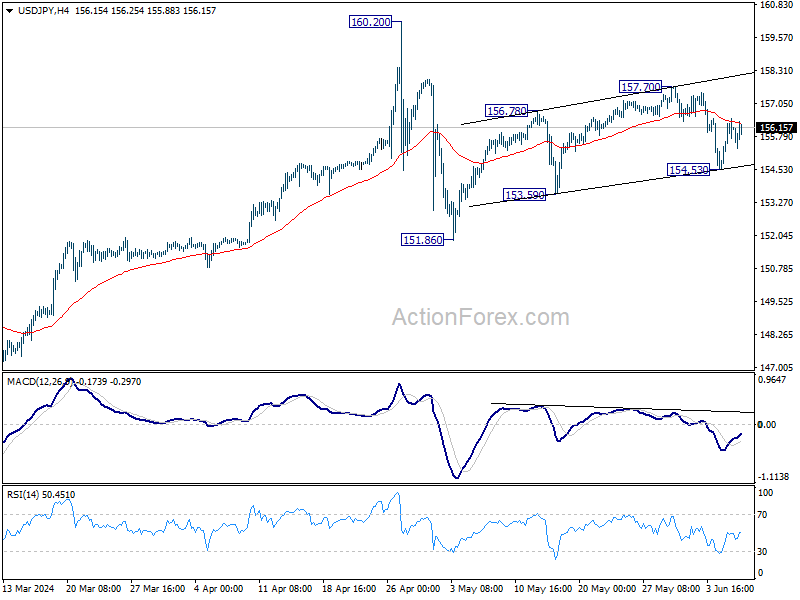
In the bigger picture, a medium term top might be formed at 160.20. As long as 55 W EMA (now at 147.77) holds, fall from 160.20 is seen as correcting the rise from 140.25 only. However, sustained break of 55 W EMA will argue that larger correction is possibly underway, and target 146.47 support next.