
Sample Category Title
USD/JPY Daily Outlook
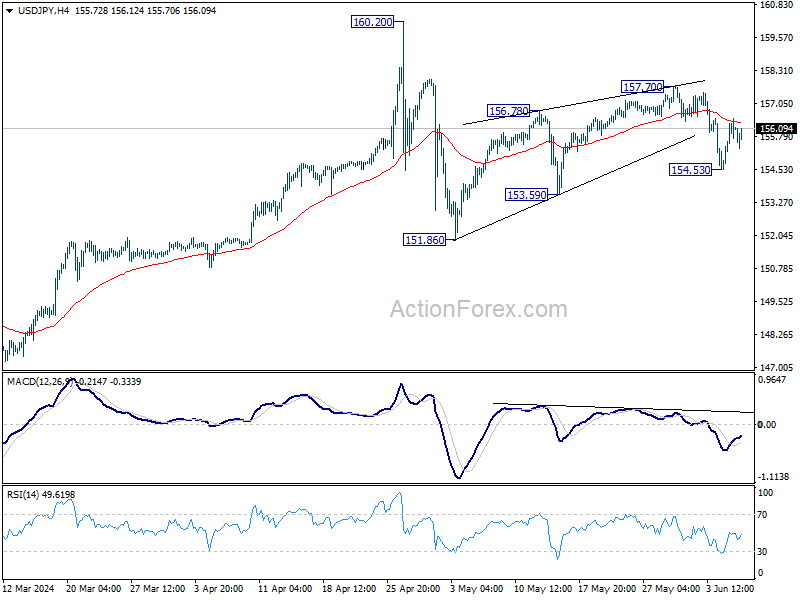
Daily Pivots: (S1) 155.01; (P) 155.75; (R1) 156.86; More….
Intraday bias in USD/JPY remains neutral at this point and outlook is unchanged. Risk will stay on the downside as long as 157.70 resistance holds. Fall from there is seen as the third leg of the corrective pattern from 160.20. On the downside, break of 154.53 will target 153.59 support first. Break there will pave the way to 151.86 support and below.
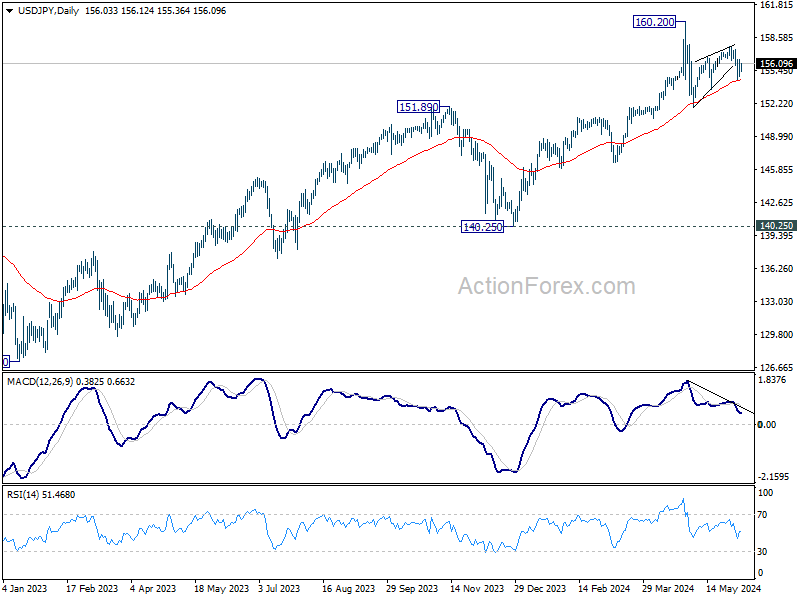
In the bigger picture, a medium term top might be formed at 160.20. As long as 55 W EMA (now at 147.77) holds, fall from 160.20 is seen as correcting the rise from 140.25 only. However, sustained break of 55 W EMA will argue that larger correction is possibly underway, and target 146.47 support next.
AUD/USD Daily Report
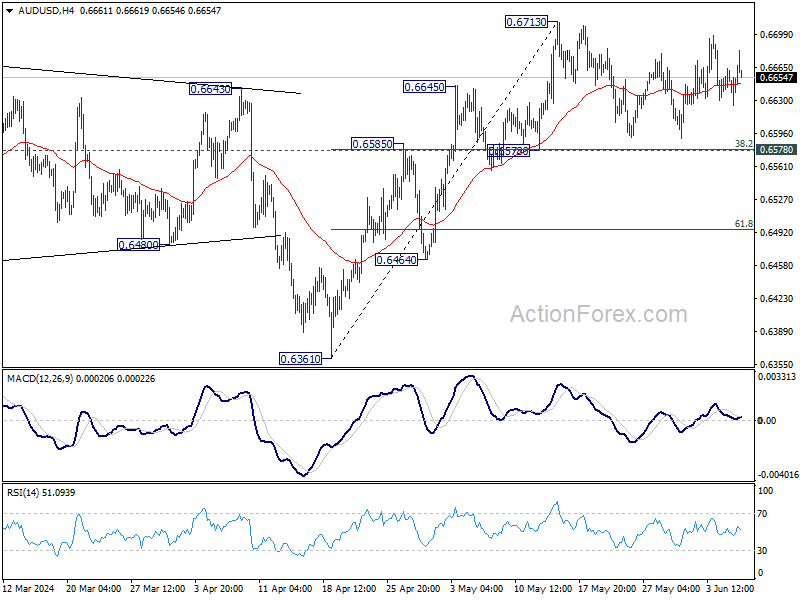
Daily Pivots: (S1) 0.6627; (P) 0.6646; (R1) 0.6666; More….
Range trading continues in AUD/USD and intraday bias remains neutral at this point. As long as 0.6578 cluster support (38.2% retracement of 0.6361 to 0.6713 at 0.6579) holds, further rally remains in favor. On the upside, firm break of 0.6713 will resume whole rise from 0.6361 to 0.6870 resistance next. However, sustained break of 0.6578 will dampen this bullish view, and bring deeper fall to 61.8% retracement at 0.6495.
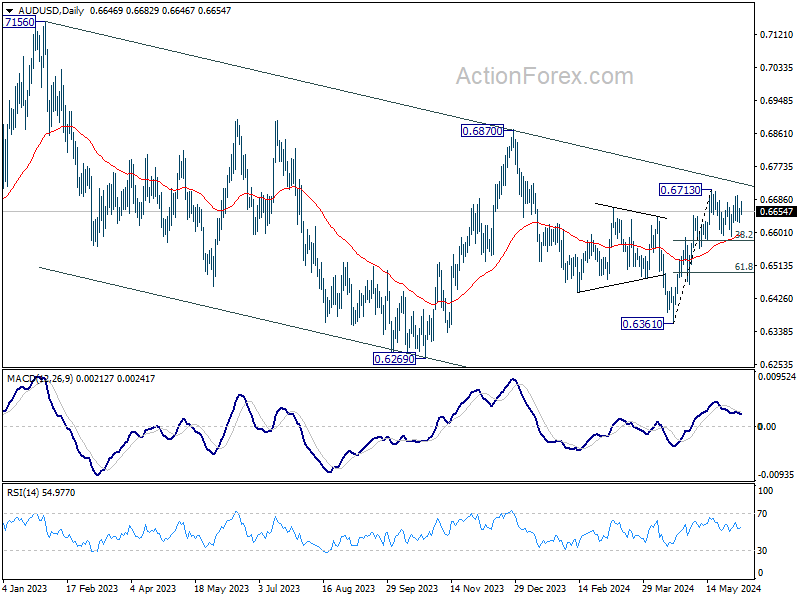
In the bigger picture, price actions from 0.6169 (2022 low) are seen as a medium term corrective pattern to the down trend from 0.8006 (2021 high). Fall from 0.7156 (2023 high) is seen as the second leg, which could have completed at 0.6269 already. Rise from there is seen as the third leg which is now trying to resume through 0.6870 resistance.
ECB Rate Cut in Sight Today
In focus today
Today, focus is on the monetary policy meeting in the ECB. The ECB is widely expected to deliver a 25bp rate cut, largely because the Governing Council members have stated as much. The updated June staff projections are expected to suggest that the prevailing economic and monetary policy narrative stays broadly unchanged, and we expect the rate cut to be formulated as a rollback of the 'insurance hike' from September last year. We expect the ECB to repeat the meeting-by-meeting and data-dependent approach to the policy rate path beyond June, and we forecast the next cut only in December. For details, see ECB Preview: A political rate cut in June, and no cut in September, 24 May.
Also in Europe, the election for the European Parliament kicks off today in the Netherlands. Over the weekend the remaining member states will vote, and we will have a result of the election on Sunday evening.
In Denmark, we expect Nationalbanken to lower interest rates by 25bp as well, if ECB acts as we expect and lowers interest rates.
Overnight, China releases trade data for May. After a weak print in April, we look for a rebound in the annual growth rate as base effects turn more positive in May.
Economic and market news
What happened overnight
In Japan, Bank of Japan's (BoJ) Nakamura said that based on current data it is appropriate for BoJ to maintain monetary policy intact for the time being. Further, he added that he sees a risk that if consumption weakens further it may discourage firms from raising prices, and that this could lead to inflation falling short of the 2% inflation target from 2025 and onwards.
What happened Wednesday
In the US, non-manufacturing ISM showed a very sharp uptick as it increased to 53.8 in May (cons: 50.8, prior: 49.4). Notably for monetary policy prices index declined further (58.1; from 59.2). Employment index rose slightly (47.1; from 45.9) but remains below the neutral level of 50. Both ISM and PMI pointed towards stronger services activity in May.
The Bank of Canada (BoC) lowered its interest rate by 25 bp to 4.75% at its monetary policy meeting. The move was in accordance with market's pricing in an 84% probability of a rate cut at the meeting. Governor Macklem said that they have seen further and sustained evidence that underlying inflation is easing, and that monetary policy therefore no longer needs to be as restrictive. Furthermore, the BoC does not rule out that more rate cuts could be on the horizon if inflation continues to head in the right direction. Markets price in a 40% probability of a cut already at the next meeting in July. USD/CAD rose close to a full figure upon announcement. Since then, USD/CAD is back at the point from before the announcement.
The National Bank of Poland (NBP) kept interest rates unchanged at 5.75% at Wednesday's monetary policy meeting, in line with market consensus. The inflation rate is back in the target range of 2.5% plus or minus one percentage point. However, there are some uncertainties on where inflation is headed since the polish government are planning to raise a cap on power prices in the second half of 2024, which according to the NBP could send inflation back above 5% at the end of the year.
In Japan, the nominal wage growth increased by 2.1% in April compared to same month a year ago. This means that in real terms Japanese wages fell 0.7% y/y, declining at a slower pace than in previous periods. We still want to see an effect of the solid spring wage hikes in the wage- and inflation data, which would allow the Bank of Japan to begin hiking rates further.
In China, the Caixin services PMI for May landed at 54.0 (cons: 52.6, prior: 52.5), much higher than expected. The number indicates that the Chinese service sector production is expanding at the highest pace in 10 months.
What happened Tuesday
In the US, President Biden announced tighter measures to curb illegal immigration on the US southern border. Officials from the Biden administration said that immigrants who illegally crossed the US-Mexican border would be ineligible for asylum until the number of daily encounters is below 1500. Currently it is above 2500 a day. Illegal immigration flow has already come down quite a bit from the peak seen in H2 2023. This seems consistent with the fact that the boom in foreign born labour force growth seen earlier has moderated a bit in March and April. We have previously flagged that this could be a factor to consider if we start to see weaker headline NFP growth towards the end of the year.
Speaking of the US labour market we saw another downside surprise in job openings with negative revisions (8.06M; prev. month revised to 8.36M from 8.49M). Weaker labour demand has been a decent leading indicator for cooling wages as well.
In Switzerland, May inflation came in at 1.4% y/y (cons: 1.4%, prior: 1.4%) and core inflation at 1.2% y/y (cons: 1.3%, prior: 1.2%). With April inflation at 1.37 and May inflation at 1.39, inflation is on track to meet the SNB's Q2 inflation forecast of 1.4%. Importantly, the monthly momentum in both core and headline ticks lower to 0.1% m/m SA in headline and 0.1% in core. EUR/CHF slightly higher on the lower core measure and decreased monthly momentum.
Equities: Global equities were higher yesterday with several new all-time high closings and US indices ending at or near their daily highs. Benign macro data and five consecutive sessions of lower yields have fuelled risk appetite. Two interesting points from yesterday include a sizeable cyclical outperformance, which is logical given the data and the increase in risk appetite. Additionally, the tech sector rose 2.5% globally yesterday, with NVDA once again standing out. While this might raise curiosity and concern, it is a classic feature of late-cycle exuberance. Going against strong trends in the current environment can be extremely costly, and using a valuation approach is worthless as a timing tool. In the US yesterday, Dow +0.3%, S&P 500 +1.2%, Nasdaq +2.0%, Russell 2000 +1.5%. Asian markets are mostly higher this morning, and futures are higher in both Europe and the US as well.
FI: Yesterday, global bond yields declined as the sentiment regarding the Federal Reserve is changing slowly as market participants are changing their views on rate cuts from the Federal Reserve. 10Y US Treasury yields fells some 5-6bp yesterday, while 2Y US Treasury fell some 5bp. Furthermore, there was also a decent rally in the European government bonds with a broad-based decline in the yields.
FX: In a quiet session yesterday the most notable developments were the move higher in USD/JPY despite the rally in US Fixed income and the relatively modest move in CAD despite Bank of Canada's first rate cut. Both EUR/SEK and EUR/NOK moved very little while EUR/USD edged marginally lower as we head into today's ECB meeting, which we do not expect will rock the single currency.
Dream Bigger Than the Price
The data from the US yesterday was mixed: a softer-than-expected ADP read and a stronger-than-expected ISM services data marked the session. According to the data, the US economy added 152K new private jobs in May – much lower than 175K penciled in by analysts and the weakest number since the start of the year, meanwhile services expanded by the strongest pace in the past nine months during the same month. The bond traders focused on the weak ADP report rather than on the strong ISM read, and sent the US 2-year yield down to 4.72%. The fact that the Bank of Canada (BoC) announced the widely expected 25bp and left the door open for more rate cuts – if inflation progress toward the right direction – and the expectation that the European Central (ECB) will be the second G7 central bank to announce the first rate cut also helped tilting the balance in favour of the doves.
And the lower yields boosted appetite in global indices. The Canadian TSX rebounded past its 50-DMA, the European SXXP jumped while the S&P500 was catapulted to a fresh record for the 25th time this year. Yes the S&P500 renewed record 25 times since this year started – regardless of the fact that we spent most of the year scaling back the Fed cut bets and are still not sure if the Fed will be able to cut rates this year at all.
So what’s driving these stocks higher? Well, tech stocks are still behind the most of the upside pressure thanks to AI craze. In numbers, the 10 stocks at the S&P500 - that include Microsoft, Nvidia, Apple, Amazon, Meta, Alphabet and Broadcom – accounted for about 35.7% of the market cap after the strong May rally. Nvidia rallied more than 5% to a fresh record and joined the club of companies that are worth more than $3 trillion. As of yesterday’s close, Nvidia is more valuable than Apple, and a touch less valuable than Microsoft – which triggered the AI rally with OpenAI’s ChatGPT. Apple on the other hand advanced by a meagre 0.78% yesterday and is at a spitting distance from its own ATH, after announcing a partnership with the very OpenAI and hoping that it could give the company’s stagnant sales the sugar boost it needs.
Dream bigger than the price
As Nvidia advances like a bulldozer to fresh highs, emerges the question of whether this price rally is justified. Now, it’s always hard to say, yes everything is justified, while looking at a price chart that rises exponentially, and pushes the PE ratio higher along with it. What’s justified, however, is the sense of urgency that investors feel about being part of the AI dream: investors want to dream bigger than the price and financial metrics. What’s happening today is – no doubt – the digital equivalent of the industrial revolution. The opportunities are huge at both the company and individual levels, and Nvidia is aware of the growing demand and keeps its foot on the gas. It announced last week that it will upgrade its AI accelerators every year, and the company is working on a 360 degree offering: this means that Nvidia is not focused on making ultra-efficient AI chips, but they are also expanding their offering with software and services to reach out to mid and small sized companies so that they can also integrate AI in their business models. This is perhaps what differentiates Nvidia from its competitors. Some compare Nvidia’s strategy to Apple’s closed system that worked so well in keeping the company on top of its game for years. The rumor has it that Nvidia is on the path to becoming the next Apple. And in terms of market cap, since yesterday, it’s already more valuable.
For the crucial question of: is it too late to buy? Well listen, we asked the same question when the stock price hit $500, $800, and $1000 per share. Now it is past $1220.
And other chipmakers are doing well, as well, Qualcomm rose more than 3% yesterday, AMD jumped nearly 4%, even the sputtering Intel added 2.50%. Here in Europe, we also had a change in top ranks of the market leaders. The Dutch ASML – which sells machines to the world’s leading chipmakers – jumped 9.50% yesterday and became Europe’s second most valuable company – overtaking LVMH - on news that TSM will receive the high-NA extreme ultraviolet machine by the end of this year. I asked ChatGPT what’s that – as I think there is no one in a better position to answer that question and it replied by a detailed text and said that ‘the introduction of high-NA EUV machines is significant because it represents a major technological advancement, enabling the production of even smaller and more powerful semiconductor devices. These machines are expected to play a critical role in the next generation of chip manufacturing, supporting further advancements in electronics and computing’. TSM also rallied 6.85% yesterday to a fresh high.
ECB to cut
Let’s now come back to earth, the ECB is expected to announce a 25bp cut later today. Because that decision is broadly expected and priced in since months, it won’t matter that much for the market mood. The real question is, what tidbit will Lagarde drop regarding the future rate cuts. Will she sound cautious about future rate cuts, or will she sound confident that this is the first rate cut of a series of more rate cuts expected to come regularly. Note that the latest CPI update from the Eurozone wasn’t enchanting last week – as it hinted at rising price pressures last month, but released yesterday, a softer-than-expected PPI figures for April threw some cold water on worries. The EURUSD rebounded yesterday but saw resistance into the 1.09 level. A sufficiently dovish hint from Lagarde at today’s presser should bring the euro bears in charge of the market.
USD/CAD Daily Outlook
Daily Pivots: (S1) 1.3659; (P) 1.3700; (R1) 1.3736; More….
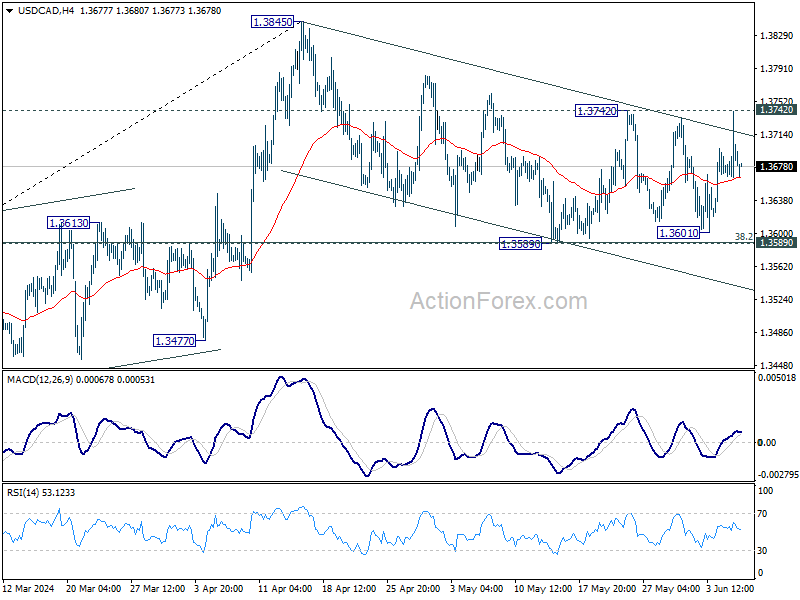
USD/CAD is still stuck in range after failing to break through 1.3742 resistance. Intraday bias remains neutral for the moment and outlook is unchanged. On the upside, break of 1.3742 resistance will revive the case that correction from 1.3845 has completed at 1.3589. Intraday bias will be back on the upside for retesting 1.3845. On the downside, firm break of 1.3589 support will argue that whole rise from 1.3176 has completed at 1.3845 already. Fall from 1.3845 should then resume to 61.8% retracement of 1.3176 to 1.3845 at 1.3432.
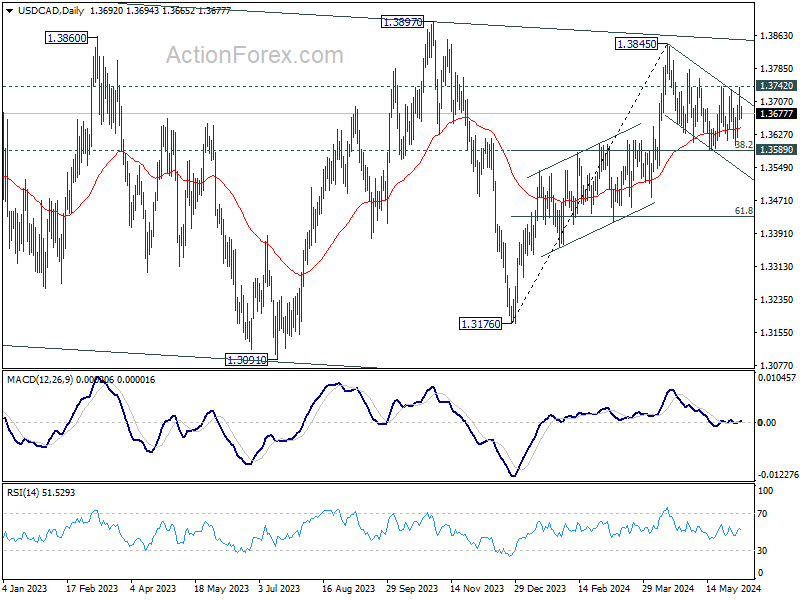
In the bigger picture, price actions from 1.3976 (2022 high) are viewed as a corrective pattern. In case of another fall, strong support should emerge above 1.2947 resistance turned support to bring rebound. Firm break of 1.3976 will confirm up resumption of whole up trend from 1.2005 (2021 low). Next target is 61.8% projection of 1.2401 to 1.3976 from 1.3176 at 1.4149.
Post-BoC Selloff Short-Lived for Canadian Dollar, Euro Eyes Upcoming ECB Meeting
Canadian Dollar remains the weakest performer for the week at this point. Yet, losses is so far contained, with the recovery after the brief selloff following BoC's rate cut overnight. While further cuts are anticipated within the year, the likelihood of another immediate adjustment in July is currently seen as unlikely , with market odds at about 40% only. Instead, analysts now predict possibly only two more rate reductions, one each in Q3 and Q4.
Attention is now shifting to ECB's anticipated rate cut today. The main question is whether ECB will hint at additional easing measures for the remainder of the year, particularly through its upcoming economic projections. Euro has displayed mixed performance so far this week but could potentially strengthen if ECB's stance is perceived as less dovish than expected.
Overall in the forex markets, Swiss Franc leads as the strongest currency of the week, with Yen and New Zealand Dollar also showing robust performances. The U.S. Dollar trails Canadian Dollar as the second weakest, followed by the Australian Dollar. British Pound and Euro are holding steady in the middle of the performance spectrum.
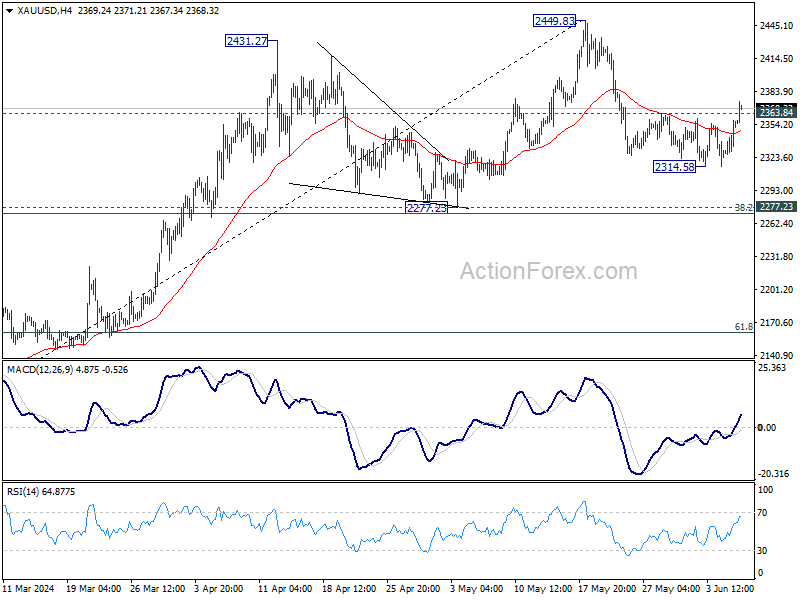
Technically, Gold's break of 2363.84 resistance argues that pull back from 2449.83 has completed at 2314.58 already. Further rise would be seen back to retest 2449.83, but upside would likely be limited there for the first attempt. Meanwhile, break of 2314.58 will extend the corrective fall to 2277.23 cluster support instead.
In Asia, at the time of writing Nikkei is up 0.72%. Hong Kong HSI is up 0.24%. China Shanghai SSE is down -0.09%. Singapore Strait Times is up 0.25%. Japan 10-year JGB yield is down -0.0357 at 0.969. Overnight, DOW rose 0.25%. S&P 500 rose 1.18%. NASDAQ rose 1.96%. 10-year yield fell -0.047 to 4.289.
BoJ's Nakamura warns of inflation risks, advocates maintaining current policy
BoJ board member Toyoaki Nakamura, known for his dovish stance, cautioned in a speech today that "inflation may not reach 2 per cent from fiscal 2025 onward" if households reduce spending, which would discourage companies from further price hikes.
Nakamura highlighted that domestic consumption has been sluggish recently. He also pointed to the uncertainty surrounding the sustainability of wage increases, noting that the impact of rising wages on prices has been weak too.
Given the current data, Nakamura stated that it is appropriate to keep monetary policy unchanged for the time being. He was the sole dissenter in the BoJ's decision to end eight years of negative interest rates and bond yield control in March.
Tech sector propels NASDAQ to new record
The US stock markets continued to display diverged performance. While DOW continued to struggle to bounce, S&P 500 and NASDAQ surged to new record highs. In the background, investor confidence is growing that Fed will begin cutting interest rates in September, with markets currently pricing in nearly 70% odds of this outcome.
A significant driver of this bullish sentiment is the strong performance of the tech sector, which has boosted overall risk appetite. Nvidia's market valuation reached the USD 3T for the first time, surpassing Apple to become the world's second-most valuable company.
Technically, near term outlook will now stay bullish in NASDAQ as long as 16336.07 support holds. A goldilocks non-farm payroll report tomorrow could prompt upside acceleration towards 138.2% projection of 10207.47 to 14446.55 from 12543.85 at 18427.31.
ECB to initiate easing cycle, markets seek clues on next moves
ECB is expected to commence its monetary policy loosening cycle today, with market anticipating a 25 basis point reduction in deposit rate to 3.75% and an adjustment of main refinancing rate to 4.25% correspondingly. Key focus areas will be ECB’s communication during the press conference and updates in the economic projections, which could provide crucial insights into the central bank's policy strategy for the remainder of the year.
Economists are divided on the future pace of easing, with some forecasting two additional rate cuts in September and December. However, they acknowledge that the likelihood leans overwhelmingly towards fewer rate cuts rather than more, particularly if core inflation remains elevated and economic recovery picks up speed at the beginning of Q3. Current market pricing reflects this uncertainty, with only 60% probability assigned to a rate cut in September.
A critical aspect to monitor will be any adjustments in the inflation forecasts, especially any upward revisions. A significant increase in inflation projections could diminish the likelihood of a rate cut in September.
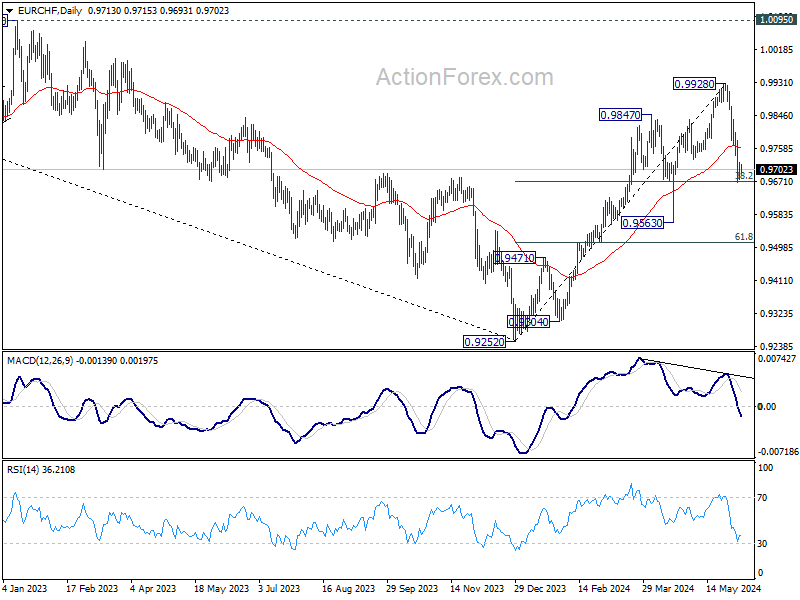
EUR/CHF is now sitting at a juncture, pressing 38.2% retracement of 0.9252 to 0.9928 at 0.9670. Strong bounce from the current level, followed by sustained trading above 55 D EMA, will maintain near term bullishness. That is, while corrective pattern from 0.9928 could still extend further, rise from 0.9252 is in favor to resume at a later stage.
However, sustained break of 0.9670 will raise the chance of bearish reversal, and bring deeper decline to 0.9563 support next.
Looking ahead
Germany factor orders, Eurozone retail sales and UK PMI construction will be released in European session. Later in the day, US will release jobless claims and trade balance. Canada will release trade balance and Ivey PMI.
USD/CAD Daily Outlook
Daily Pivots: (S1) 1.3659; (P) 1.3700; (R1) 1.3736; More….
USD/CAD is still stuck in range after failing to break through 1.3742 resistance. Intraday bias remains neutral for the moment and outlook is unchanged. On the upside, break of 1.3742 resistance will revive the case that correction from 1.3845 has completed at 1.3589. Intraday bias will be back on the upside for retesting 1.3845. On the downside, firm break of 1.3589 support will argue that whole rise from 1.3176 has completed at 1.3845 already. Fall from 1.3845 should then resume to 61.8% retracement of 1.3176 to 1.3845 at 1.3432.
In the bigger picture, price actions from 1.3976 (2022 high) are viewed as a corrective pattern. In case of another fall, strong support should emerge above 1.2947 resistance turned support to bring rebound. Firm break of 1.3976 will confirm up resumption of whole up trend from 1.2005 (2021 low). Next target is 61.8% projection of 1.2401 to 1.3976 from 1.3176 at 1.4149.
Economic Indicators Update
| GMT | Ccy | Events | Actual | Forecast | Previous | Revised |
|---|---|---|---|---|---|---|
| 01:30 | AUD | Trade Balance (AUD) May | 6.55B | 5.50B | 5.02B | 4.84B |
| 05:45 | CHF | Unemployment Rate May | 2.40% | 2.30% | 2.30% | |
| 06:00 | EUR | Germany Factory Orders M/M Apr | 0.50% | -0.40% | ||
| 08:00 | EUR | Italy Retail Sales M/M Apr | 0.30% | 0.00% | ||
| 08:30 | GBP | Construction PMI May | 52.5 | 53 | ||
| 09:00 | EUR | Eurozone Retail Sales M/M Apr | 0.20% | 0.80% | ||
| 12:15 | EUR | ECB Rate On Deposit Facility | 3.75% | 4.00% | ||
| 12:15 | EUR | ECB Main Refinancing Operations Rate | 4.25% | 4.50% | ||
| 12:30 | USD | Trade Balance (USD) Apr | -69.8B | -69.4B | ||
| 12:30 | USD | Initial Jobless Claims (May 31) | 215K | 219K | ||
| 12:30 | USD | Nonfarm Productivity Q1 | 0.30% | 0.30% | ||
| 12:30 | USD | Unit Labor Costs Q1 | 4.70% | 4.70% | ||
| 12:30 | CAD | Trade Balance (CAD) Apr | -2.2B | -2.3B | ||
| 12:45 | EUR | ECB Press Conference | ||||
| 14:00 | CAD | Ivey PMI May | 65.2 | 63 | ||
| 14:30 | USD | Natural Gas Storage | 89B | 84B |
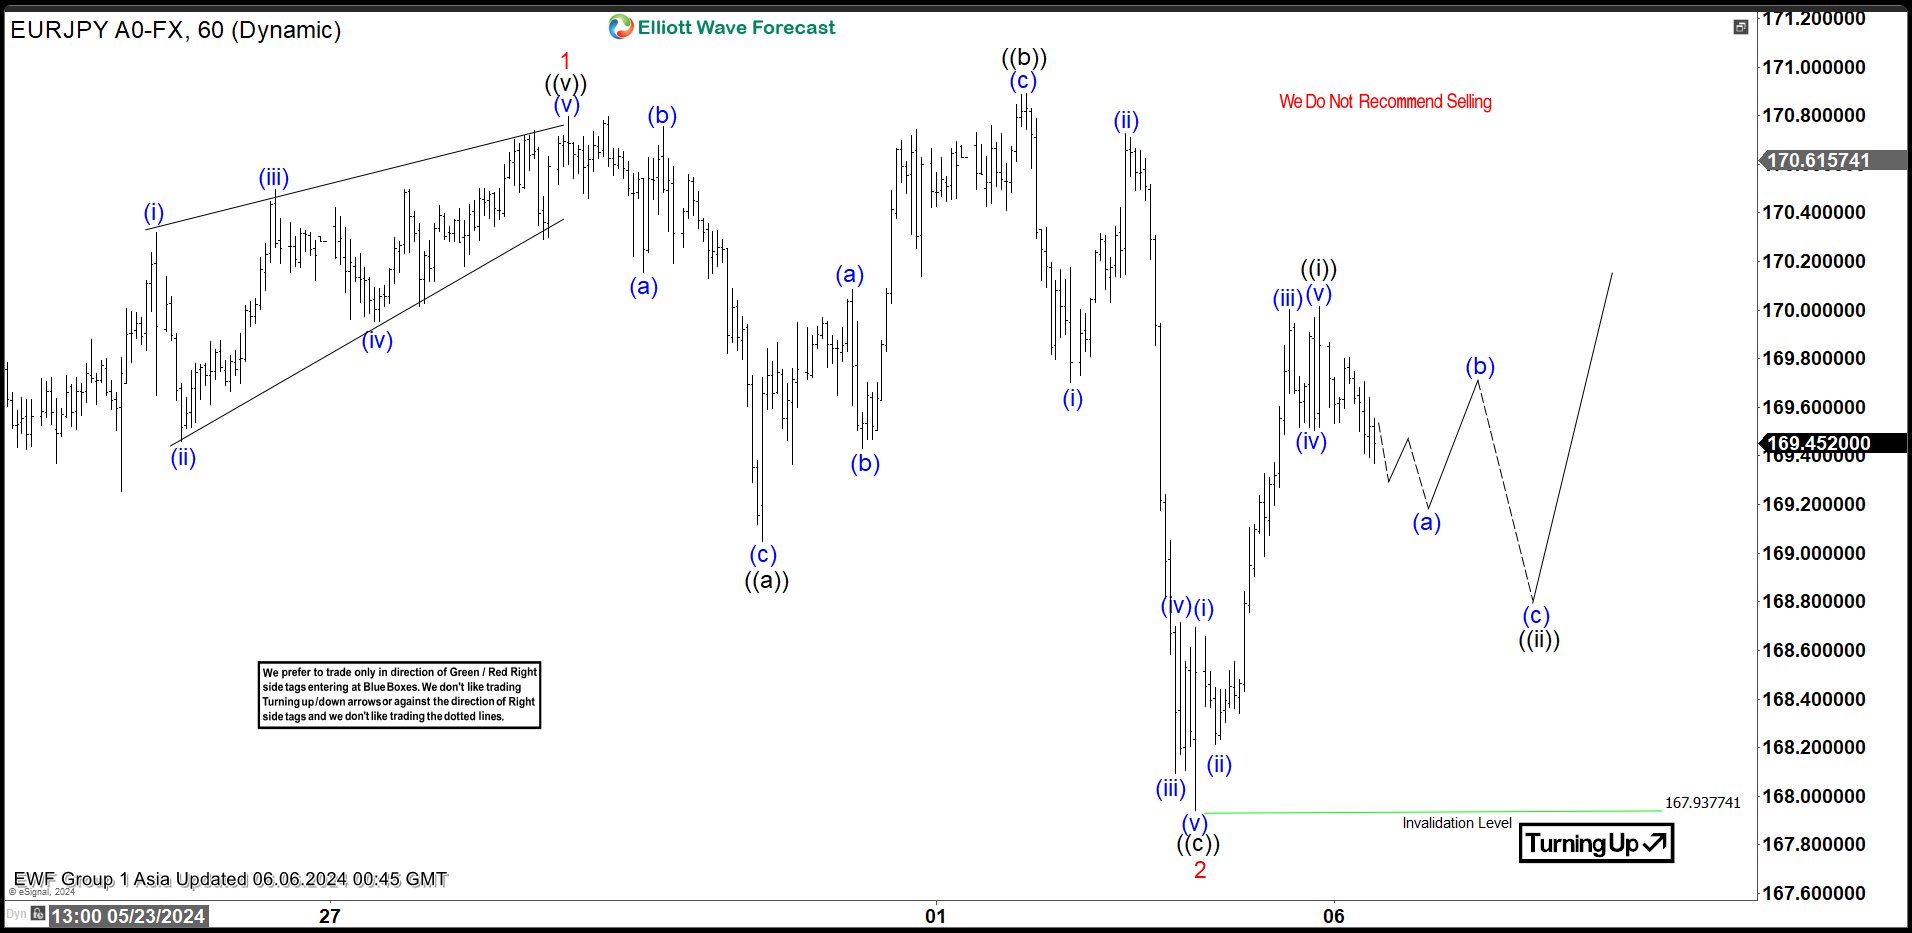
EURJPY 5 Waves Impulsive Elliott Wave Rally Favors Upside
Short Term Elliott Wave in EURJPY suggests rally from 5.3.2024 is unfolding as a 5 waves impulse. Up from 5.3.2024 low, wave 1 ended at 170.798. Dips in wave 2 took the form of an expanded Flat Elliott Wave structure. Down from wave 1, wave (a) ended at 170.15 and wave (b) ended at 170.75. Wave (c) lower ended at 169.05 which completed wave ((a)) in higher degree. Up from there, wave ((b)) ended at 170.89 with internal subdivision as a zigzag. Final leg wave ((c)) lower ended at 167.93 in the form of an impulse. This also ended wave 2 pullback in higher degree.
Pair has started to turn higher in wave 3. Shor Term rally from wave 2 low looks to be a clear 5 waves impulsive structure, favoring further upside. Up from wave 2, wave (i) ended at 168.65 and pullback in wave (ii) ended at 168.21. Wave (iii) higher ended at 170, dips in wave (iv) ended at 169.5, and final leg wave (v) ended at 170 which completed wave ((i)). Near term, as far as it stays above 167.93, expect wave ((ii)) pullback to find support in 3, 7, or 11 swing for further upside.
EURJPY 60 Minutes Elliott Wave Chart
EURJPY Elliott Wave Video
https://www.youtube.com/watch?v=1QerO4WXzt0
GBP/USD Shows Signs of Strength, 1.3000 Next?
Key Highlights
- GBP/USD gained pace for a move above the 1.2800 resistance.
- A major bullish trend line is forming with support at 1.2750 on the 4-hour chart.
- Gold prices are gaining pace above the $2,350 resistance zone.
- EUR/USD is aiming for a move toward the 1.0950 level.
GBP/USD Technical Analysis
The British Pound remained in a positive zone above the 1.2650 support level against the US Dollar. GBP/USD gained pace for a move above 1.2720 and 1.2750.
Looking at the 4-hour chart, the pair started a consolidation phase above the 1.2750 level. There is also a major bullish trend line forming with support at 1.2750. The main support seems to be forming near the 1.2720 level and the 100 simple moving average (red, 4-hour).
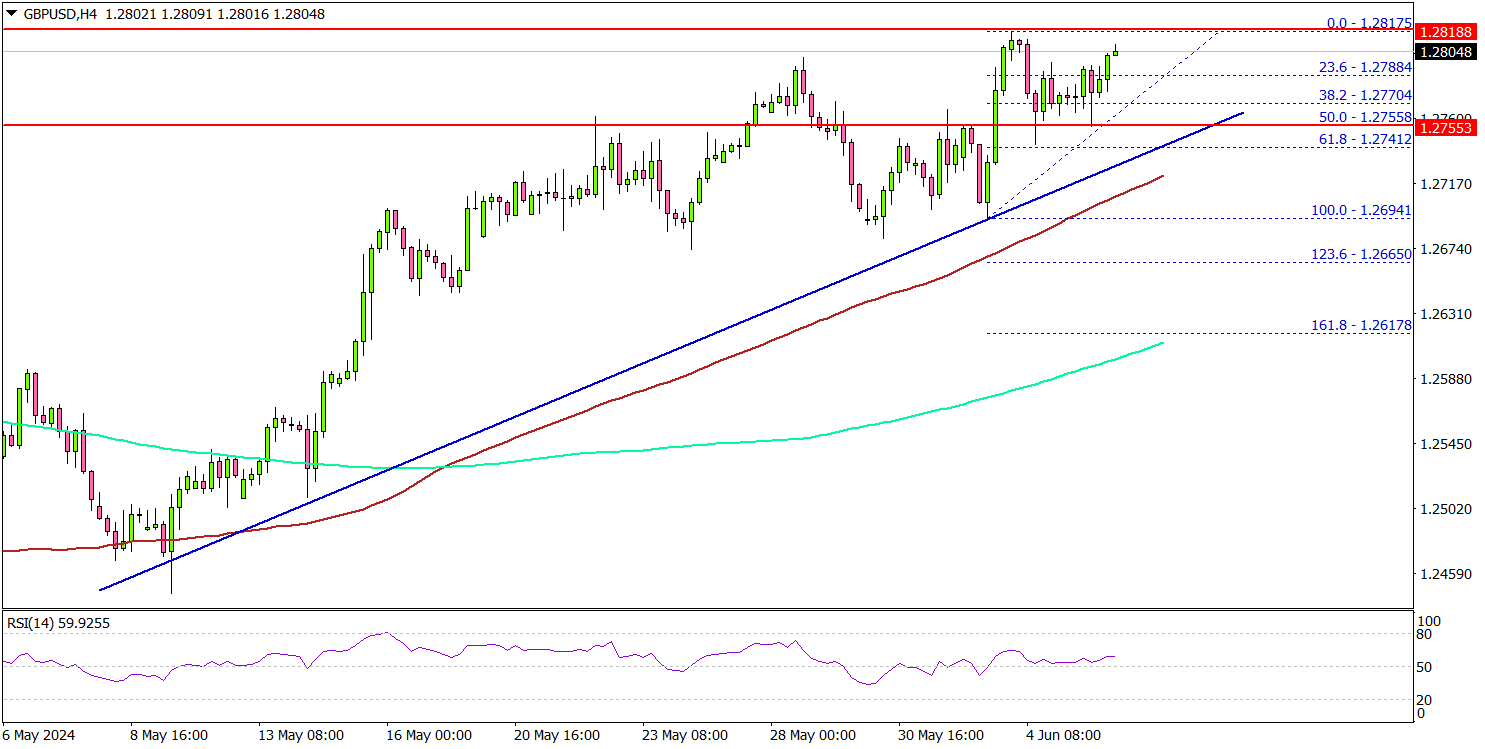
A downside break and close below the 1.2720 support zone could open the doors for a larger decline. In the stated case, the pair could decline toward the 1.2650 level.
On the upside, immediate resistance is near the 1.2820 zone. The first major resistance is near the 1.2850 level. A clear move above the 1.2850 resistance might send it toward the 1.2920 level. Any more gains might call for a move toward the 1.3000 level in the near term.
Looking at EUR/USD, the pair is showing positive signs, and the bulls might soon aim for a move toward the 1.0950 level in the near term.
Economic Releases
- US Initial Jobless Claims - Forecast 220K, versus 219K previous.
- ECB Interest Rate Decision - Forecast 3.75%, versus 4.0% previous.
ECB to initiate easing cycle, markets seek clues on next moves
ECB is expected to commence its monetary policy loosening cycle today, with market anticipating a 25 basis point reduction in deposit rate to 3.75% and an adjustment of main refinancing rate to 4.25% correspondingly. Key focus areas will be ECB’s communication during the press conference and updates in the economic projections, which could provide crucial insights into the central bank's policy strategy for the remainder of the year.
Economists are divided on the future pace of easing, with some forecasting two additional rate cuts in September and December. However, they acknowledge that the likelihood leans overwhelmingly towards fewer rate cuts rather than more, particularly if core inflation remains elevated and economic recovery picks up speed at the beginning of Q3. Current market pricing reflects this uncertainty, with only 60% probability assigned to a rate cut in September.
A critical aspect to monitor will be any adjustments in the inflation forecasts, especially any upward revisions. A significant increase in inflation projections could diminish the likelihood of a rate cut in September.
EUR/CHF is now sitting at a juncture, pressing 38.2% retracement of 0.9252 to 0.9928 at 0.9670. Strong bounce from the current level, followed by sustained trading above 55 D EMA, will maintain near term bullishness. That is, while corrective pattern from 0.9928 could still extend further, rise from 0.9252 is in favor to resume at a later stage.
However, sustained break of 0.9670 will raise the chance of bearish reversal, and bring deeper decline to 0.9563 support next.
BoJ’s Nakamura warns of inflation risks, advocates maintaining current policy
BoJ board member Toyoaki Nakamura, known for his dovish stance, cautioned in a speech today that "inflation may not reach 2 per cent from fiscal 2025 onward" if households reduce spending, which would discourage companies from further price hikes.
Nakamura highlighted that domestic consumption has been sluggish recently. He also pointed to the uncertainty surrounding the sustainability of wage increases, noting that the impact of rising wages on prices has been weak too.
Given the current data, Nakamura stated that it is appropriate to keep monetary policy unchanged for the time being. He was the sole dissenter in the BoJ's decision to end eight years of negative interest rates and bond yield control in March.