Sample Category Title
US initial jobless claims rises to 229k vs exp 215k
US initial jobless claims rose 8k to 229k in the week ending May 25, above expectation of 215k. Four-week moving average of initial claims fell -750 to 222k.
Continuing claims rose 2k to 1792k in the week ending May 25. Four-week moving average of continuing claims rose 3k to 1789k.
GBP/USD: Extended Consolidation Likely to Precede Fresh Push Higher
Cable is consolidating under new multi-week high (1.2817), with near-term action underpinned by rising 10DMA (1.2758) and looking for fresh push higher and attack at 2024 high (1.2893).
Daily moving averages in full bullish configuration and with multiple bull-crosses maintain bullish structure, though fading positive momentum suggests that near-term action may hold in extended consolidation before larger bulls regain full control.
Dips should be ideally contained by 10DMA (also broken Fibo 76.4% of 1.2893/1.2299) and extended pullback not to exceed 1.2707/1.2680 zone (rising 20DMA (May 30 higher low) to keep larger bulls in play.
Res: 1.2803; 1.2817; 1.2853; 1.2893.
Sup: 1.2758; 1.2707; 1.2680; 1.2666.

ETHUSD Consolidates as Advance Pauses
- ETHUSD posts fresh 2-month high following ETF approval
- But fails to extend its rally as bulls lift foot off the gas
- Momentum indicators ease from overbought conditions
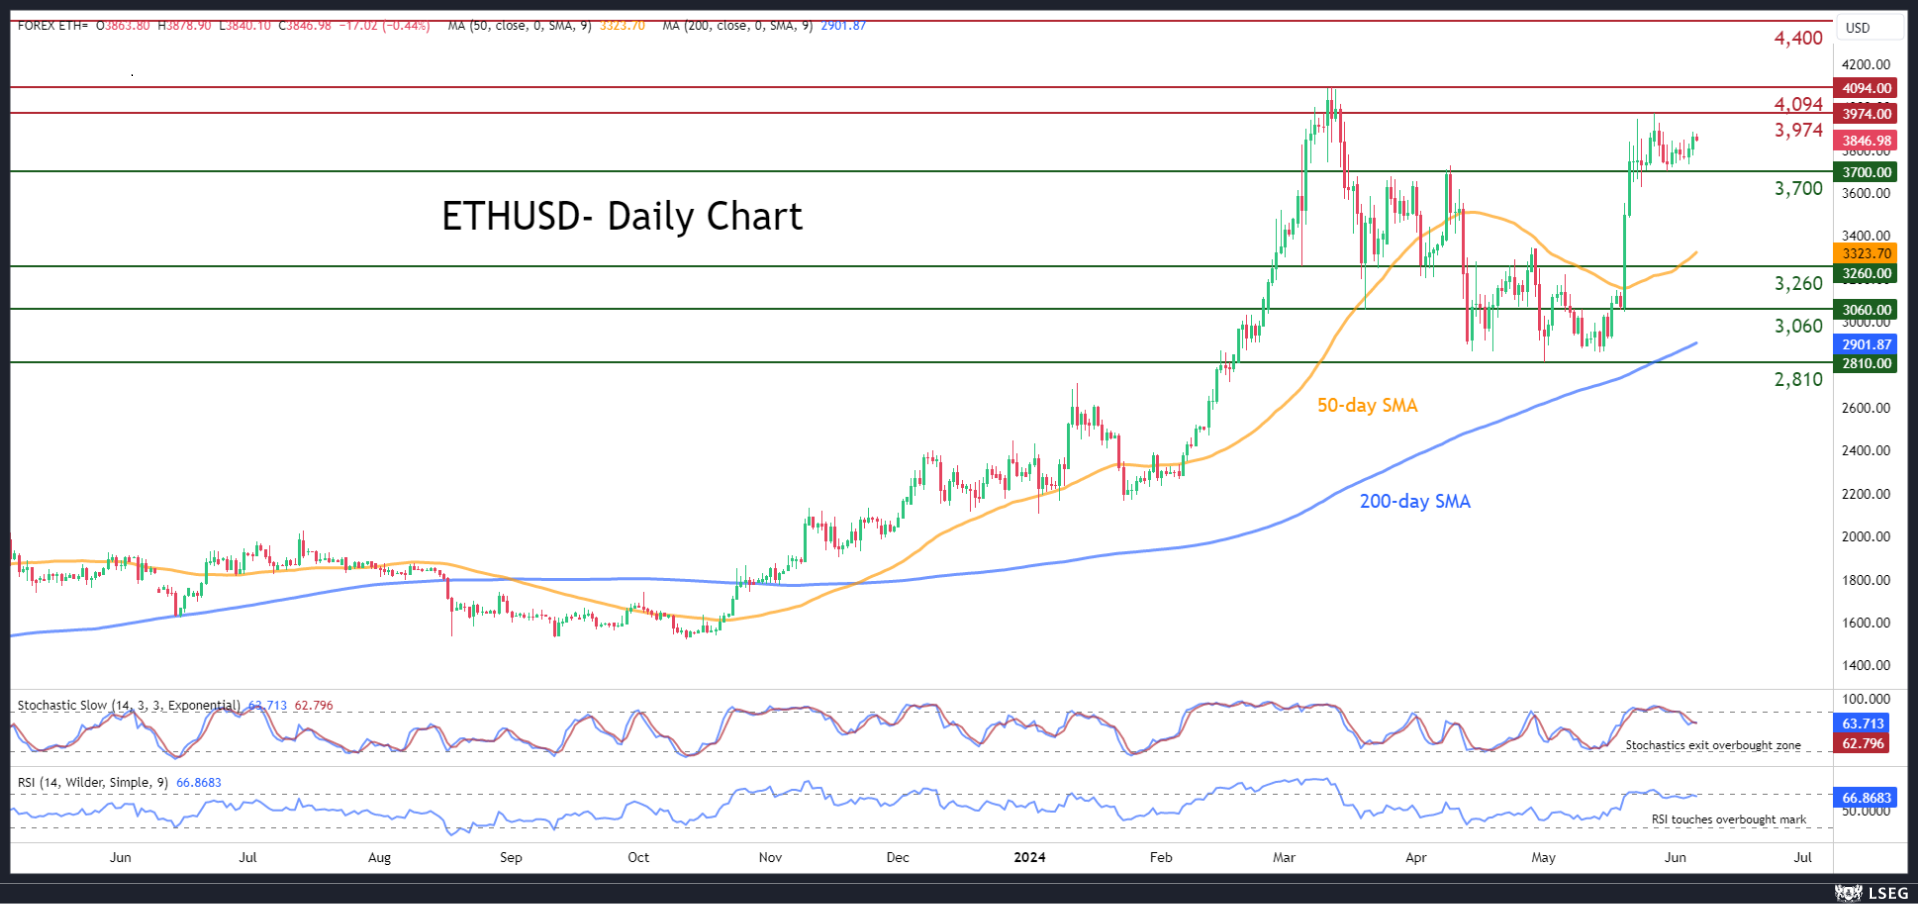
ETHUSD (Ethereum) had been on the rise after claiming the 50-day simple moving average (SMA) in mid-May, also helped by the regulatory approval of spot-Ethereum ETFs in the US. Although the price posted a fresh two-month peak of 3,974, it has been rangebound in the past few sessions due to approaching overbought conditions.
Should the price reverse lower, immediate support could be found at 3,700, a region that has acted both as support and resistance in 2024. Lower, the bears could attack the March-April support of 3,260. Slicing through that barrier, the pair might test the March bottom of 3,060.
On the flipside, if the bulls regain total control, the price could revisit its two-month peak of 3,974. A violation of that zone could pave the way for the 2024 high of 4,090, which is also a more than two-year high. Should that barricade fail, attention might shift to 4,400, a region that was frequently tested from October till December of 2021.
Overall, although ETHUSD stormed to a fresh two-month high supported by sector-specific developments, it seems that its rally is running out of juice. Hence, traders should not rule out another sell-the-fact type of reaction moving forward given what we have previously seen this year in the crypto sector.
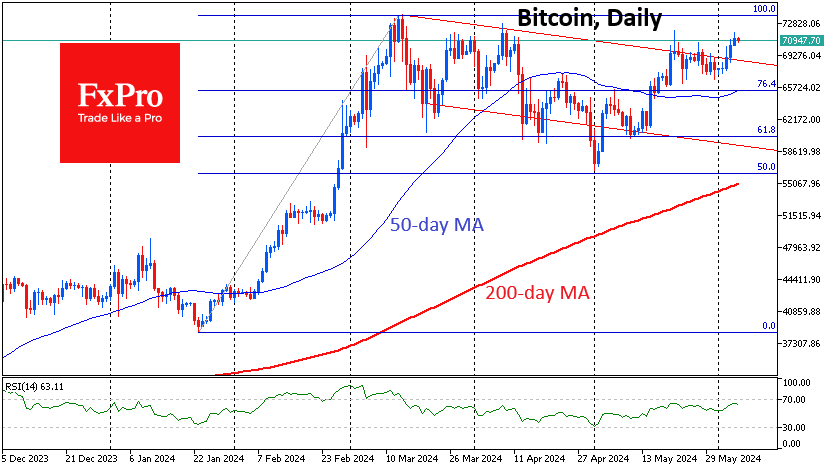
Crypto Takes its Time
Market picture
The cryptocurrency market decided to storm the local highs set almost two months ago. However, the growth has not yet developed, and some players rushed to fix profits quickly despite the positive sentiment in the US stock markets.
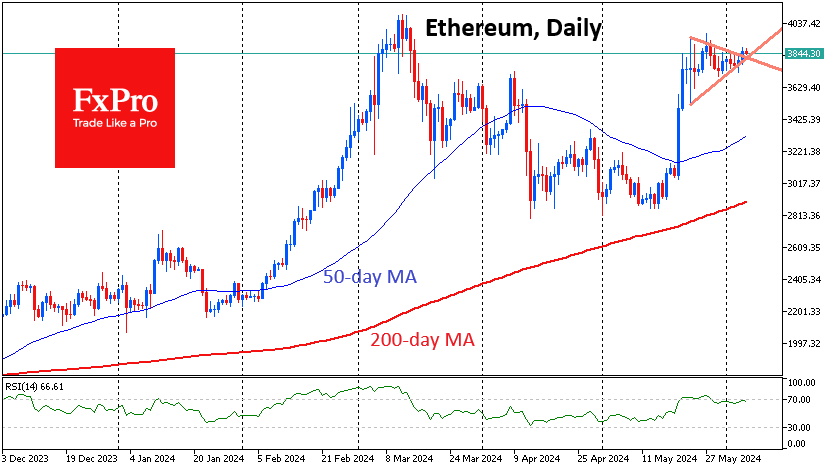
Bitcoin is trading near $71K, where it was a day ago, but Ethereum (+1%) has moved up – a small but important step up from the consolidation range. These two coins account for over 70% of the total crypto market capitalisation and show no signs of excitement so far. It seems that the market preferred to climb smoothly to the March highs. So, we should not expect an acceleration of growth immediately after reaching them because, with smooth growth, traders will move stop orders higher.
On June 5, BNB and TON quotes updated their historical highs at $715 and $7.8, respectively. Toncoin jumped on the background of news about the addition of TON to the European trading platform Robinhood Crypto.
BNB’s rise is likely due to the Simple Earn programme, which runs from June 5 to 25 and will allow you to lock in BNB or SUI for that period for additional profits.
News background
According to SoSoValue, net inflows into spot bitcoin ETFs in the US totalled $886 million on 4 June, the second highest on record after the $1.05 billion recorded on 12 March. Inflows into spot bitcoin ETFs have continued for 16 consecutive days. Bloomberg noted that total investments since the beginning of the year reached $15 billion.
Fidelity Investments believes that most market participants should have positions in Bitcoin, regardless of their beliefs. To do so, they need to allocate just 1-5% of their capital to BTC.
Ripple CEO Brad Garlinghouse said that the launch of the Ethereum-ETF will open the door for other cryptocurrencies to enter the ETF market. He believes the emergence of XRP-based spot exchange-traded funds is “inevitable.” Other ETF contenders could include Solana (SOL) and Cardano (ADA).
FTX, which is in bankruptcy proceedings, has settled a lawsuit by the US Internal Revenue Service (IRS). According to the parties’ settlement agreement, the agency will receive, at best, $885 million from FTX instead of the $24 billion originally sought.
ECB cuts 25bps, inflation seen below 2% in 2026
ECB has lowered interest rates by 25 basis points as widely expected. Following the reduction, the main refinancing rate is now 4.25%, the deposit rate is 3.75%, and the marginal lending rate is 4.50%.
In its latest forecasts, the ECB projects economic growth to pick up to 0.9% in 2024, 1.4% in 2025, and 1.6% in 2026.
Inflation is expected to average 2.5% in 2024, 2.2% in 2025, and 1.9% in 2026. Core inflation is forecasted to average 2.8% in 2024, 2.2% in 2025, and 2.0% in 2026.
Notably, both headline and core inflation forecasts have been revised upward for 2024 and 2025.
Monetary policy decisions
The Governing Council today decided to lower the three key ECB interest rates by 25 basis points. Based on an updated assessment of the inflation outlook, the dynamics of underlying inflation and the strength of monetary policy transmission, it is now appropriate to moderate the degree of monetary policy restriction after nine months of holding rates steady. Since the Governing Council meeting in September 2023, inflation has fallen by more than 2.5 percentage points and the inflation outlook has improved markedly. Underlying inflation has also eased, reinforcing the signs that price pressures have weakened, and inflation expectations have declined at all horizons. Monetary policy has kept financing conditions restrictive. By dampening demand and keeping inflation expectations well anchored, this has made a major contribution to bringing inflation back down.
At the same time, despite the progress over recent quarters, domestic price pressures remain strong as wage growth is elevated, and inflation is likely to stay above target well into next year. The latest Eurosystem staff projections for both headline and core inflation have been revised up for 2024 and 2025 compared with the March projections.Staff now see headline inflation averaging 2.5% in 2024, 2.2% in 2025 and 1.9% in 2026. For inflation excluding energy and food, staff project an average of 2.8% in 2024, 2.2% in 2025 and 2.0% in 2026. Economic growth is expected to pick up to 0.9% in 2024, 1.4% in 2025 and 1.6% in 2026.
The Governing Council is determined to ensure that inflation returns to its 2% medium-term target in a timely manner. It will keep policy rates sufficiently restrictive for as long as necessary to achieve this aim. The Governing Council will continue to follow a data-dependent and meeting-by-meeting approach to determining the appropriate level and duration of restriction. In particular, its interest rate decisions will be based on its assessment of the inflation outlook in light of the incoming economic and financial data, the dynamics of underlying inflation and the strength of monetary policy transmission. The Governing Council is not pre-committing to a particular rate path.
The Governing Council today also confirmed that it will reduce the Eurosystem’s holdings of securities under the pandemic emergency purchase programme (PEPP) by €7.5 billion per month on average over the second half of the year. The modalities for reducing the PEPP holdings will be broadly in line with those followed under the asset purchase programme (APP).
Key ECB interest rates
The Governing Council decided to lower the three key ECB interest rates by 25 basis points. Accordingly, the interest rate on the main refinancing operations and the interest rates on the marginal lending facility and the deposit facility will be decreased to 4.25%, 4.50% and 3.75% respectively, with effect from 12 June 2024.
Asset purchase programme (APP) and pandemic emergency purchase programme (PEPP)
The APP portfolio is declining at a measured and predictable pace, as the Eurosystem no longer reinvests the principal payments from maturing securities.
The Governing Council will continue to reinvest, in full, the principal payments from maturing securities purchased under the PEPP until the end of June 2024. Over the second half of the year, it will reduce the PEPP portfolio by €7.5 billion per month on average. The Governing Council intends to discontinue reinvestments under the PEPP at the end of 2024.
The Governing Council will continue applying flexibility in reinvesting redemptions coming due in the PEPP portfolio, with a view to countering risks to the monetary policy transmission mechanism related to the pandemic.
Refinancing operations
As banks are repaying the amounts borrowed under the targeted longer-term refinancing operations, the Governing Council will regularly assess how targeted lending operations and their ongoing repayment are contributing to its monetary policy stance.
***
The Governing Council stands ready to adjust all of its instruments within its mandate to ensure that inflation returns to its 2% target over the medium term and to preserve the smooth functioning of monetary policy transmission. Moreover, the Transmission Protection Instrument is available to counter unwarranted, disorderly market dynamics that pose a serious threat to the transmission of monetary policy across all euro area countries, thus allowing the Governing Council to more effectively deliver on its price stability mandate.
The President of the ECB will comment on the considerations underlying these decisions at a press conference starting at 14:45 CET today.
Eurozone retail sales down -0.5% mom in Apr, EU falls -0.6% mom
Eurozone retail sales volume fell -0.5% mom in April, worse than expectation of -0.2% mom. Sales volume decreased for food, drinks, tobacco by 0.5%, for non-food products (except automotive fuel) by 0.1%, and for automotive fuel in specialised stores by 2.2%.
EU retail sales fell -0.6% mom. Among Member States for which data are available, the largest monthly decreases in the total retail trade volume were recorded in Latvia (-3.3%), Cyprus (-3.1%) and Denmark (-2.7%). The highest increases were observed in Slovakia (+2.4%), Bulgaria and Austria (both +1.9%) and Portugal (+1.7%).
Gold Prices Reach 2368 USD Amid Speculation of Fed Rate Cuts
Gold prices climbed to 2368 USD per troy ounce on Thursday, continuing the upward momentum for the second session. This surge comes as market expectations adjust to the likelihood of future interest rate cuts by the Federal Reserve, fuelled by recent employment data.
Data from ADP indicated that the number of private-sector jobs in the US for May increased less than expected, with April’s figures also revised downwards. This suggests a cooling but robust employment market, reinforcing speculation about impending rate cuts. According to the CME Group’s FedWatch tool, market participants anticipate two rate cuts in 2024, with a 70% probability of easing by September.
Attention is now turning to Friday’s comprehensive labour market reports from the US, which will provide further insights into the economic health and possible direction of monetary policy. Additionally, recent global movements by central banks, such as the Bank of Canada’s first rate cut in four years and the expected rate cut by the European Central Bank today, are influencing gold prices.
XAU/USD technical analysis
The H4 chart shows that gold has broken out of a consolidation range established above the 2315.00 USD level, moving upwards. The market is now poised to reach 2395.00 USD potentially. Once this target is met, a retraction to 2356.20 USD for a test from above could occur before another possible rise to 2399.00 USD. The MACD indicator supports this bullish outlook, with its signal line below zero but ascending sharply towards new highs.
On the H1 chart, gold developed a growth wave towards 2356.20 USD, followed by a consolidation range forming below this level. The market has since broken upwards, continuing the growth trajectory towards 2378.23 USD. After reaching this level, a corrective movement back to 2356.20 USD may occur, potentially setting the stage for a push towards the 2395.00 USD mark. The Stochastic oscillator indicates that, while the signal line has dipped below 80, it is expected to rise again towards 80, suggesting continued upward momentum.
Market outlook
Gold prices are experiencing a bullish phase, underpinned by shifting expectations regarding US monetary policy and actions by other central banks. Investors should closely monitor the upcoming US employment data and global central bank decisions. These events could significantly influence gold’s price dynamics in the short term. The technical indicators suggest a continuation of the current uptrend, with key levels to watch for potential reversals or further gains.
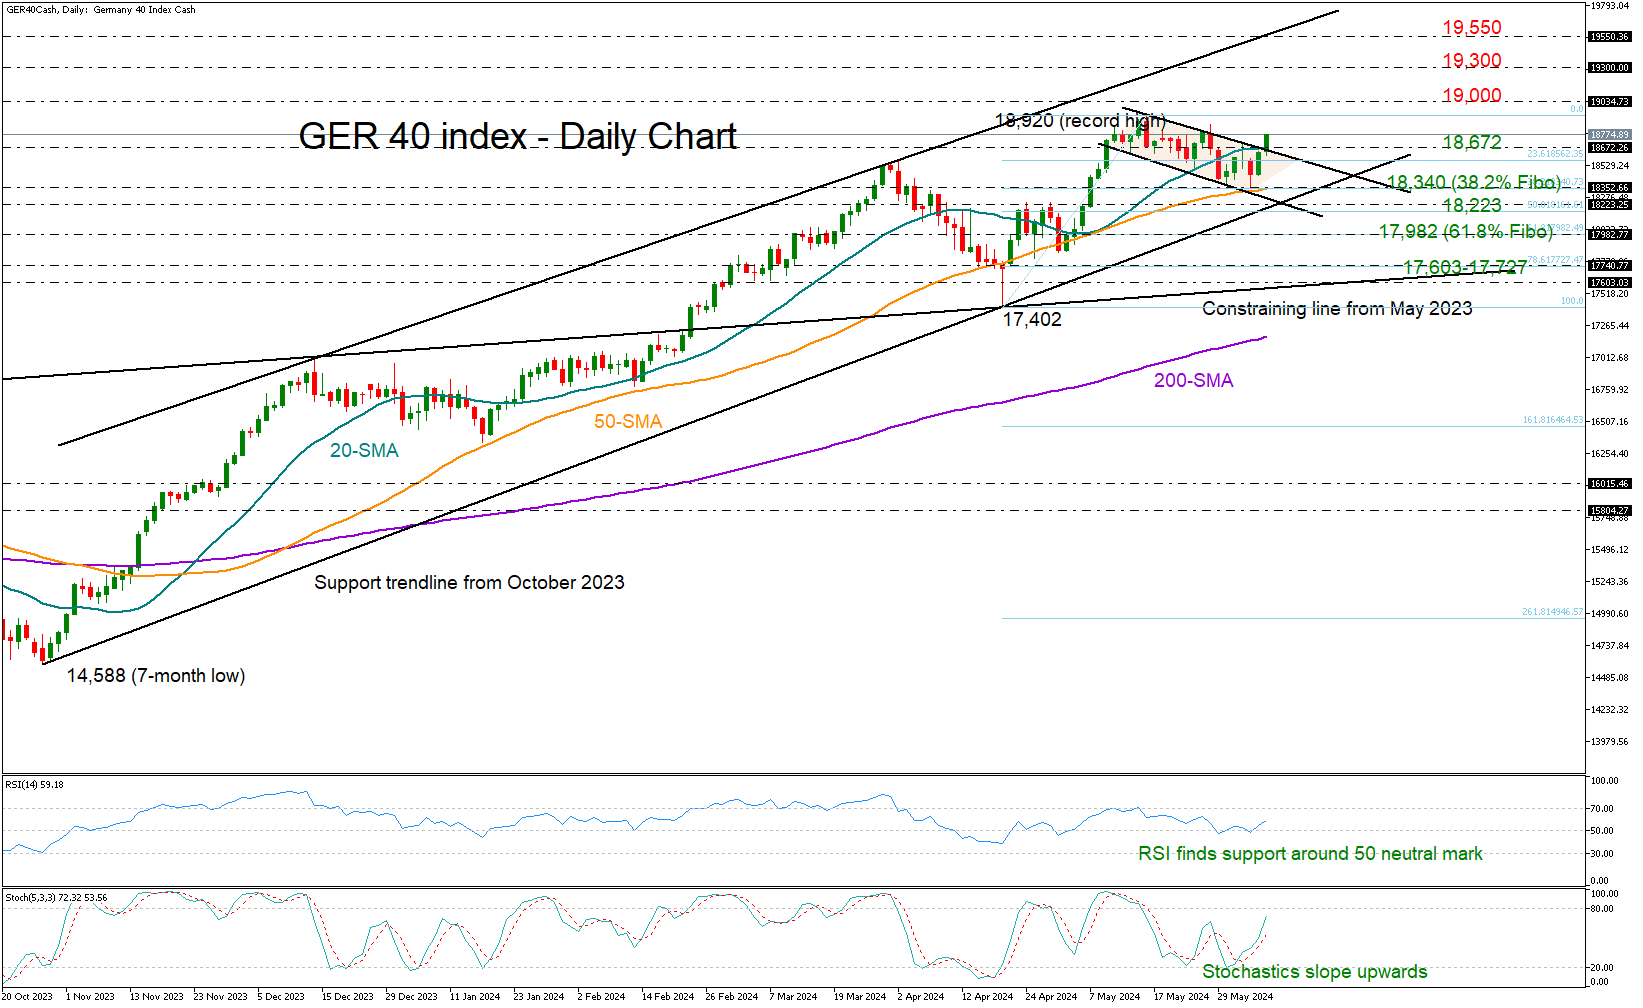
GER 40 Index in Positive Mood Ahead of ECB Rate Decision
- German 40 index strives to exit bearish formation before a widely expected rate cut
- Short-term risk skewed to the upside, but confirmation signal could come above 18,672
The German 40 index started Thursday’s session on a positive note, aiming to extend its latest upturn above its 20-day simple moving average (SMA) and out of the short-term bearish channel at 18,672.
All eyes will be on the ECB policy meeting today and particularly on the central bank’s guidance on future rate cuts as a quarter-point reduction is already priced in. The index could benefit from dovish communication, and from a technical standpoint, the bulls seem to have the wind in their sails. The RSI is sloping upwards again after bottoming out twice around its 50 neutral mark. Likewise, the stochastic oscillator has changed direction to the upside, promoting the current positive action in the market.
The all-time high of 18,920 and the psychological mark of 19,000 could serve as initial obstacles on the upside. Passing through that wall, the index could rise into the 19,265-19,300 area, where the 161.8% Fibonacci extension of the latest downfall is placed. Another victory there could add more fuel to the rally, bringing the all-important resistance trendline from December 2023 at 19,550 under the limelight.
In the opposite case of the price pulling below its 20-day SMA at 18,672, it might again seek support near the 50-day SMA and the 23.6% Fibonacci mark of the April-May upleg around 18,340. A step below that base might not discourage traders unless the decline stretches below 18,223, where the lower band of the bearish channel is currently intersecting the tentative ascending line from October 2023. If that bearish scenario plays out, the index could slump towards the 61.8% Fibonacci of 17,982 or even lower into the 17,600-17,727 zone.
To sum up, the short-term technical picture suggests that the German 40 index might stay positively charged in the coming sessions. A clear close above 18,670 could confirm more gains ahead.
EURGBP Tests a Key Support Area
- EURGBP edges higher today ahead of crucial ECB meeting
- Strong downside pressure in place despite UK elections being in the spotlight
- Momentum indicators are mostly mixed at this juncture
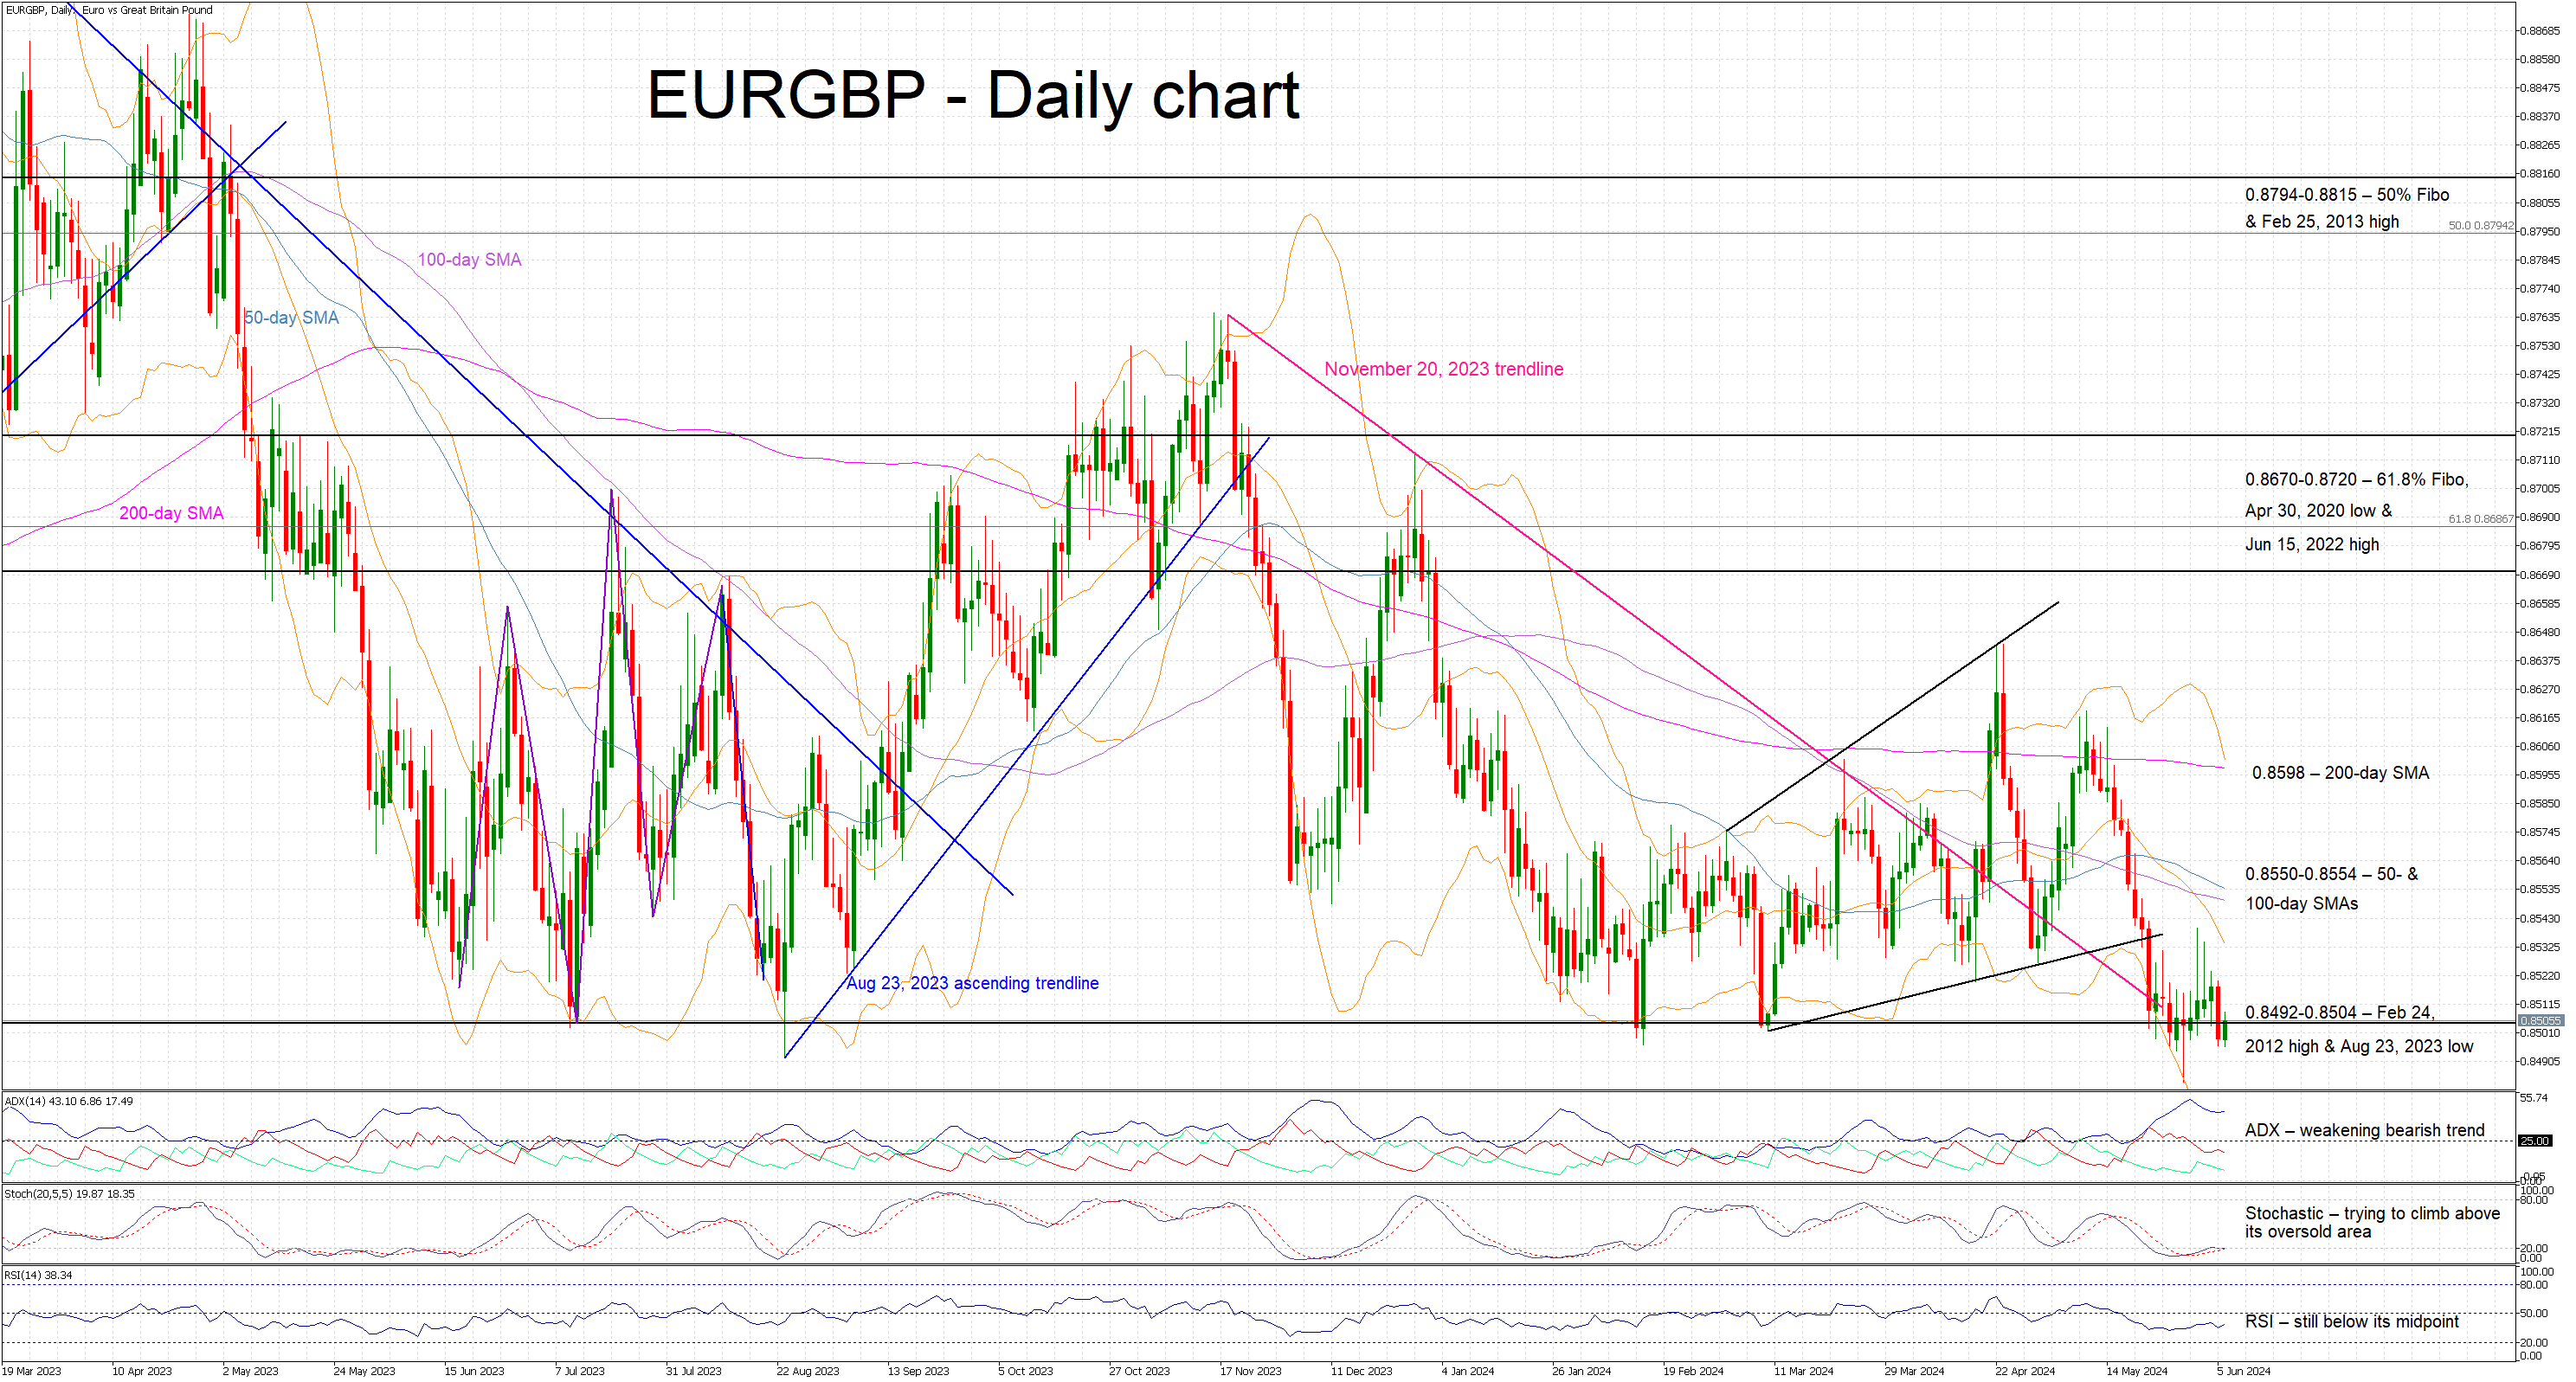
EURGBP is trading higher today, a tad above its lowest level since August 2022, and in an extremely important support area that has repeatedly acted as a floor and put a stop in the bears’ momentum. The market is preparing for the much-awaited ECB meeting that could deliver the first rate from a major central bank later today. The euro has been under severe pressure since mid-April with a slightly odd-shaped double-top structure playing a key role in the current downward trend.
In the meantime, the momentum indicators appear mixed. The Average Directional Movement Index (ADX) remains above its 25-threshold, but it is trading sideways and thus pointing to a weakening bearish trend in EURGBP. Similarly, the RSI is stuck below its 50-midpoint. More importantly, the stochastic oscillator is trying to climb above both its moving average and oversold territory. Should this move take place, it would be seen as a strong bullish signal.
Should the bulls retake control, they could first try to lead EURGBP above the busy 0.8492-0.8504 area, which is defined by the February 24, 2012 high and the August 23, 2023 low. Even higher, the 50- and 100-day simple moving averages (SMAs) at the 0.8550-0.8554 range could prove strong resistance points, with the more important 200-day SMA currently standing a tad higher.
On the flip side, the bears appear determined to keep EURGBP below the 0.8492-0.8504 area and then retest the recent trough at 0.8483. If successful, they could then push EURGBP much lower with the August 4, 2022 low at 0.8339 possibly being the next target.
To sum up, EURGBP remains on the back foot ahead of the ECB with the bears once again trying to decisively break through the strong 0.8492-0.8504 support area.