
Sample Category Title
EUR/GBP Daily Outlook
Daily Pivots: (S1) 0.8516; (P) 0.8540; (R1) 0.8559; More...
Intraday bias in EUR/GBP remains on the downside as fall from 0.8713 is in progress. Current decline is seen as part of the larger down trend. Next target is 0.8491 low, and then 0.8464 projection level. On the upside, above 0.8563 minor resistance will turn intraday bias neutral and bring consolidations again.
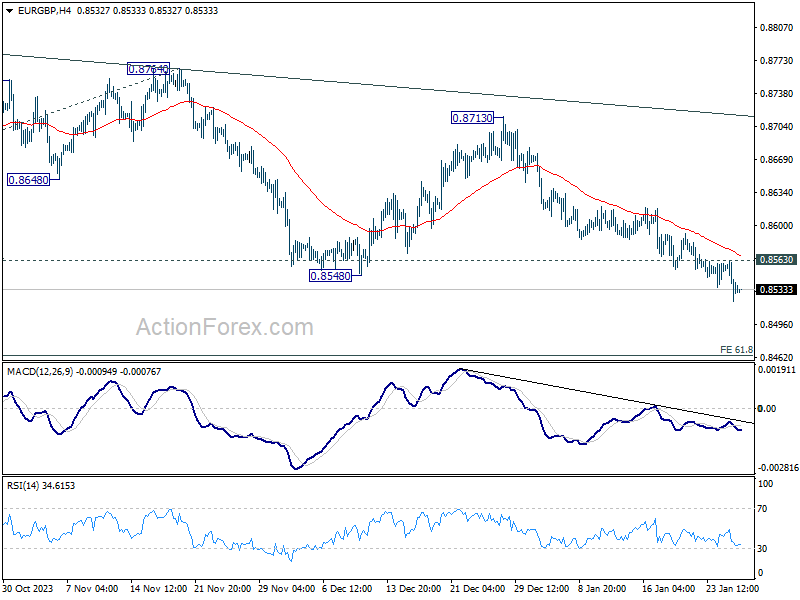
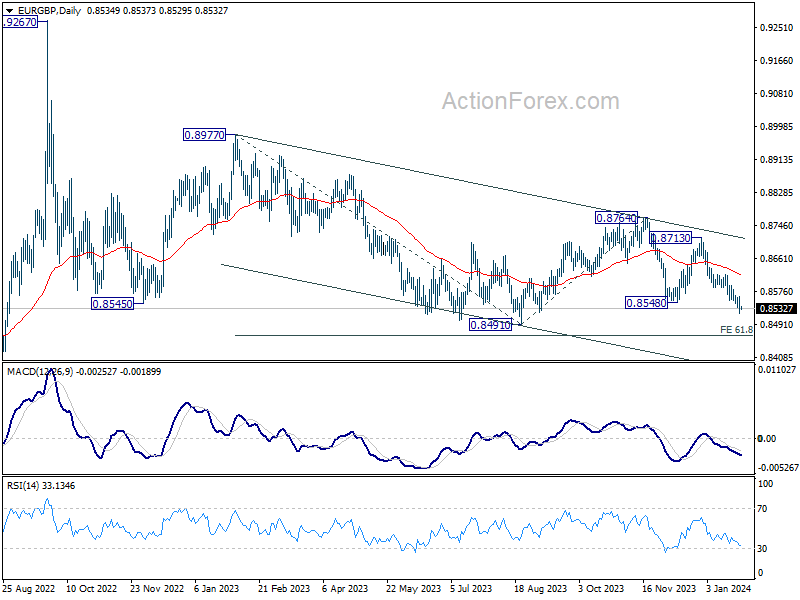
In the bigger picture, fall from 0.8764 is seen as another leg in the whole down trend from 0.9267 (2022 high). Outlook will stay bearish as long as 0.8713 resistance holds. Break of 0.8491 will target 61.8% projection of 0.8977 to 0.8491 from 0.8764 at 0.8464.
Subdued Trading Continues, Euro Falters as Markets Await US PCE Inflation
The subdued trading in the forex markets observed through the week continued in today's Asian session. Despite numerous central bank decisions and key economic data releases, most major currency pairs and crosses are staying within last week's range. Euro, as the worst performer. so far is a notable exception. This lackluster performance seems tied to relatively larger decline in Germany's benchmark yield, which reflects concerns over the region's economic prospects. Yet, selling momentum in the common currency is limited, except versus Sterling.
Meanwhile, Yen, Swiss Franc, and Dollar are leading as the strongest currencies for the week. This may suggest a shift toward risk-averse behavior among investors. However, this interpretation isn't fully supported by global stock market activity; there's a noticeable absence of significant selloffs. Even in China, where stocks have been underperforming globally this year, there has been a rebound following PBoC's decision to cut the reserve requirement ratio to injects liquidity into the market. Commodity currencies are showing slight weakness, though they are performing marginally better than Euro.
The market's attention is now pivoting to the upcoming US PCE inflation data. Expectations are set for headline PCE inflation to remain steady at 2.6% yoy in December, while core PCE is anticipated to slow from 3.2% yoy to 3.0% yoy. Despite the strong US Q4 GDP data released yesterday, the futures market continues to indicate a roughly 52% likelihood of a Fed rate cut in March. The impending inflation data is poised to play a crucial role in either reinforcing or altering these rate cut expectations.
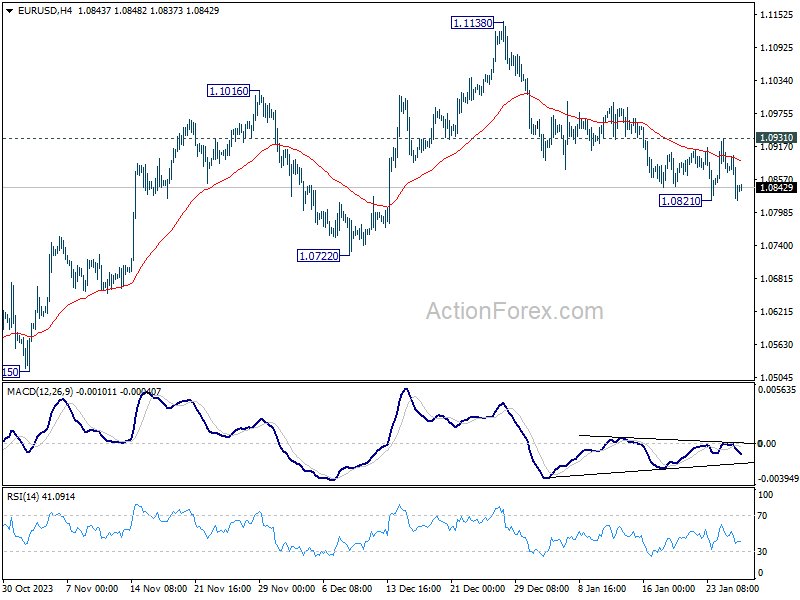
Technically, EUR/USD is now pressing 1.0821 temporary low again as this week's recovery faltered quickly. Break there will resume the fall from 1.1138 to 1.0722 support. More importantly, decisive break of 1.0722 will argue that whole rebound from 1.0447 has completed, and turn near term outlook bearish for retesting this low. Let's see how EUR/USD would react to today's US inflation data.
In Asia, at the time of writing, Nikkei is down -1.39%. Hong Kong HSI is down -0.71%. China Shanghai SSE is down -0.12%. Singapore Strait Times is up 0.41%. Japan 10-year JGB yield is down -0.0369 at 0.713. Overnight, DOW rose 0.64%. S&P 500 rose 0.53%. NASDAQ rose 0.18%. 10-year yield fell -0.046 to 4.132.
Japan's Tokyo CPI slows sharply to 1.6%, raises questions on BoJ's negative rates exit
Japan's Tokyo CPI core (ex-food) slowed significantly from 2.1% yoy to 1.6% yoy in January, below expectation of 1.9% yoy. That's also the lowest rate since March 2022. Additionally, core-core CPI (ex-food and energy) declined from 3.5% yoy to 3.1% yoy, marking a fifth consecutive month of decline. Headline CPI mirrored this trend, falling from 2.4% yoy to 1.6% yoy.
The latest Tokyo CPI data has sparked a debate among economists regarding its influence on BoJ strategy to phase out negative interest rates. While some analysts believe this data won't significantly impact BoJ's plan, anticipating the first rate hike since 2007 in April, others are more cautious. They suggest that the surprising drop in Tokyo inflation might lead BoJ to reconsider or delay the decision.
In parallel, December's corporate services price index remained steady at 2.4% yoy, aligning with the near nine-year high recorded in November.
BoJ's minutes emphasize importance of discussions on exiting negative rates
The minutes from BoJ's meeting on December 18-19 highlighted a focus on strategic discussions regarding the future of its monetary policy. The members agreed on the importance to "deepen discussions" about the "timing of the exit" from the current monetary policy framework and determining the "appropriate pace of raising policy interest rates thereafter." This discussion is closely tied to the evolving dynamics of "wage and price developments."
A key sentiment echoed by many members was the prerequisite for a sustainable and stable achievement of the price stability target before considering the termination of the negative interest rate policy and the yield curve control framework. The establishment of a "virtuous cycle between wages and prices" was reiterated as a necessary condition for these policy shifts.
Additionally, some members expressed the viewpoint that BoJ is "not in a situation where it would fall behind the curve" if it did not rush to raise policy interest rates. This perspective suggests a cautious approach to monetary tightening, implying that the central bank doesn't feel pressured to act hastily in adjusting its interest rate policy.
Looking ahead
Germany Gfk consumer sentiment and Eurozone M3 money supply will be released in European session. Later in the day, US personal income and spending, as well as PCE inflation will be the main focus.
EUR/GBP Daily Outlook
Daily Pivots: (S1) 0.8516; (P) 0.8540; (R1) 0.8559; More...
Intraday bias in EUR/GBP remains on the downside as fall from 0.8713 is in progress. Current decline is seen as part of the larger down trend. Next target is 0.8491 low, and then 0.8464 projection level. On the upside, above 0.8563 minor resistance will turn intraday bias neutral and bring consolidations again.
In the bigger picture, fall from 0.8764 is seen as another leg in the whole down trend from 0.9267 (2022 high). Outlook will stay bearish as long as 0.8713 resistance holds. Break of 0.8491 will target 61.8% projection of 0.8977 to 0.8491 from 0.8764 at 0.8464.
Economic Indicators Update
| GMT | Ccy | Events | Actual | Forecast | Previous | Revised |
|---|---|---|---|---|---|---|
| 23:30 | JPY | Tokyo CPI Y/Y Jan | 1.60% | 2.40% | ||
| 23:30 | JPY | Tokyo CPI ex Fresh Food Y/Y Jan | 1.60% | 1.90% | 2.10% | |
| 23:30 | JPY | Tokyo CPI ex Food & Energy Y/Y Jan | 3.10% | 3.50% | ||
| 23:50 | JPY | Corporate Service Price Index Y/Y Dec | 2.40% | 2.40% | 2.30% | 2.40% |
| 23:50 | JPY | BoJ minutes | ||||
| 00:01 | GBP | GfK Consumer Confidence Jan | -19 | -21 | -22 | |
| 07:00 | EUR | Germany Gfk Consumer Confidence Feb | -24.3 | -25.1 | ||
| 09:00 | EUR | Eurozone M3 Money Supply Y/Y Dec | -0.70% | -0.90% | ||
| 13:30 | USD | Personal Income M/M Dec | 0.30% | 0.40% | ||
| 13:30 | USD | Personal Spending Dec | 0.40% | 0.20% | ||
| 13:30 | USD | PCE Price Index M/M Dec | 0.20% | -0.10% | ||
| 13:30 | USD | PCE Price Index Y/Y Dec | 2.60% | 2.60% | ||
| 13:30 | USD | Core PCE Price Index M/M Dec | 0.20% | 0.10% | ||
| 13:30 | USD | Core PCE Price Index Y/Y Dec | 3.00% | 3.20% | ||
| 15:00 | USD | Pending Home Sales M/M Dec | 1.60% | 0.00% |
Technical Outlook and Review
DXY:
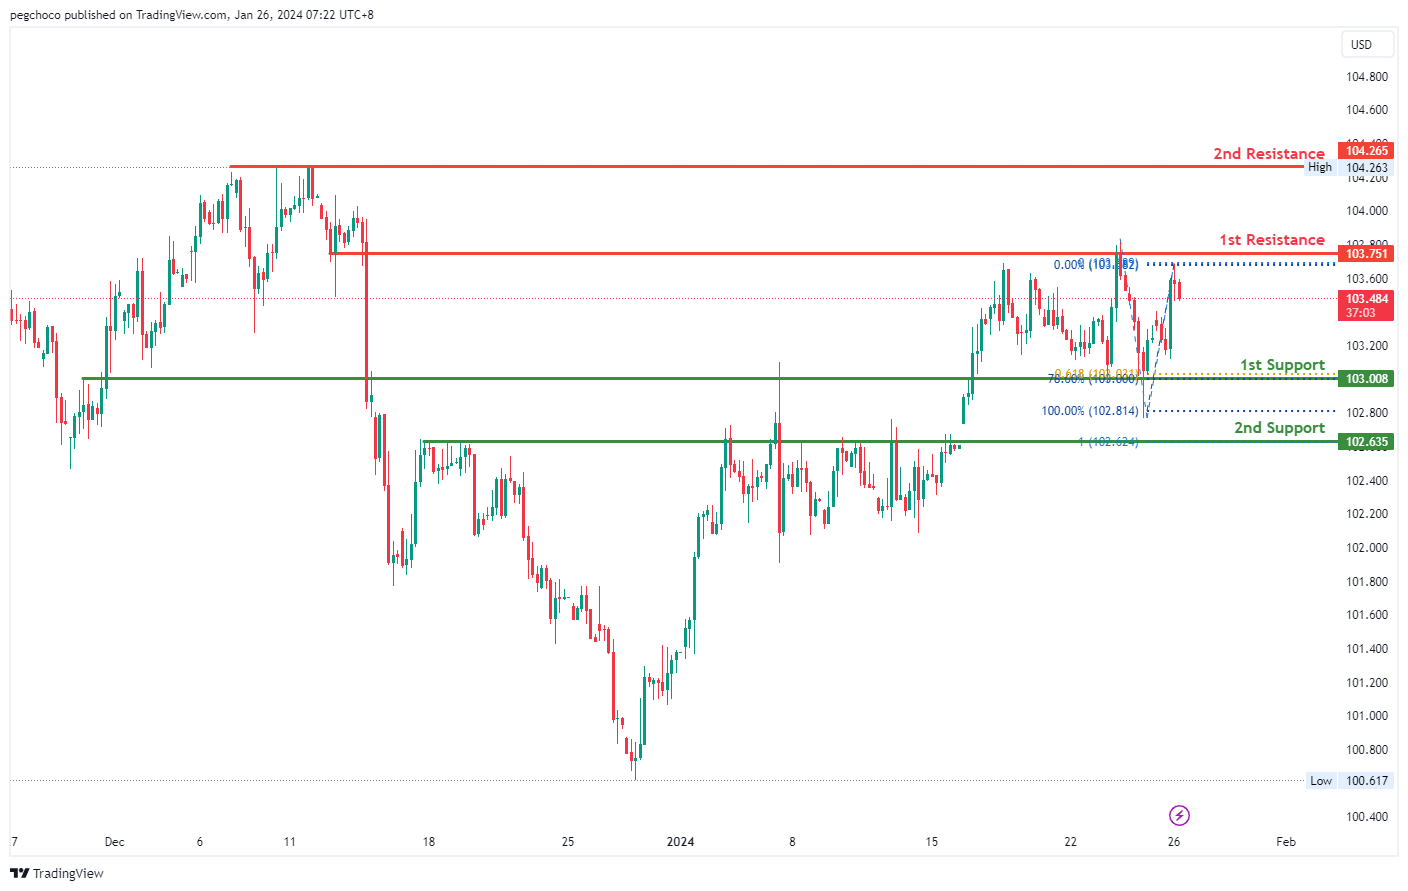
The DXY (US Dollar Currency Index) chart is currently displaying a bearish overall momentum, indicating weakness in the US Dollar. According to your analysis, there is potential for a bearish continuation in the price towards the 1st support level.
The 1st support level at 103.00 is considered significant for several reasons. It represents an overlap support, indicating that this price level has historically acted as both support and resistance. Additionally, it coincides with the 78.60% Fibonacci Retracement level and the 61.80% Fibonacci Projection, indicating Fibonacci confluence. This confluence of Fibonacci levels adds significant strength to this support zone, suggesting it may serve as a strong area where price could potentially find support during a bearish move.
The 2nd support level at 102.63 is identified as a pullback support and also coincides with the 100% Fibonacci Projection, further reinforcing its importance as a potential support level during price pullbacks.
On the resistance side, the 1st resistance level at 103.75 is recognized as an overlap resistance, indicating that this price level has historically served as both support and resistance. This makes it a potential barrier where selling pressure could emerge.
The 2nd resistance level at 104.26 is categorized as a multi-swing high resistance, indicating that it represents a historical point where the price has encountered resistance and potential selling interest.
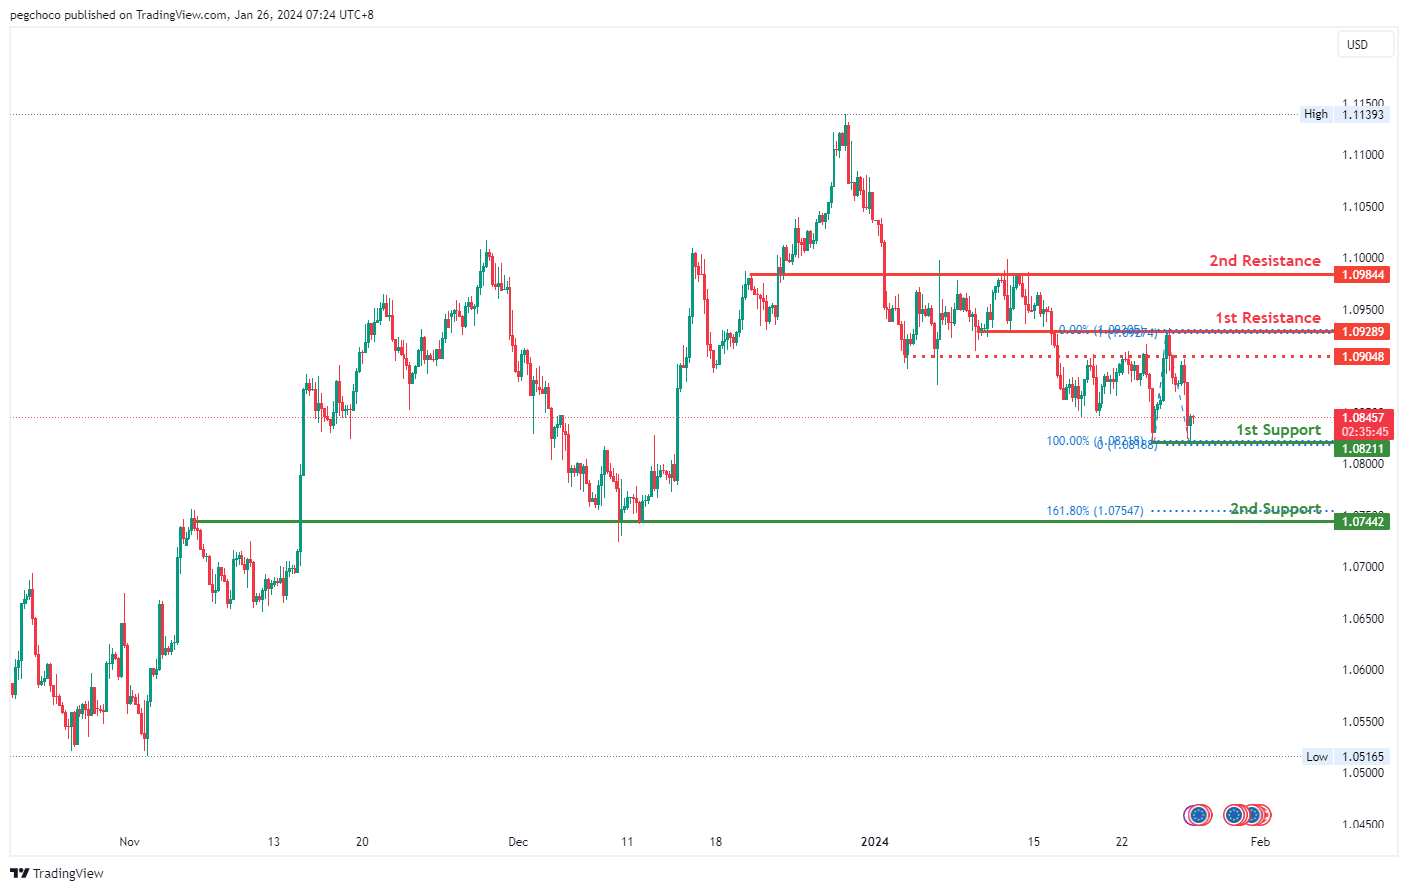
EUR/USD:
The EUR/USD trading pair is currently exhibiting a bullish overall momentum, indicating strength in the Euro relative to the US Dollar. Your analysis suggests that there is potential for a bullish continuation in the price towards the 1st resistance level.
The 1st support level at 1.0821 is considered significant for several reasons. It represents a swing low support and coincides with the 100% Fibonacci Projection, indicating that this level corresponds to a previous significant low point on the chart and that Fibonacci confluence adds to its importance as a potential support level.
The 2nd support level at 1.0744 is identified as an overlap support and also aligns with the 161.80% Fibonacci Extension level, further reinforcing its significance as a support zone.
On the resistance side, the 1st resistance level at 1.0928 is recognized as an overlap resistance, indicating that this price level has historically served as both support and resistance. This makes it a potential barrier where selling pressure could emerge.
The 2nd resistance level at 1.0984 is also identified as an overlap resistance, emphasizing its historical significance as a potential barrier for further upward price movement.
Additionally, there is an intermediate resistance level at 1.0904, characterized as an overlap resistance. This further supports the idea of potential resistance at this level.
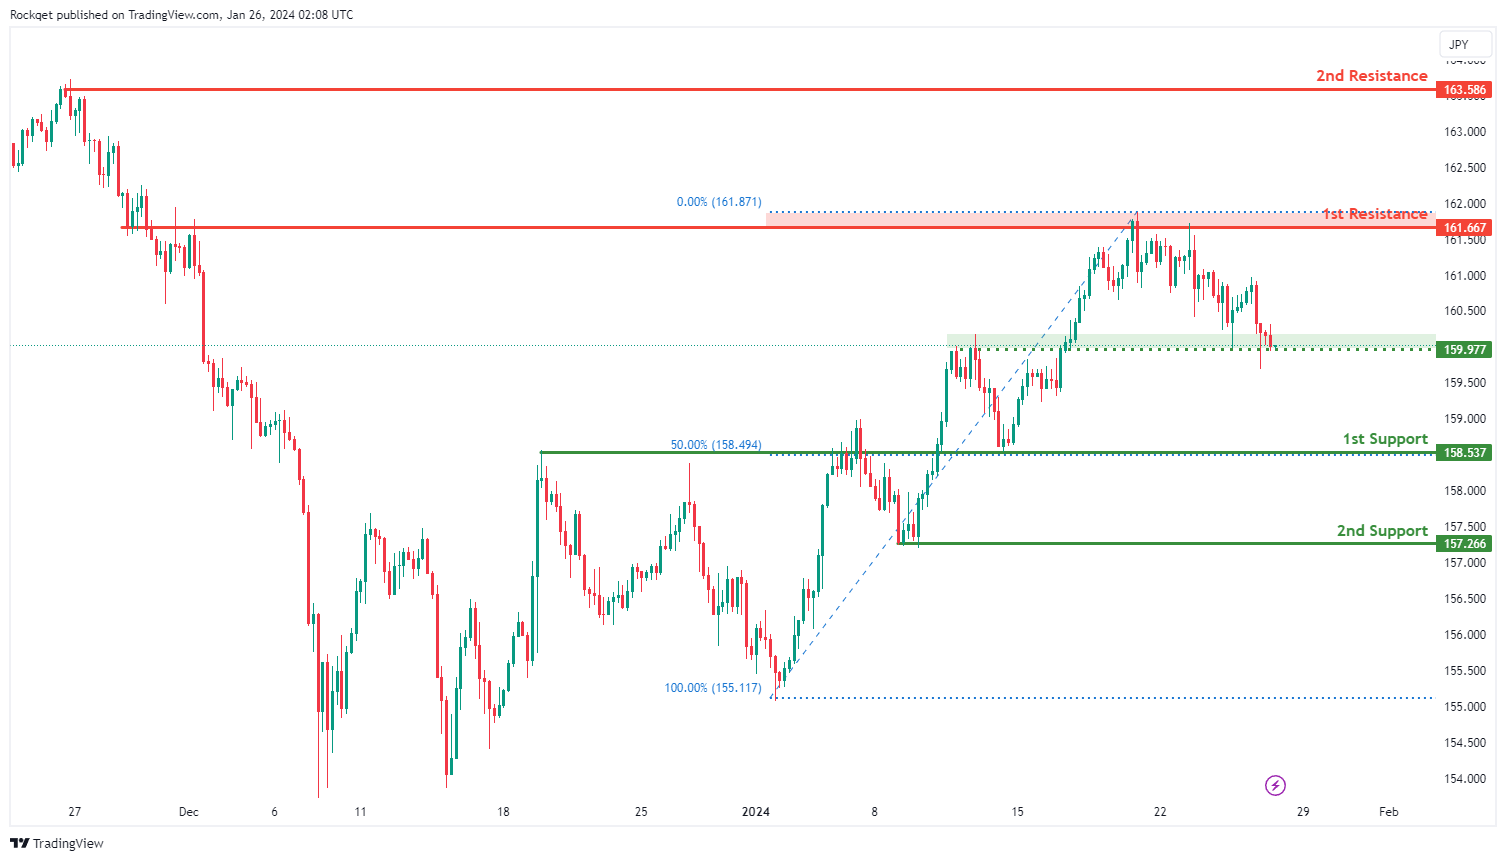
EUR/JPY:
The EUR/JPY chart currently demonstrates a bearish overall momentum, indicating a prevailing downward trend. Several factors contribute to this bearish sentiment, suggesting a potential continuation of the downward movement in the price.
The 1st support at 158.537 is considered favorable due to its identification as an overlap support and alignment with the 50% Fibonacci Retracement. This level indicates historical significance, suggesting a strong level of support.
Additionally, the 2nd support at 157.266 is recognized as a pullback support, providing additional strength to the support zone.
In addition, there is an intermediate support at 159.27, which is considered an overlap support. This level further reinforces the potential support zone.
On the resistance side, the 1st resistance at 161.667 is highlighted as an overlap resistance, indicating a historical level where selling interest may emerge.
Furthermore, the 2nd resistance at 163.586 is acknowledged as a swing high resistance, adding to the potential resistance levels.
EUR/GBP:
The EUR/GBP chart currently exhibits a bearish overall momentum, indicating a prevailing downward trend. Several factors contribute to this bearish sentiment, suggesting a potential continuation of the downward movement in the price.
The 1st support at 0.85306 is considered favorable for its identification as a pullback support, indicating a historical level where buying interest has previously emerged.
Additionally, the 2nd support at 0.85146 is recognized as a swing low support, providing additional strength to the potential support zone. This support level also coincides with the 127.20% Fibonacci Extension, adding confluence to its significance.
On the resistance side, the 1st resistance at 0.85565 is highlighted as an overlap resistance, indicating a historical level where selling interest may emerge.
Furthermore, the 2nd resistance at 0.85889 is acknowledged as another overlap resistance, adding additional significance to this potential resistance level.

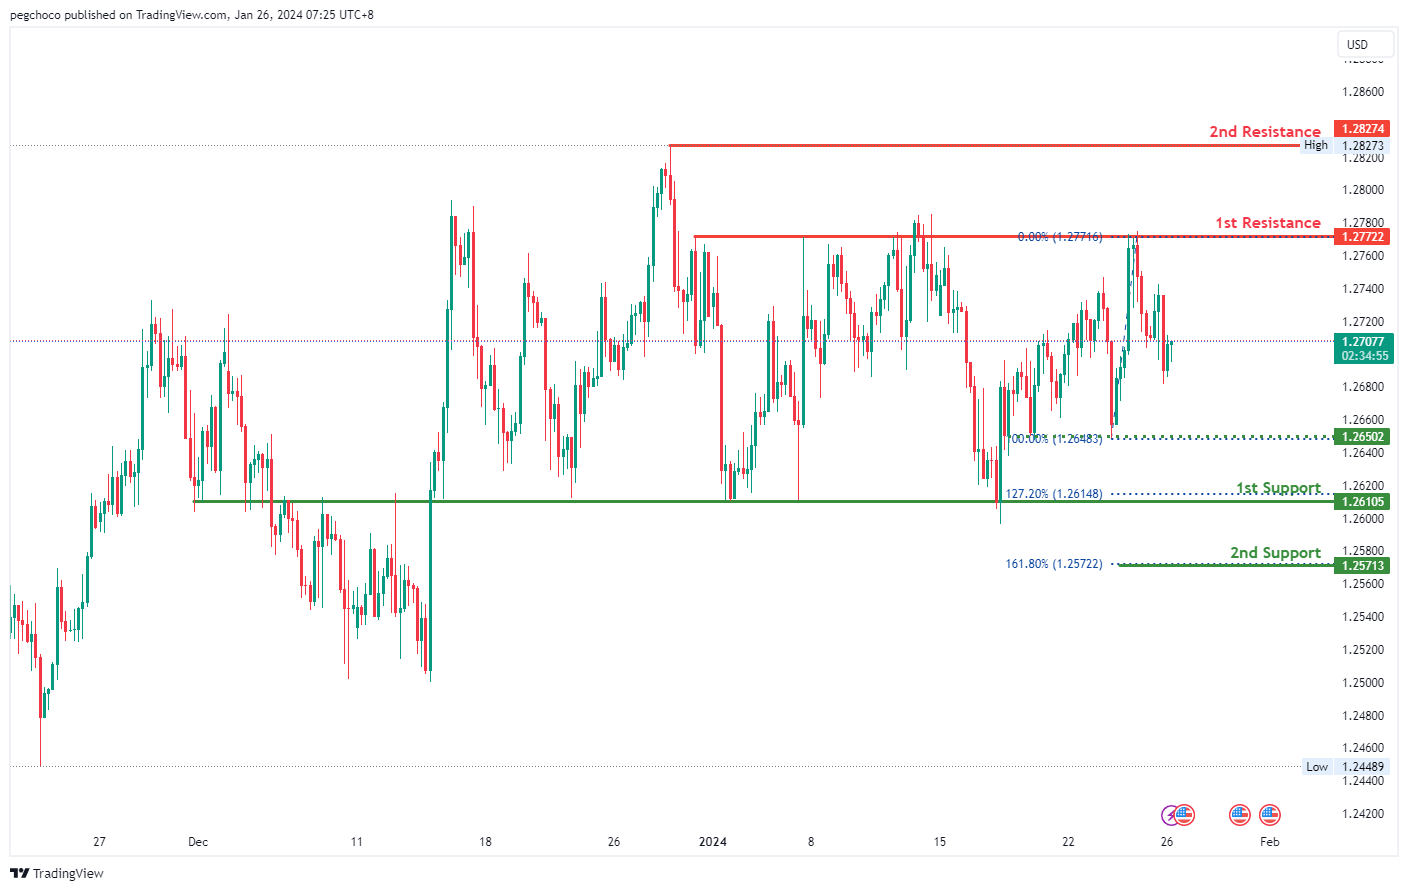
GBP/USD:
The GBP/USD trading pair currently has a bearish overall momentum, indicating weakness in the British Pound relative to the US Dollar. Your analysis suggests that there is potential for a bearish continuation in the price towards the 1st support level.
The 1st support level at 1.2610 is considered significant for several reasons. It represents an overlap support and coincides with the 127.20% Fibonacci Extension level, indicating that this level corresponds to a previous significant level on the chart, and the Fibonacci confluence adds to its importance as a potential support level during a bearish move.
The 2nd support level at 1.2571 is identified as a support level and aligns with the 161.80% Fibonacci Extension level, further reinforcing its significance as a support zone.
On the resistance side, the 1st resistance level at 1.2772 is recognized as a multi-swing high resistance, indicating that it represents a historical point where the price has encountered resistance and potential selling interest.
The 2nd resistance level at 1.2827 is categorized as a swing high resistance, suggesting that it represents a historical point where the price has encountered resistance.
Additionally, there is an intermediate support level at 1.2650, characterized as a multi-swing low support, which may act as a minor support area during the bearish move.
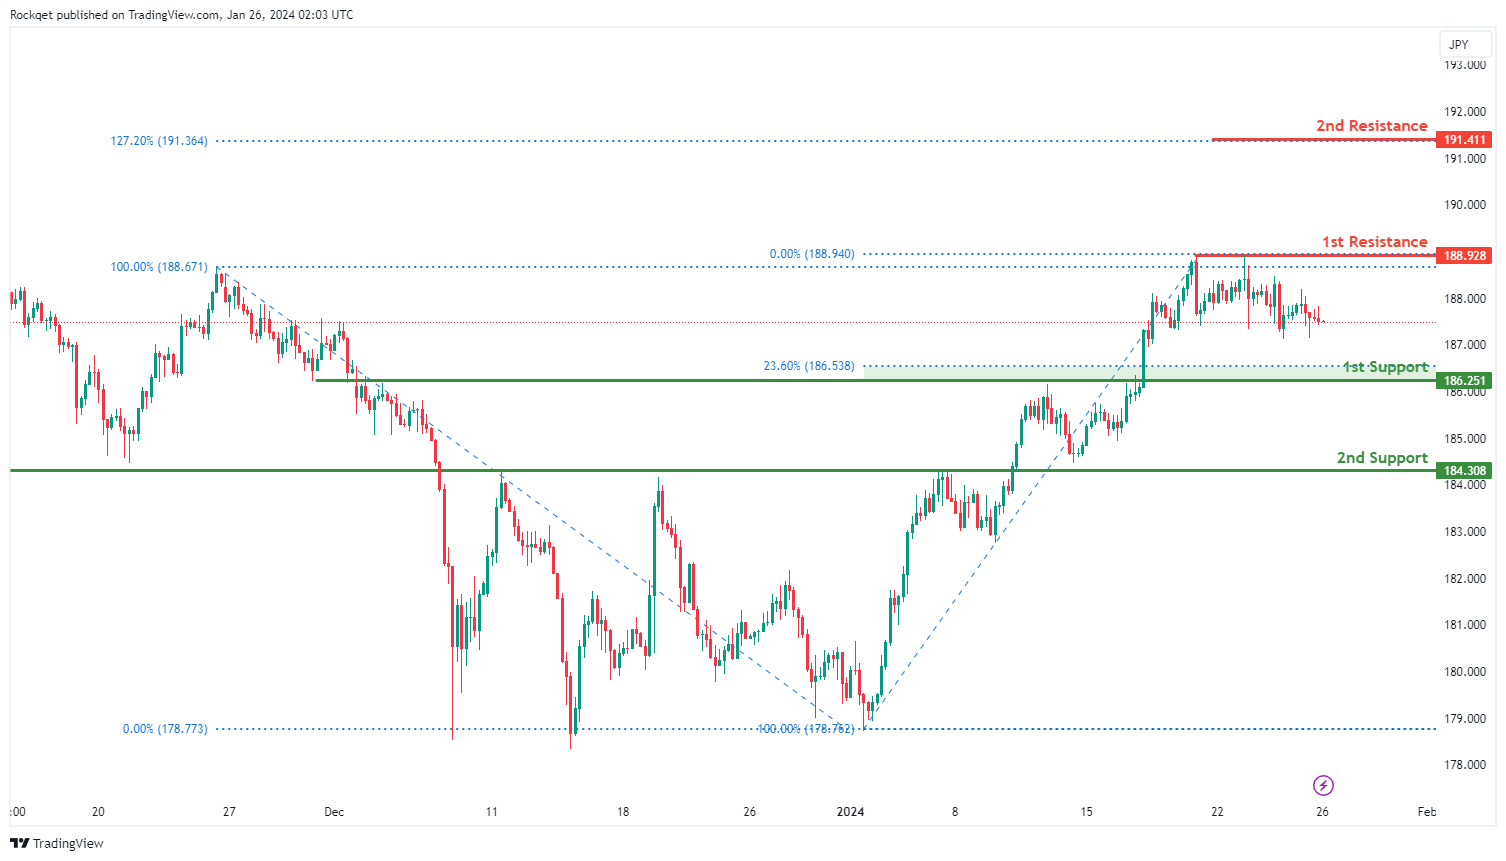
GBP/JPY:
The GBP/JPY chart currently reflects a neutral overall momentum, indicating a lack of a clear trend direction. Several factors contribute to this neutral stance, suggesting potential fluctuations in the price between identified support and resistance levels.
The 1st support at 186.251 is considered favorable due to its identification as an overlap support and alignment with the 23.60% Fibonacci Retracement. This level represents a historical point where buying interest has previously emerged.
Additionally, the 2nd support at 184.308 is recognized as a pullback support, providing additional strength to the support zone.
On the resistance side, the 1st resistance at 188.928 is highlighted as a swing high resistance, indicating a historical level where selling interest may emerge.
Furthermore, the 2nd resistance at 191.411 is acknowledged as a level where the price might encounter resistance, given the 127% Fibonacci Extension.
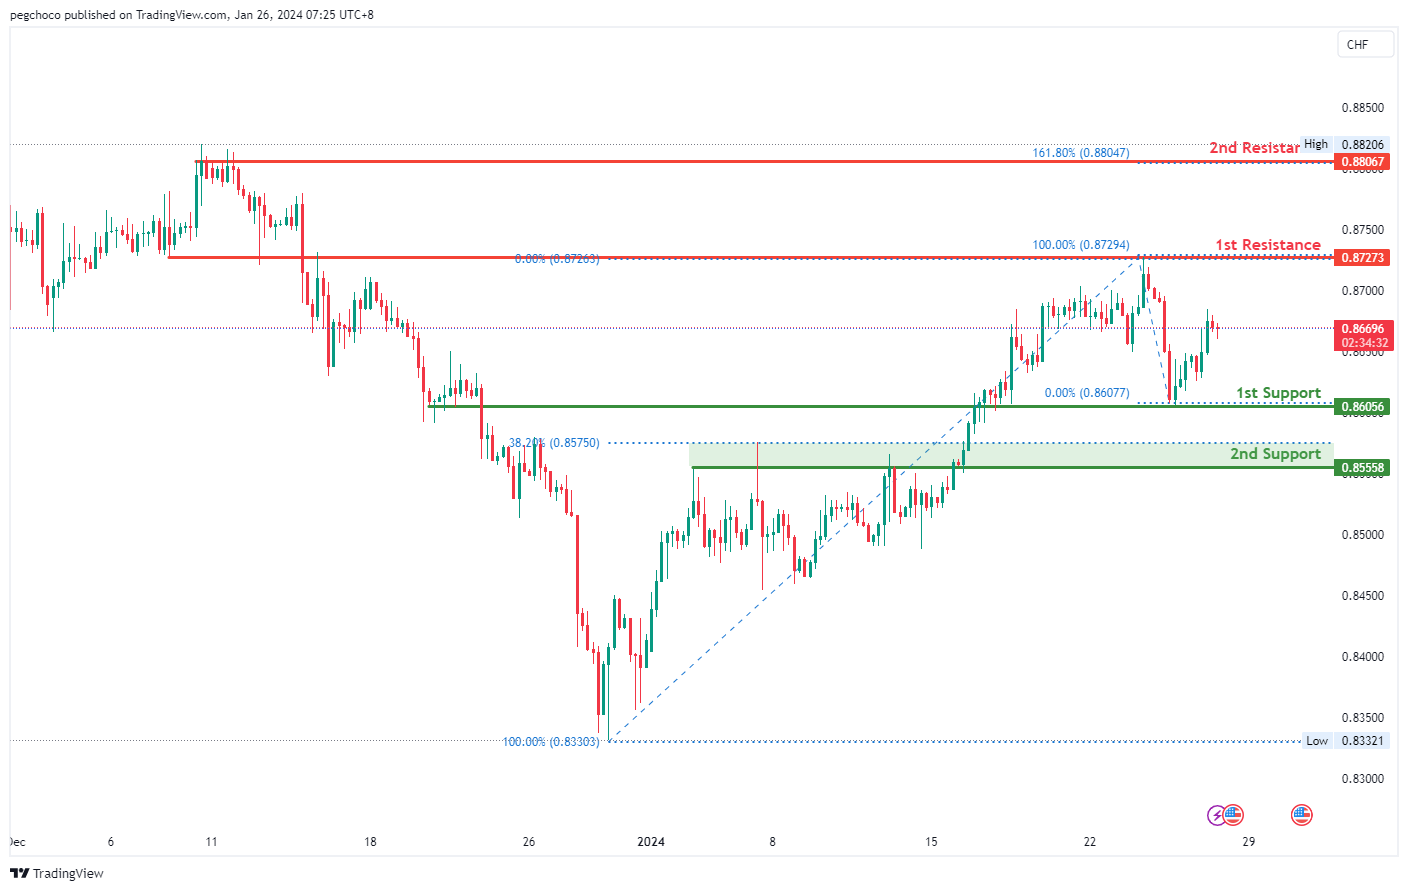
USD/CHF:
The USD/CHF trading pair currently exhibits a bullish overall momentum, indicating strength in the US Dollar relative to the Swiss Franc. Your analysis suggests that there is potential for a bullish continuation in the price towards the 1st resistance level.
The 1st support level at 0.8605 is considered significant as it represents an overlap support, indicating that this price level has historically acted as both support and resistance. This suggests that it may serve as a strong area where price could potentially find support during a bullish move.
The 2nd support level at 0.8555 is identified as a pullback support and also coincides with the 38.20% Fibonacci Retracement level. This confluence of factors adds further significance to this support zone, implying that it may act as a notable support level during price pullbacks.
On the resistance side, the 1st resistance level at 0.8727 is recognized as an overlap resistance, indicating that this price level has historically served as both support and resistance. This makes it a potential barrier where selling pressure could emerge.
The 2nd resistance level at 0.8806 is categorized as a multi-swing high resistance, indicating that it represents a historical point where the price has encountered resistance and potential selling interest.
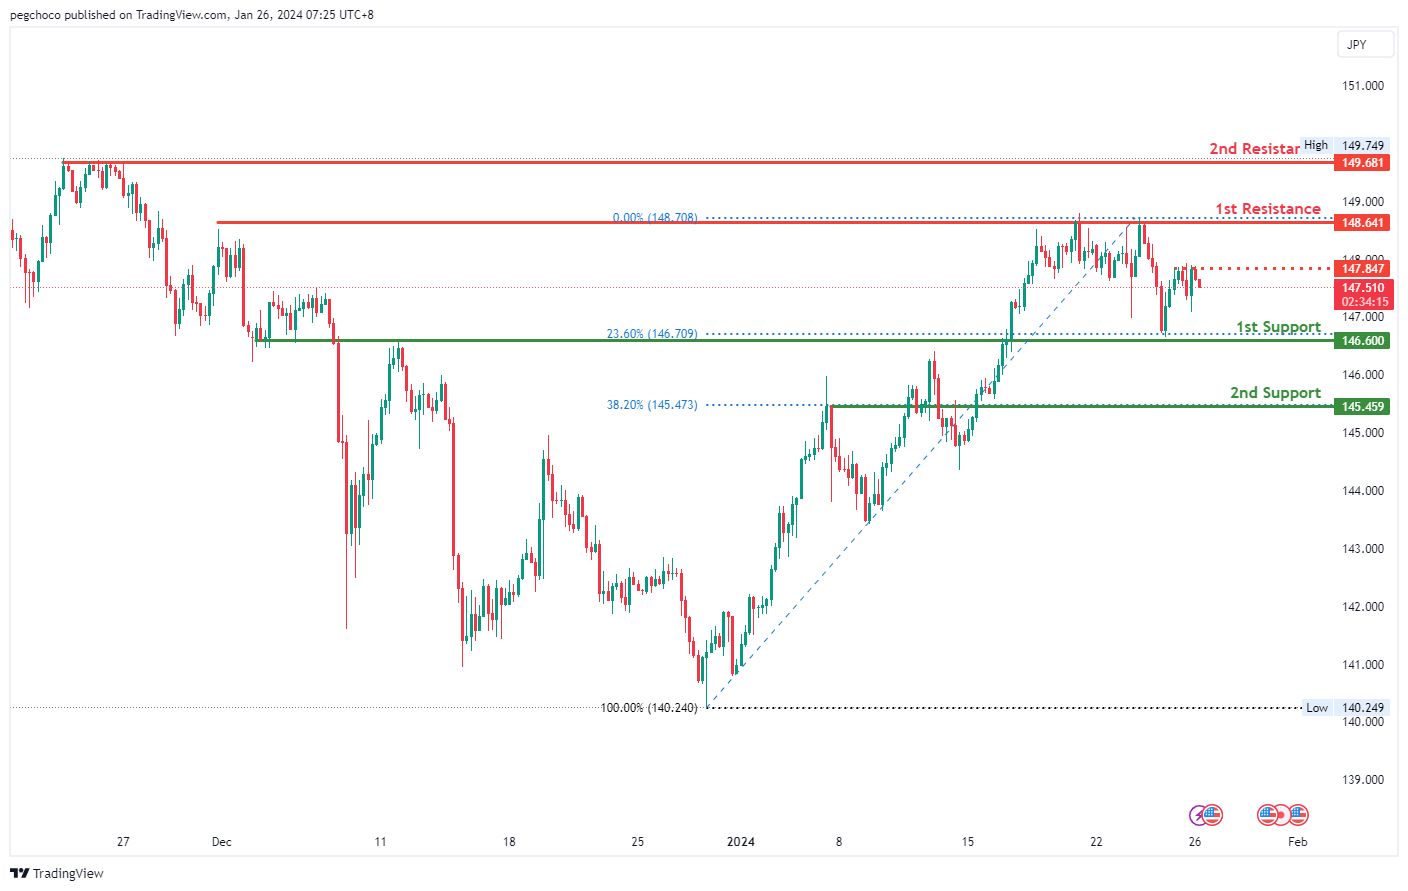
USD/JPY:
The USD/JPY trading pair currently has a bearish overall momentum, indicating weakness in the US Dollar relative to the Japanese Yen. Your analysis suggests that there is potential for a bearish continuation in the price towards the 1st support level.
The 1st support level at 146.50 is considered significant for several reasons. It represents an overlap support and coincides with the 23.60% Fibonacci Retracement level, indicating that this level corresponds to a previous significant low point on the chart, and the Fibonacci confluence adds to its importance as a potential support level during a bearish move.
The 2nd support level at 144.45 is identified as an overlap support and aligns with the 38.20% Fibonacci Retracement level, further reinforcing its significance as a support zone.
On the resistance side, the 1st resistance level at 148.64 is recognized as a multi-swing high resistance, indicating that it represents a historical point where the price has encountered resistance and potential selling interest.
The 2nd resistance level at 149.68 is categorized as a multi-swing high resistance, emphasizing its historical significance as a potential barrier for further upward price movement.
Additionally, there is an intermediate resistance level at 147.84, characterized as a multi-swing high resistance, which may act as a minor resistance area during the bearish move.
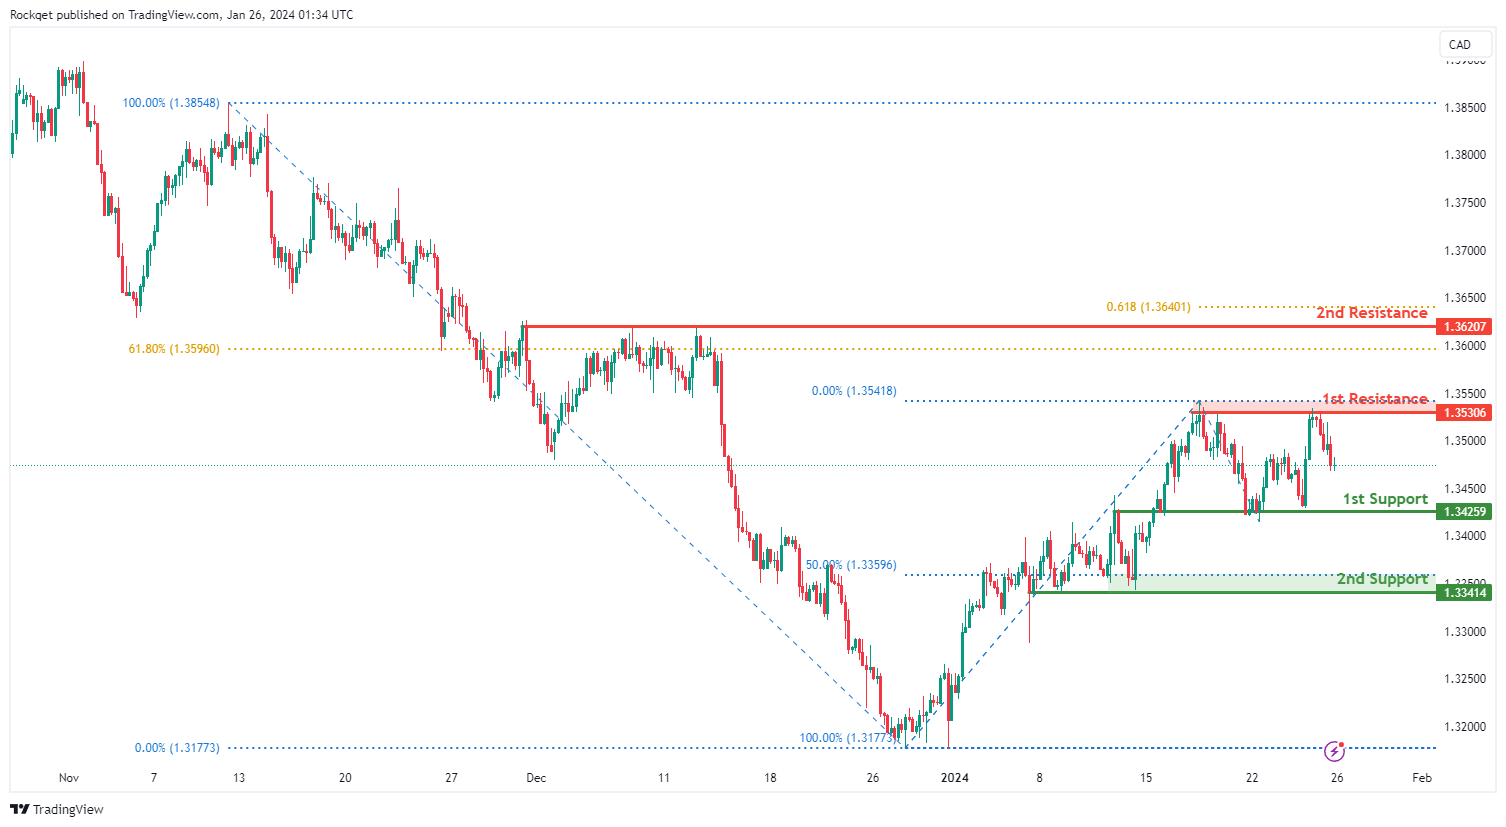
USD/CAD:
The USD/CAD chart currently exhibits a neutral bias. In this context, there is a potential scenario for price to fluctuate between the 1st support and the 1st resistance.
The 1st support level at 1.3425 is identified as an overlap support. Further below, the 2nd support level at 1.3341 is marked as a pullback support that aligns close to the 50.00% Fibonacci retracement level, further reinforcing its importance as a key support level.
To the upside, the 1st resistance level at 1.3530 is identified as a pullback resistance. Higher up, the 2nd resistance level at 1.3620 is also noted as a pullback resistance that aligns close to a confluence of Fibonacci levels i.e. the 61.80% retracement and the 61.80% projection, further reinforcing its significance as a potential resistance zone.
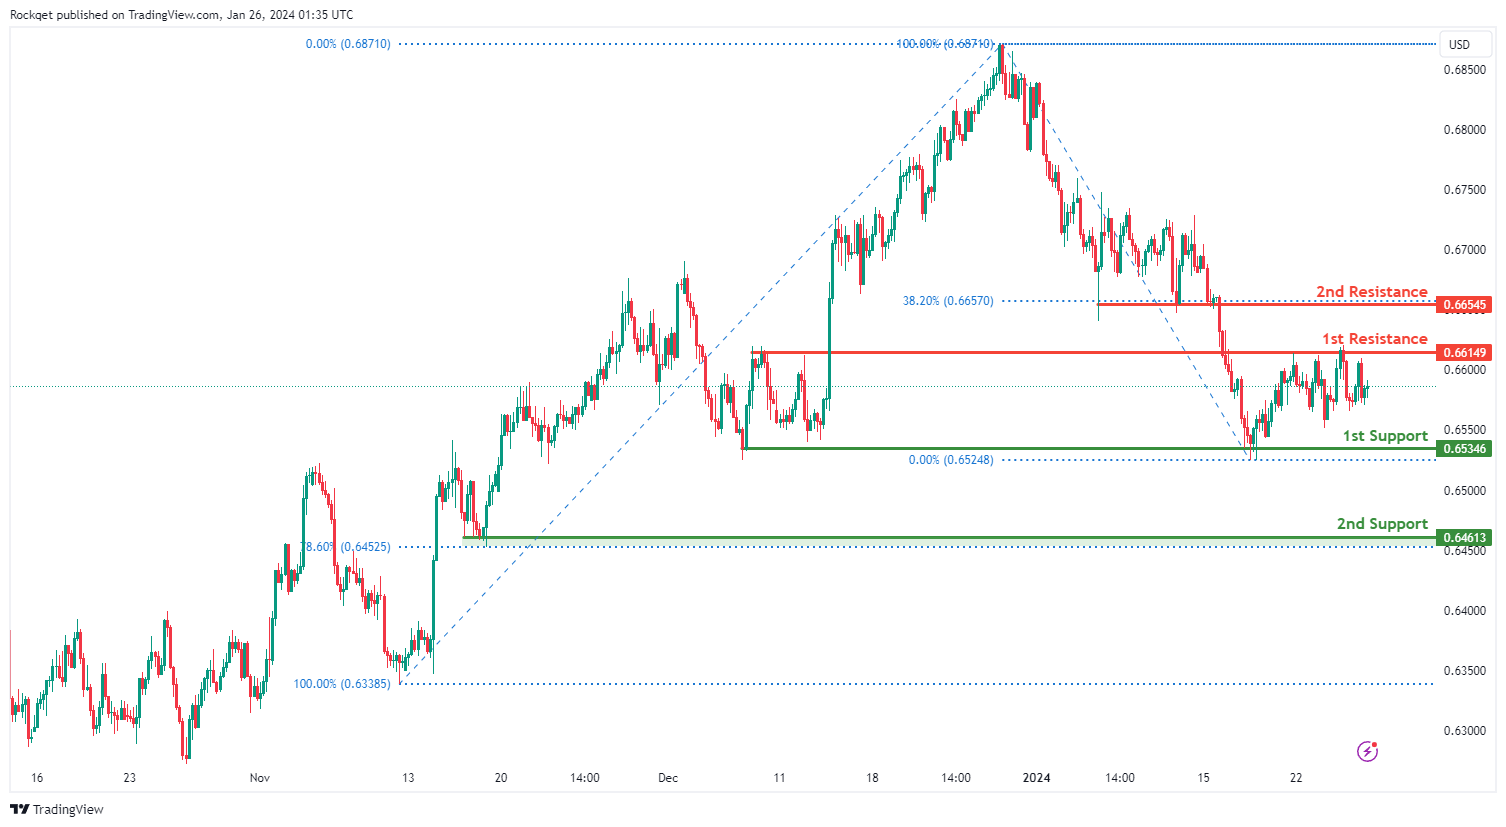
AUD/USD:
The AUD/USD chart currently exhibits a neutral bias. In this context, there is a potential scenario for price to fluctuate between the 1st support and the 1st resistance.
The 1st resistance level at 0.6614 is identified as a pullback resistance. Higher up, the 2nd resistance level at 0.6654 is also noted as a pullback resistance that aligns with the 38.20% Fibonacci retracement level, suggesting a potential barrier for further upside movement.
To the downside, the 1st support level at 0.6534 is identified as a pullback support. Further below, the 2nd support level at 0.6461 is also marked as a pullback support that aligns close to the 78.60% Fibonacci retracement level, further reinforcing its importance as a key support level.
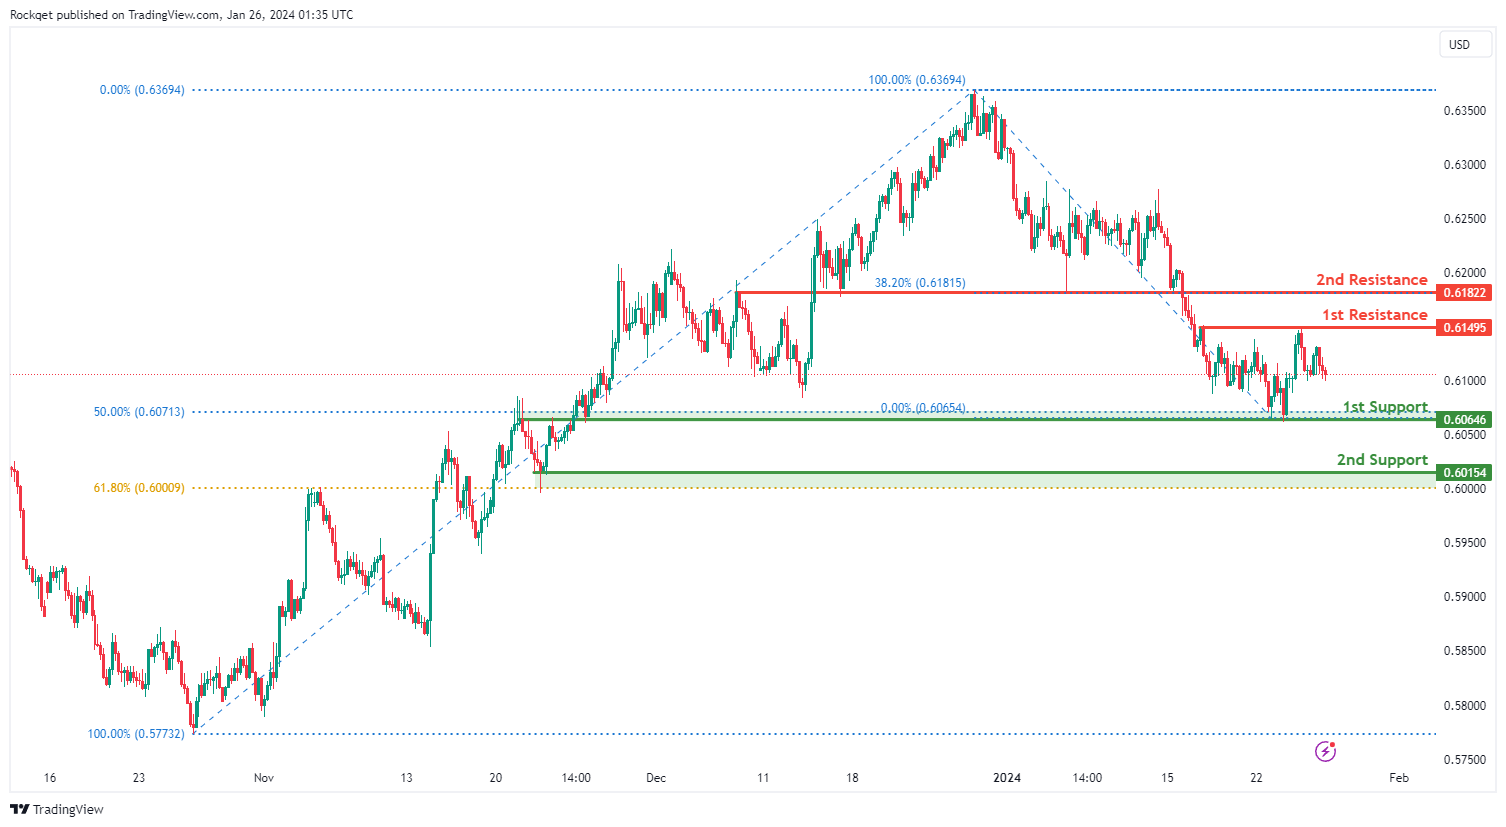
NZD/USD
The NZD/USD chart currently exhibits a neutral bias. In this context, there is a potential scenario for price to fluctuate between the 1st support and the 1st resistance.
The 1st resistance level at 0.6149 is identified as a pullback resistance. Higher up, the 2nd resistance level at 0.6182 is noted as an overlap resistance that aligns with the 38.20% Fibonacci retracement level, suggesting a potential barrier for further upside movement.
To the downside, the 1st support level at 0.6064 is identified as an overlap support that aligns close to the 50.00% Fibonacci retracement level. Further below, the 2nd support level at 0.6015 is marked as a pullback support that aligns close to the 61.80% Fibonacci retracement level, further reinforcing its importance as a key support level.
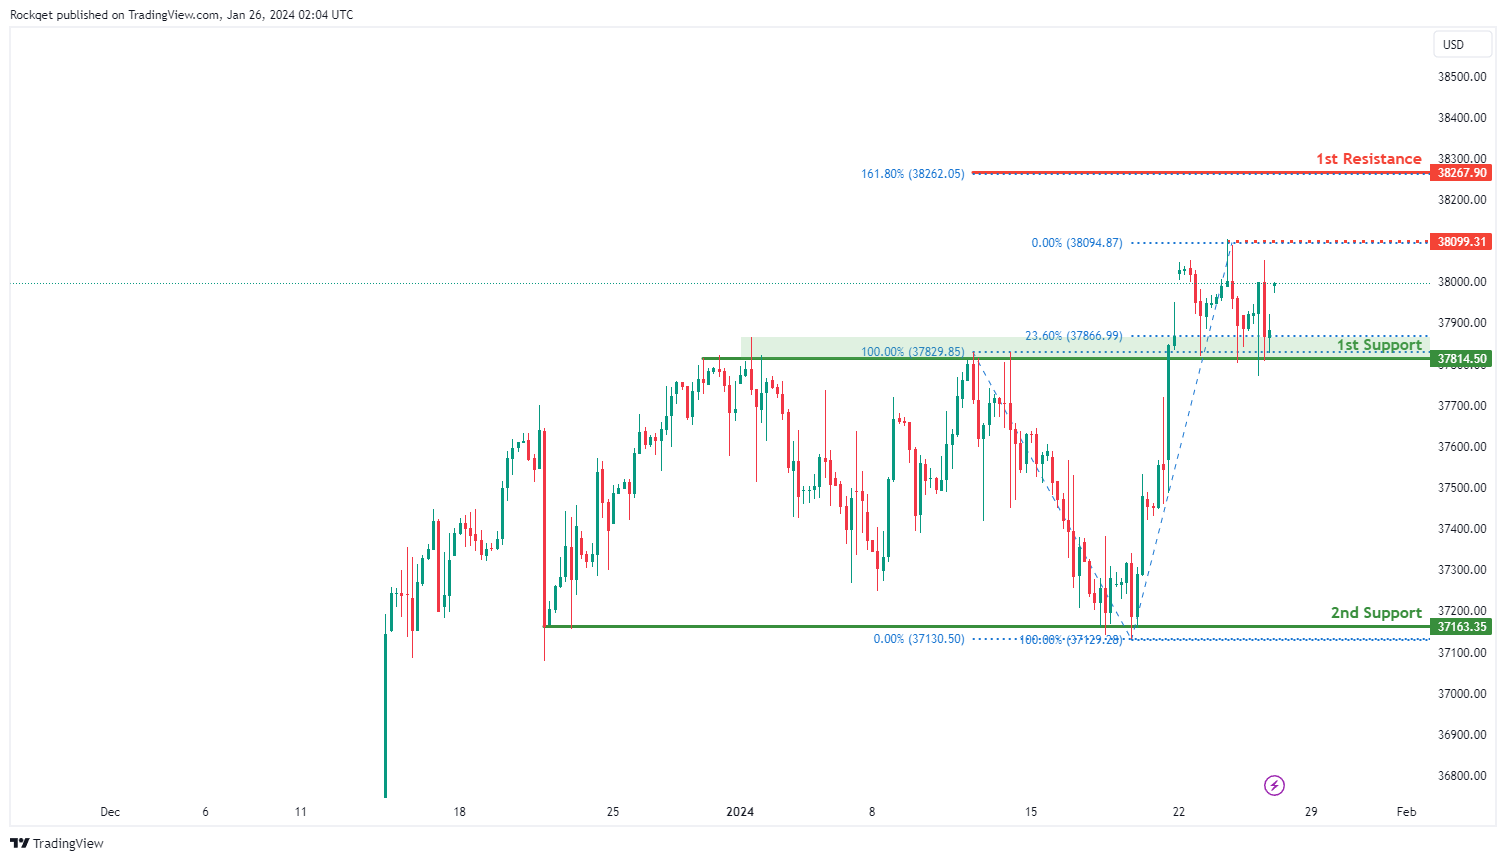
DJ30:
The DJ30 (Dow Jones Industrial Average) chart currently exhibits neutral overall momentum, indicating a lack of a clear trend direction. Several factors contribute to this neutral stance, suggesting potential fluctuations in the price between identified support and resistance levels.
The 1st support at 37814.50 is considered favorable for several reasons. Firstly, it is identified as an overlap support, representing a historical level where buying interest has previously emerged. Additionally, this support level coincides with the 23.60% Fibonacci Retracement, further strengthening its significance.
The 2nd support at 37163.35 is recognized as a multi-swing low support, providing additional reinforcement to the potential support zone.
On the resistance side, the intermediate resistance at 38099.31 is highlighted as a level where swing high resistance is observed. This level may pose a challenge to the bearish momentum.
Furthermore, the 1st resistance at 38267.90 is identified as the 161.80% Fibonacci Extension, adding confluence to its potential as a resistance level.
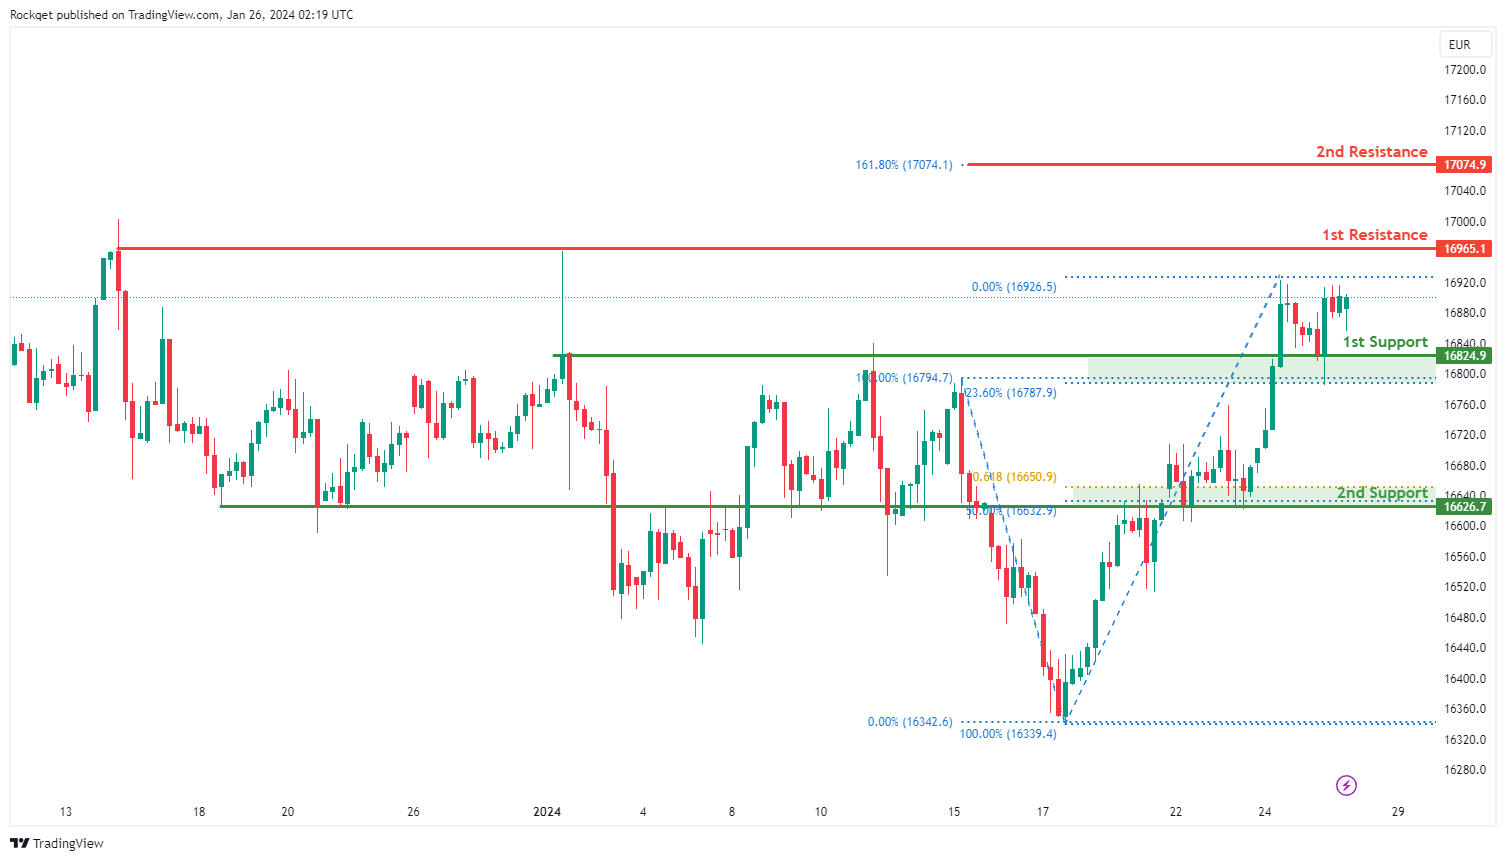
GER40:
The GER40 (DAX) chart currently exhibits a a bullish overall momentum, indicating a prevailing upward trend. Several factors contribute to this bullish momentum, suggesting potential upward movement in the price.
The 1st support at 16824.9 is considered favorable for several reasons. Firstly, it is identified as a pullback support, indicating a historical level where buying interest has previously emerged. Additionally, this support level aligns with the 23.60% Fibonacci Retracement, adding confluence to its significance.
The 2nd support at 16626.7 is recognized as a multi-swing low support, providing additional strength to the potential support zone. Furthermore, it coincides with the 50% Fibonacci Retracement and the 61.80% Fibonacci Projection, further reinforcing its importance.
On the resistance side, the 1st resistance at 16965.1 is highlighted as a swing high resistance, indicating a historical level where selling interest may emerge.
Additionally, the 2nd resistance at 17074.9 is acknowledged as a level where the price might encounter resistance, given the 161.80% Fibonacci Retracement.
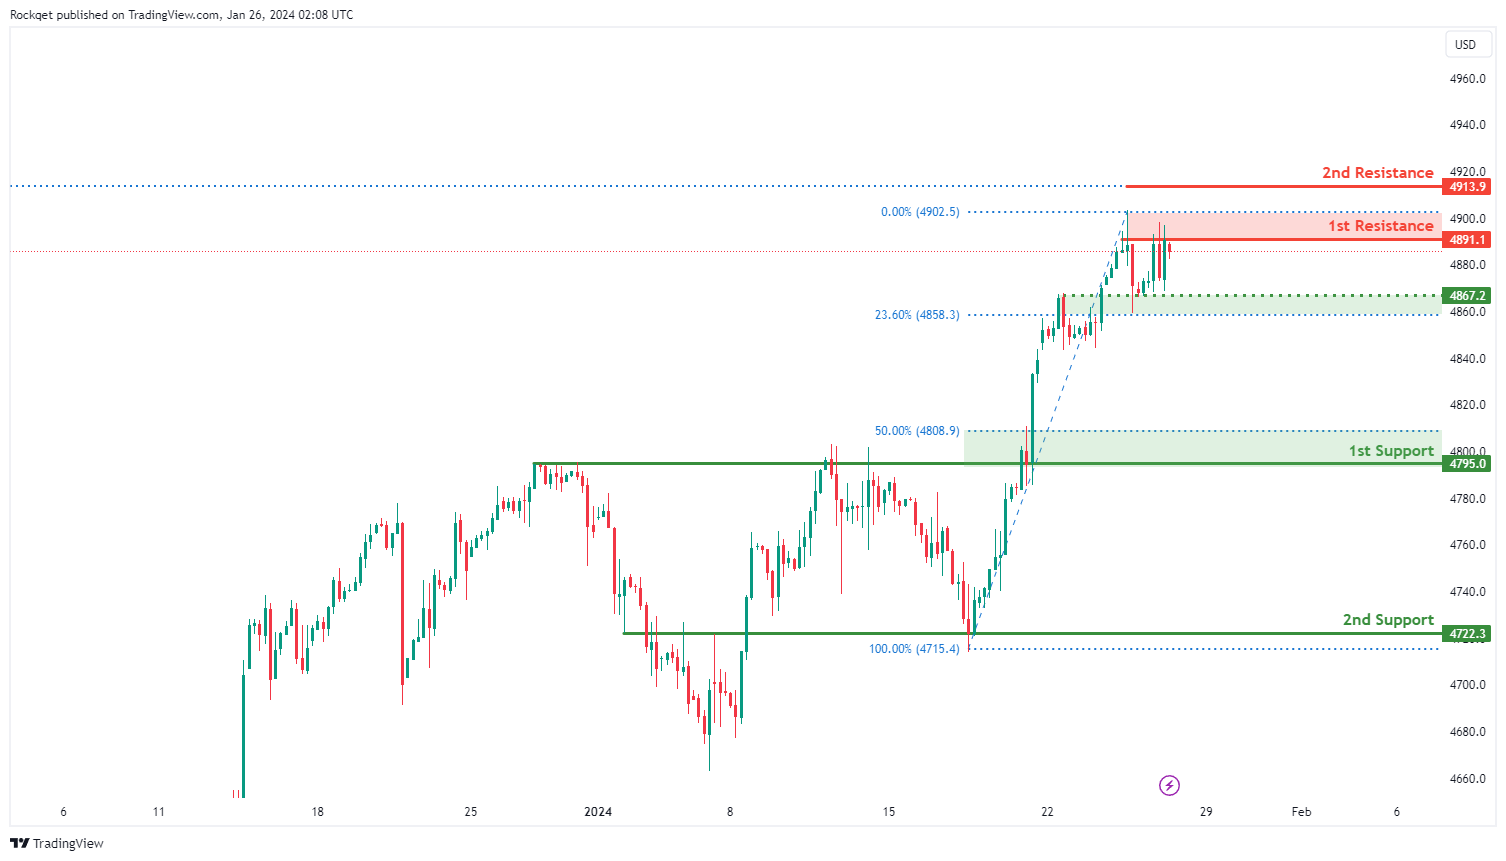
US500:
The US500 chart currently exhibits a bullish overall momentum, indicating a prevailing upward trend. Several factors contribute to this bullish momentum, suggesting potential upward movement in the price.
The 1st support at 4795.0 is considered favorable for several reasons. Firstly, it is identified as a pullback support, indicating a historical level where buying interest has previously emerged. Additionally, this support level aligns with the 50% Fibonacci Retracement, adding confluence to its significance.
The 2nd support at 4722.3 is recognized as an overlap support, providing additional strength to the potential support zone.
Intermediate support at 4867.2 is noteworthy for a couple of reasons. It is identified as an overlap support, indicating a level where buying interest has previously emerged. Furthermore, this support level aligns with the 23.60% Fibonacci Retracement, adding to its significance.
On the resistance side, the 1st resistance at 4891.1 is highlighted as a swing high resistance, indicating a historical level where selling interest may emerge.
Additionally, the 2nd resistance at 4913.9 is acknowledged as a level where the price might encounter resistance, given the 161.80% Fibonacci Extension.
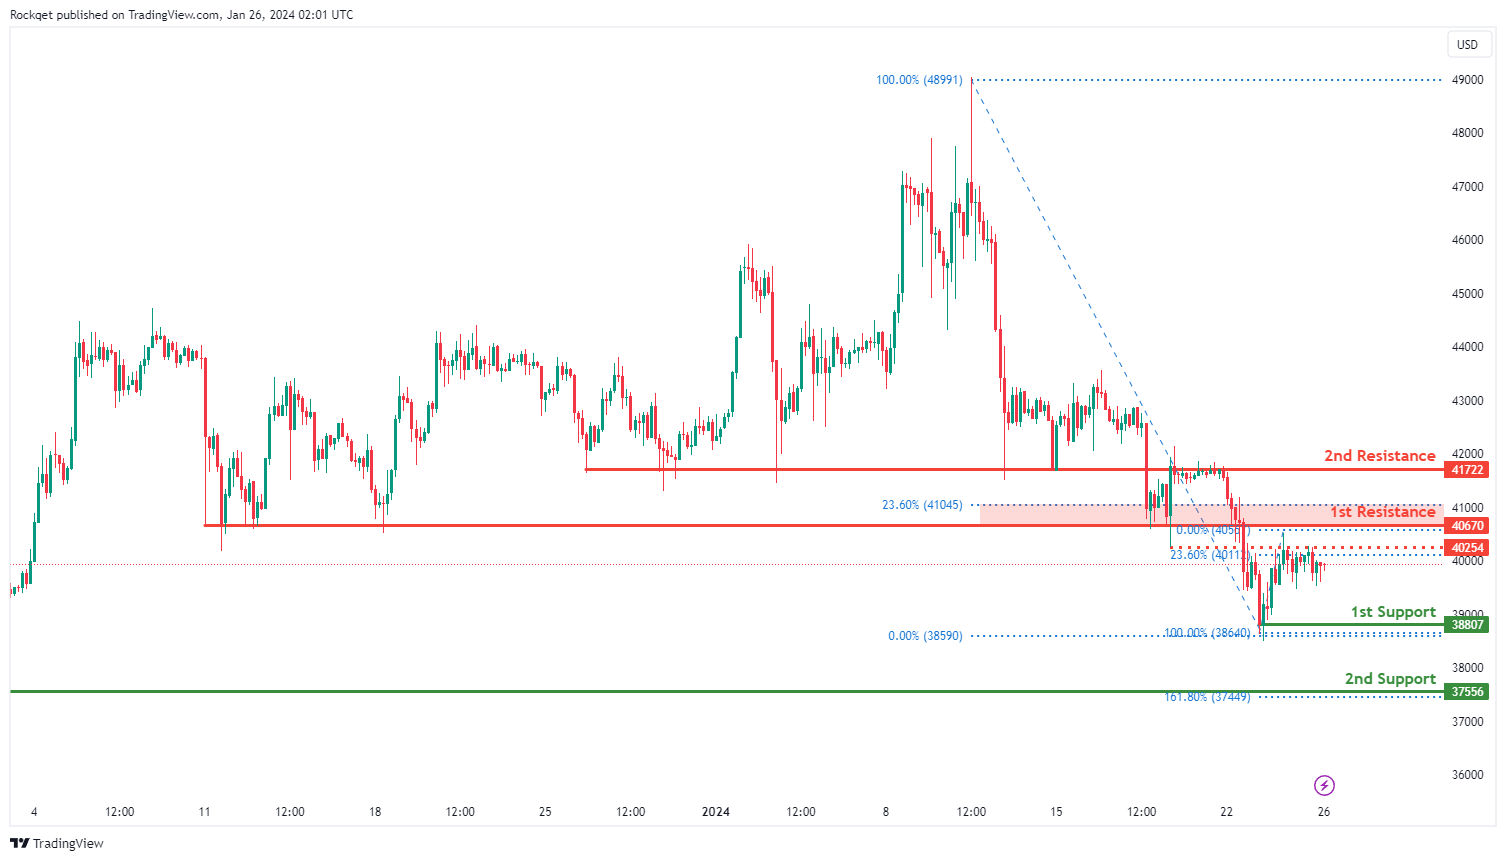
BTC/USD:
The BTC/USD chart currently shows a neutral overall momentum, suggesting a lack of a clear trend direction. The price could potentially make fluctuations between the 1st resistance and 1st support levels.
The 1st support at 38807 is considered favorable as it represents a swing low support, indicating a historical level where buying interest has previously emerged.
The 2nd support at 37556 is recognized as an overlap support and coincides with the 161.80% Fibonacci Extension, providing additional strength to the support zone.
On the resistance side, the 1st resistance at 40670 is noteworthy for being an overlap resistance and aligning with the 23.60% Fibonacci Retracement, adding significance to this potential resistance level. Additionally, the 2nd resistance at 41722 is identified as an overlap resistance.
Intermediate resistance at 40254 is also highlighted as an overlap resistance, further contributing to the potential resistance zone.
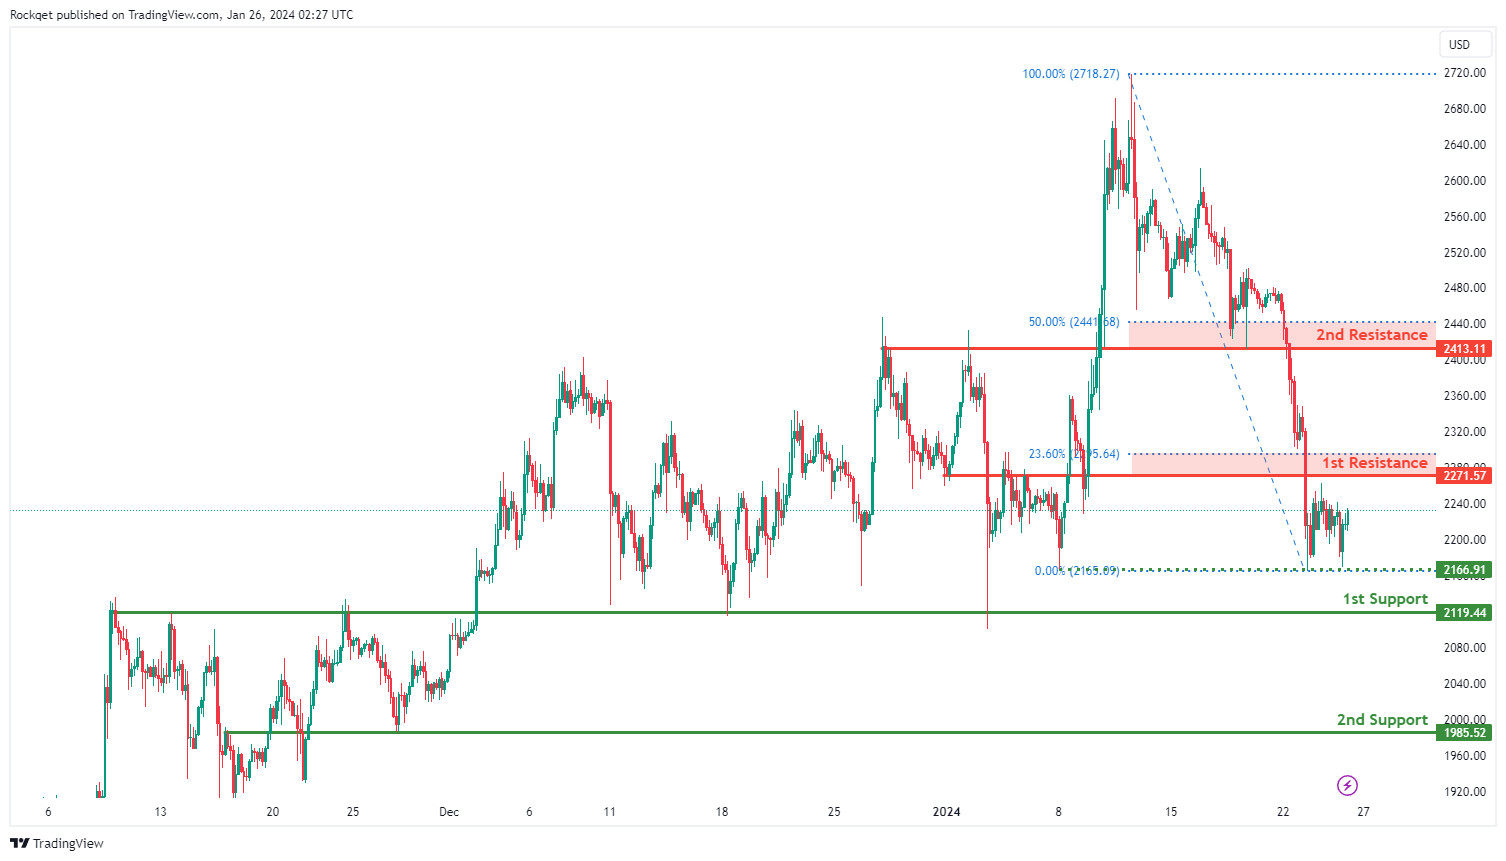
ETH/USD:
The ETH/USD chart currently exhibits a neutral overall momentum, indicating a lack of a clear trend direction. The price could potentially make fluctuations between the 1st resistance and 1st support levels.
The 1st support at 2119.44 is considered favorable as it is identified as an overlap support, signifying a historical level where buying interest has previously emerged.
Similarly, the 2nd support at 1985.52 is recognized as an overlap support, providing additional strength to the support zone.
Intermediate support at 2166.91 is highlighted as a swing low support, adding further depth to the potential support zone.
On the resistance side, the 1st resistance at 2271.57 is noteworthy for being an overlap resistance and aligning with the 23.60% Fibonacci Retracement, adding significance to this potential resistance level.
Additionally, the 2nd resistance at 2413.11 is identified as an overlap resistance and coincides with the 50% Fibonacci Retracement, contributing to the overall resistance zone.
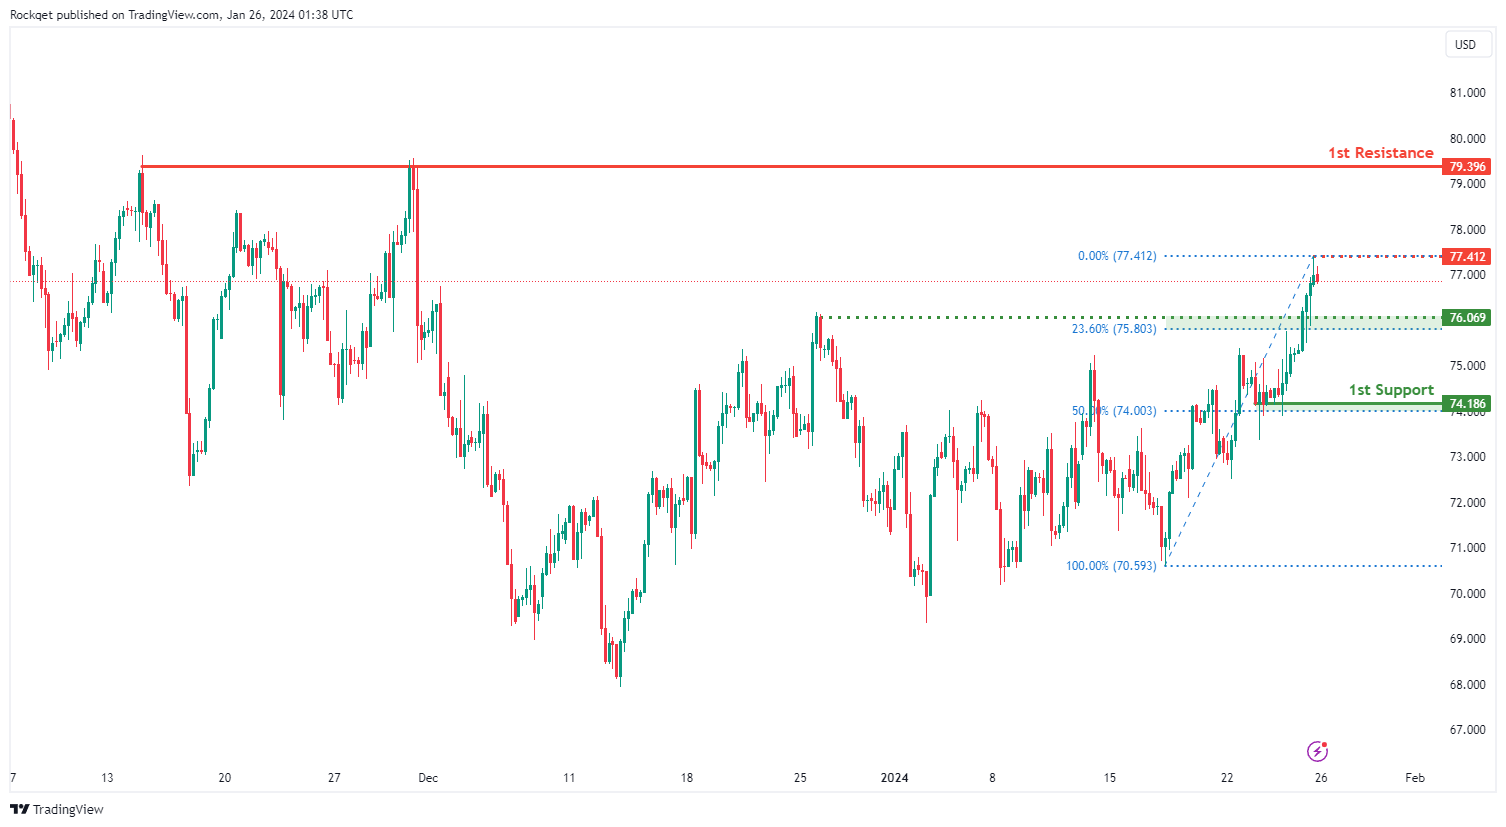
WTI/USD:
The WTI (West Texas Intermediate) chart currently exhibits an overall bullish momentum. In this context, there is a potential scenario for price to rise towards the 1st resistance should it break above the intermediate resistance..
The intermediate resistance level at 77.41 is identified as a pullback resistance. Higher up, the 1st resistance level at 79.39 is noted as a multi-swing-high resistance, suggesting a potential barrier for further upside movement.
To the downside, the intermediate support level at 76.06 is identified as a pullback support that aligns close to the 23.60% Fibonacci retracement level. Further below, the 1st support level at 74.18 is also marked as a pullback support that aligns close to the 50.00% Fibonacci retracement level, further reinforcing its importance as a key support level.
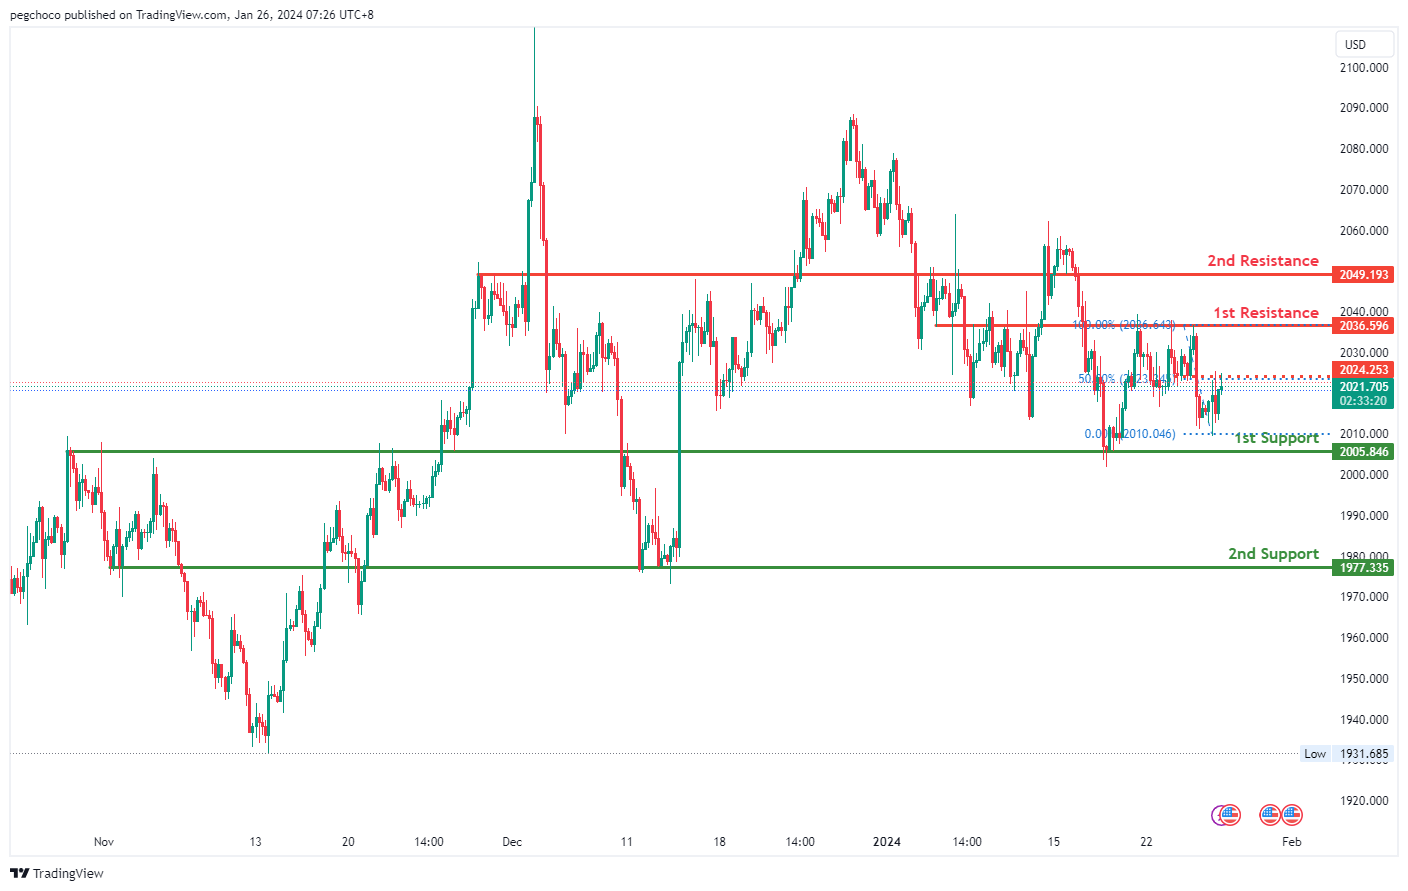
XAU/USD (GOLD):
The XAUUSD (Gold/US Dollar) chart is currently displaying a bearish overall momentum, indicating weakness in the price of gold. Your analysis suggests that there is potential for a bearish continuation in the price towards the 1st support level.
The 1st support level at 2005.84 is considered significant as it represents an overlap support, indicating that this price level has historically acted as both support and resistance. This suggests that it may serve as a strong area where price could potentially find support during a bearish move.
The 2nd support level at 1977.35 is identified as an overlap support, reinforcing its importance as a level where price has previously found both support and resistance.
On the resistance side, the 1st resistance level at 2036.59 is recognized as an overlap resistance, indicating that this price level has historically served as both support and resistance. This makes it a potential barrier where selling pressure could emerge.
The 2nd resistance level at 2049.19 is characterized as a pullback resistance, suggesting that it might act as a notable resistance point during price pullbacks.
Additionally, there is an intermediate resistance level at 2024.25, characterized as an overlap resistance, which coincides with the 50% Fibonacci Retracement level. This further supports the idea of potential resistance at this level.
Foreign Central Banks Take Center Stage
Summary
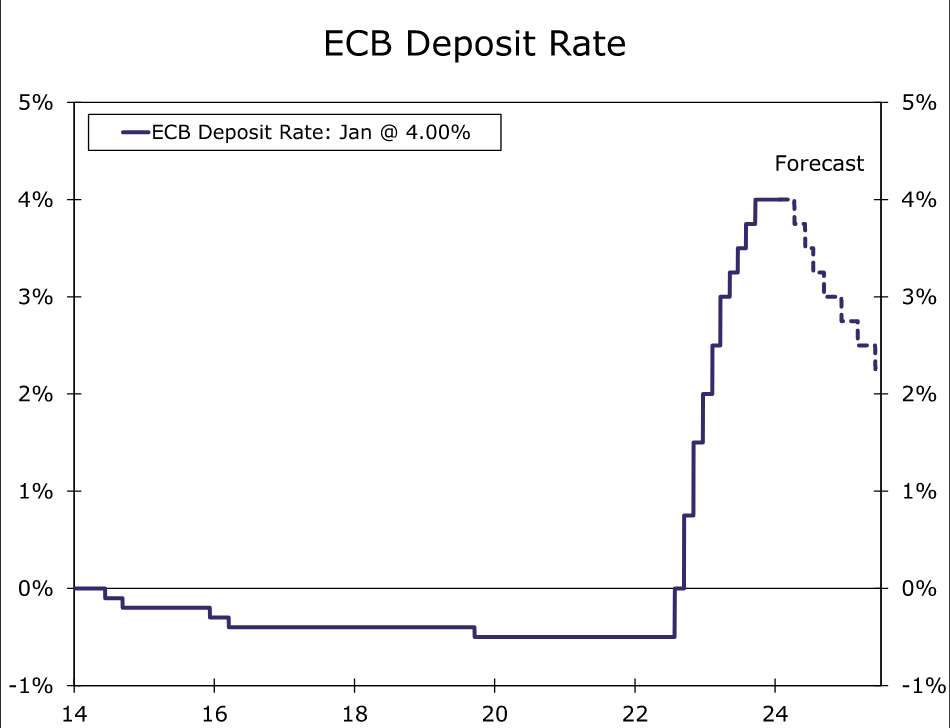
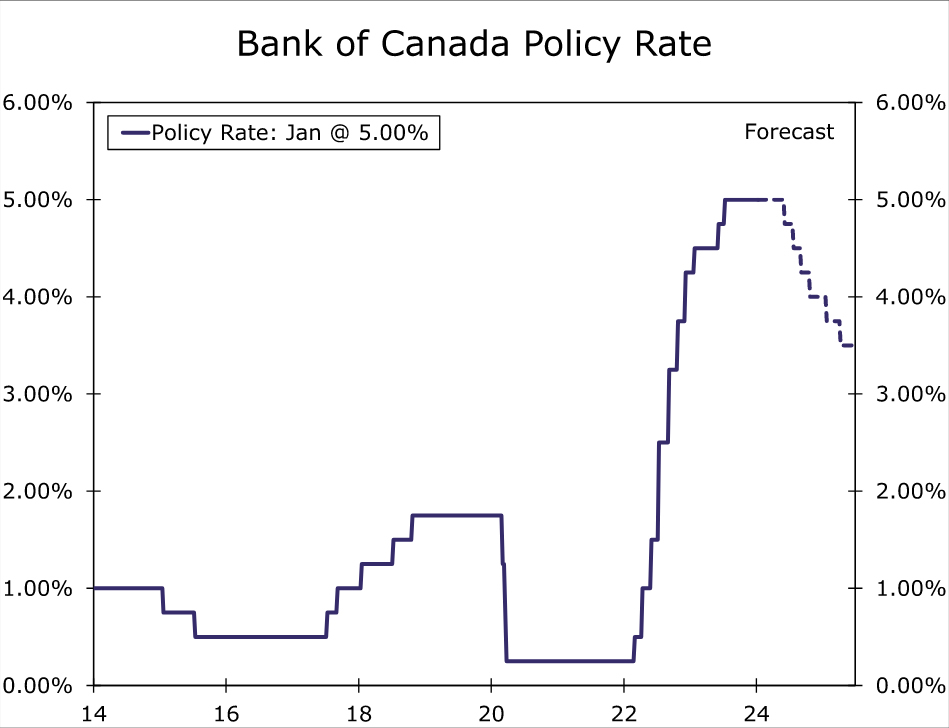
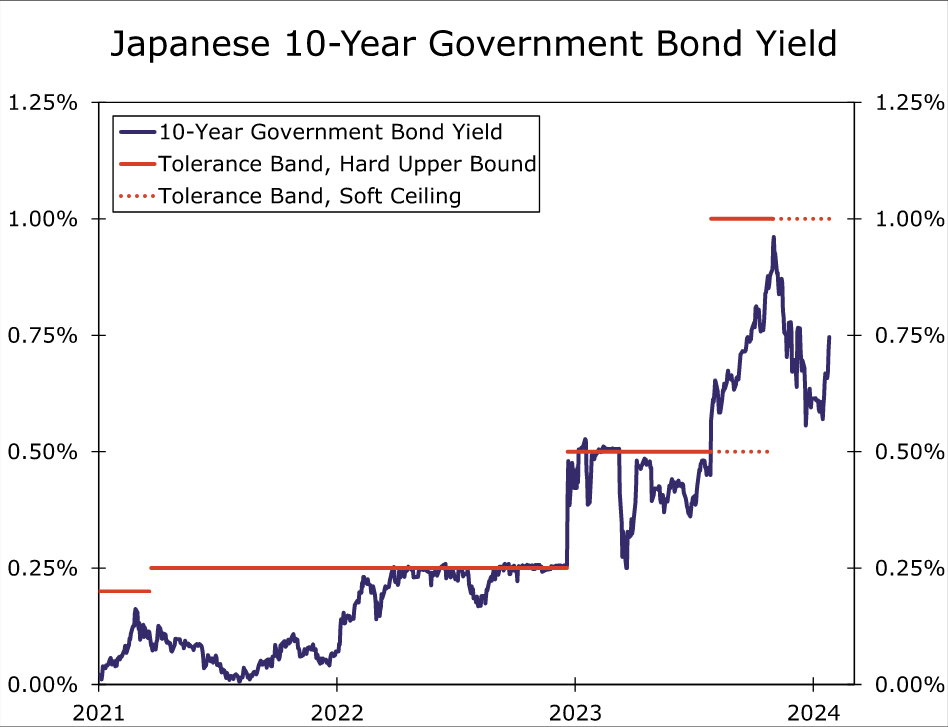
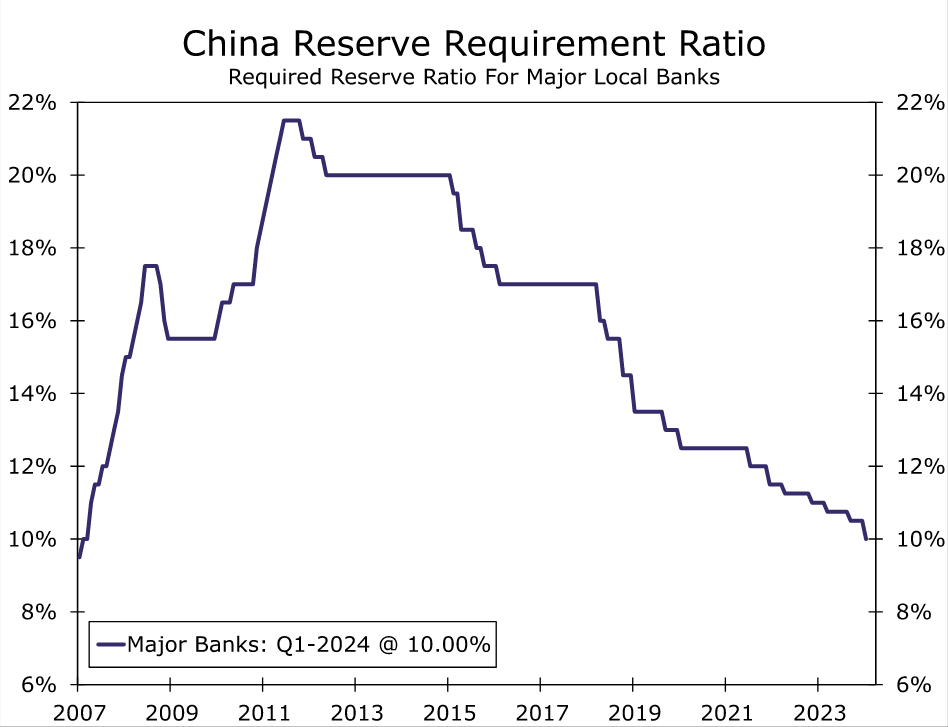
It was a busy week for foreign central banks, with several offering their first monetary policy assessment of 2024. The Bank of Japan held monetary policy unchanged, but its announcement and updated economic forecasts kept it on track for an April rate hike, in our view. The Bank of Canada's announcement was modestly dovish in tone, suggesting some risk that an initial rate cut could come earlier than our base case for monetary easing in June. The European Central Bank had offered hawkish guidance ahead of this week's meeting, but its announcement was arguably more neutral in tone. Given downbeat economic trends and the ECB's data dependence, our base case remains for an initial rate cut in April, although we acknowledge the risks are tilted toward a later move in June. Finally, the People's Bank of China lowered its Reserve Requirement Ratio to provide long-term liquidity to the market. While that could offer some support to the economy, we still expect China's GDP growth to be slower in 2024 than 2023.
Foreign Central Banks Kick Off 2024
It was a busy week for foreign central banks, with several institutions making their first monetary policy announcements of this year, and offering insight to the potential paths of their respective monetary policy stances through 2024. The European Central Bank (ECB) monetary policy announcement was perhaps not quite as hawkish as expected. In the lead up to this meeting, ECB President Lagrade suggested a rate cut was likely by or in the summer, and some of the more hawkish policymakers suggested the summer or later. ECB policymakers have also indicated a desire to see early 2024 wage data before adjusting their monetary policy stance. However, considering this leadup, the ECB's policy announcement was perhaps more neutral in tone. The ECB reiterated that it "considers that the key ECB interest rates are at levels that, maintained for a sufficiently long duration, will make a substantial contribution" toward returning inflation to its 2% medium-term target in a timely manner. The ECB also again highlighted a data-dependent approach to conducting monetary policy. On that front, the ECB said the declining trend in underlying inflation has continued, and that past interest rate increases continue to be "transmitted forcefully into financing conditions. Tight financing conditions are dampening demand, and this is helping to push down inflation." While ECB policymakers have guided market participants toward summer rate cuts, their assessment on the Eurozone economy appears notably underwhelming. As a result some market participants, including ourselves, still see potential for ECB easing to come earlier, during the spring.
This dichotomy between the ECB's policy guidance and its assessment of the economy was also apparent during ECB President Lagarde's press conference. She said the consensus was that a rate cut debate was premature, and she stood by her comments on summer rate-cut timing. At the same time, she said data signal economic weakness in the near-term, that the December inflation rebound was less than expected and almost all underlying measures fell in December. She added that short-term inflation expectations gauges are down markedly, and did not over-emphasize the inflationary risks from the Red Sea crisis. Combining the policy guidance with the assessment of the economy, the upcoming data should still be key as to the exact timing of an initial ECB rate cut. If GDP growth stays soft, sentiment surveys remain in contraction territory and underlying inflation continues to improve, then the rate cut debate could intensify in March and April, and monetary easing in April (for now still our base case) remains possible. However, should activity or sentiment data show some resilience, or improving inflation trends get interrupted, the June meeting will come more clearly into focus as the most likely timing for initial ECB easing.
In its first announcement of 2024, the Bank of Canada (BoC) offered a moderately dovish shift in its monetary policy outlook. The BoC lowered its GDP growth forecasts, predicting zero growth in Q4-2023, and shaving its 2024 and 2025 GDP growth forecasts to 0.8% and 2.4% respectively. Against this backdrop, the BoC said the economy now looks to be operating in "modest excess supply", suggesting some slack has opened up. BoC Governor Macklem also highlighted a shift in monetary policy focus, saying discussions are shifting from whether the policy rate is restrictive enough, to how long it needs to stay at the current level. Macklem did not completely rule out further rate hikes though, if new developments pushed inflation higher. As for the possible timing of rate cuts, the central bank said it is still concerned about risks to the inflation outlook, particularly the persistence in underlying inflation, and the BoC wants to see further and sustained easing in core inflation. In our view, Canada's economy is already weak enough to elicit rate cuts from the central bank if wage and price inflation co-operate. With wage growth and core inflation still elevated for the time being, however, we maintain our call for an initial BoC rate cut in June. That said, we view the risks as clearly tilted to an earlier April move, a risk that could crystallize if wages or prices were to slow sharply in the next few months.
The Bank of Japan (BoJ) held monetary policy steady at its January announcement, keeping its policy rate at -0.10% and leaving its Yield Curve Control parameters untouched. In formal guidance that was unchanged, the BoJ said it will "patiently continue with monetary easing" and "will not hesitate to take additional easing measures if necessary." That said, the central bank still appears to be laying the groundwork for a rate hike sometime during the earlier part of 2024, perhaps by April. In a notable shift in language, the BoJ said the certainty of achieving its economic projections has continued to gradually increase. BoJ Governor Ueda said the central bank will carefully assess data, including the spring wage talks, to see if the virtuous cycle of wages and prices is strengthening. The broader view on those spring wage talks appears to be constructive. In a recent Bloomberg survey, for example, some 94% of economists anticipated that the 2024 spring wage talks would result in an average wage increase that either matched, or was higher, that the average 3.6% wage increase achieved in 2023. Ueda also highlighted that more data will be available in April than March, and that a policy decision can be made even ahead of wage details for all small firms being available. Finally, the BoJ raised its forecast for medium-term (FY 2025) core inflation slightly to 1.8%, from 1.7% previously. Overall, we view BoJ policymakers' assessment of the economy and inflation as encouraging enough to keep our call for a 10 bps policy rate hike to 0.00% in April on track.
Finally, the People's Bank of China (PBoC) announced a reduction in its Reserve Requirement Ratio (RRR) to ease domestic liquidity conditions. Effective from 5 February, the RRR will be lowered by 0.50 percentage points, reducing that ratio to 10.00% for major banks. The move will provide around 1 trillion yuan in long-term liquidity to the market, according the PBoC Governor. Still, these policy moves come in the context of weak domestic demand, disinflation and deleveraging and, as a result, we still anticipate a moderate slowdown in China's GDP in 2024.
USD/JPY Signals Downside Correction, US GDP Grew 3.3%
Key Highlights
- USD/JPY is showing signs of a downside correction from 148.80.
- It traded below a key bullish trend line with support at 147.75 on the 4-hour chart.
- EUR/USD is struggling to recover above the 1.0900 resistance zone.
- The US GDP grew at a 3.3% annual rate in the fourth quarter of 2023.
USD/JPY Technical Analysis
The US Dollar remained strong after a close above 146.50 against the Japanese Yen. USD/JPY peaked near 148.80 and recently started a downside correction.
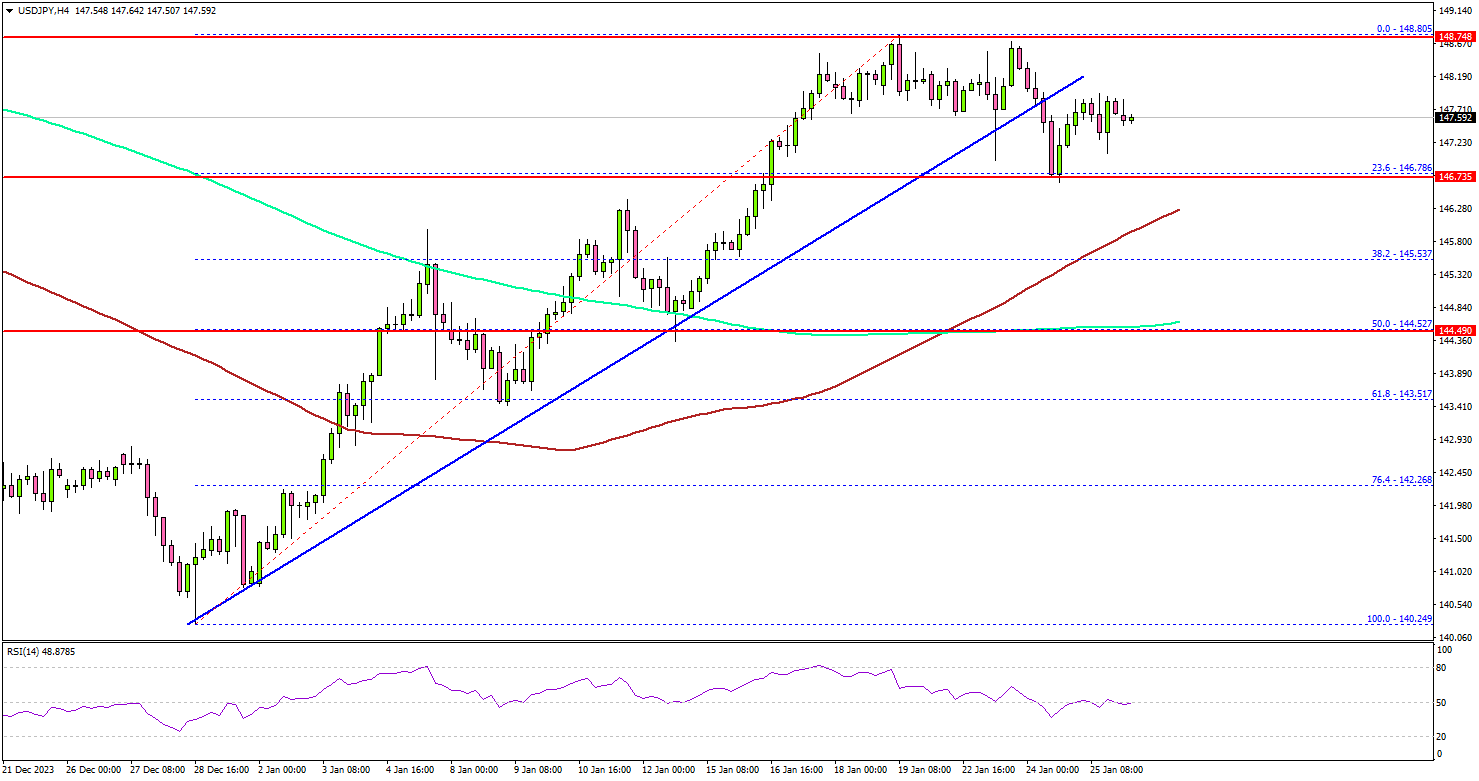
Looking at the 4-hour chart, the pair corrected lower below the 148.00 level. There was a break below a key bullish trend line with support at 147.75. The pair tested the 146.80 support zone and the 23.6% Fib retracement level of the upward move from the 140.24 swing low to the 148.80 high.
If the bears remain in action, the pair might decline below the 146.80 support. The next major support sits near the 146.20 level and the 100 simple moving average (red, 4 hours).
A downside break below the 146.20 zone could spark another sharp decline. The next major support is 144.50 or the 200 simple moving average (green, 4 hours). It is close to the 50% Fib retracement level of the upward move from the 140.24 swing low to the 148.80 high.
Any more losses might call for a drop toward the 142.20 support. On the upside, the pair is facing resistance near the 148.20 level.
The next key resistance is near the 148.80 level. A close above the 148.80 zone could open the doors for more upsides. The next stop for the bulls might be 149.50. Any more gains might send USD/JPY toward the 150.00 level.
Looking at EUR/USD, the pair is consolidating losses near 1.0850 and struggling to gain pace for a move above the 1.0920 resistance.
Economic Releases
- US Personal Income for Dec 2023 (MoM) - Forecast +0.3%, versus +0.4% previous.
- US Core Personal Consumption Expenditure for Dec 2023 (MoM) - Forecast +0.2%, versus +0.1% previous.
BoJ’s minutes emphasize importance of discussions on exiting negative rates
The minutes from BoJ's meeting on December 18-19 highlighted a focus on strategic discussions regarding the future of its monetary policy. The members agreed on the importance to "deepen discussions" about the "timing of the exit" from the current monetary policy framework and determining the "appropriate pace of raising policy interest rates thereafter." This discussion is closely tied to the evolving dynamics of "wage and price developments."
A key sentiment echoed by many members was the prerequisite for a sustainable and stable achievement of the price stability target before considering the termination of the negative interest rate policy and the yield curve control framework. The establishment of a "virtuous cycle between wages and prices" was reiterated as a necessary condition for these policy shifts.
Additionally, some members expressed the viewpoint that BoJ is "not in a situation where it would fall behind the curve" if it did not rush to raise policy interest rates. This perspective suggests a cautious approach to monetary tightening, implying that the central bank doesn't feel pressured to act hastily in adjusting its interest rate policy.
Japan’s Tokyo CPI slows sharply to 1.6%, raises questions on BoJ’s negative rates exit
Japan's Tokyo CPI core (ex-food) slowed significantly from 2.1% yoy to 1.6% yoy in January, below expectation of 1.9% yoy. That's also the lowest rate since March 2022. Additionally, core-core CPI (ex-food and energy) declined from 3.5% yoy to 3.1% yoy, marking a fifth consecutive month of decline. Headline CPI mirrored this trend, falling from 2.4% yoy to 1.6% yoy.
The latest Tokyo CPI data has sparked a debate among economists regarding its influence on BoJ strategy to phase out negative interest rates. While some analysts believe this data won't significantly impact BoJ's plan, anticipating the first rate hike since 2007 in April, others are more cautious. They suggest that the surprising drop in Tokyo inflation might lead BoJ to reconsider or delay the decision.
In parallel, December's corporate services price index remained steady at 2.4% yoy, aligning with the near nine-year high recorded in November.
WTI Wave Analysis
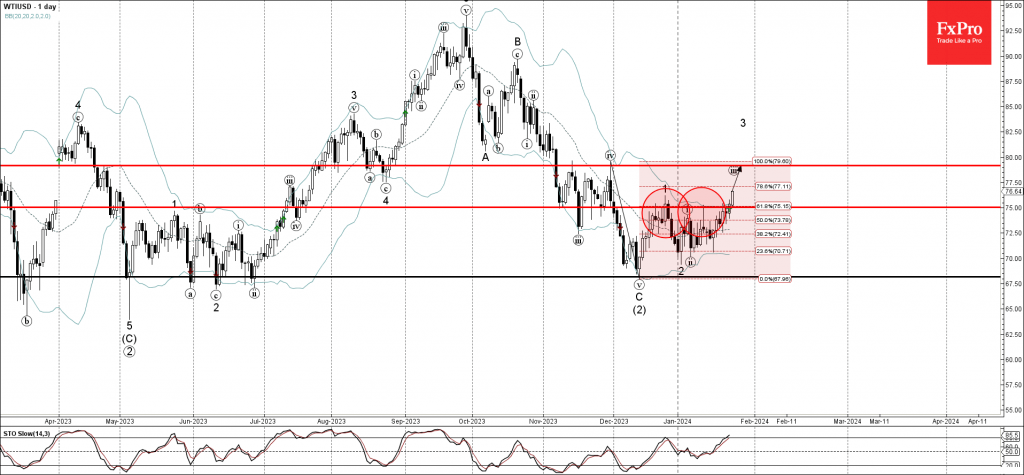
- WTI broke key resistance level 75.00
- Likely to rise to resistance level 79.15
WTI crude oil recently broke the key resistance level 75.00 (which has been reversing the price from the end of December).
The breakout of the resistance level 75.00 coincided with the breakout of the 61.8% Fibonacci correction of the previous sharp downward impulse v from November.
Given the strength of the active impulse waves 3 and (3), EURCAD can be expected to rise further to the next resistance level 79.15 (top of the previous correction iv).
EURCAD Wave Analysis
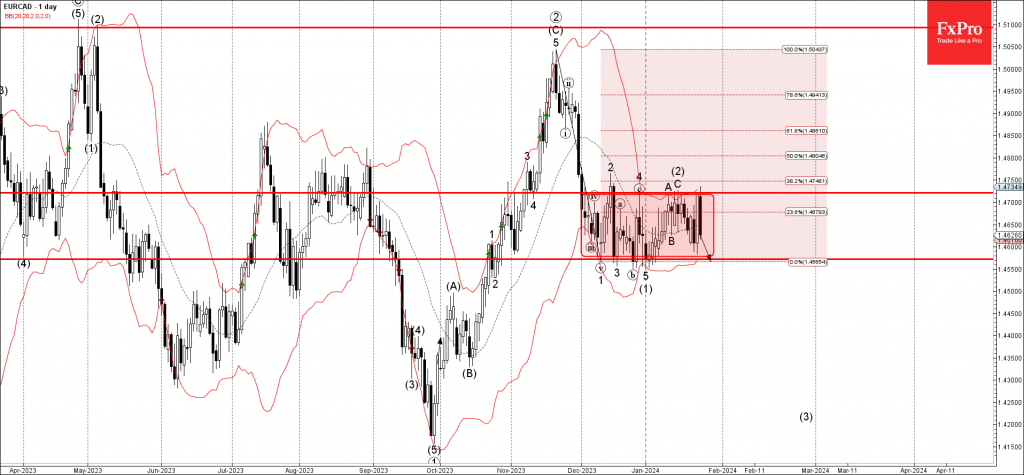
- EURCAD reversed from resistance level 1.4720
- Likely to fall to support level 1.4570
EURCAD currency pair recently reversed down once again from the key resistance level 1.4720 (upper boundary of the sideways price range inside which the pair has been trading from December).
The resistance level 1.4720 was strengthened by the upper daily Bollinger Band and by the 38.2% Fibonacci correction of the previous sharp downward impulse from November.
Given the strength of the resistance level 1.4720, EURCAD can be expected to fall further to the next support level 1.4570 (lower boundary of this price range).
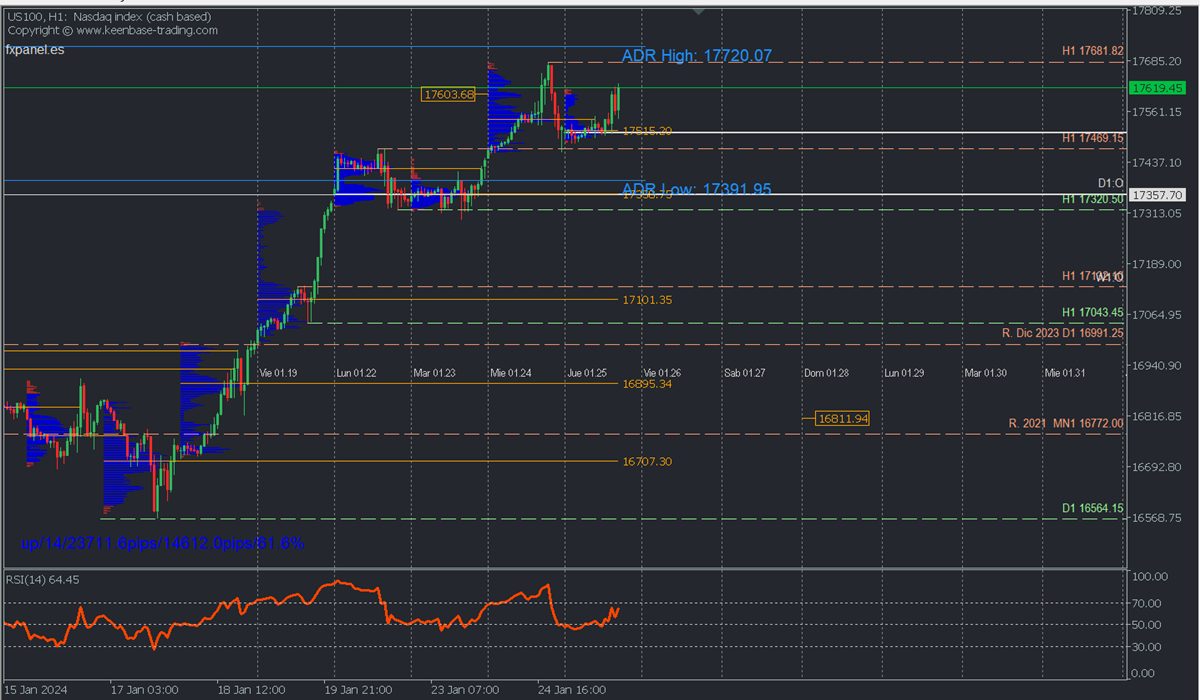
Nasdaq 100 (US100): Toward 17750
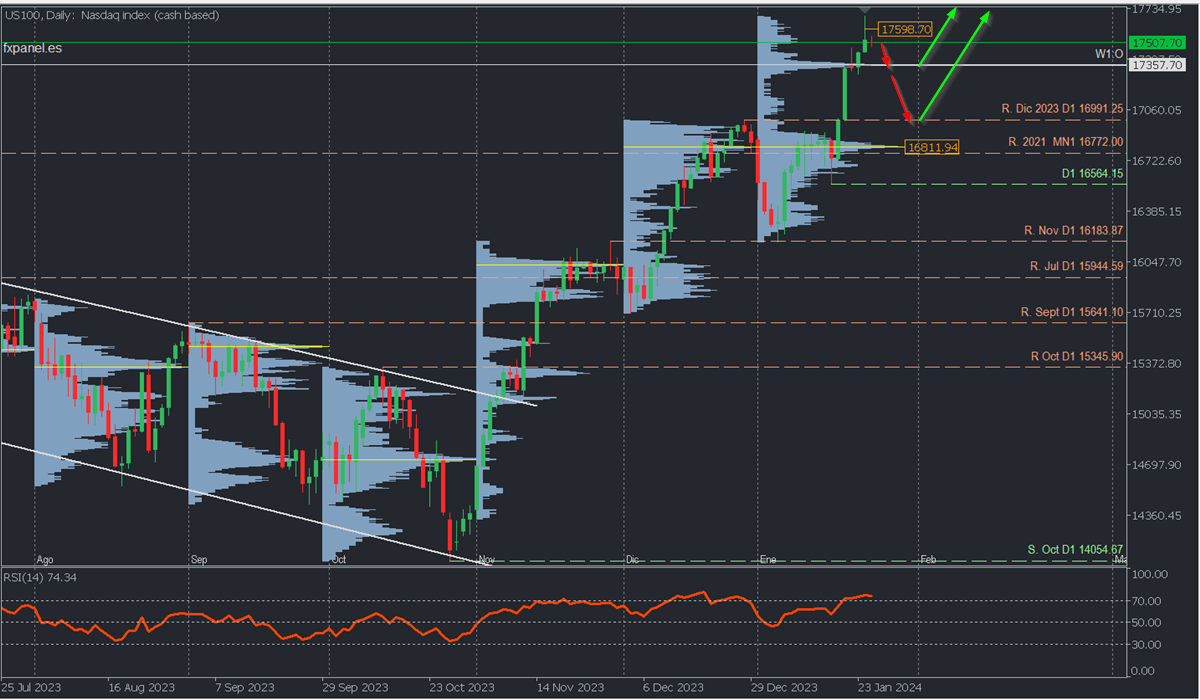
Bullish Scenario: Buy between 17515 and 17600 with TP1: 17681; TP2: 17720 intraday, and TP3: 17750 / 18000 in extension. It is recommended to set a stop loss (S.L.) below 17487 or at least 1% of the account capital**.
Bearish Scenario in case of breaking the buying zone: Sell below 17500 with TP1: 17469; TP2: 17421, and TP3: 17358 in extension. It is recommended to place a stop loss at 1.3477 or at least 1% of the account capital**. A trailing stop can be used.
Fundamental Environment:
The US 100 has risen approximately 9% since its January 5th low, following the increases of over 12% in November and over 8% in December, mainly driven by speculation about the Fed's early start to monetary easing (rate cuts).
Despite several FOMC members continuing to discourage speculation, the fourth-quarter earnings season of 2023 and the earnings of technology companies temporarily shifted previous speculations.
With the Fed meeting next week, market expectations are expected to become more realistic, acknowledging that the first-rate cuts will likely have to wait until at least the end of the first half of the year, triggering the necessary correction before incorporating the cuts into the price for June.
Analysis from the daily chart:
So far, the index reached a high of 17681.82 yesterday with no references to volume-based buying target levels. We can exclusively consider on the daily chart the potential retracement zones due to liquidity, such as the weekly opening at 17357.70 with a high volume node becoming the main target for bears in the short term. Its breakout will extend the correction towards the December broken resistance, now acting as support at 16991.25, and more extensively a retest of the January buying zone around the uncovered POC at 16811.94 and surrounding areas. A renewed rally is expected to reach and surpass 18000 before the end of the month.
Analysis from H1 chart:
The price could continue to rise today and break the resistance level at 17681.82. However, it may be limited by the daily bullish average range at 17720.07 before continuing to increase further towards 18,000 in the upcoming days. This will happen at least before the Fed meeting.
This scenario will remain valid as long as the retracement stays above the buying zone that coincides with the day's opening at 17515, even after a retracement to it. On the other hand, if the price fails to create a new high above the resistance at 17681.82 and falls towards the buying zone, causing its decisive breakout, it will pave the way for a possible breakdown of the support at 17460, in which case we will have a more extended correction towards the next buying zone at the weekly opening at 17358.
The bullish trend will maintain its intact structure as long as the retracements do not break the last relevant support, currently at 16564.15.
*Uncovered POC: POC = Point of Control: It is the level or zone where the bullish trend will remain intact as long as retracements do not break the relevant support at 16564.15. highest volume concentration occurred. If there was a bearish movement previously from it, it is considered a selling zone and forms a resistance area. Conversely, if there was a bullish impulse previously, it is considered a buying zone, usually located at lows, forming support zones.
**Consider this risk management suggestion.
**It is crucial that risk management be based on capital and traded volume. Therefore, a maximum risk of 1% of the capital is recommended. Using risk management indicators like the Easy Order is suggested.