Sample Category Title
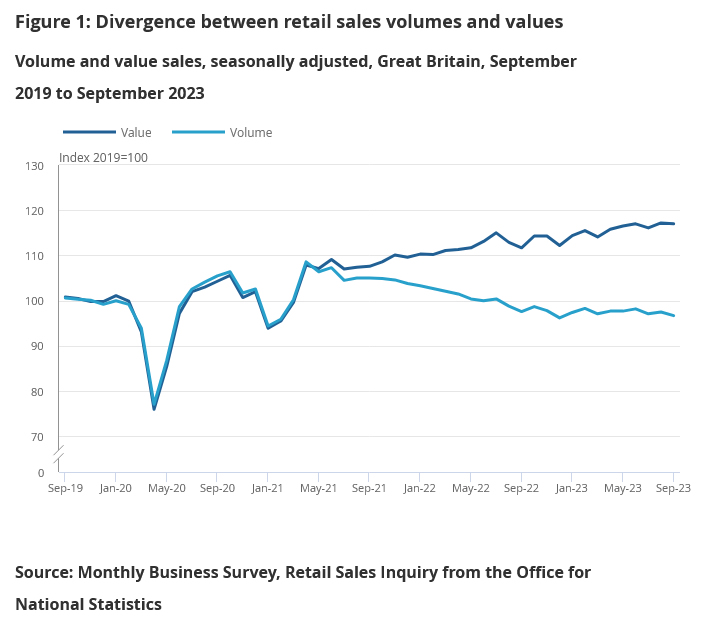
UK retail sales volumes down -0.9% mom in Sep, value down -0.2% mom
UK retail sales volumes fell sharply by -0.9% mom in September, much worse than expectation of -0.4% mom. Sale volumes excluding automotive fuel dropped -1.0% mom.
Looking at some details, non-food stores sales volumes fell -1.9% mom. Non-store retailing sales volumes fell -2.2% mom. Foot stores sales volumes rose rose 0.2% mom. Automotive fuel sales volumes rose by 0.8% mom.
Looking at the quarterly picture, sales volumes fell by -0.8% in the three months to September when compared with the previous three months. Ex-fuel sales volumes fell -1.0%.
In value term, retail sales value dropped -0.2% mom. Sales value excluding automotive fuel fell -0.4% mom.
US 10-year Yield Hits 5% on Powell’s Comments, Gold Exceeds $1980 per Ounce
‘Additional evidence of persistently above-trend growth, or that tightness in the labour market is no longer easing, could put further progress on inflation at risk and could warrant further tightening of the monetary policy’ said the Federal Reserve (Fed) Chair Jerome Powell at the Economic Club of New York yesterday. September’s 336K NFP read, higher-than-expected set of inflation data at the latest release contrary, a more than 35% surge in US household net worth since 2019 (Survey of Consumer Finances) are among evidence that the US economy is doing just fine.
Of course, the flip side of the story is dirtier. The US national debt is now above $33 trillion and rising and the safety of the US sovereign bonds, especially on the long end of the yield curve, came under scrutiny by global investors. Despite the rising tensions in Gaza, and a swift flight to safety, the US 10-year papers were aggressively sold, and the US 10-year yield hit the 5% mark after rising by around 35bp since Monday.
The selloff could be explained by strong retail sales data – that followed a strong NFP read and a stronger-than-expected inflation data since the month started – which both fueled the hawkish Fed expectations.
While a hawkish Fed means higher rates and the continuation of the QT, the US Treasury issues long-term debt to balance out the amount of short-term bills that it issued earlier this year.
Moreover, the US is now expected to help Israel – and continue to help Ukraine, in a period of swelling fiscal problems.
Whatever it is, the US initial jobless claims yesterday came below the 200K psychological level, and further fueled the selloff. The US 10-year yield at 5% for the first time since 2007. Needless to tell you that this is the first time in my career I have seen the US 10-year yield at this level as I had my Master’s degree in 2010! The US 2-year yield remains steady around 5.15%. The gap between the US 2 and 10-year yield is now narrowing, we haven’t seen recession in the US just yet. Bloomberg’s Simon White writes that there is ‘sufficiently compelling evidence that the US – and the rest of the world – is likely to enjoy a cyclical upswing before the next downturn’. I am less optimistic. The US 10-year yield at 5% will likely boost appetite, if not, expect the stock markets to bear the brunt of the surge in long term yields.
In the FX, the US dollar is surprisingly calm this week; you would expect more movement amid the surge in the US yields. Regardless of surging US yields, safe haven capital flows into gold. The price of an ounce exceeded $1980 this morning, and the purchases should accelerate before the closing bell as investors will seek safety into a weekend that could bring more carnage in the Middle East. Crude oil is above the $90pb level and has more to rise due to fear of supply disruptions in the Middle East. The dollar-yen is uncomfortably stable near the 150 psychological mark, as inflation in Japan came in higher-than-expected but fell to a year low, softening the Bank of Japan (BoJ) hawks’ hands.
USD/CAD Daily Outlook
Daily Pivots: (S1) 1.3686; (P) 1.3714; (R1) 1.3747; More....
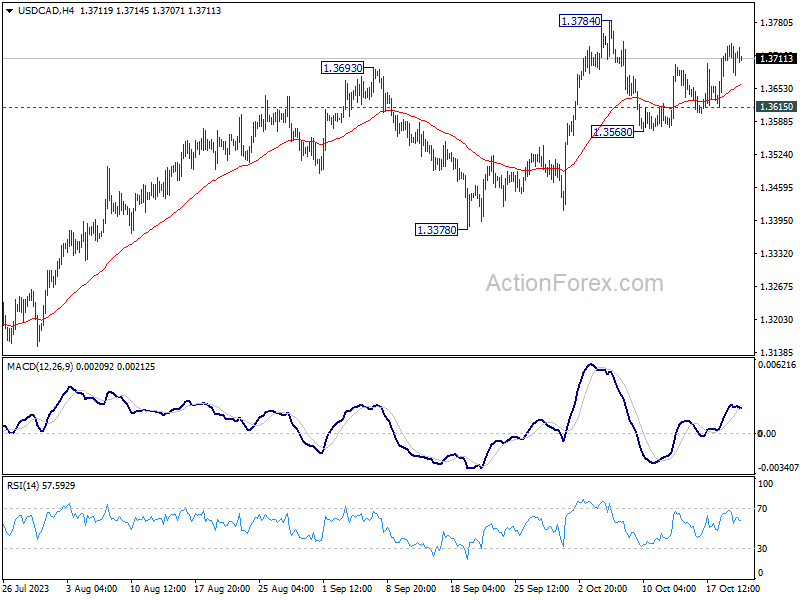
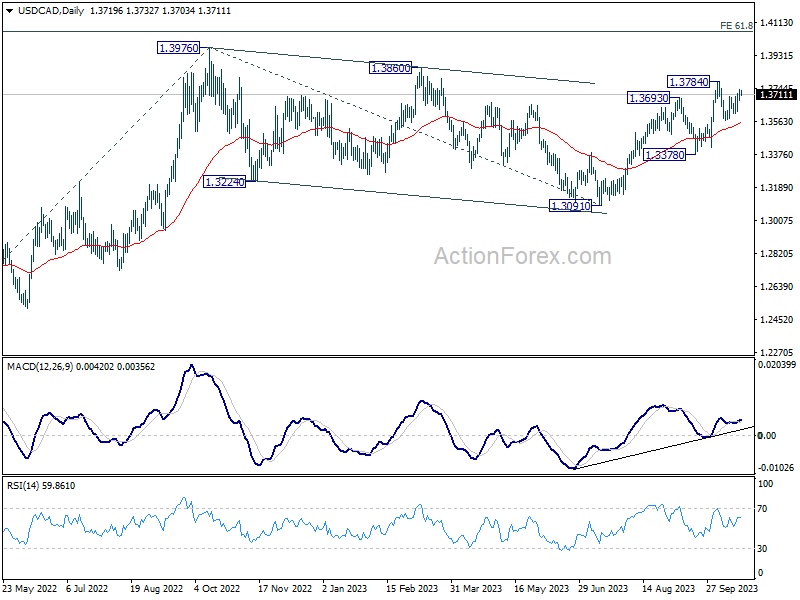
Intraday bias in USD/CAD stays on the upside for retesting 1.3784 first. Break there will resume larger rise from 1.3091 to retest 1.3976 high. On the downside, however, break of 1.3615 support will bring another falling leg to extend the near term corrective pattern from 1.3784.
In the bigger picture, current development revives the case that corrective pattern from 1.3976 (2022 high) has completed with three waves down to 1.3091. Decisive break of 1.3976 high will confirm resumption of up trend from 1.2005 (2021 low). Next target will be 61.8% projection of 1.2401 to 1.3976 from 1.3091 at 1.4064. This will now remain the favored case as long as 1.3378 support holds.
AUD/USD Daily Report
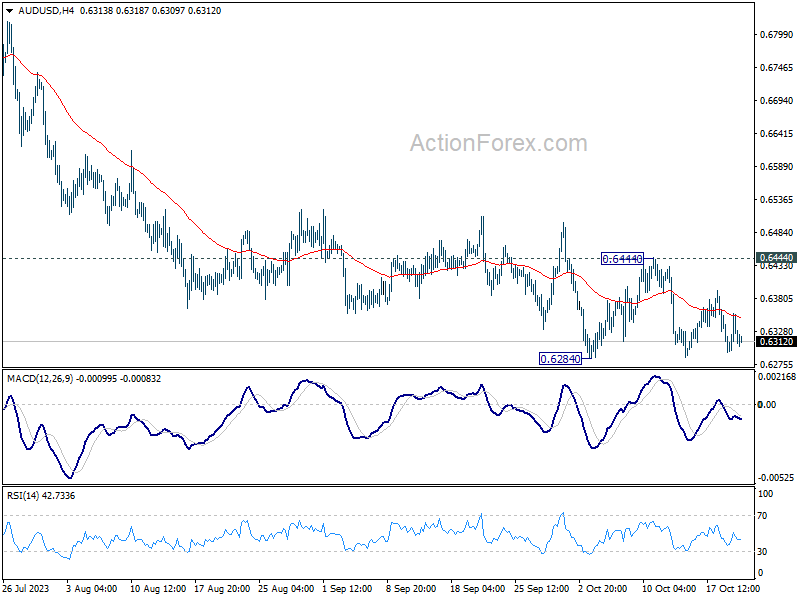
Daily Pivots: (S1) 0.6298; (P) 0.6327; (R1) 0.6359; More...
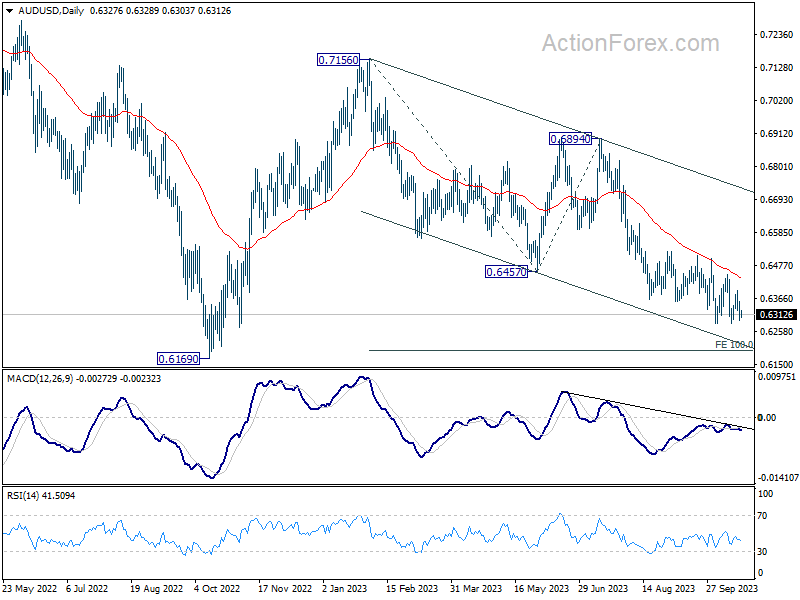
Range trading continues in AUD/USD and intraday bias stays neutral. Also, outlook remains bearish with 0.6444 resistance intact. On the downside, decisive break of 0.6284 will confirm resumption of whole decline from 0.7156. Next target is 100% projection of 0.7156 to 0.6457 from 0.6894 at 0.6195, which is close to 0.6169 medium term support. Nevertheless, firm break of 0.6444 will confirm short term bottoming, and turn bias to the upside for stronger rebound.
In the bigger picture, down trend from 0.8006 (2021 high) is possibly still in progress. Decisive break of 0.6169 will target 61.8% projection of 0.8006 to 0.6169 to 0.7156 at 0.6021. This will now remain the favored case as long as 0.6894, in case of strong rebound.
EUR/USD Daily Outlook
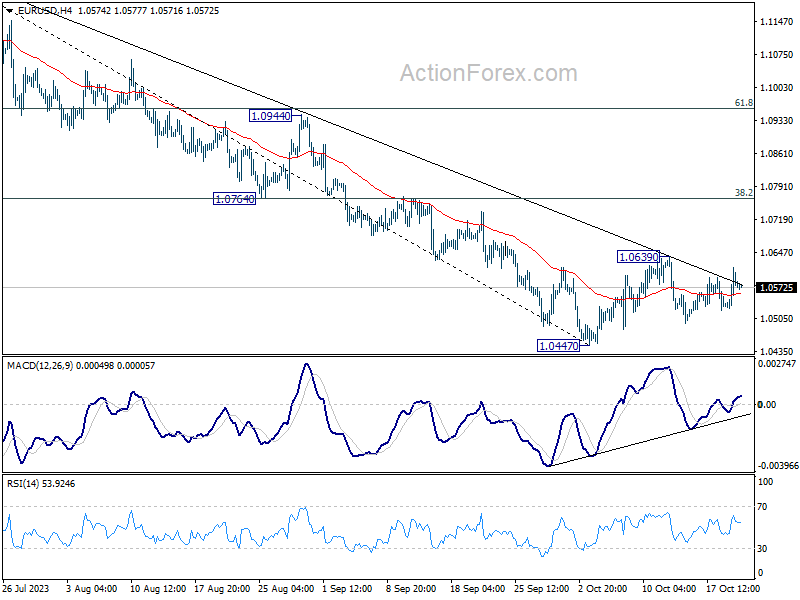
Daily Pivots: (S1) 1.0535; (P) 1.0575; (R1) 1.0623; More...
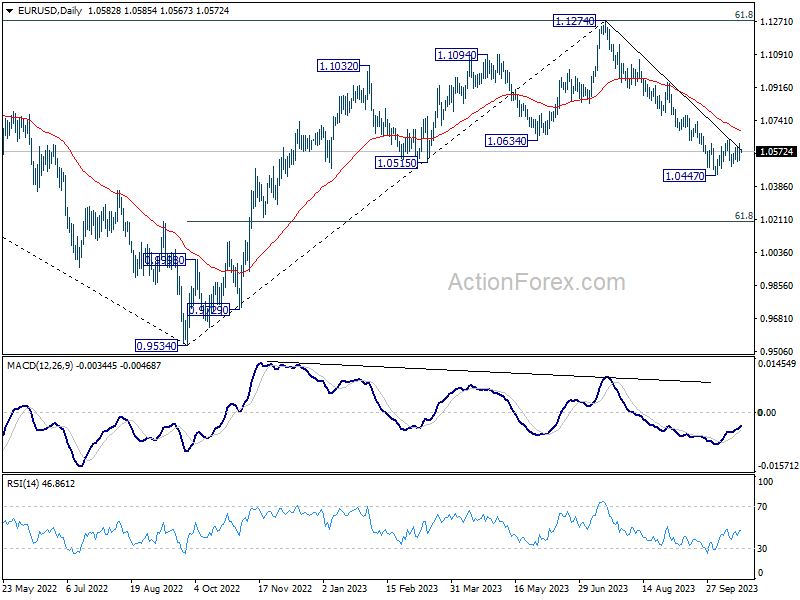
Intraday bias in EUR/USD remains neutral and outlook stays bearish with 1.0639 resistance intact. On the downside, firm break of 1.0447 will resume whole fall from 1.1274 and target 1.0199 fibonacci level. On the upside, however, break of 1.0639 will resume the rebound from 1.0447 to 55 D EMA (now at 1.0684).
In the bigger picture, fall from 1.1274 medium term top could still be a correction to rise from 0.9534 (2022 low). But chance of a complete trend reversal is rising. In either case, current fall should target 61.8% retracement of 0.9534 to 1.1274 at 1.0199 next. For now, risk will stay on the downside as long as 55 D EMA (now at 1.0684) holds, in case of rebound.
GBP/USD Daily Outlook
Daily Pivots: (S1) 1.2091; (P) 1.2142; (R1) 1.2193; More
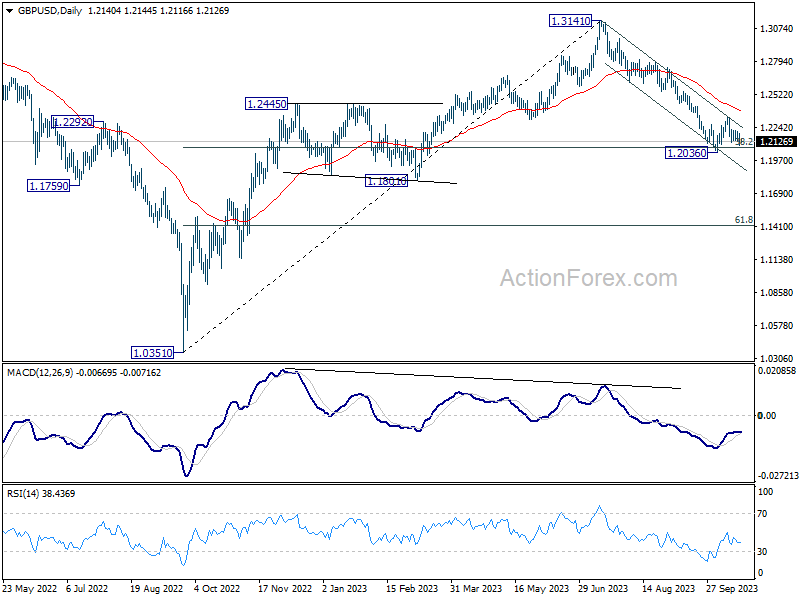
Consolidation from 1.2026 is still in progress and intraday bias in GBP/USD stays neutral. Also, outlook remains bearish with 1.2336 resistance intact. On the downside, decisive break of 1.2036 will resume whole decline from 1.3141 for 1.1801 support next. However, break of 1.2336 will resume the rebound from 1.2036 to 55 D EMA (now at 1.2374).
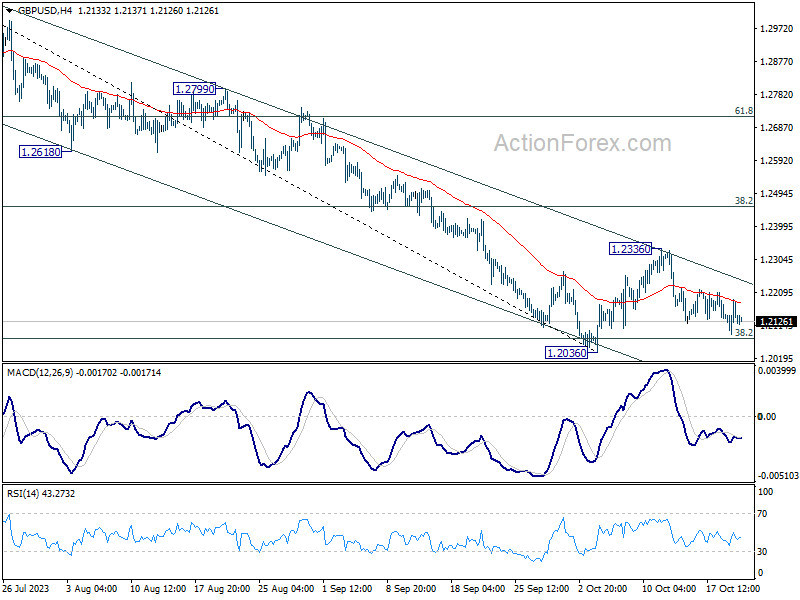
In the bigger picture, fall from 1.3141 medium term top could still be a correction to up trend from 1.0351 (2022 low) only. But risk of complete trend reversal is rising. Sustained break of 38.2% retracement of 1.0351 to 1.3141 at 1.2075 will pave the way to 61.8% retracement at 1.1417. For now, risk will stay on the downside as long as 55 D EMA (now at 1.2374) holds, in case of rebound.
USD/JPY Daily Outlook
Daily Pivots: (S1) 149.66; (P) 149.81; (R1) 149.96; More...
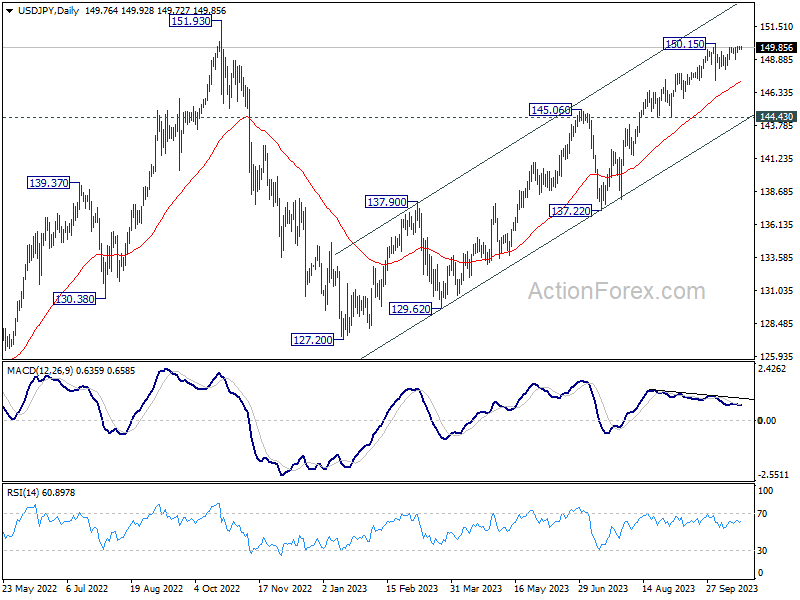
No change in USD/JPY's outlook as sideway trading continues. Intraday bias remains neutral at this point. On the downside, below 148.24 minor support will turn bias to the downside for another down leg through 147.28. On the upside, firm break of 150.15 will resume larger up trend to test 151.93 high.
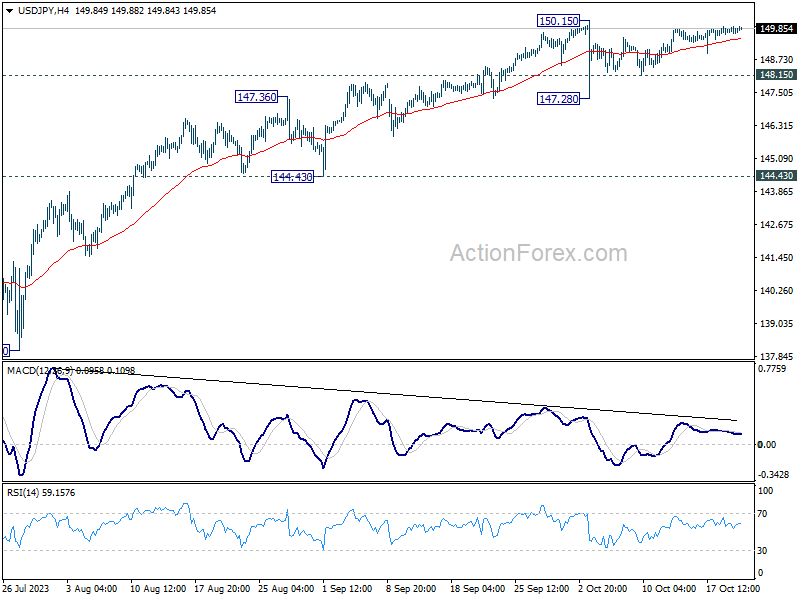
In the bigger picture, while rise from 127.20 is strong, it could still be seen as the second leg of the corrective pattern from 151.93 (2022 high). Rejection by 151.93, followed by sustained break of 145.06 resistance turned support will be the first sign that the third leg of the pattern has started. However, sustained break of 151.93 will confirm resumption of long term up trend.
USD/CHF Daily Outlook
Daily Pivots: (S1) 0.8882; (P) 0.8942; (R1) 0.8975; More....
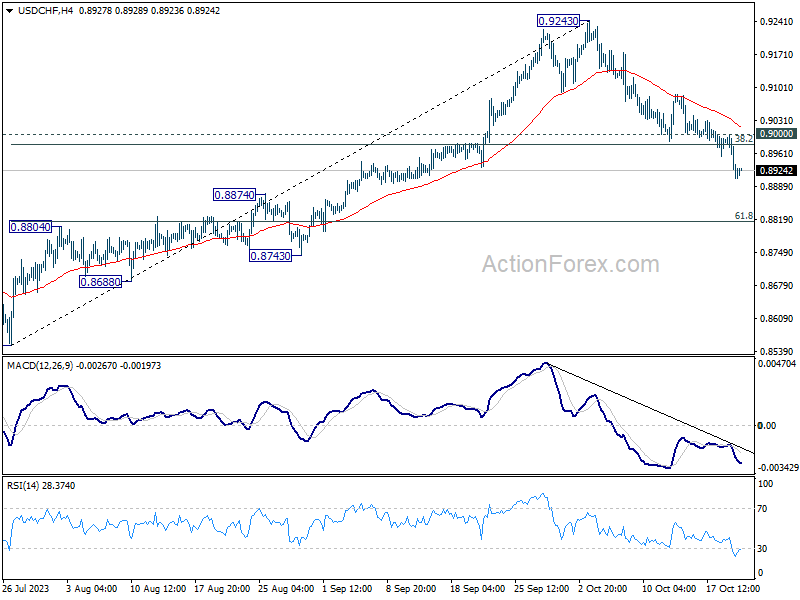
USD/CHF's fall from 0.9243 continued and finally took out 38.2% retracement of 0.8551 to 0.9243 at 0.8979 decisively. There is no sign of bottoming and intraday bias is now on the downside for 61.8% retracement at 0.8815. Sustained break there will pave the way to retest 0.8551 low. On the upside, above 0.9000 minor resistance will turn bias neutral and bring consolidations first, before staging another decline.
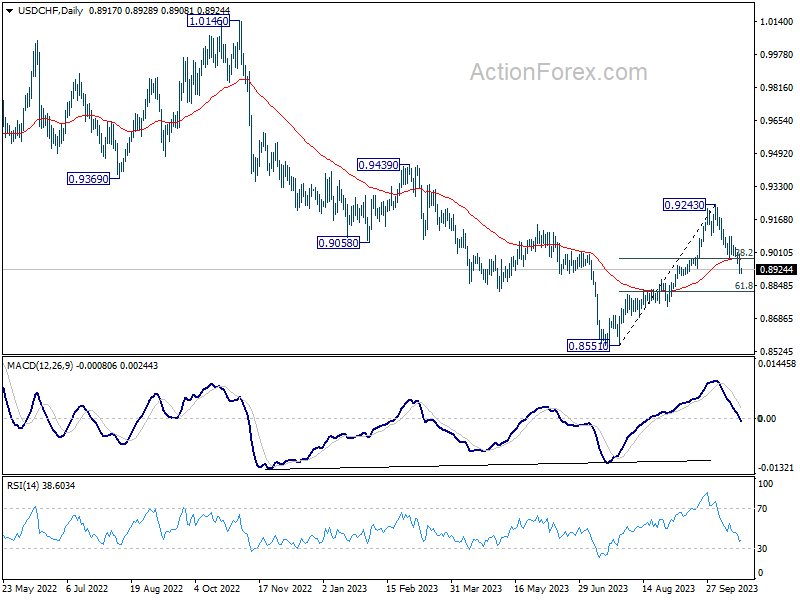
In the bigger picture, the firm break of 55 D EMA (now at 0.8974) argues that rebound from 0.8551 might be completed as a correction at 0.9243. In other words, larger fall from 1.0146 (2022 high) is possibly not over yet. Risk will now stay on the downside as long as 0.9243 resistance holds. Firm break of 0.8551 will confirm down trend resumption.
Geopolitical Concerns Continues to Bolster Swiss Franc; Dollar Resilient Post Fed Powell’s Commentary
Swiss Franc continues to dominate as this week's top-performing currency, as the global financial markets are under influence of mounting geopolitical tensions. Reports suggest that Israel might be preparing for ground operations against Hamas. The country's Defence Minister, Yoav Gallant, has reportedly alerted troops that they will soon see Gaza "from inside", and "the command will come".
This global unease has also propelled Gold, pushing the precious metal closer to the significant 2000 mark. Furthermore, WTI crude oil has surpassed 90 level. Franc's surge also seems to bolster Euro, which now ranks as the week's second strongest currency. In contrast, the British Pound has not managed to keep up the pace.
Following Fed Chair Jerome Powell's speech, Dollar experienced a mild dip but remained robust, ranking as the third strongest currency for the week. The tenacity of the greenback is attributed to the persistent rise of 10-year yield, which narrowly missed the 5% mark overnight. US President Joe Biden's call for increased spending to support Israel and Ukraine amplified the selloff in treasuries. Biden's proposal is reported to be at USD 100B in new spending, subject to Congress approval.
Conversely, New Zealand Dollar is languishing at the bottom of the weekly chart, with Canadian Dollar and Yen trailing closely. It's uncertain if Japan will intervene in the currency markets again as USD/JPY might probes 150 any time. The country's top currency diplomat Masato Kanda emphasized the "basic stance" to not to say anything about intervention as that would causes noises in the markets. So, there would be no clue until action is taken.
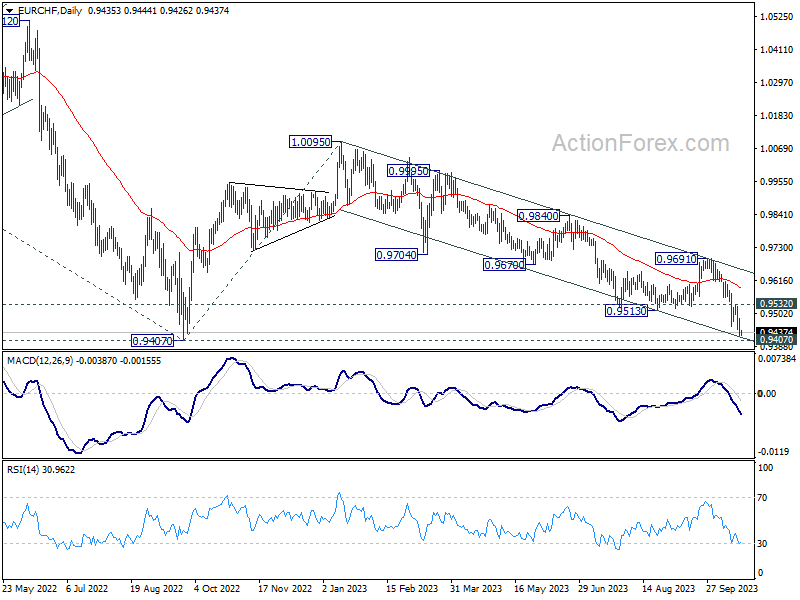
Technically, even though Euro is the second strongest for the week, EUR/CHF still extending the medium term down trend from 1.0095. The cross is now approaching medium term channel support, as well as medium term bottom at 0.9407. A bounce from current level is plausible and break above 0.9532 resistance will indicate short term bottoming. However, decisive break of 0.9407 will confirm resumption of the long term down trend, and could be an indication of renewed decline in EUR/USD too.
In Asia, at the time of writing, Nikkei is down -0.12%. Hong Kong HSI is down -0.41%. China Shanghai SSE is down -0.27%. Singapore Strait Times is down -0.06%. Japan 10-year JGB yield is down -0.0077 at 0.839. Overnight, DOW dropped -0.75%. S&P 500 dropped -0.85%. NASDAQ dropped -0.96%. 10-year yield rose 0.084 to 4.988.
Fed's Powell signals caution on rate hikes, notes yield surge as de facto tightening
Fed Chair Jerome Powell, in his speech at the Economic Club of New York, asserted that while the option for an additional rate hike remains open, a prudent and careful approach will be the governing principle. Market participants, digesting Powell's words, now overwhelmingly anticipate an extension of Fed's pause in November, a sentiment reflected in fed fund futures pointing towards a 100% chance of this outcome. Referring to the recent rise in yields, he said it might have an effect "at the margins" on reducing the necessity for further rate hikes.
Powell suggested that the surge in yields might be linked to growing concerns surrounding fiscal deficits and mentioned that the process of Quantitative Tightening could also be influencing it. Highlighting that the uptick in yields acts as a de facto policy tightening, Powell raised the possibility that this might reduce the need for aggressive rate hikes in the future.
Although inflation metrics have dipped during the summer, Powell emphasized, "inflation is still too high, and a few months of good data are only the beginning." The inflation outlook remains uncertain, marked by the unpredictability of its stabilization point in the upcoming quarters, and Powell concedes that, "the path is likely to be bumpy."
With an eye on economic growth and labor market dynamics, Powell indicated that persistent above-trend growth or sustained labor market tightness could trigger a reevaluation of the inflation outlook. Such developments "could warrant further tightening of monetary policy."
Underscoring the complexities and potential pitfalls ahead, Powell stated, Committee is "proceeding carefully." "We will make decisions about the extent of additional policy firming and how long policy will remain restrictive based on the totality of the incoming data, the evolving outlook, and the balance of risks," he added.
Fed officials stress patience and vigilance amid rising treasury yields
Comments from some key Fed officials overnight underscore the central bank's cautious approach in the face of evolving economic conditions, particularly the rise in treasury yields and persistent inflation.
Philadelphia Fed President Patrick Harker asserted, "We are at the point where we can hold rates where they are." He acknowledged the recent data trends, noting, "So far, economic and financial conditions are evolving roughly as I expected," but added that some indicators have been "a tad stronger than my baseline forecast." Harker championed patience in monetary policy, suggesting that "a resolute, but patient, stance of monetary policy will allow us to achieve the soft landing that we all wish for our economy."
Dallas Fed President Lorie Logan emphasized the natural tightening effect of the recent uptick in treasury yields, stating they have "done some of this tightening work for us." While Logan recognized some progress in inflation management, she conceded, "it's still too high." Stressing the importance of the broader economic environment, she remarked, "It's important that we have continued restrictive financial conditions."
Chicago Fed President Austan Goolsbee approached the inflation debate from a historical perspective. He noted, "There's a widely held conventional wisdom that if you get the inflation rate down more than 5 percentage points you will have to have a big recession to do that." Contrary to this belief, Goolsbee expressed optimism, saying, "So far, we haven't had that recession, I'm still hopeful we can avoid it entirely."
Lastly, Atlanta Fed President Raphael Bostic laid clear his priorities, stating, "As for inflation, that is job one for now." He elucidated the broad impacts of inflation, observing that "Across the economy and demographic groups, inflation is the force that is most painful and drives more people to precariousness."
Japan's core CPI slips below 3% mark to 2.8% yoy
Inflationary momentum in Japan showed signs of easing in September, with all-item CPI decelerating to 3.0% yoy, down from 3.2% yoy in the prior month. Core CPI, which strips out the volatile food prices, also showed a downtrend, registering at 2.8% yoy, a dip from 3.1% yoy. Furthermore, core-core CPI, which excludes both food and energy prices, declined marginally from 4.3% yoy to 4.2% yoy.
Remarkably, core inflation dipped below the 3% mark for the first time since August 2022. Nevertheless, it remains above BoJ's 2% target, marking the 18th consecutive month of surpassing this benchmark.
The detailed breakdown of the data indicates that energy prices were a significant drag, plunging by -11.7% yoy. This downturn can be attributed to the government's proactive measures to trim utility bills, resulting in double-digit falls in electricity and city gas prices. On the contrary, food prices remained on an upward swing, posting 8.8% yoy increase.
There are reports suggesting an upward revision in BoJ's core CPI forecast for fiscal 2023. Sources familiar with the bank's deliberations indicate a possible revision from 2.5% to nearly 3.0%. All eyes will now be on BoJ 's policy meeting scheduled for Oct 31, where a new outlook report is anticipated.
New Zealand's exports down -18% yoy in Sep, China leads decline again
New Zealand's trade balance for September reveals a deficit of NZD -2.3B, driven by a notable fall in goods exports of -18% yoy, bringing the total to NZD 4.9B. The decline in imports was also significant, dropping by -15% yoy to NZD 7.2B.
A striking feature of this downturn is the notable reduction in exports to China, marking a deviation from the consistent growth observed over the past decade. International trade manager Alasdair Allen noted, "Over the past decade, exports to China have been steadily increasing, with a flat period during COVID-19, but in recent months this has started to shift."
Breaking down the export figures by country, China recorded a 20% yoy drop, equivalent to NZD 332 million, leading the downturn. Exports to Australia, US, EU, and Japan also experienced declines, calculated at -3.3%, -6.7%, -26%, and -12% yoy, respectively.
On the imports front, China once again played a significant role, with imports from the country decreasing by -17% yoy. Imports from EU and Australia also dropped by -1.5% yoy and -21% yoy respectively. Imports from South Korea contracted by -16% yoy. In contrast, imports from US saw a growth of 6.1% yoy.
Looking ahead
UK retail sales and Germany PPI are the main focuses in European session. Canada will release retail sales later in the day.
USD/CHF Daily Outlook
Daily Pivots: (S1) 0.8882; (P) 0.8942; (R1) 0.8975; More....
USD/CHF's fall from 0.9243 continued and finally took out 38.2% retracement of 0.8551 to 0.9243 at 0.8979 decisively. There is no sign of bottoming and intraday bias is now on the downside for 61.8% retracement at 0.8815. Sustained break there will pave the way to retest 0.8551 low. On the upside, above 0.9000 minor resistance will turn bias neutral and bring consolidations first, before staging another decline.
In the bigger picture, the firm break of 55 D EMA (now at 0.8974) argues that rebound from 0.8551 might be completed as a correction at 0.9243. In other words, larger fall from 1.0146 (2022 high) is possibly not over yet. Risk will now stay on the downside as long as 0.9243 resistance holds. Firm break of 0.8551 will confirm down trend resumption.
Economic Indicators Update
| GMT | Ccy | Events | Actual | Forecast | Previous | Revised |
|---|---|---|---|---|---|---|
| 21:45 | NZD | Trade Balance (NZD) Sep | -2329M | -2291M | -2273M | |
| 23:01 | GBP | GfK Consumer Confidence Oct | -30 | -20 | -21 | |
| 23:30 | JPY | National CPI Y/Y Sep | 3.00% | 3.20% | ||
| 23:30 | JPY | National CPI ex-Fresh Food Y/Y Sep | 2.80% | 2.80% | 3.10% | |
| 23:30 | JPY | National CPI ex Food Energy Y/Y Sep | 4.20% | 4.30% | ||
| 06:00 | GBP | Retail Sales Y/Y Sep | -0.40% | 0.40% | ||
| 06:00 | EUR | Germany PPI M/M Sep | 0.40% | 0.30% | ||
| 06:00 | EUR | Germany PPI Y/Y Sep | -14.20% | -12.60% | ||
| 06:00 | GBP | Public Sector Net Borrowing (GBP) Sep | 17.7B | 10.8B | ||
| 12:30 | CAD | Retail Sales M/M Aug | -0.10% | 0.30% | ||
| 12:30 | CAD | Retail Sales ex Autos M/M Aug | -0.10% | 1.00% |
Technical Outlook and Review
DXY:
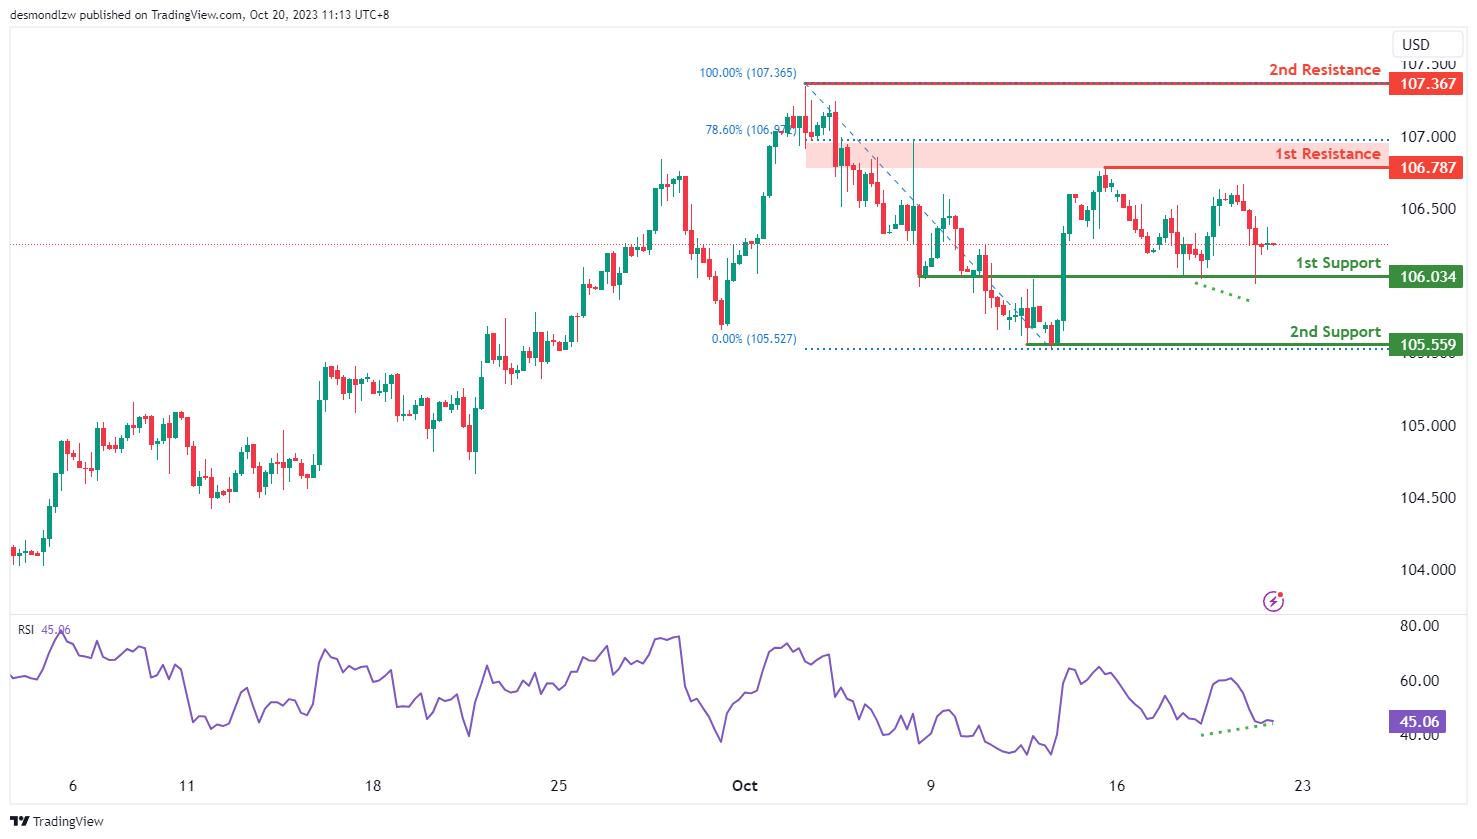
The DXY (US Dollar Index) chart currently displays an overall neutral momentum, suggesting a potential scenario for price to fluctuate between the 1st resistance and the 1st support levels. However, the Relative Strength Index (RSI) is displaying bullish divergence versus price, indicating the likelihood of a bullish move towards the 1st resistance level.
The 1st support level at 106.03 is identified as an overlap support. Additionally, the 2nd support level at 105.56 is identified as a swing-low support, further reinforcing potential price support.
To the upside, the 1st resistance level at 106.79 is characterized as a pullback resistance that aligns close to the 78.60% Fibonacci retracement level. Beyond this, the 2nd resistance level at 107.37 is identified as a swing-high resistance.
EUR/USD:
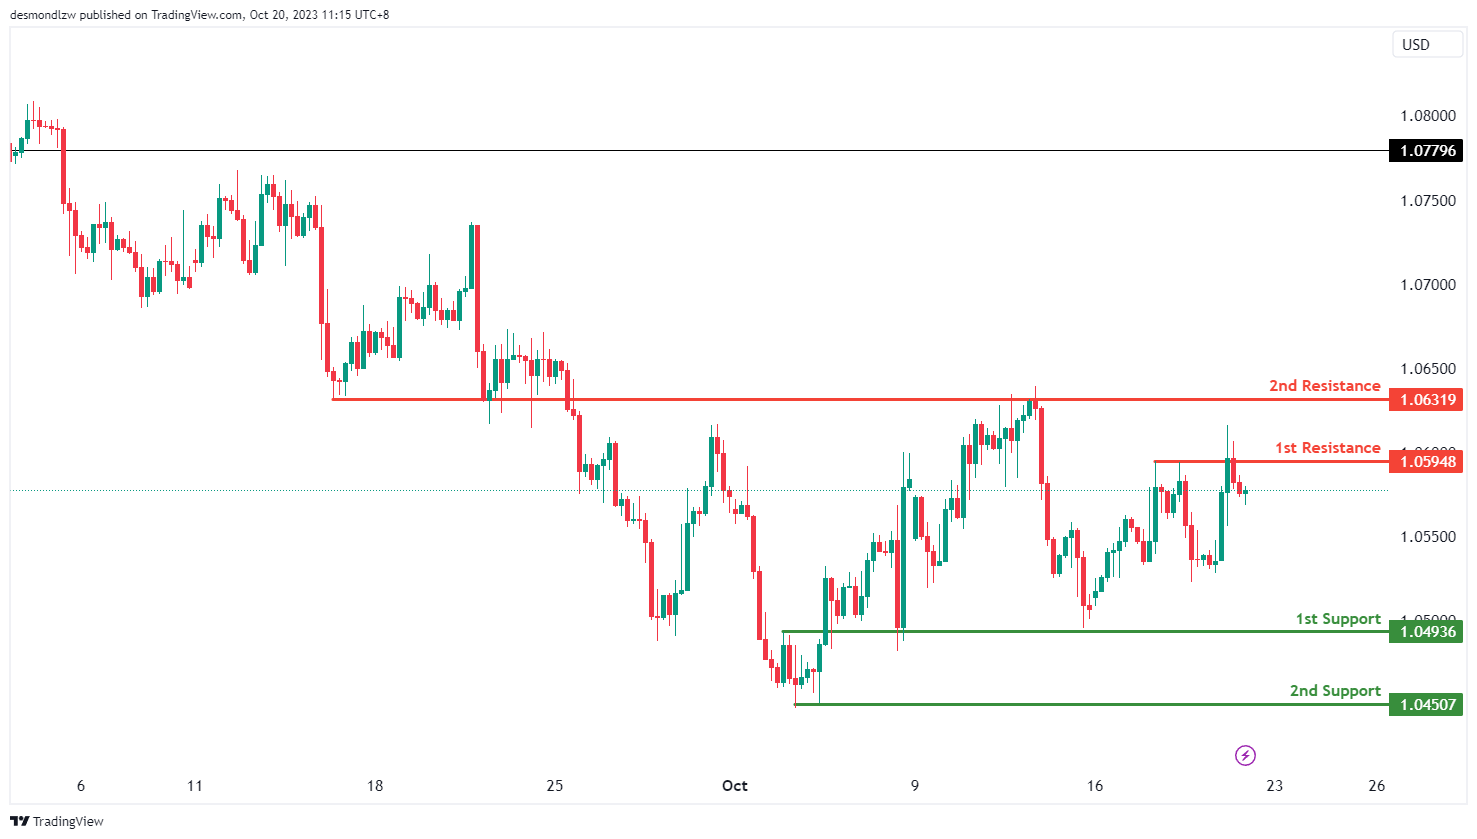
The EUR/USD chart currently demonstrates an overall bearish momentum, indicating a potential scenario for price to make a bearish reaction off the 1st resistance level with a subsequent drop towards the 1st support level.
The 1st resistance level at 1.0595 is characterized as a pullback resistance. Beyond this, the 2nd resistance level at 1.0632 is identified as an overlap resistance, potentially acting as a barrier to further bullish advances.
To the downside, the 1st support level at 1.0494 is identified as an overlap support. Additionally, the 2nd support level at 1.0451 is identified as a swing-low support, further reinforcing a potential zone for price support.
EUR/JPY:
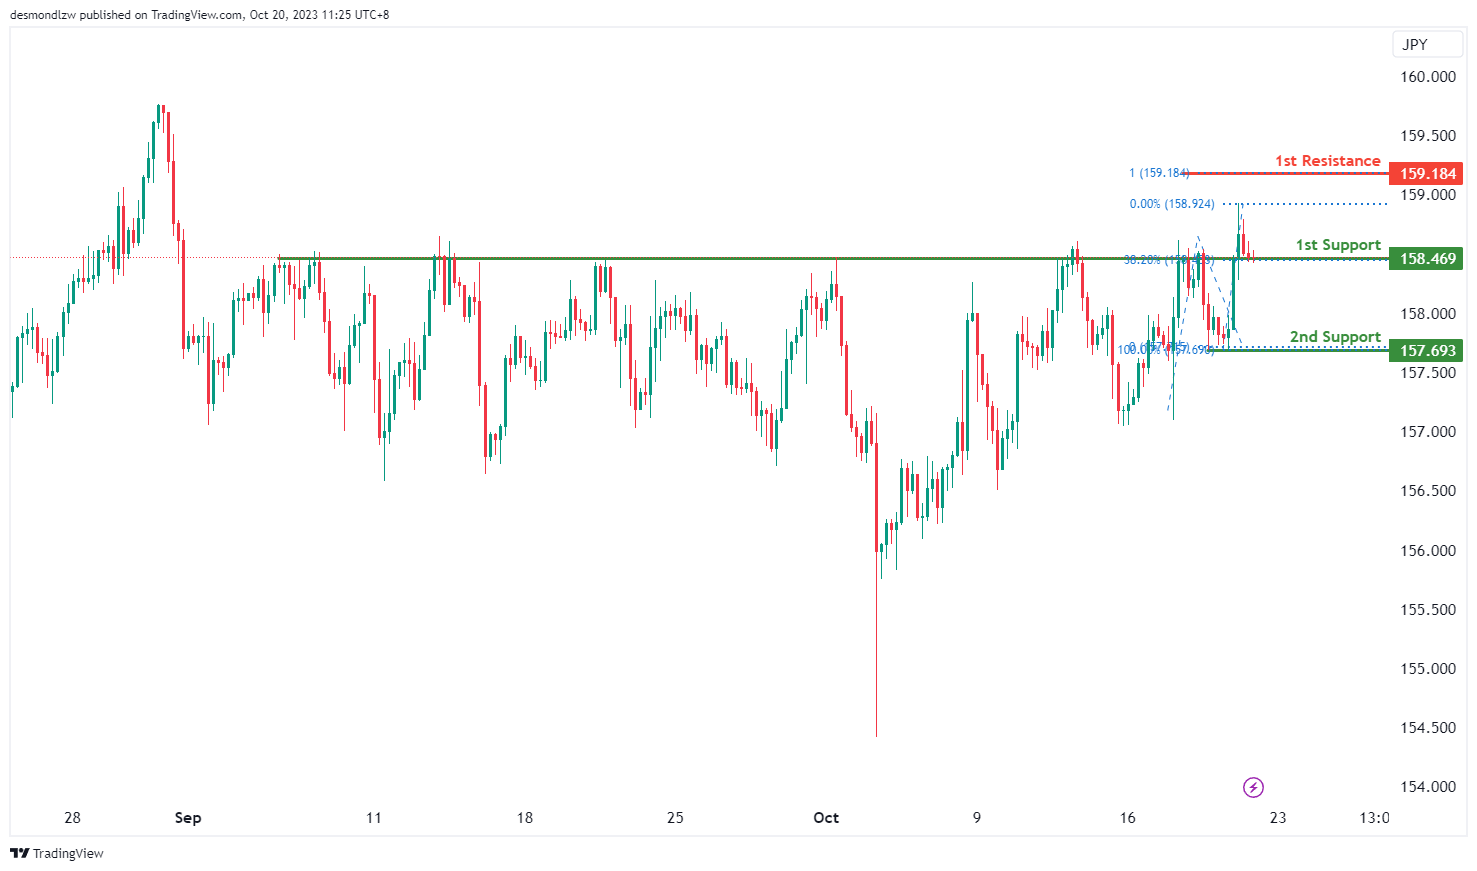
The instrument we are analyzing is EUR/JPY, and the overall momentum of the chart indicates a bullish trend.
There is a possibility that the price may experience a bullish bounce when approaching the first support level and then head towards the first resistance level.
The first support level is at 158.46, and it’s considered strong because it represents an overlap of support and aligns with a 38.20% Fibonacci Retracement.
The second support level is at 157.69, and it’s also significant as it marks a swing low support.
On the resistance side, the first resistance level is at 159.18, and it’s noteworthy as it represents a significant level and aligns with a 100% Fibonacci Projection.
EUR/GBP:
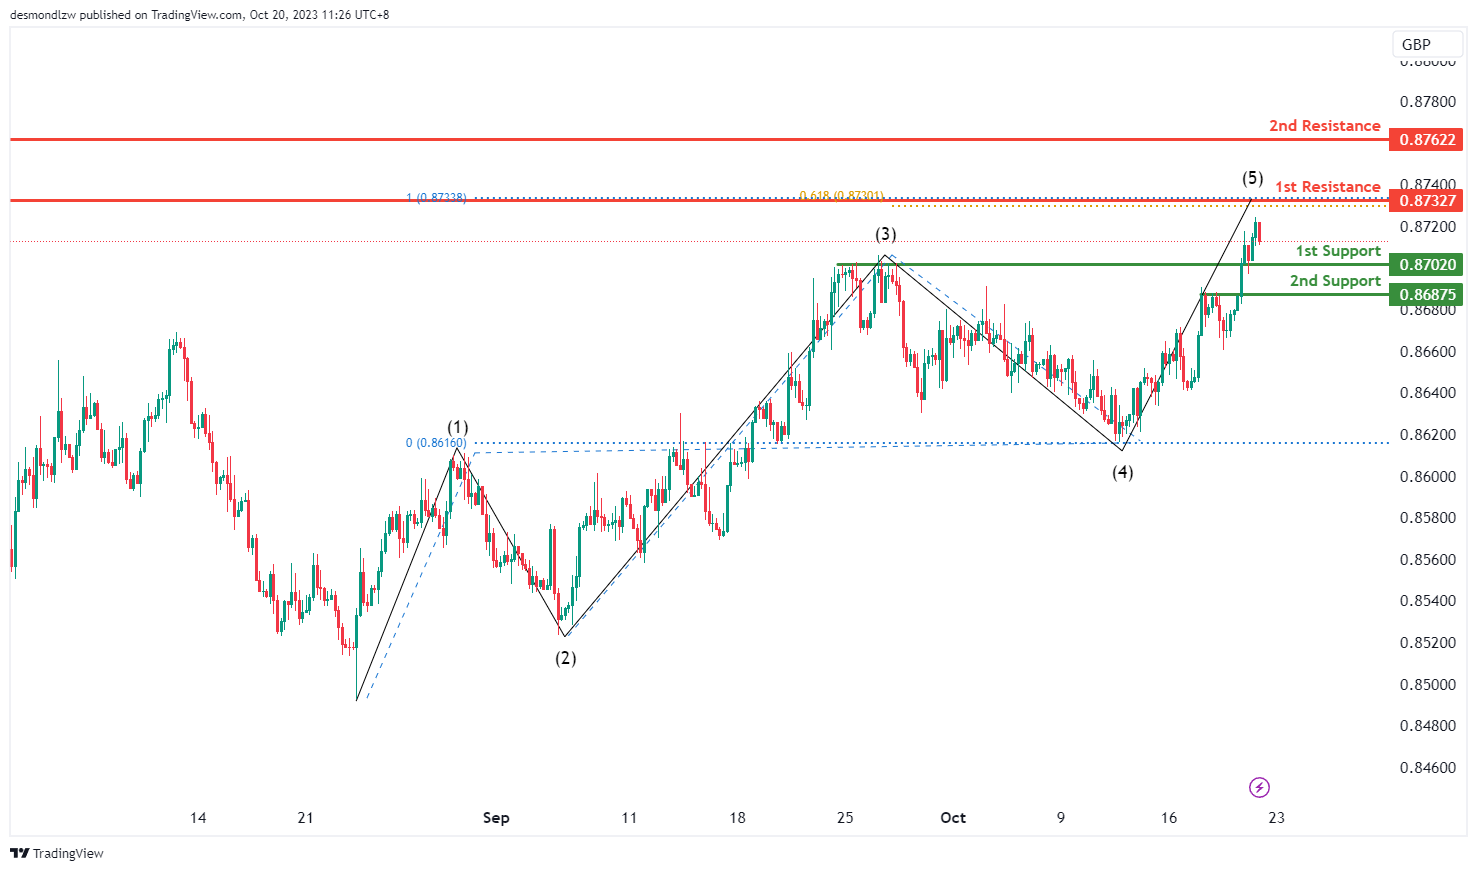
The instrument we are examining is EUR/GBP, and the overall momentum of the chart indicates a bullish trend.
There is a possibility that the price may drop further to the first support level in the short term before bouncing from there and rising to the first resistance level.
The first support level is at 0.8702, and it’s considered strong because it represents an overlap of support.
The second support level is at 0.8687, and it’s also significant as it marks a pullback support.
On the resistance side, the first resistance level is at 0.8732, and it’s noteworthy because it represents an overlap of resistance and is accompanied by a 61.80% Fibonacci Projection and a 100% Fibonacci Projection, indicating a Fibonacci confluence.
The second resistance level is at 0.8762, and it’s significant as well, as it functions as an overlap resistance.
GBP/USD:
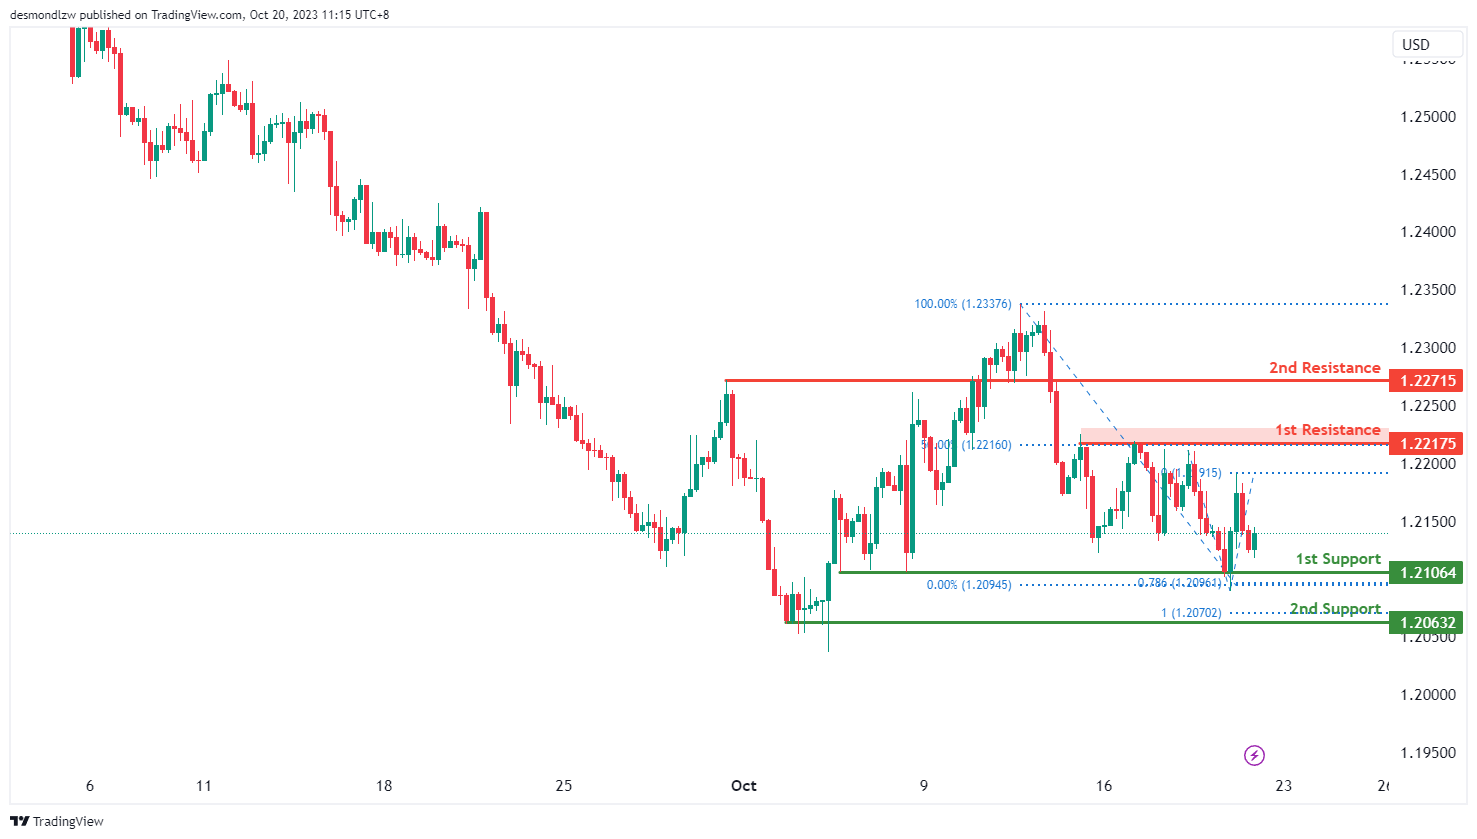
The GBP/USD chart currently exhibits a neutral momentum, suggesting a potential for price to fluctuate between the 1st resistance and the 1st support levels.
The 1st support level at 1.2106 is identified as a pullback support that aligns with the 78.60% Fibonacci projection level. Additionally, the 2nd support level at 1.2063 is identified as a swing-low support that aligns with the 100.00% Fibonacci projection level, adding another layer of potential price support.
To the upside, the 1st resistance level at 1.2218 is characterized as a multi-swing-high resistance that aligns with the 50.00% Fibonacci retracement level. Beyond this, the 2nd resistance level at 1.2272 is identified as an overlap resistance, potentially acting as a barrier to further bullish advances.
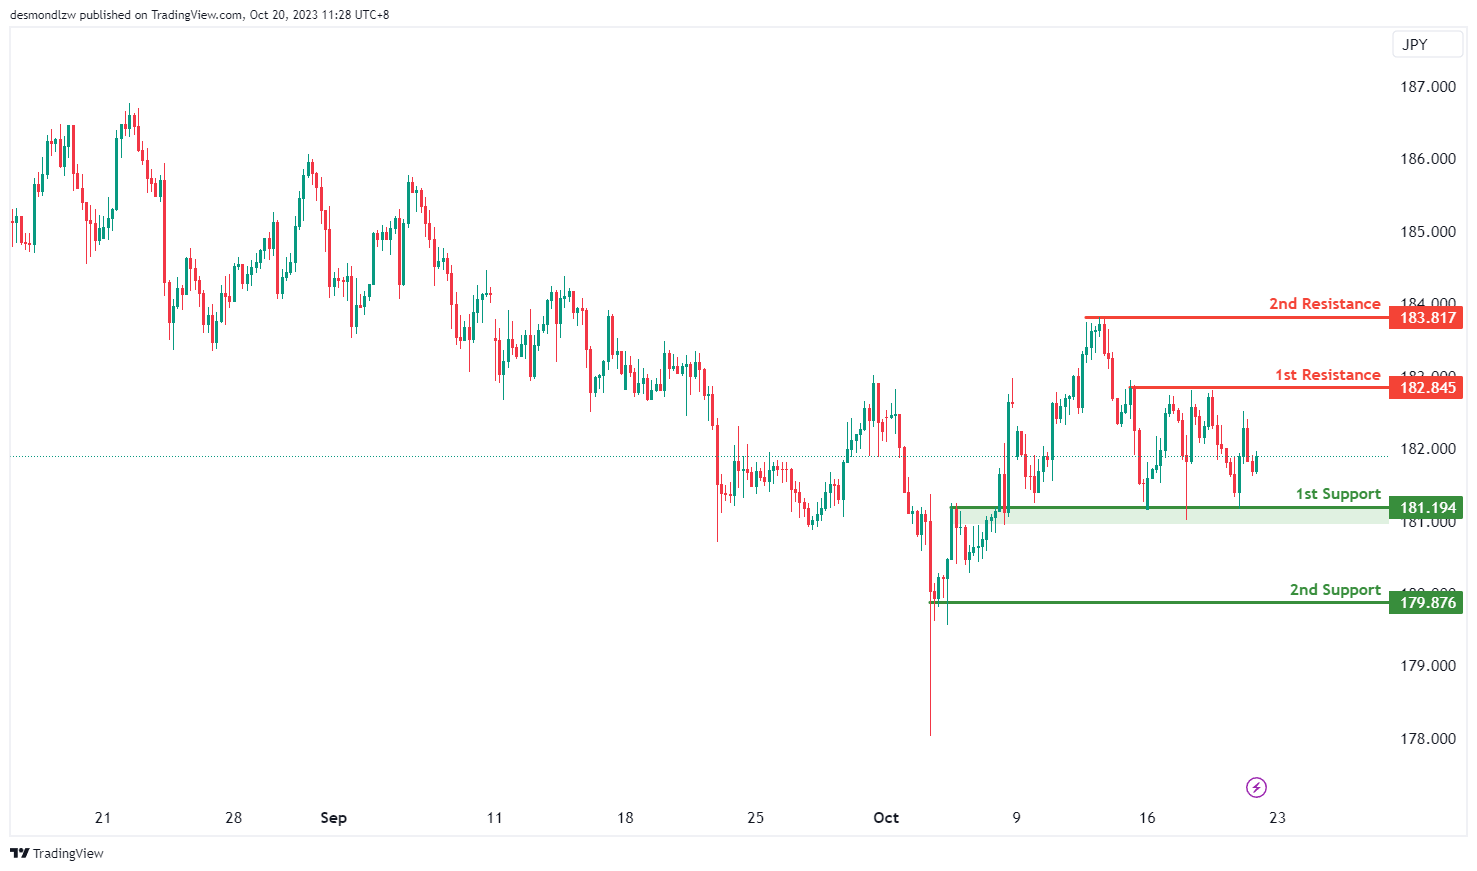
GBP/JPY:
The instrument under analysis is GBP/JPY, and the overall momentum of the chart is currently neutral, indicating a lack of a clear trend.
There is a possibility that the price may fluctuate between the first resistance and first support levels.
The first support level is at 181.19, and it’s considered strong because it represents an overlap of support.
The second support level is at 179.87, and it’s also significant as it marks a swing low support.
On the resistance side, the first resistance level is at 182.84, and it’s noteworthy because it represents a multi-swing high resistance.
The second resistance level is at 183.81, and it’s significant as well, as it represents a swing high resistance.
USD/CHF:
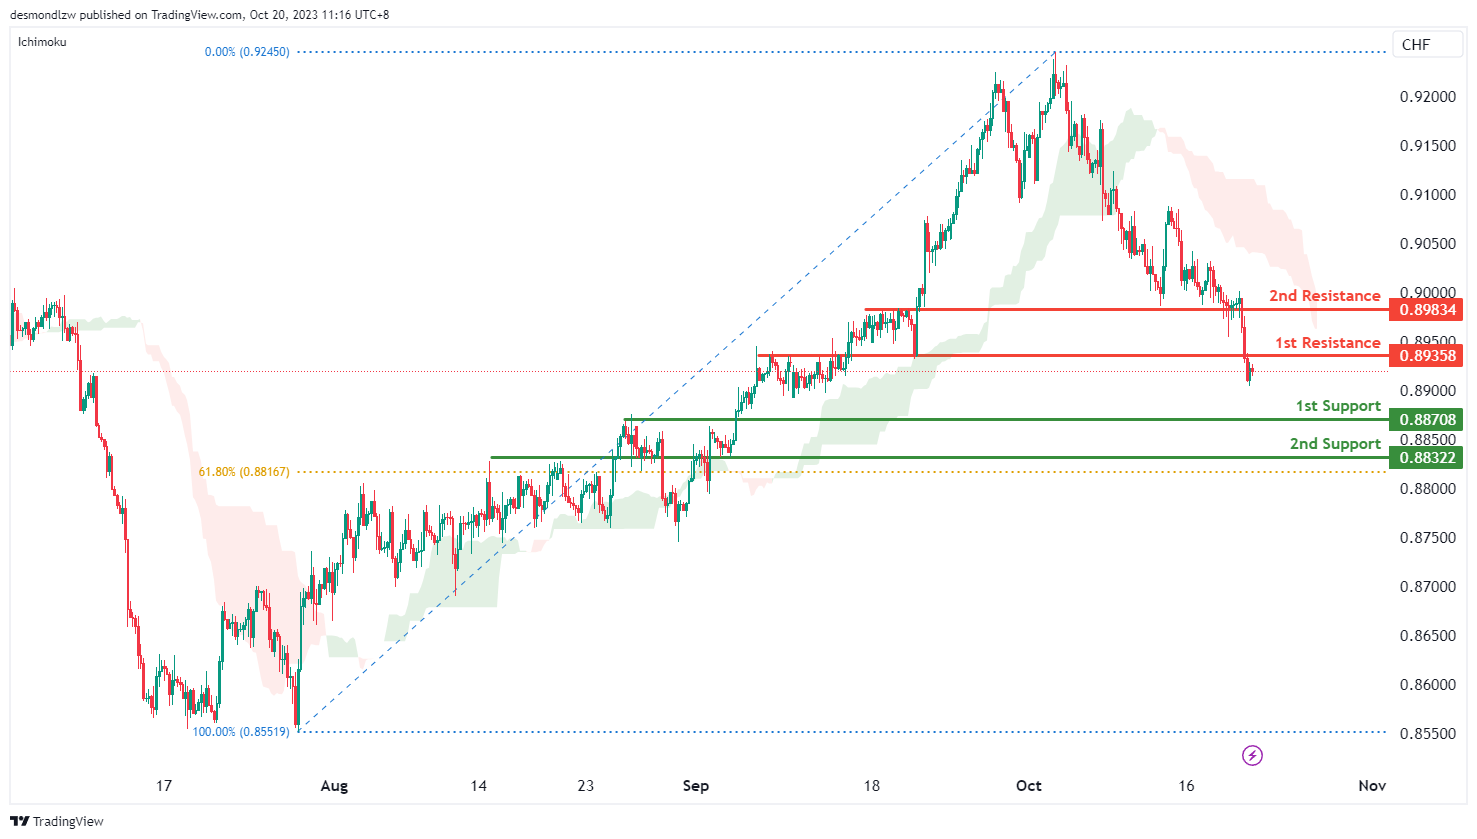
The USD/CHF chart currently indicates a bearish momentum, with price trading under the bearish Ichimoku cloud. This factor suggests a potential scenario for price to make a bearish reaction off the 1st resistance level and drop down towards the 1st support level.
The 1st resistance level at 0.8936 is characterized as an overlap resistance. Beyond this, the 2nd resistance level at 0.8983 is also identified as an overlap resistance, potentially acting as a barrier to further bullish advances.
To the downside, the 1st support level at 0.8871 is identified as a pullback support. Additionally, the 2nd support level at 0.8832 is noted as an overlap support that aligns close to the 61.80% Fibonacci retracement level, reinforcing the strength of potential support.
USD/JPY:
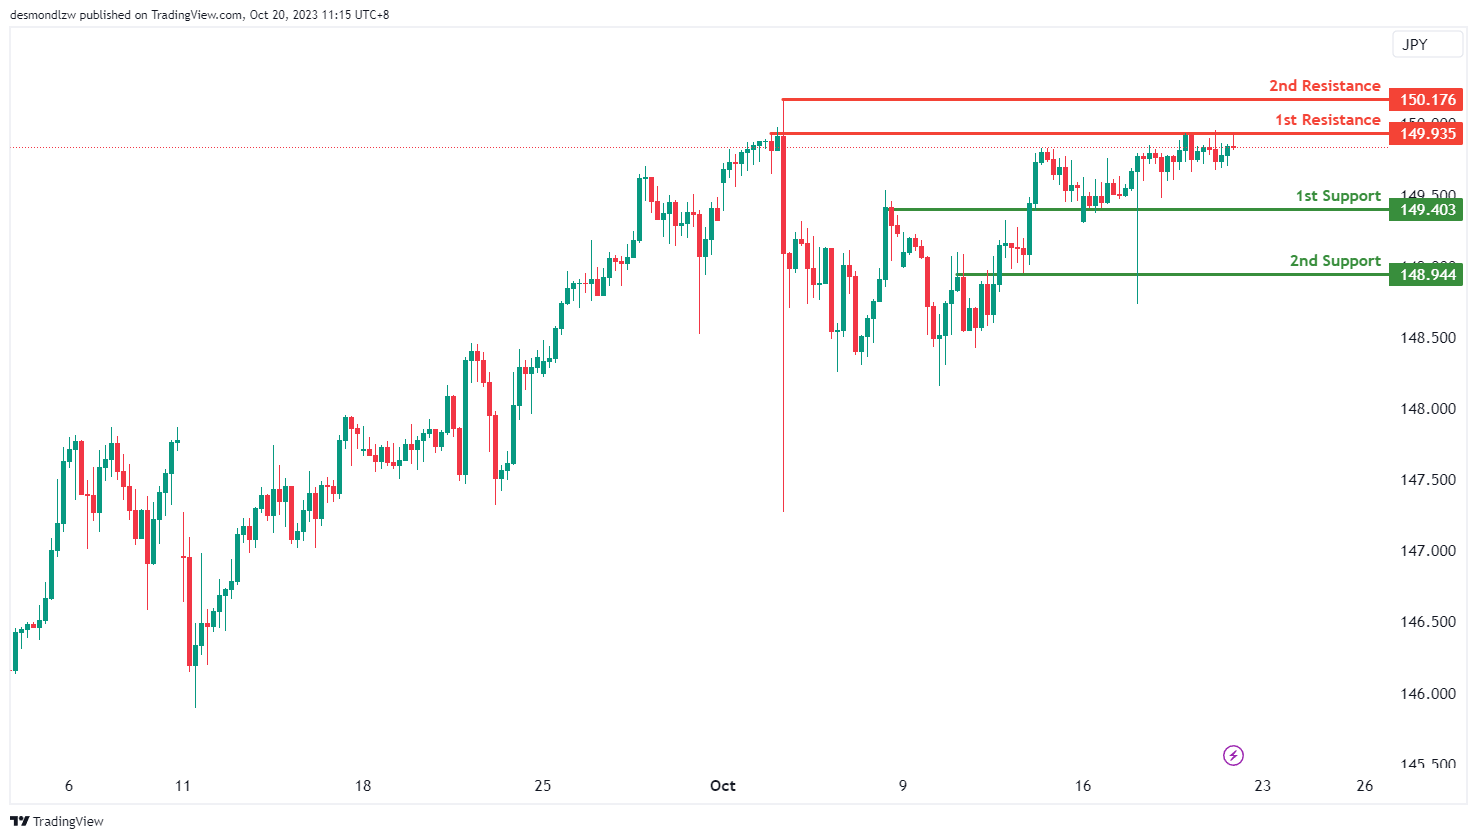
The USD/JPY chart currently shows a neutral momentum, with a potential for price to fluctuate between the 1st resistance and the 1st support levels.
The 1st resistance level at 149.94 is characterized as a pullback resistance level. Beyond this, the 2nd resistance level at 150.18 is identified as a swing-high resistance, potentially acting as a barrier to further bullish advances.
To the downside, the 1st support level at 149.40 is identified as an overlap support. Additionally, the 2nd support level at 148.94 is also noted as an overlap support, providing a strong foundation of potential support.
USD/CAD:
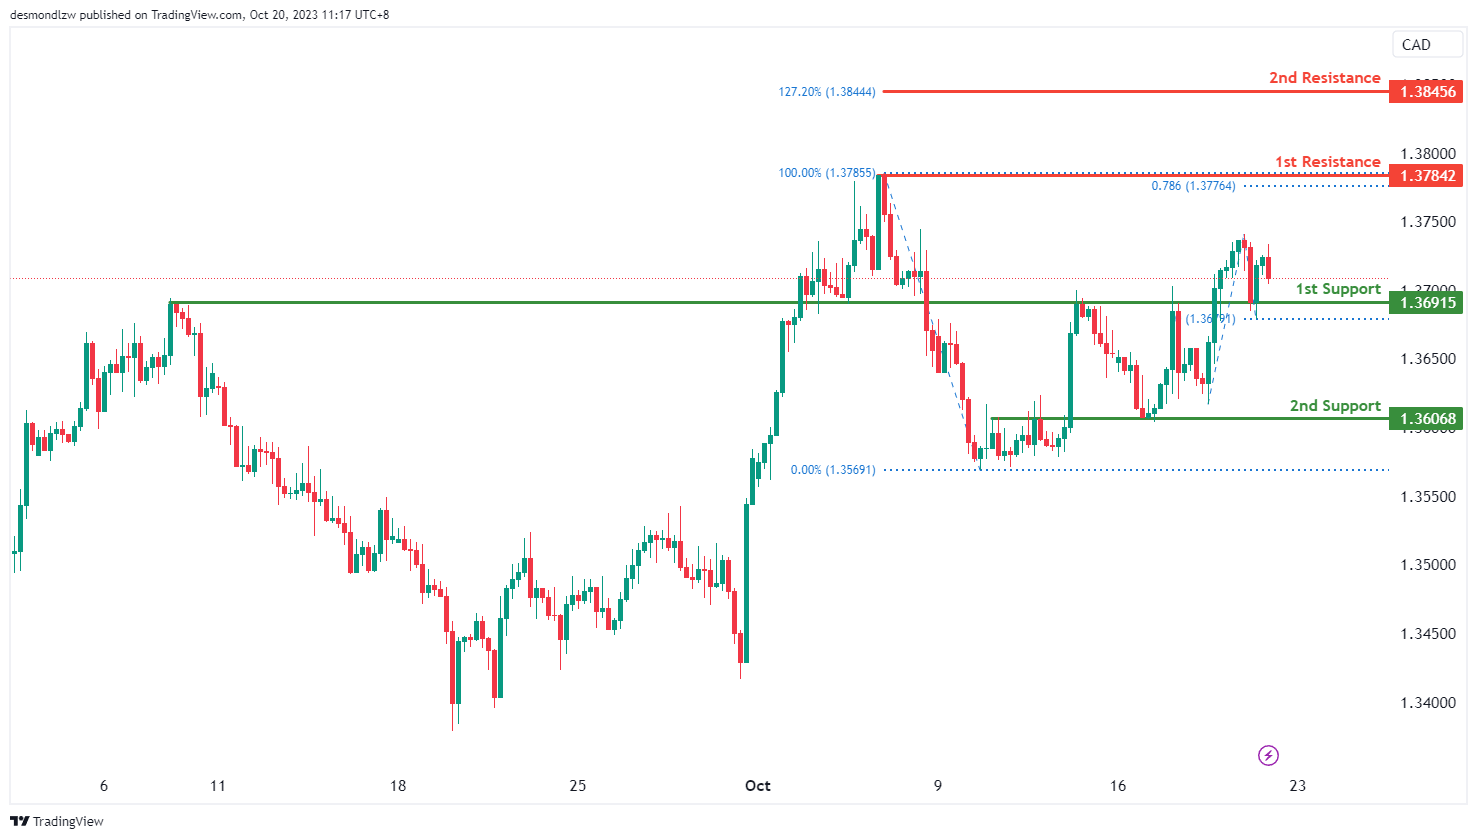
The USD/CAD chart currently exhibits a bullish momentum, suggesting a potential scenario for price to pull back towards the 1st support level before making a bullish bounce towards the 1st resistance level.
The 1st support level at 1.3692 is identified as an overlap support. Additionally, the 2nd support level at 1.3607 is also noted as an overlap support, adding to its significance as a potential support zone.
To the upside, the 1st resistance level at 1.3784 is identified as a swing-high resistance that aligns with the 78.60% Fibonacci projection level. Higher up, the 2nd resistance level at 1.3846 is noted as a resistance level that aligns with the 127.20% Fibonacci extension level, potentially acting as a barrier to further bullish advances.
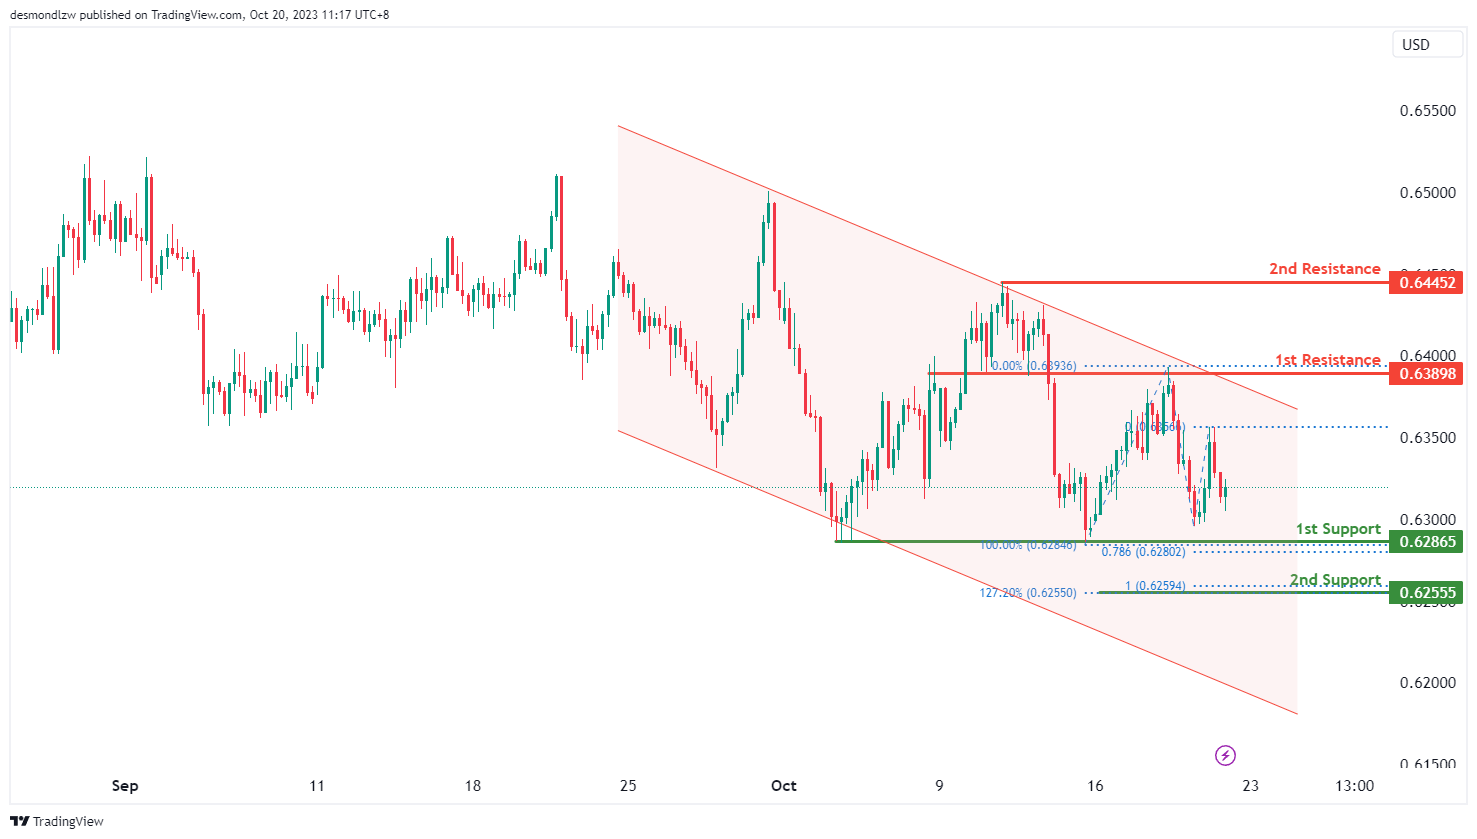
AUD/USD:
The AUD/USD chart currently exhibits a bearish momentum, with price trading within a bearish channel. This factor indicates a potential scenario for price to make a bearish continuation towards the 1st support level.
The 1st support level at 0.6287 is identified as a multi-swing-low support that aligns with the 78.60% Fibonacci projection level. Additionally, the 2nd support level at 0.6256 is marked as a support level that aligns with a confluence of Fibonacci levels i.e. the 127.20% extension and the 100.00% projection levels, further reinforcing its importance as a potential support area.
To the upside, the 1st resistance level at 0.6389 is identified as an overlap resistance. Beyond this, the 2nd resistance level at 0.6445 is marked as a swing-high resistance, making it a potentially strong resistance level.
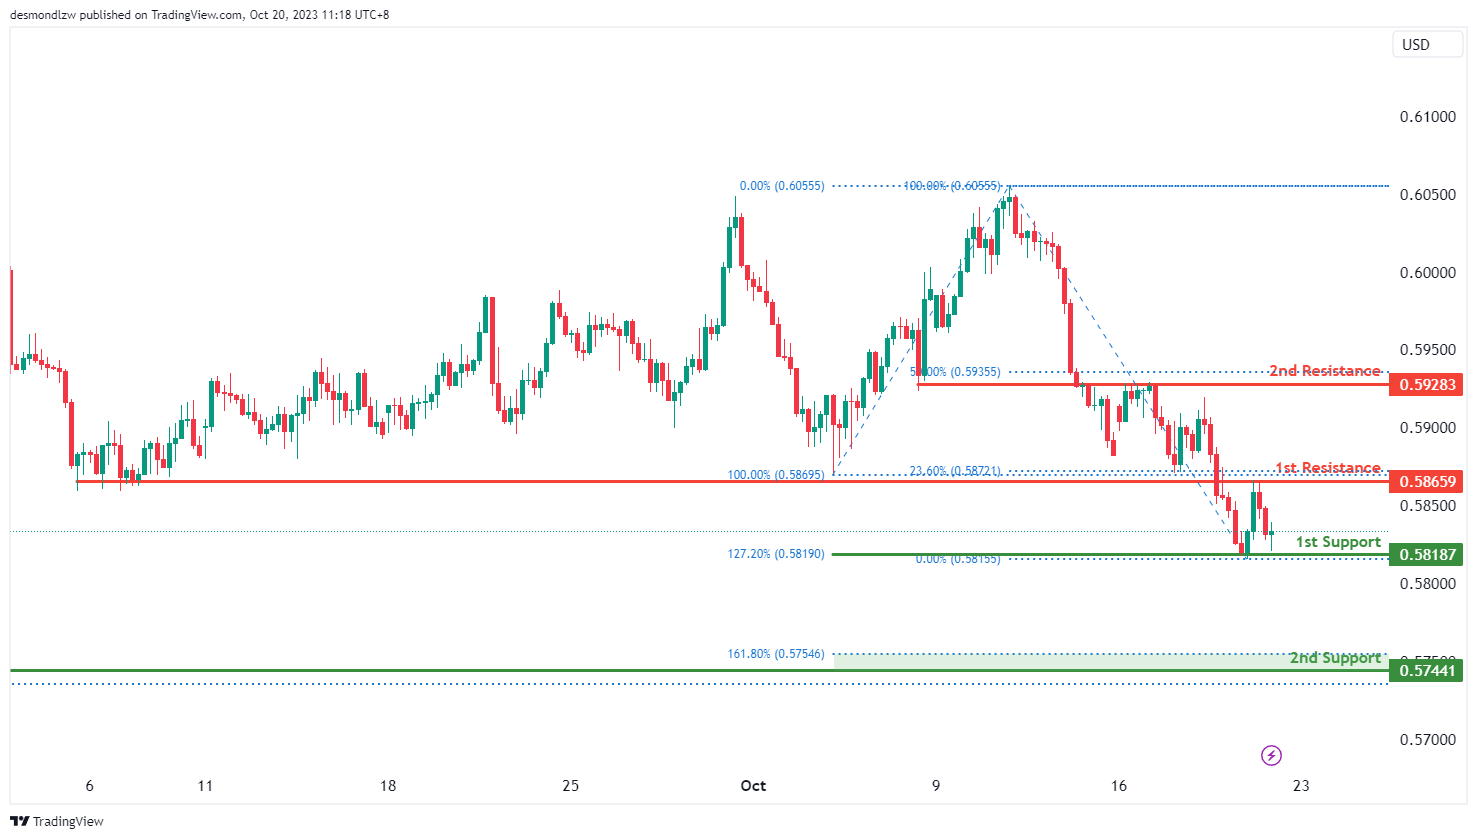
NZD/USD
The NZD/USD chart currently exhibits a bearish momentum, suggesting a potential scenario for price to make a bearish continuation towards the 1st support level.
The 1st support level at 0.5819 is identified as a pullback support that aligns with the 127.20% Fibonacci extension level. Further below, the 2nd support level at 0.5744 is also noted as a pullback support that aligns with the 161.80% Fibonacci extension level, indicating a potential support zone.
To the upside, the 1st resistance level at 0.5866 is identified as an overlap resistance that aligns with the 23.60% Fibonacci retracement level. Beyond this, the 2nd resistance level at 0.5928 is also marked as an overlap resistance that aligns with the 50.00% Fibonacci retracement level, making it a potentially strong resistance level.
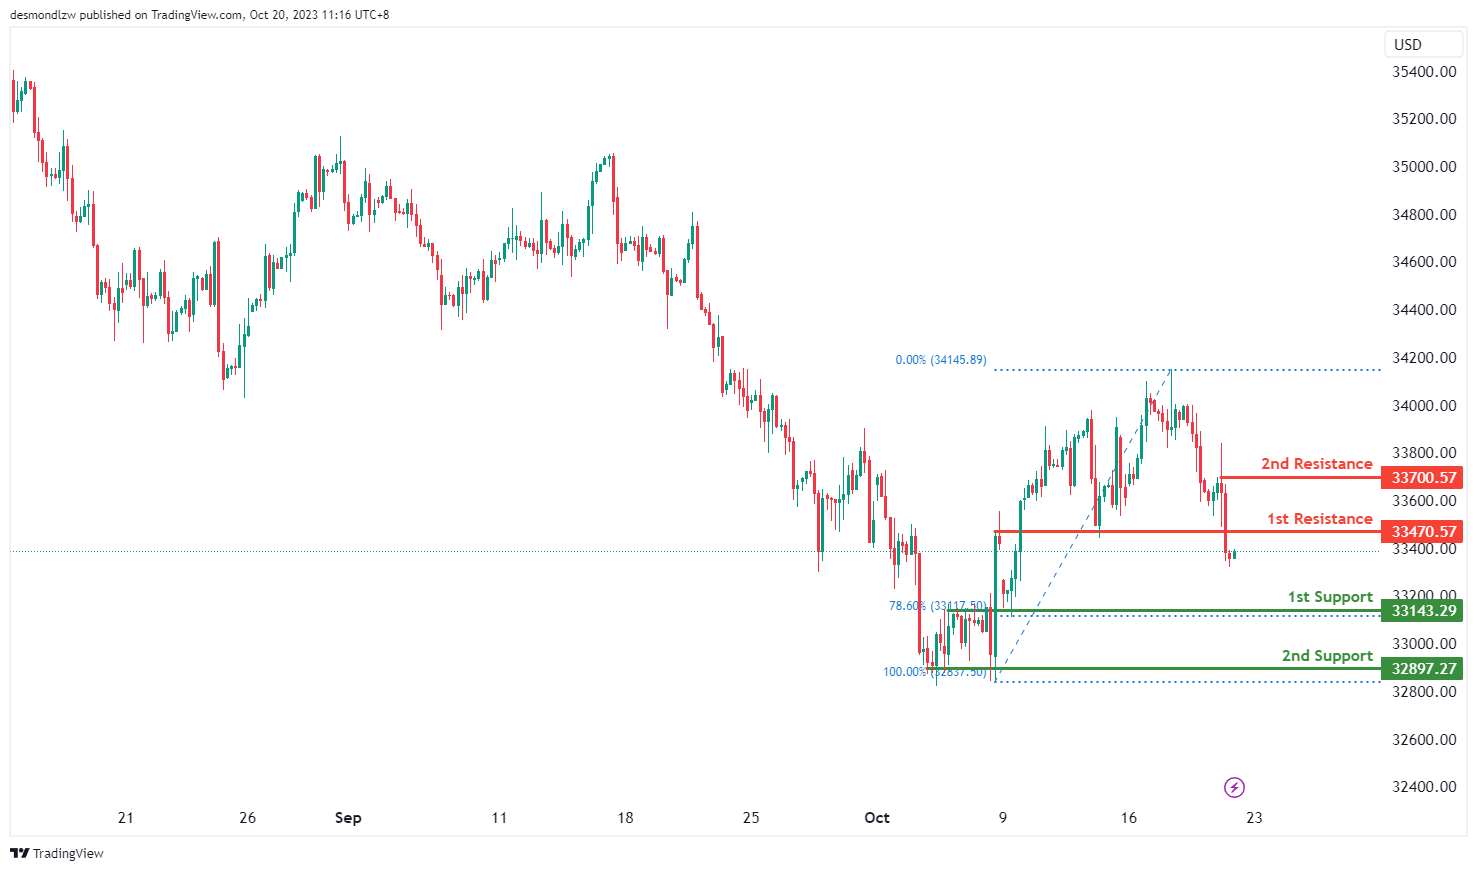
DJ30:
The instrument we are analyzing is DJ30, and the overall momentum of the chart indicates a bearish trend.
There is a possibility that the price may experience a bearish reaction when approaching the first resistance level and subsequently drop to the first support level.
The first support level is at 33143.29, and it’s considered strong because it represents an overlap of support and aligns with a 78.60% Fibonacci Retracement.
The second support level is at 32897.27, and it’s also significant as it marks a multi-swing low support.
On the resistance side, the first resistance level is at 33470.57, and it’s noteworthy because it represents an overlap of resistance.
The second resistance level is at 33700.57, and it’s significant as well, as it functions as a pullback resistance.
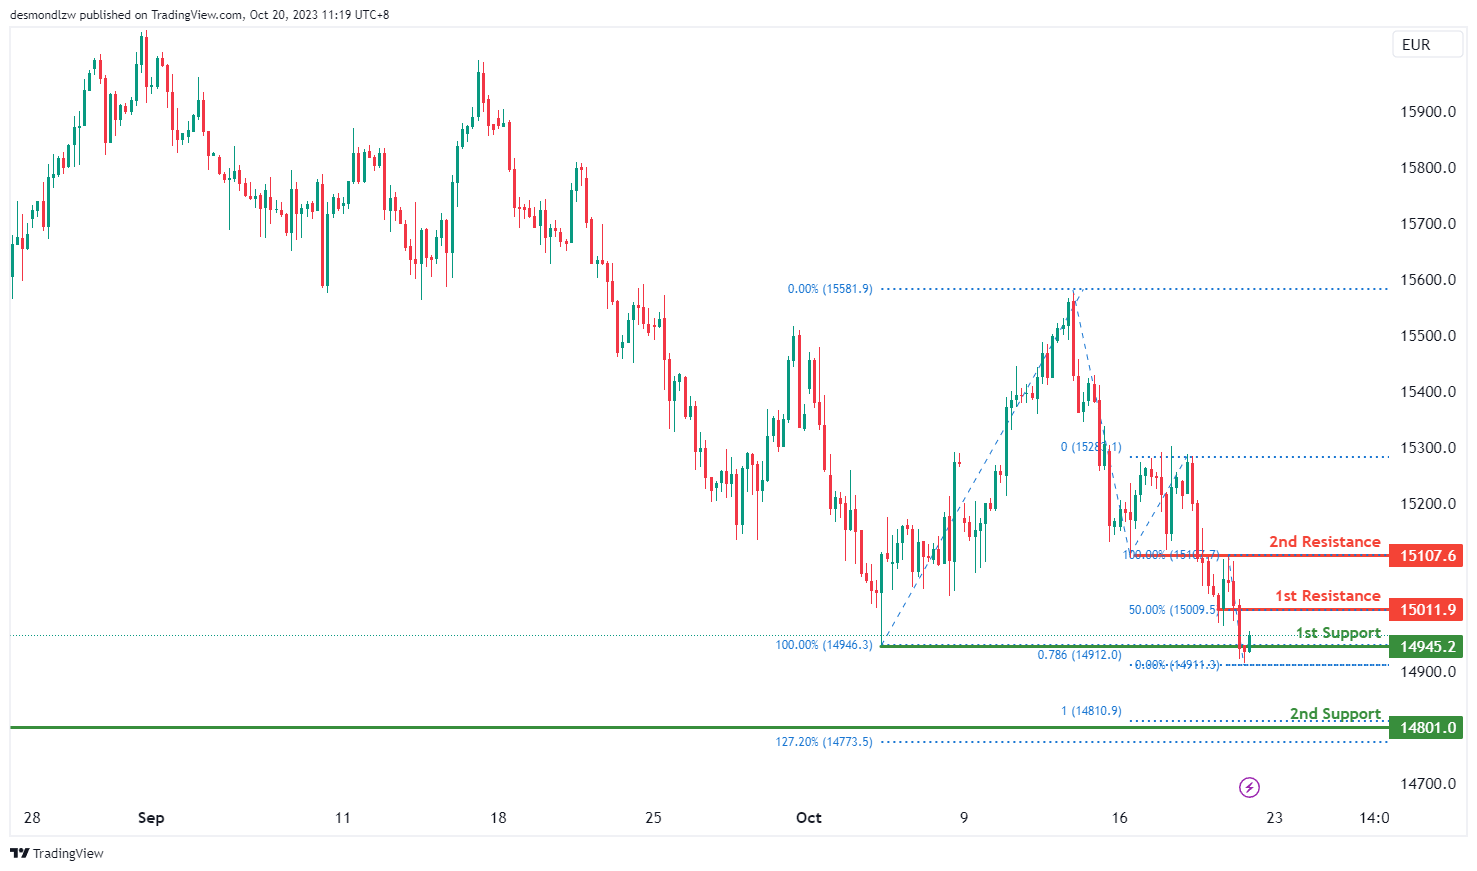
GER40:
The instrument we are examining is GER40, and the overall momentum of the chart indicates a bearish trend.
There is a possibility that the price may initially rise towards the first resistance level in the short term before reversing off it and dropping towards the first support level.
The first support level is at 14945.20, and it’s considered strong because it represents a multi-swing low support and aligns with a 78.60% Fibonacci Projection.
The second support level is at 14801.00, and it’s also significant as it marks a swing low support and corresponds to a 100% Fibonacci Projection and a 127.20% Fibonacci Extension, indicating a Fibonacci confluence.
On the resistance side, the first resistance level is at 15011.90, and it’s noteworthy because it represents a pullback resistance and is associated with a 50% Fibonacci Retracement.
The second resistance level is at 15107.60, and it’s significant as well, as it functions as an overlap resistance.
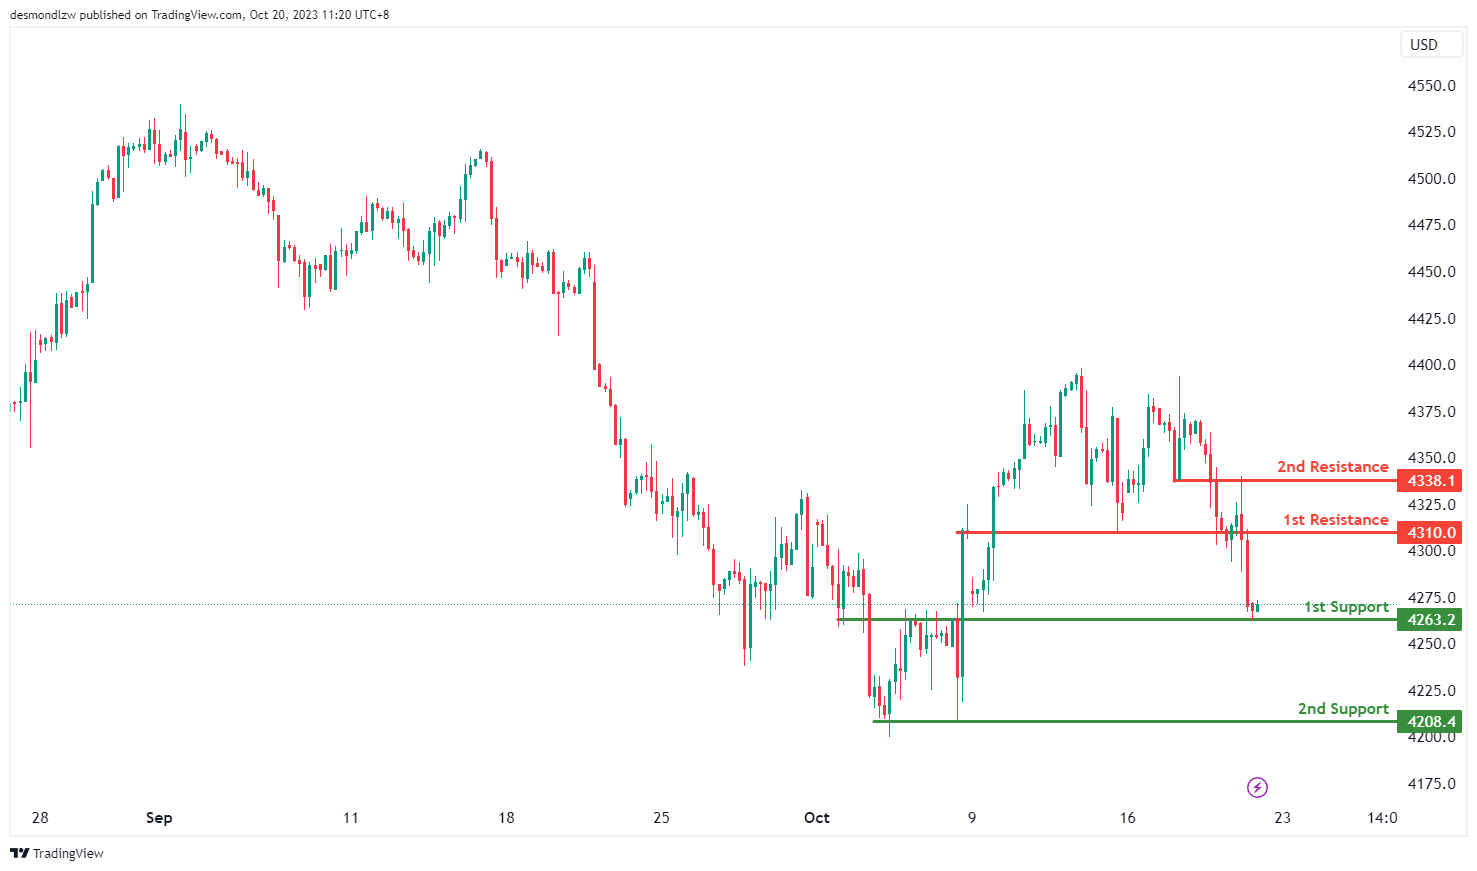
US500
The instrument we are analyzing is US500, and the overall momentum of the chart indicates a bullish trend.
There is a possibility that the price may experience a bullish bounce when approaching the first support level and then head towards the first resistance level.
The first support level is at 4263.2, and it’s considered strong because it represents an overlap of support.
The second support level is at 4208.4, and it’s also significant as it marks a multi-swing low support.
On the resistance side, the first resistance level is at 4310.0, and it’s noteworthy because it represents an overlap of resistance.
The second resistance level is at 4338.1, and it’s significant as well, as it functions as an overlap resistance.
BTC/USD:
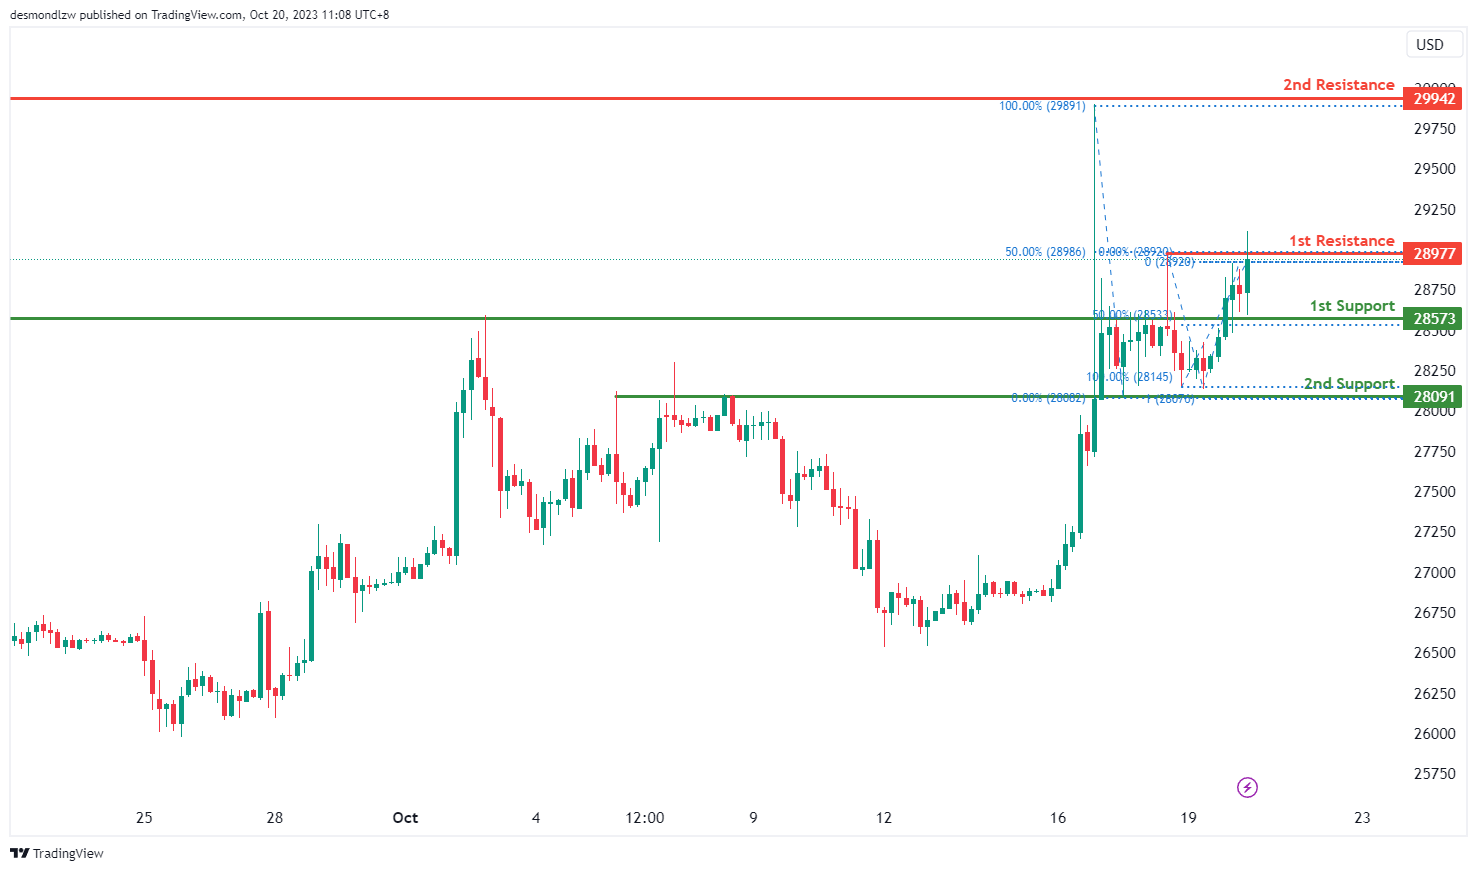
The instrument we are analyzing is BTC/USD, and the overall momentum of the chart indicates a bearish trend.
There is a possibility that the price may experience a bearish reaction when approaching the first resistance level and subsequently drop to the first support level.
The first support level is at 28573, and it’s considered strong because it represents an overlap of support and aligns with a 50% Fibonacci Retracement.
The second support level is at 28091, and it’s also significant as it marks another overlap of support and corresponds to a 100% Fibonacci Projection.
On the resistance side, the first resistance level is at 28977, and it’s noteworthy because it represents a swing high resistance and is associated with a 50% Fibonacci Retracement.
The second resistance level is at 29942, and it’s significant as well, as it represents a multi-swing high resistance.
ETH/USD:
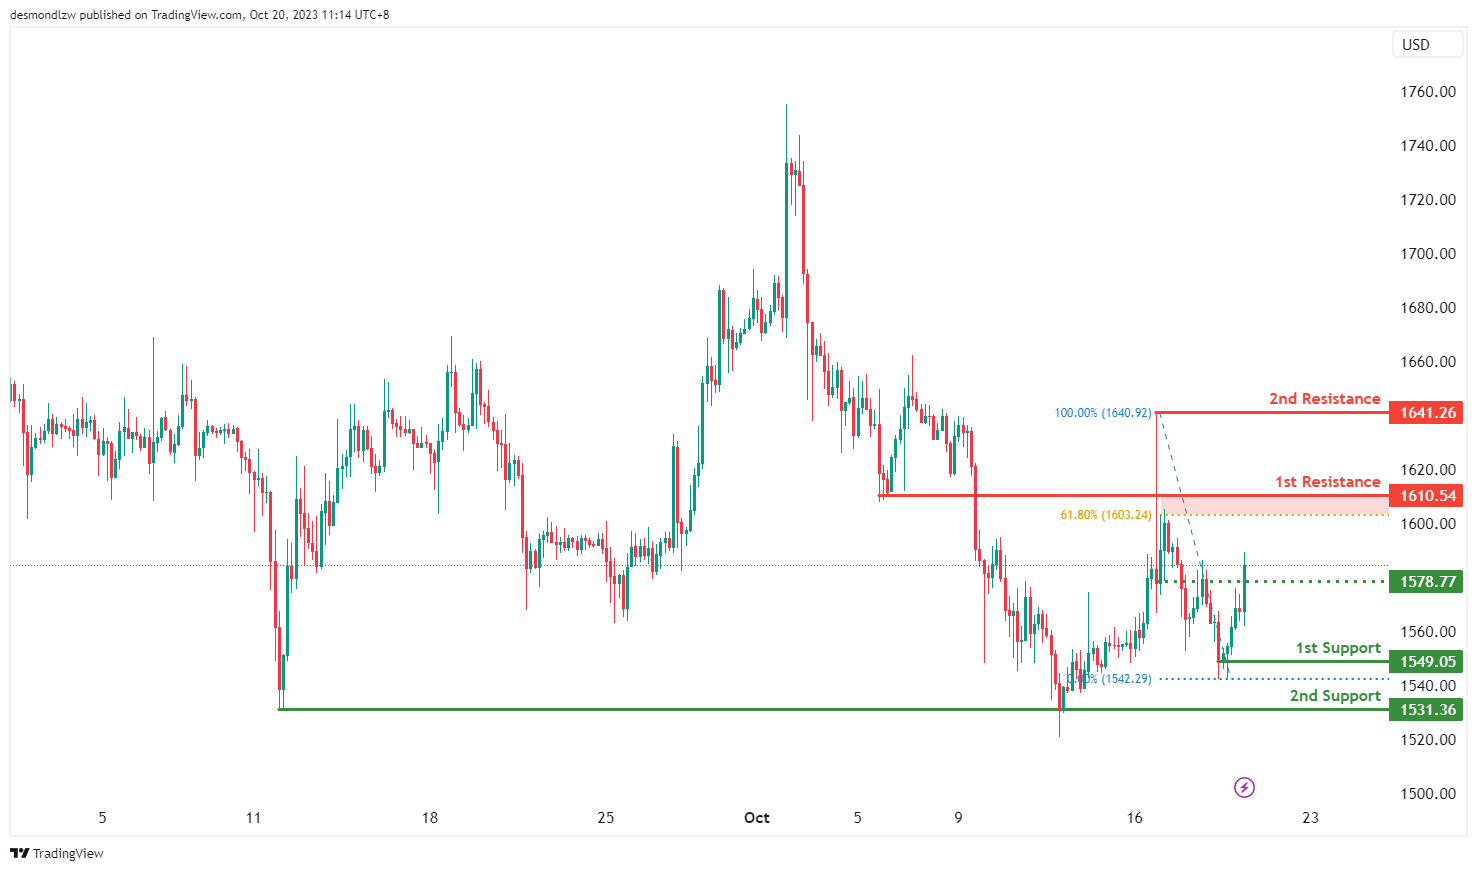
The instrument under analysis is ETH/USD, and the overall momentum of the chart indicates a bullish trend.
There is a possibility that the price may experience a bullish break through the first resistance level and subsequently rise to the second resistance level.
The first support level is at 1,548.68, and it’s considered strong because it represents a swing low support.
The second support level is at 1,531.36, and it’s also significant as it marks a multi-swing low support.
On the resistance side, the first resistance level is at 1,578.77, and it’s noteworthy because it represents an overlap of resistance.
The second resistance level is at 1,610.54, and it’s significant as well, as it functions as an overlap resistance and coincides with a 61.80% Fibonacci Retracement.
WTI/USD:
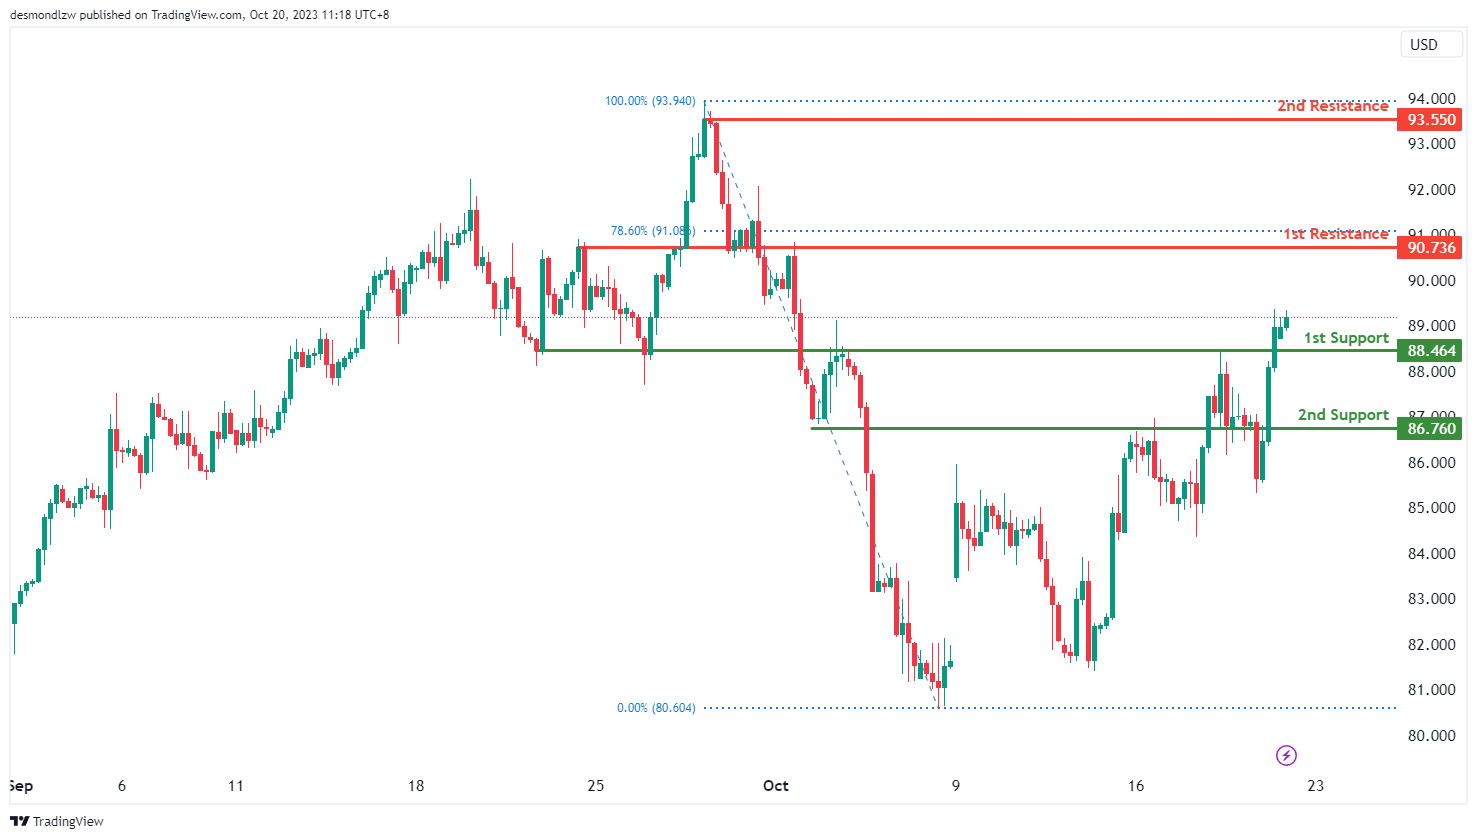
The WTI chart currently shows a bullish momentum, indicating a potential scenario for price to make a bullish continuation towards the 1st resistance level.
The 1st resistance level at 90.74 is identified as an overlap resistance that aligns close to the 78.60% Fibonacci retracement level. Beyond this, the 2nd resistance level at 93.55 is marked as a swing-high resistance, making it a potentially strong resistance level.
To the downside, the 1st support level at 88.46 is identified as an overlap support level. Additionally, the 2nd support level at 86.76 is also noted as an overlap support, indicating a potential support zone.
XAU/USD (GOLD):
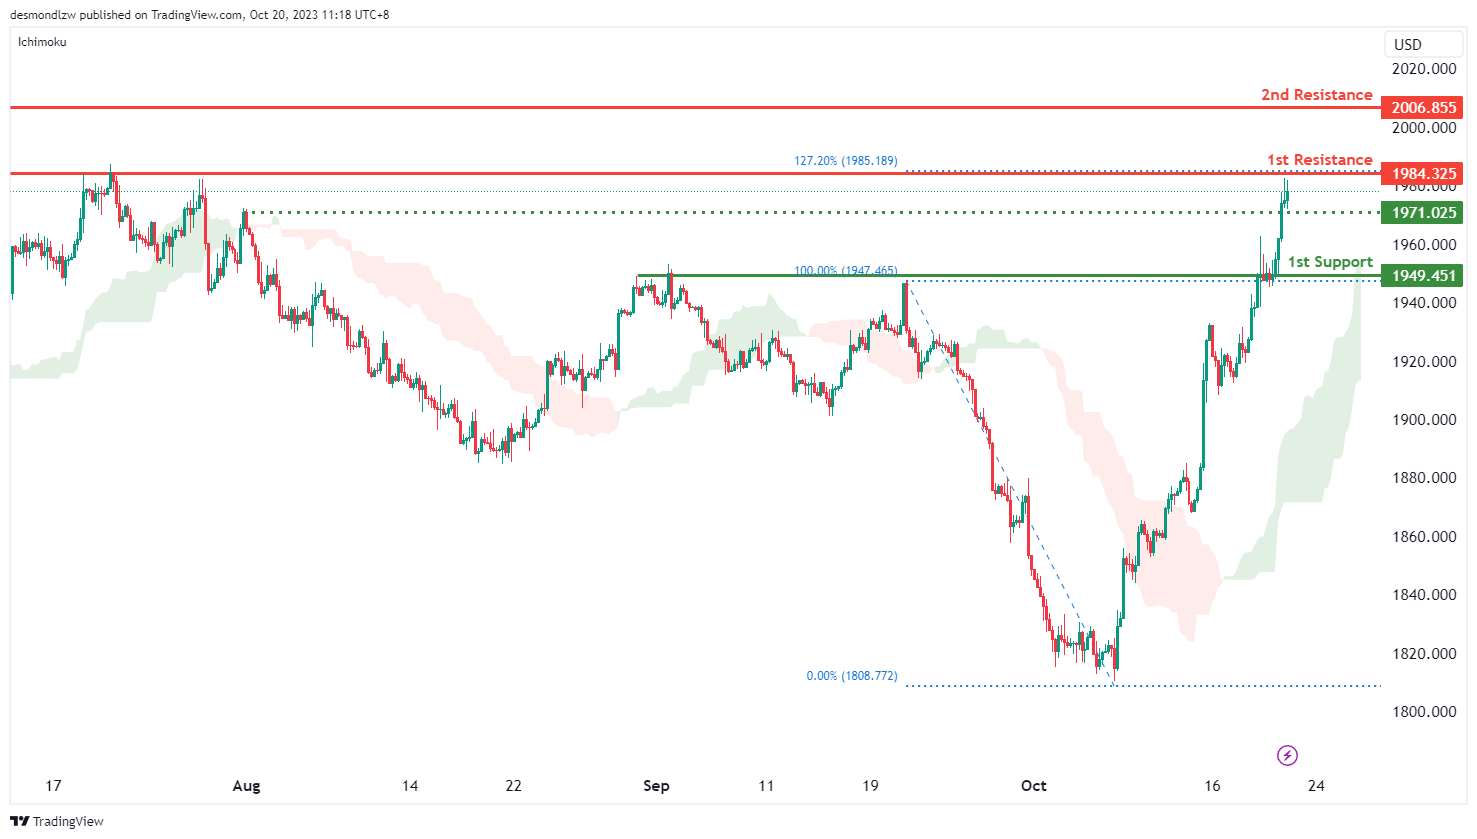
The Gold (XAU/USD) chart currently exhibits a bullish momentum, with price trading above the bullish Ichimoku cloud. There is a potential scenario for price to make a bullish continuation towards the 1st resistance level.
The 1st resistance level at 1,984.33 is characterized as a pullback resistance that coincides with the 127.20% Fibonacci retracement level. Beyond this, the 2nd resistance level at 2,006.86 is identified as an overlap resistance, providing a strong potential resistance point.
To the downside, the intermediate support at 1,971.03 is noted as a pullback support. Additionally, the 1st support level at 1,949.45 is marked as an overlap support, indicating a potential support zone.