

Sample Category Title
Gold: Continues to Trend Higher on Rising Geopolitical Tensions
Gold extends steep rally and hit three-month high in early Friday, strongly supported by growing demand for safe haven on overheated situation in the Middle East, which threatens to escalate into possible broader regional crisis with unforeseeable consequences.
The yellow metal was up 4.5% last week and is on track for another strong advance this week (around 2.7% so far), with $50 increase seen in past two days.
Adding to support from geopolitics were the latest comments from Fed Chair Powell, who said that financial conditions were tightened by rise in bond yields which might be sufficient to keep the Fed on hold in its November policy meeting.
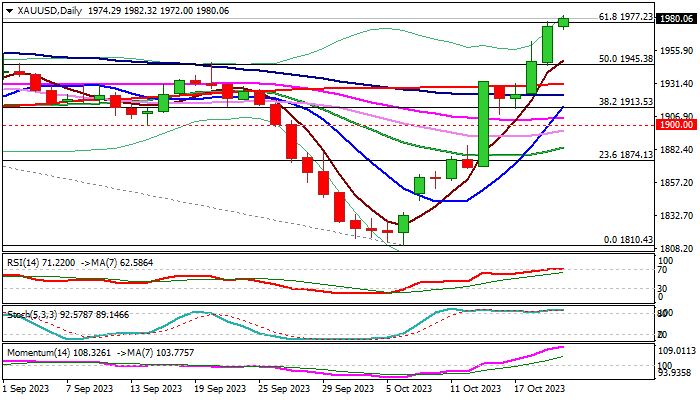
Fresh acceleration on Friday broke through important Fibo barrier at $1977 (61.8% of $2080/$1810 fall), generating fresh bullish signal, which will require confirmation on weekly close above this level and open way for attack at psychological $2000 barrier.
Technical studies are in full bullish configuration on daily chart but overbought, suggesting that bulls may take a breather in coming sessions.
Consolidation in current strongly favorable conditions for gold should be limited and offer better levels to re-enter strong bullish market, with dips to find solid support at $1950 zone.
Only significant decrease in geopolitical tensions, which so far looks very unlikely, would hurt bulls and push the price lower.
Res: 1987; 1997; 2000; 2010.
Sup: 1977; 1962; 1952; 1945.
AUD/USD and NZD/USD Signal More Downsides
AUD/USD declined below the 0.6355 and 0.6330 support levels. NZD/USD is also moving lower and might trade below the 0.5800 zone.
Important Takeaways for AUD/USD and NZD/USD Analysis Today
- The Aussie Dollar started a fresh decline from well above the 0.6355 level against the US Dollar.
- There is a key bearish trend line forming with resistance near 0.6330 on the hourly chart of AUD/USD at FXOpen.
- NZD/USD declined steadily from the 0.5930 resistance zone.
- There is a connecting bearish trend line forming with resistance near 0.5840 on the hourly chart of NZD/USD at FXOpen.
AUD/USD Technical Analysis
On the hourly chart of AUD/USD at FXOpen, the pair struggled to clear the 0.6400 zone. The Aussie Dollar started a fresh decline below the 0.6355 support against the US Dollar.
The pair even settled below 0.6330 and the 50-hour simple moving average. A low was formed near 0.6295 before there was an upside correction. The pair climbed above the 50% Fib retracement level of the downward move from the 0.6393 swing high to the 0.6295 low.
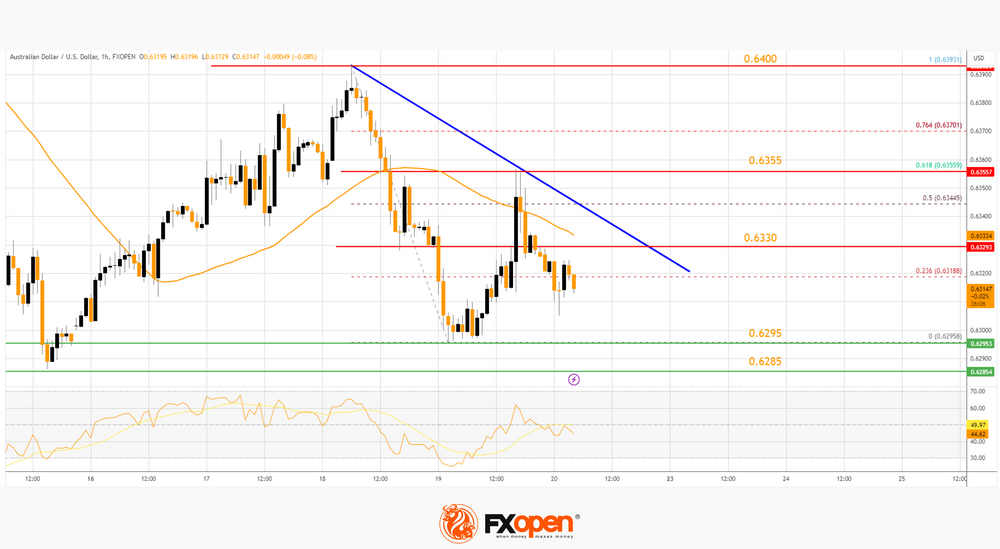
However, the bears were active near the 0.6355 resistance zone. It failed to clear the 61.8% Fib retracement level of the downward move from the 0.6393 swing high to the 0.6295 low.
There is also a key bearish trend line forming with resistance near 0.6330. On the downside, initial support is near the 0.6295 low. The next support sits at 0.6285. If there is a downside break below 0.6285, the pair could extend its decline.
The next support could be 0.6250. Any more losses might send the pair toward the 0.6220 support. On the upside, an immediate resistance is near the trend line at 0.6330.
The next major resistance is near 0.6355, above which the price could rise toward 0.6400. Any more gains might send the pair toward 0.6420. A close above the 0.6420 level could start another steady increase in the near term. The next major resistance on the AUD/USD chart could be 0.6500.
NZD/USD Technical Analysis
On the hourly chart of NZD/USD on FXOpen, the pair also followed a similar pattern and declined from the 0.5930 zone. The New Zealand Dollar gained bearish momentum and traded below 0.5870 against the US Dollar.
The pair even tested the 0.5815 zone before there was a minor recovery wave. The pair climbed above the 23.6% Fib retracement level of the downward move from the 0.5916 swing high to the 0.5815 low. However, it failed to surpass the 50-hour simple moving average at 0.5870.
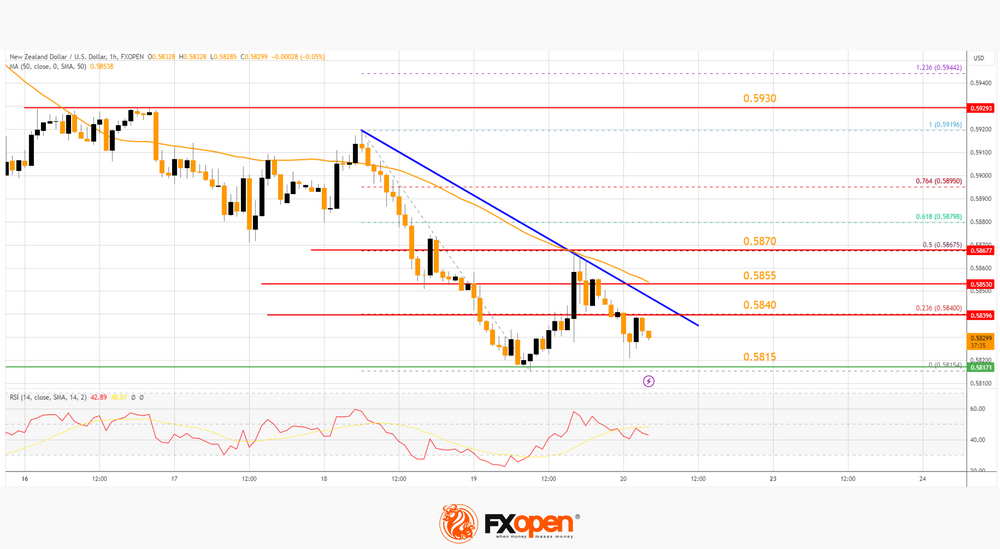
It is now moving lower and trading well below 0.5870. On the downside, immediate support on the NZD/USD chart is near the 0.5815 level.
The next major support is near the 0.5800 zone. If there is a downside break below 0.5800, the pair could extend its decline toward the 0.5740 level. The next key support is near 0.5700.
Immediate resistance on the upside is near a connecting bearish trend line at 0.5840. The next resistance is at 0.5855, followed by 0.5870. If there is a move above 0.5870, the pair could rise toward 0.5930. Any more gains might open the doors for a move toward the 0.5965 resistance zone in the coming days.
Trade global forex with the Innovative Broker of 2022*. Choose from 50+ forex markets 24/5. Open your FXOpen account now or learn more about trading forex with FXOpen.
* FXOpen International, Innovative Broker of 2022, according to the IAFT
This article represents the opinion of the Companies operating under the FXOpen brand only. It is not to be construed as an offer, solicitation, or recommendation with respect to products and services provided by the Companies operating under the FXOpen brand, nor is it to be considered financial advice.
USDCAD Retraces Higher Towards 6-month High
- USDCAD attempts to completely erase its latest pullback
- On track to test the 6-month peak of 1.3784
- Momentum indicators are heavily tilted to the bullish side
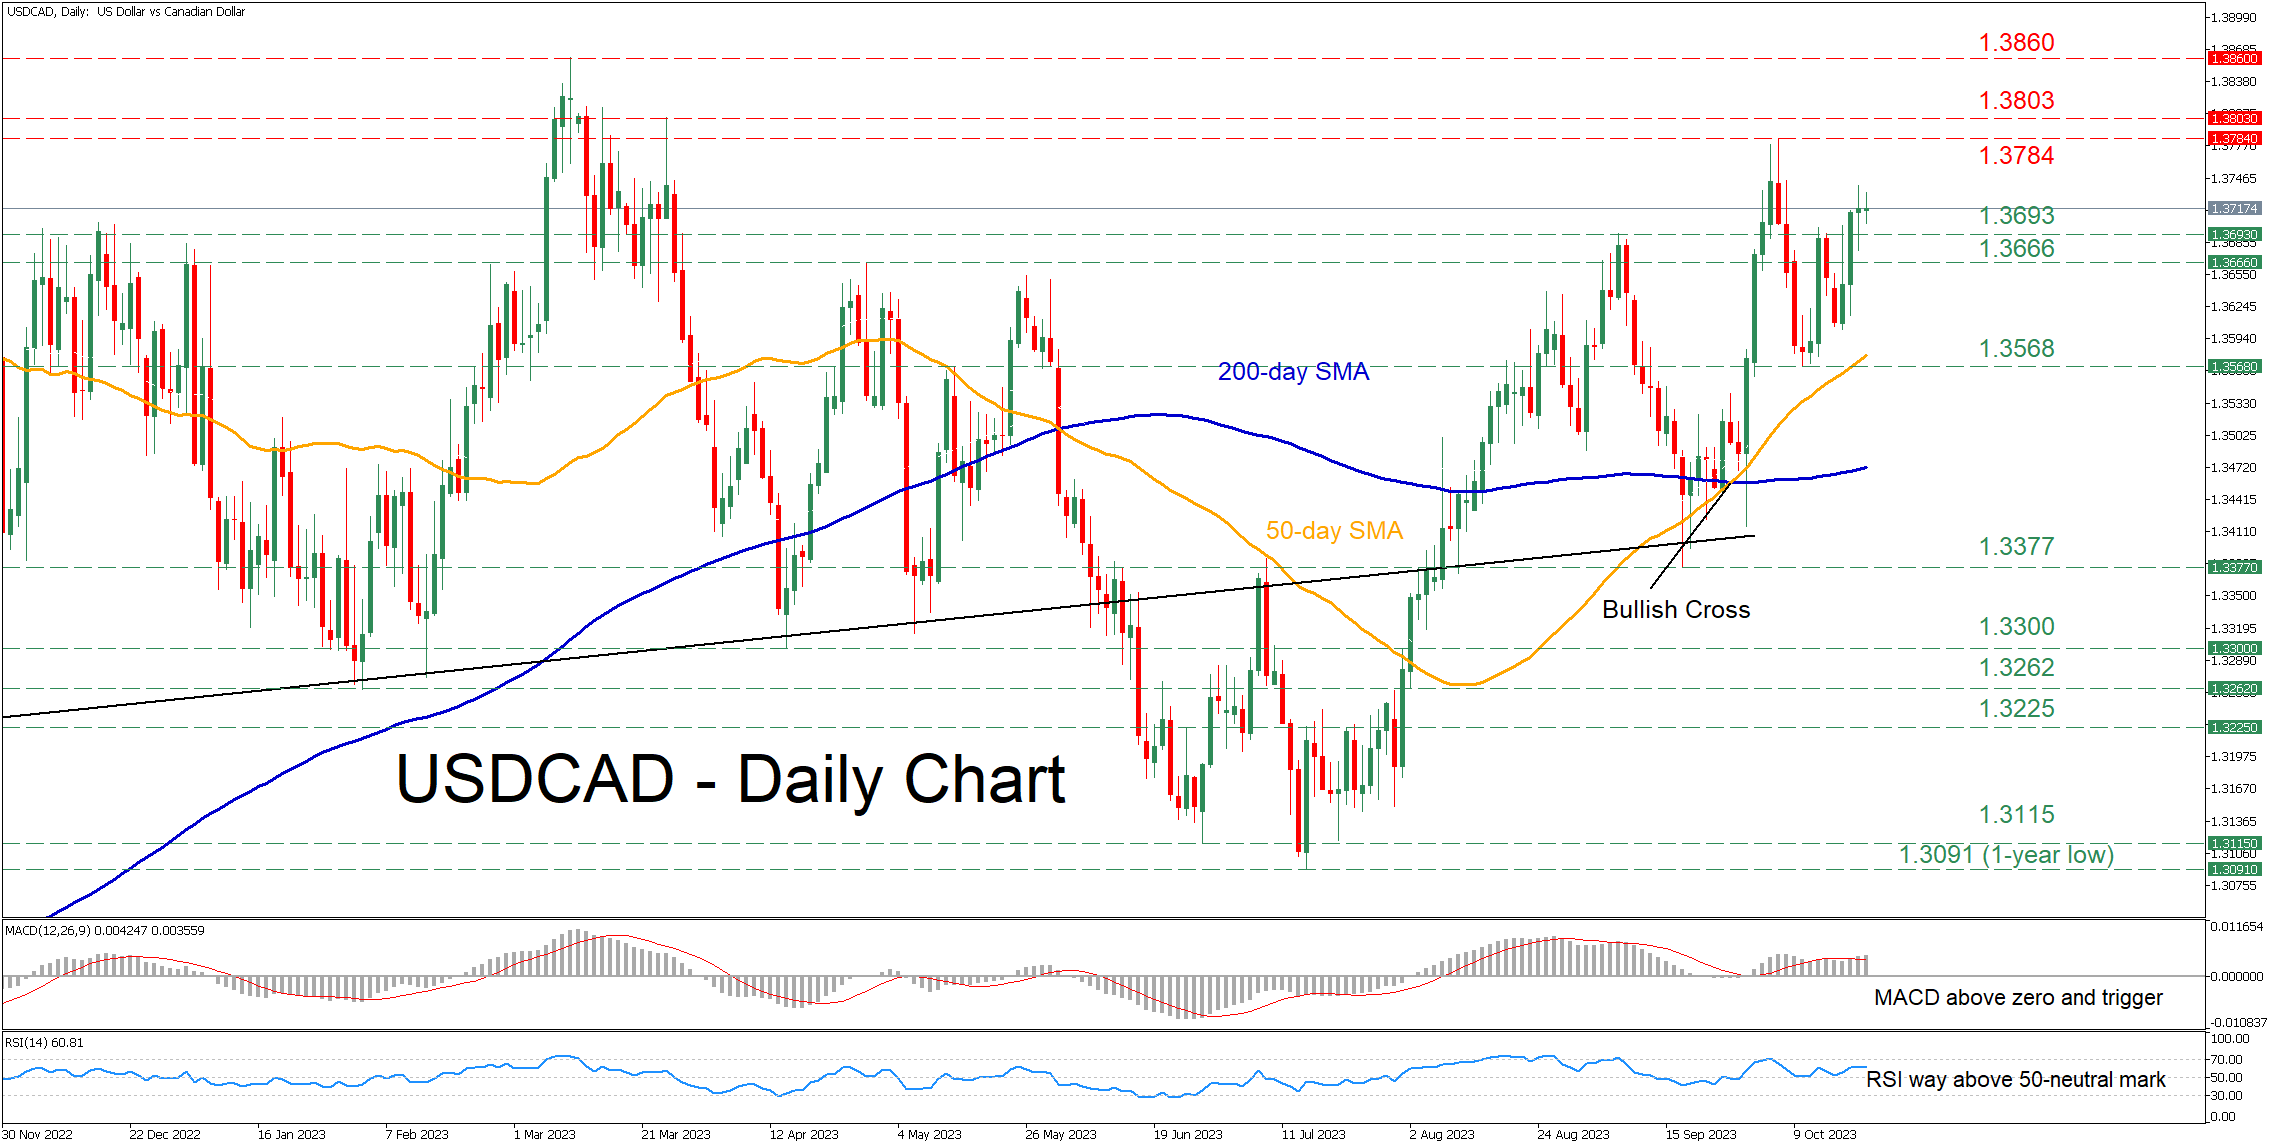
USDCAD had been in a steady advance since late September, posting a fresh six-month high of 1.3784 on October 5. Although the pair corrected to the downside, it quickly found its feet and recouped some losses, while both the RSI and MACD are endorsing this rebound as they are deep in their positive zones.
Should buying interest persist, the pair could re-test the recent rejection region of 1.3784, which is a six-month high. A break above that zone could open the door for the March resistance of 1.3803. Even higher, the 2023 peak of 1.3860 may curb further advances.
Alternatively, if the pair corrects to the downside, a couple of previous resistance regions such as 1.3693 and 1.3666 could provide initial downside protection. Sliding below the latter, the price could then test the October low of 1.3568. Should that barricade also fail, the spotlight could turn to the September bottom of 1.3377.
In brief, USDCAD appears ready to revisit its recent six-month high as near-term risks remain skewed to the upside.
GBP/JPY Daily Outlook
Daily Pivots: (S1) 181.21; (P) 181.86; (R1) 182.55; More...
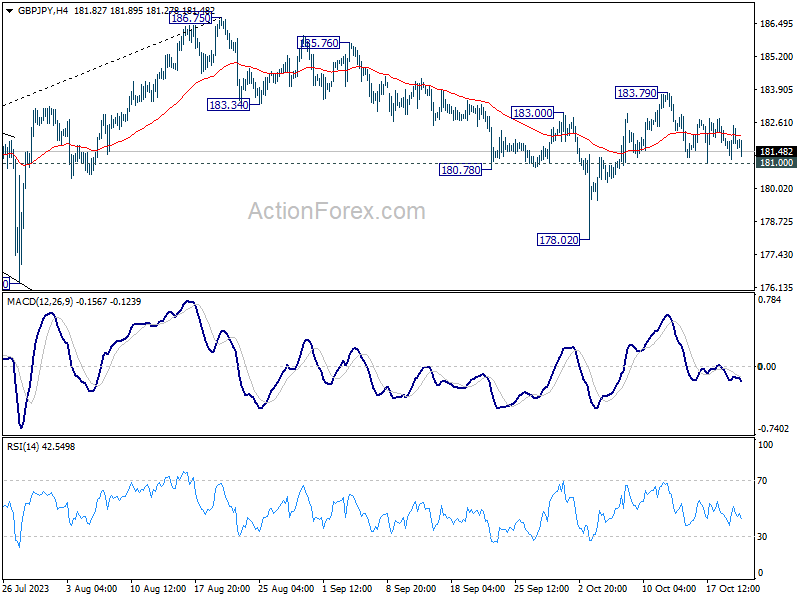
Intraday bias in GBP/JPY remains neutral and further rise is in favor with 181.00 support intact. The favored case is still that correction from 186.75 has completed at 178.02. Above 183.79 will resume the rise from 178.02 to retest 186.75 high. However, break of 181.00 will dampen this view, and turn bias back to the downside for 178.02 instead.
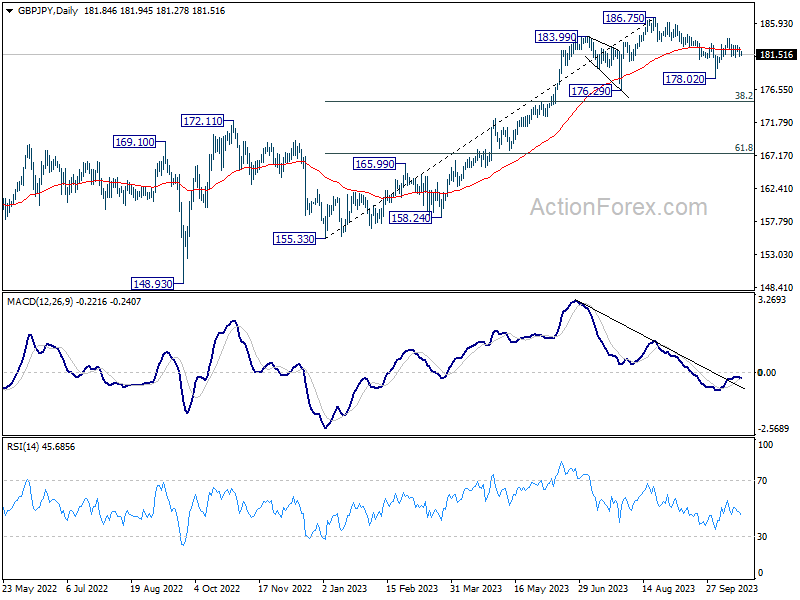
In the bigger picture, fall from 186.75 is seen as a corrective move only. As long as 176.29 support holds, larger up trend from 123.94 (202 low) should still be in progress. Break of 186.75 will target 195.86 (2015 high). Nevertheless, firm break of 176.29 will confirm medium term topping, and bring lengthier and deeper consolidations.
EUR/JPY Daily Outlook
Daily Pivots: (S1) 157.81; (P) 158.38; (R1) 159.07; More....
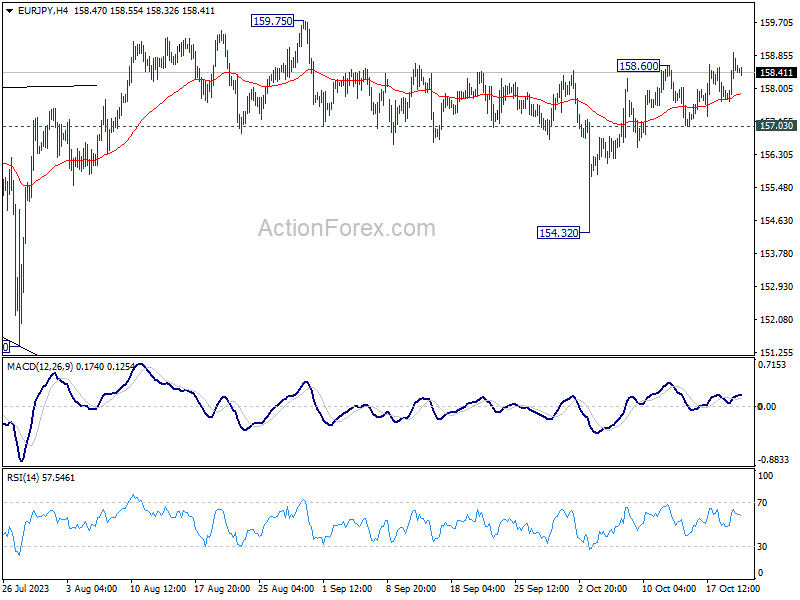
EUR/JPY's rise from 154.32 resumed by breaking 158.60 and intraday bias is back on the upside. Further rally should be seen to retest 159.75 next. Decisive break there will resume larger up trend. On he downside, break of 157.03 support is needed to signal completion of the rebound. Otherwise, further rally will remain in favor in case of retreat.
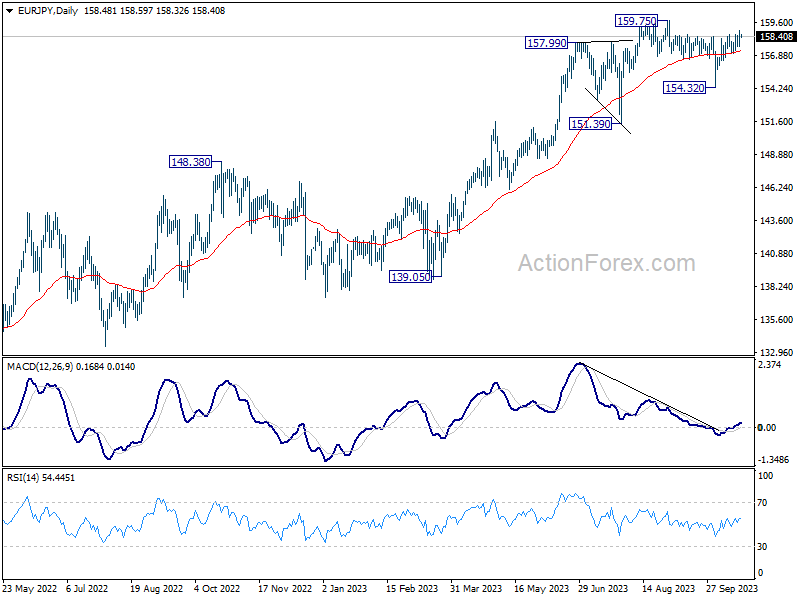
In the bigger picture, price actions from 159.75 are views as a corrective pattern. As long as 151.39 support holds, rise from 114.42 (2020 low) is expected to continue through 159.75 at a later stage. Nevertheless, firm break of 151.39 will confirm medium term topping, and bring lengthier and deeper correction.
EUR/GBP Daily Outlook
Daily Pivots: (S1) 0.8685; (P) 0.8702; (R1) 0.8731; More....
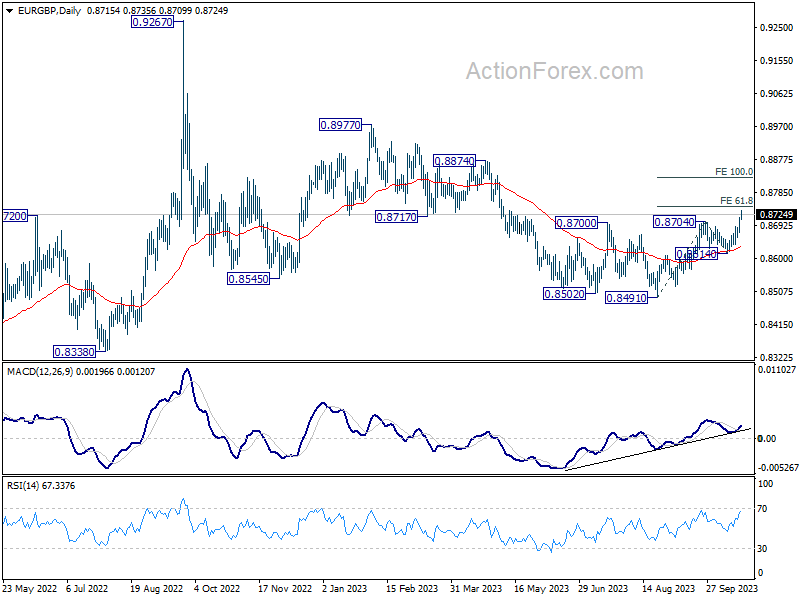
Intraday bias in EUR/GBP stays on the upside as rise from 0.8491 is extending. next target is 61.8% projection of 0.8491 to 0.8704 from 0.8614 at 0.8746. Decisive break there could prompt upside acceleration to 100% projection at 0.8827 next. On the downside, below 0.8695 minor support will turn intraday bias neutral first. But retreat should be contained well above 0.8614 to bring rise resumption.
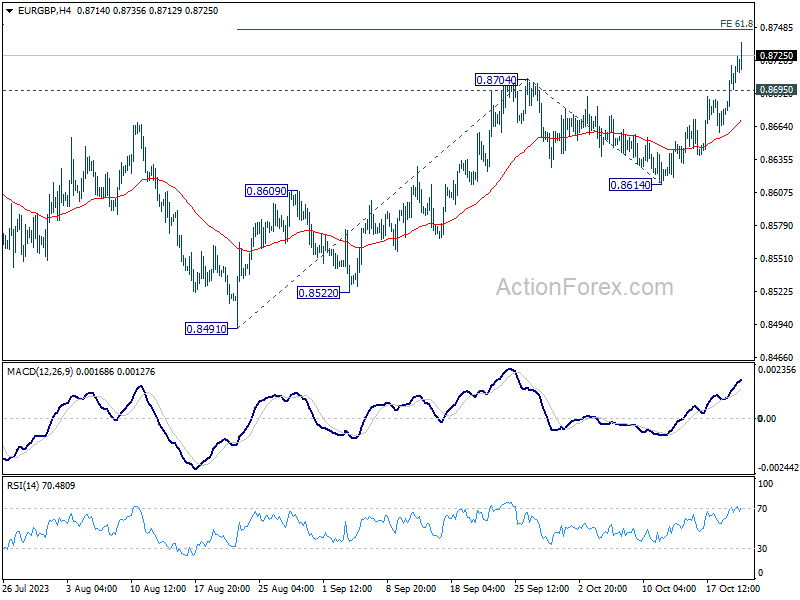
In the bigger picture, current development suggests that whole down trend from 0.9267 (2022 high) has completed with three down to to 0.8491. Rise from 0.8491 is seen as another leg inside that pattern from 0.9499 (2020 high). Further rally should be seen to 0.8977 resistance and above. This will now remain the favored case as long as 0.8614 support holds.
EUR/AUD Daily Outlook
Daily Pivots: (S1) 1.6641; (P) 1.6691; (R1) 1.6770; More...
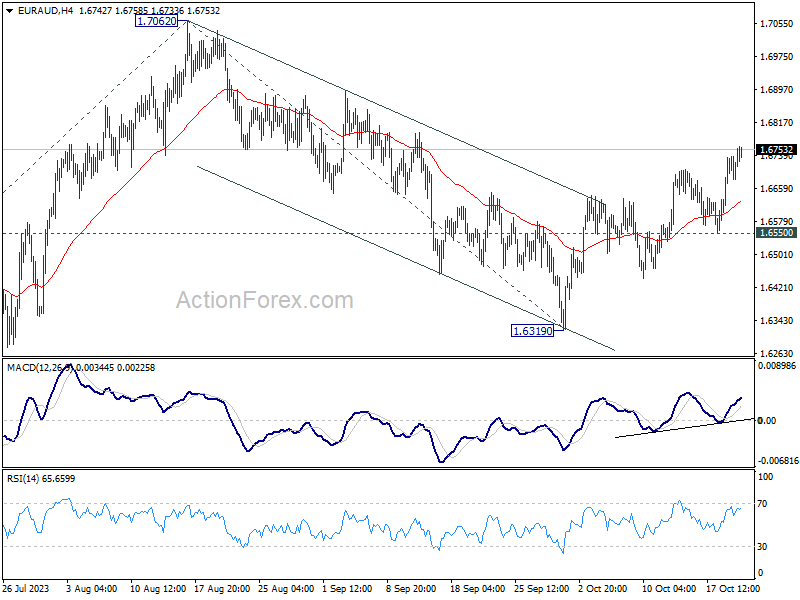
Intraday bias in EUR/AUD stays on the upside as rise from 1.6319 is in progress. Further rally should be seen to retest 1.7062 high next. On the downside, break of 1.6550 support is needed to indicate completion of the rebound. Otherwise, near term outlook will stay mildly bullish even in case of retreat.
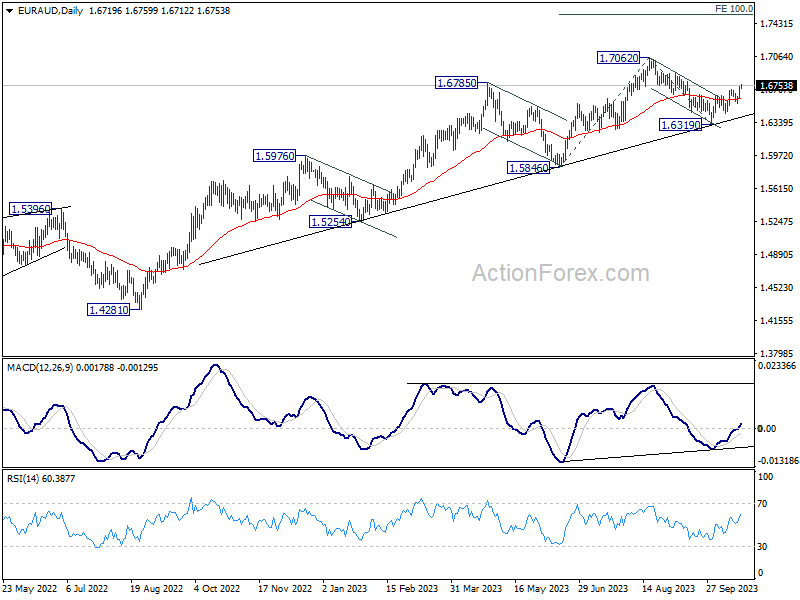
In the bigger picture, the strong support from medium term rising trend line indicates that rise from 1.4281 (2022 low) is still in progress. On resumption, next target is 100% projection of 1.5846 to 1.7062 from 1.6319 at 1.7353. In any case, outlook will stay bullish as long as 1.6319 support holds.
EUR/CHF Daily Outlook
Daily Pivots: (S1) 0.9413; (P) 0.9449; (R1) 0.9470; More...
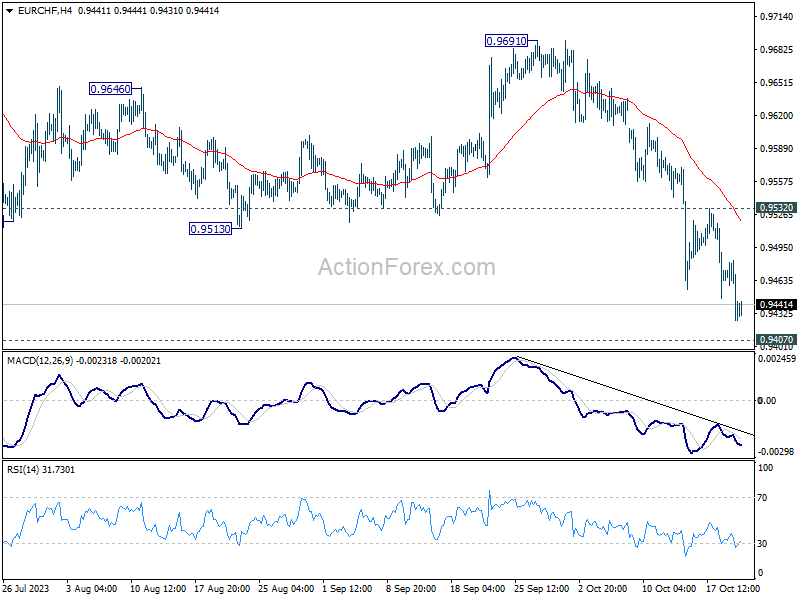
Intraday bias in EUR/CHF stays on the downside at this point. Current decline from 1.0095 is in progress for 0.9407 medium term bottom. Decisive break there will confirm larger down trend resumption. On the upside, break of 0.9532 resistance is needed to indicate short term bottoming. Otherwise, outlook will remain bearish in case of recovery.
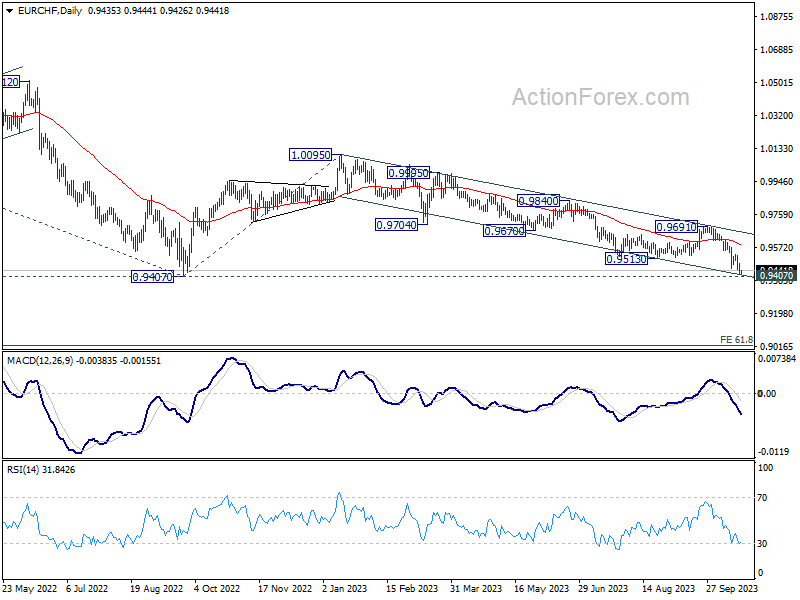
In the bigger picture, medium term outlook remains bearish with the cross capped well below falling 55 W EMA (now at 0.9782). Firm break of 0.9407 (2022 low) will confirm resumption of larger down trend from 1.2004 (2018 high). Next target will be 61.8% projection of 1.1149 to 0.9407 from 1.0095 at 0.9018. On the upside, break of 0.9691 resistance is needed to indicate medium term bottoming. Otherwise, outlook will stay bearish.
BoE’s Bailey anticipates marked decrease in October’s inflation figures
BoE Governor Andrew Bailey, in an interview with Belfast Telegraph, expressed that he "wasn't surprised" by the latest inflation report released on Wednesday. This report showcased consumer prices having ascended by 6.7% compared to the previous year in September, mirroring the growth rate observed in August.
Bailey's added the inflation rate was "not far off what we were expecting." Even more reassuring was the slight dip in core inflation, a development hefound "quite encouraging."
He optimistically anticipates a "noticeable drop" in the headline inflation rate with the forthcoming October data. This anticipated decline can be attributed to the significant surge in energy prices last year, which will be excluded from the annual comparison.
However, Bailey warned, "Pay growth as measured is still well above anything that's consistent with the target."
Fed Chair Powell Walked the Path His Colleagues Paved for Him
Markets
Fed chair Powell yesterday walked the path his colleagues had paved for him. In his widely anticipated speech at the Economic Club of New York, Powell said the recent rise in especially long‐term bond yields caused a tightening of general financial conditions which could lessen the need for a (final) rate hike. He argued for proceeding carefully given the uncertainties and risks, adding that some of the earlier delivered rate increases hasn’t showed up in the economy just yet. His comments, the last high‐profiles ones before the blackout period kicks in tomorrow, cement expectations for keeping interest rates steady at the November 1 meeting. Powell retained optionality by saying that further tightening of policy could be warranted if growth remained above‐trend and/or if tightness of the labour no longer eases. It’s a real risk following stellar September retail sales and payrolls. Bumper weekly jobless claims yesterday (198k) argued for the same. But markets, for now at least, don’t frontrun such a scenario and instead assume the end of the tightening cycle. The US yield curve turned less inverse with yields at the short end already easing going into Powell’s speech. The 2‐y yield fell 6.3 bps but the long end added more than 11 bps (30‐y). The 10‐y yield closed one bp shy of the symbolical 5%. German yields whipsawed, leading to changes of less than 1 bp across the curve. The US dollar lost ground. Gloomy risk assets (Wall Street finished up to 1% lower) prevented a close at the daily lows though. EUR/USD rose from 1.0536 to 1.0582. DXY found support at 106(.25). USD/JPY is going nowhere just shy of 150. This morning’s marginally higher‐than‐expected Japanese inflation numbers (see below) aren’t changing anything about that. China’s yuan trades marginally weaker (USD/CNY 7.317) after the central bank injected the most cash on record in a bid to support the premature economic recovery. The US dollar is generally better bid in a mild risk‐off Asian session. Stocks in the region lose up to 1.8% (South Korea). Treasuries for once attract some safe haven flows, pushing cash yields 4.5 bps lower at the belly of the curve. We expect some further core bond consolidation going into the weekend. Technical charts also argue for slightly lower yields (short‐term) after the likes of the US‐10y yield failed to push through the 5% barrier. In the same vein the dollar looks set for some gains. EUR/USD 1.0516 marks the first support zone. That said, the greenback’s performance over the past few days was not at all convincing. Retail sales in the UK this morning settle the debate for the Bank of England November 2 meeting: it’s a hold. Markets remain split over a final rate hike to 5.5% later this year/early 2024 but that’s not enough for sterling. EUR/GBP extends yesterday’s trip above 0.87 and is closing in on resistance at 0.8736.
News and views
UK GfK consumer confidence dropped at an unexpected sharp pace in October, from ‐21 to ‐30 while a near stabilization (‐21) was expected. This marks a sharp U‐turn as the index in September rebounded to the highest level since January 2022. GfK comments that ‘This sharp fall underlines that the cost‐of‐living crisis, and simply not having enough money to make‐ends‐meet, are still exerting acute pressure for many consumers’. UK consumers turned more negative most major subindices in the survey in particular expectations on the economic situation over the next twelve months (‐32 from ‐24) and climate for major purchases (‐34 from ‐20). The latter might be bad now for retailing going into the important Christmas season.
Japanese consumer prices ex fresh food slowed in September to 0.1% M/M and 2.8% Y/Y, down from 3.1%. It was the first sub 3.0% print since August last year. The index reached a cycle peak of 4.2% in January. Still the outcome was slightly above expectations. Core inflation excluding food and energy also slowed modestly from 0.3% M/M and 4.3% in August to 0.2% M/M and 4.2%Y/Y in September. In a monthly perspective, the easing in inflation was mainly driven by a sharp decline in prices of utilities (‐1.8% M/M). Costs of transport and communication declined 0.1% M/M. Clothing and footwear rose 3.0% M/M. Despite the September slowdown in inflation, the BoJ will probably again have to upgrade its inflation forecast when it holds its next regular policy meeting on October 31. For now, the BoJ held to a narrative that stimulus could stay in place as most of the inflation is cost‐driven and as the bank gives an important weight to wage growth that should support domestic demand. With respect to execution of its policy, after announcing unscheduled bond‐buying earlier this week, the BoJ today announced to offer 5‐y loans to banks to support bond buying as the 10‐y yield touched a new cycle peak near 0.85% this morning.