Sample Category Title
US Core PCE Rises to 3.4%, Income and Spending Top Expectations
The Federal Reserve's preferred inflation gauge accelerated in May as both consumer spending and personal income exceeded expectations, reinforcing the picture of a resilient US economy facing persistent price pressures. Personal income rose 0.7% mom, well above the expected 0.4% increase after being flat in April, while personal spending also advanced 0.7% mom, topping forecasts of 0.6% and accelerating from April's 0.4% gain.
Inflation remained elevated across both headline and core measures. The PCE price index rose 0.4% mom, slightly below the expected 0.5% increase, while the annual rate accelerated from 3.8% yoy to 4.1% yoy, matching expectations. Core PCE, which excludes food and energy, increased 0.3% mom as expected, lifting the annual rate from 3.3% yoy to 3.4% yoy, the highest since October 2023. The data suggest underlying inflation remains sticky despite some moderation in monthly price growth.
Taken together, the report is likely to reinforce expectations that the Fed will maintain a hawkish stance. Strong income growth continues to support consumer spending, while inflation remains well above the central bank's 2% target. The combination of resilient demand and persistent underlying price pressures is unlikely to provide policymakers with sufficient confidence that inflation is moving sustainably lower, keeping the prospect of further policy tightening firmly on the table.
| Indicator | May | April | Expectation |
|---|---|---|---|
| Personal Income | +0.7% | 0.0% | +0.4% |
| Personal Spending | +0.7% | +0.4% | +0.6% |
| PCE Price Index (Monthly) | +0.4% | — | +0.5% |
| PCE Price Index (Annual) | 4.1% | 3.8% | 4.1% |
| Core PCE Price Index (Monthly) | +0.3% | +0.2% | +0.3% |
| Core PCE Price Index (Annual) | 3.4% | 3.3% | 3.4% |
US Durable Goods Orders Hit by Transportation, Underlying Demand Improves
US durable goods orders fell -4.5% mom in May, a smaller decline than the expected -4.7% drop, as a sharp pullback in transportation equipment orders offset continued strength elsewhere in the manufacturing sector. The decline followed April's 8.5% surge and was driven by a -14.0% fall in transportation equipment orders to USD 113.5B. Excluding transportation, however, durable goods orders rose a solid 1.3%, comfortably beating expectations for a 0.5% increase.
The underlying details pointed to resilient business demand despite the volatile headline figure. Orders excluding defense declined -4.6%, reflecting the weakness in transportation, while the broad gain in orders outside the transportation sector suggests manufacturers continue to see healthy underlying demand. The report indicates that May's decline was more of a normalization following two months of exceptionally strong transportation orders rather than a broad-based deterioration in factory activity.
Manufacturing activity also remained supported by solid production. Shipments of durable goods increased 1.0% mom to USD 327.9B after a 0.7% gain in April, marking the eighth increase in the past nine months. Transportation equipment again led the advance, with shipments rising 1.4%. Overall, the report points to continued resilience in the manufacturing sector, with core demand and shipments remaining firm even as the highly volatile transportation category weighed on the headline reading.
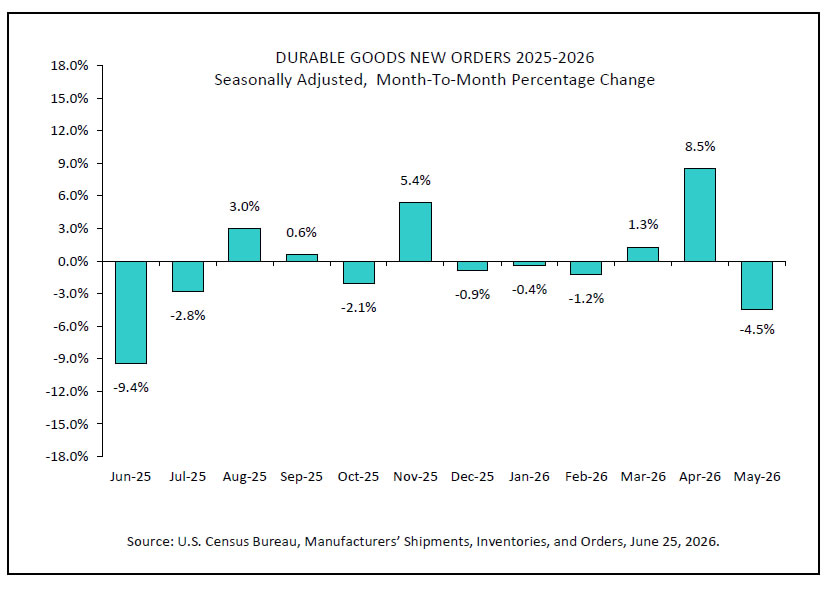
| Indicator | May | Expectation |
|---|---|---|
| Durable Goods Orders | -4.5% m/m | -4.7% m/m |
| Durable Goods Orders ex Transportation | +1.3% m/m | +0.5% m/m |
| Durable Goods Orders ex Defense | -4.6% m/m | — |
| Transportation Equipment Orders | -14.0% m/m | — |
| Durable Goods Shipments | +1.0% m/m | — |
| Transportation Equipment Shipments | +1.4% m/m | — |
US Jobless Claims Fall to 215K, Labor Market Remains Resilient
US initial jobless claims fell more than expected last week, offering fresh evidence that layoffs remain limited despite signs of a gradual cooling in the labor market. Initial claims dropped by -12k to 215k in the week ended June 20, beating expectations of 225k. The previous week's reading was revised to 227k. Meanwhile, the four-week moving average, which smooths weekly volatility, edged up by 750 to 224,250.
The picture was somewhat more mixed beneath the headline. Continuing claims, a proxy for the number of people receiving unemployment benefits, rose by 21k to 1.821m in the week ended June 13, while the insured unemployment rate held steady at 1.2%. The four-week moving average of continuing claims also increased by 9k to 1.7945m, suggesting unemployed workers are still taking slightly longer to find new jobs.
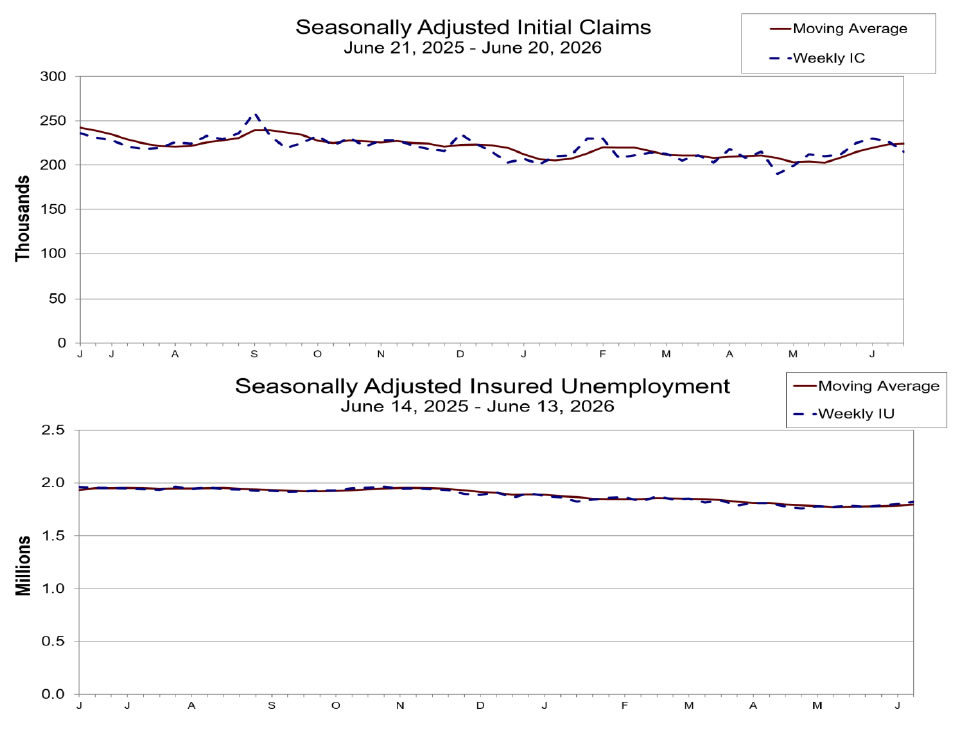
| Indicator | Latest | Previous | Expectation |
|---|---|---|---|
| Initial Jobless Claims | 215k | 227k | 225k |
| 4-Week Average (Initial Claims) | 224.25k | 223.50k | — |
| Continuing Claims | 1.821m | 1.800m | — |
| Insured Unemployment Rate | 1.2% | 1.2% | — |
| 4-Week Average (Continuing Claims) | 1.7945m | 1.7855m | — |
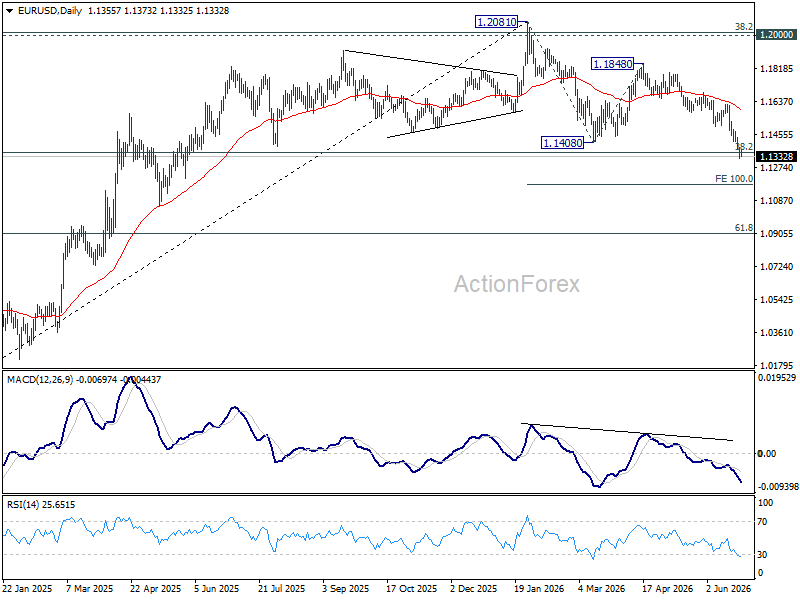
EUR/USD Daily Outlook
Intraday bias in EUR/USD remains on the downside at this point. Sustained break of 1.1353 fibonacci level will carry larger bearish implication. Next near term is 100% projection of 1.2081 to 1.1408 from 1.1848 at 1.1175. On the upside, above 1.1416 minor resistance will turn intraday bias neutral again first.
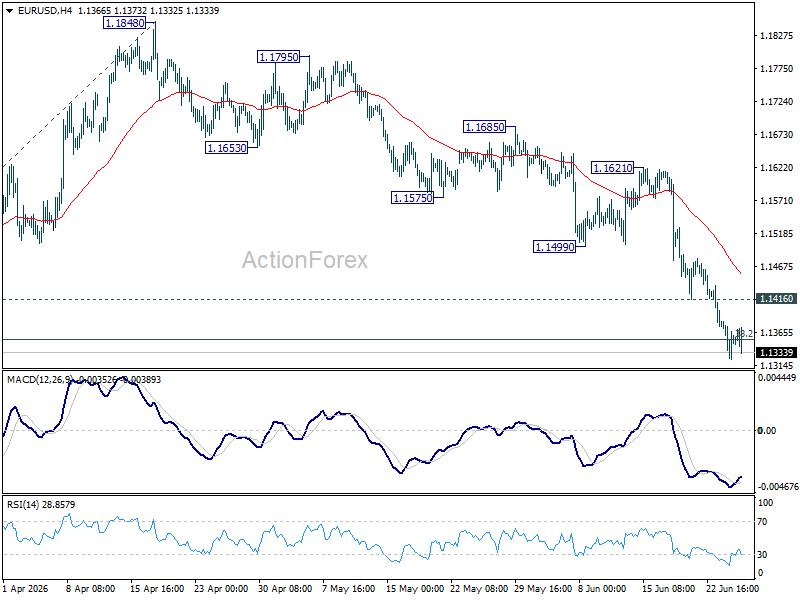
In the bigger picture, focus is back on 38.2% retracement of 1.0176 to 1.2081 at 1.1353. Decisive break there will revive the case of medium term bearish trend reversal after rejection by 1.2 key cluster resistance level. Further fall should be seen to 61.8% retracement at 1.0904. Nevertheless, strong rebound from 1.1353, followed by break of 1.1621 resistance, will retain medium term bullishness.
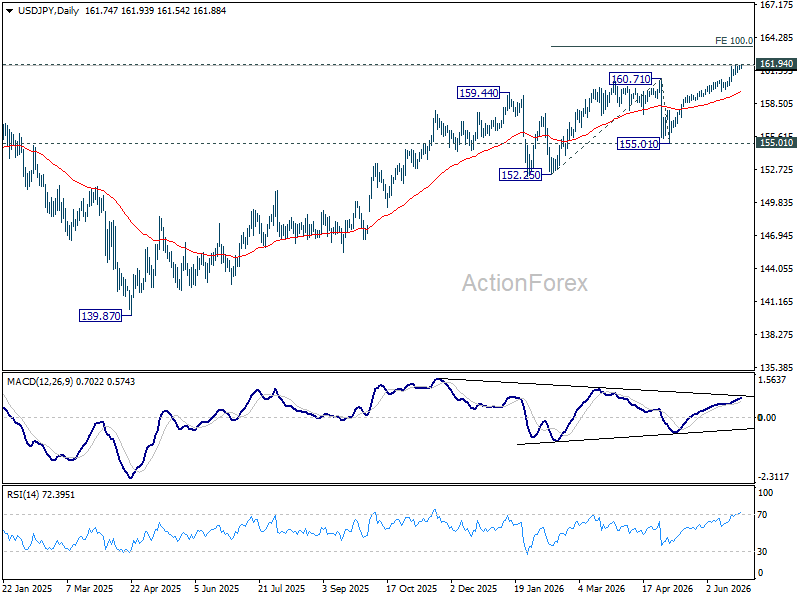
USD/JPY Daily Outlook
Intraday bias in USD/JPY remains neutral for the moment. On the downside, firm break of 160.58 support should confirm short term topping, on bearish divergence condition in 4H MACD. Deeper fall should then be seen to 55 D EMA (now at 159.46) and below. Nevertheless, decisive break of 161.94 high will resume the larger up trend to 100% projection of 152.25 to 160.71 from 155.01 at 163.47 next.
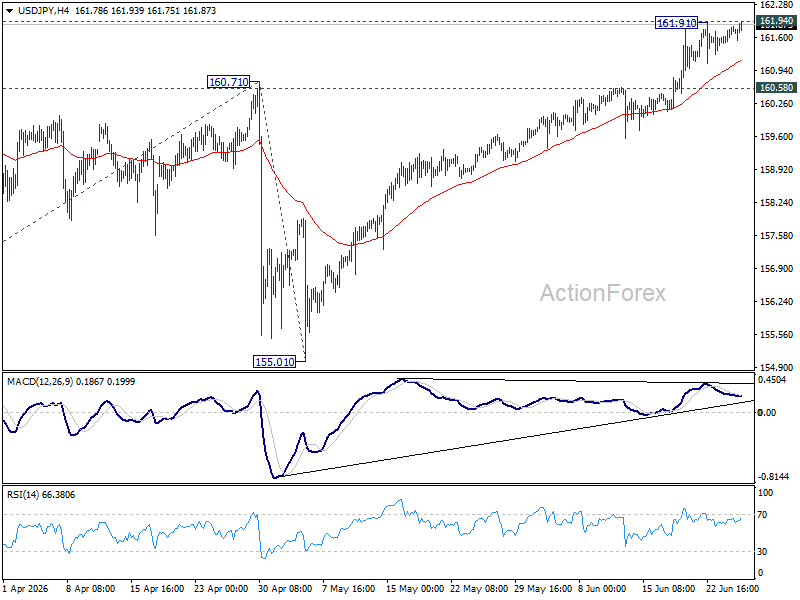
In the bigger picture, for now, corrective pattern from 161.94 (2024 high) is still seen as completed at 139.87. Rise from there is seen as resuming the long term up trend. This will remain the favored case as long as 55 W EMA (now at 155.17) holds.
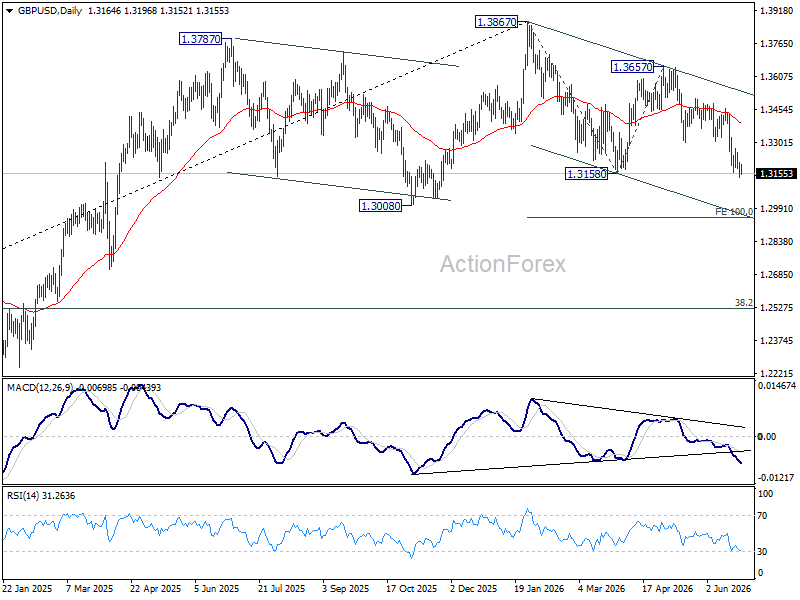
GBP/USD Daily Outlook
Intraday bias in GBP/USD remains on the downside for the moment. Sustained trading below 1.3158 support will resume whole fall from 1.3867 to 100% projection of 1.3867 to 1.3158 from 1.3657 at 1.2948. On the upside, above 1.3272 resistance will turn intraday bias neutral again first.
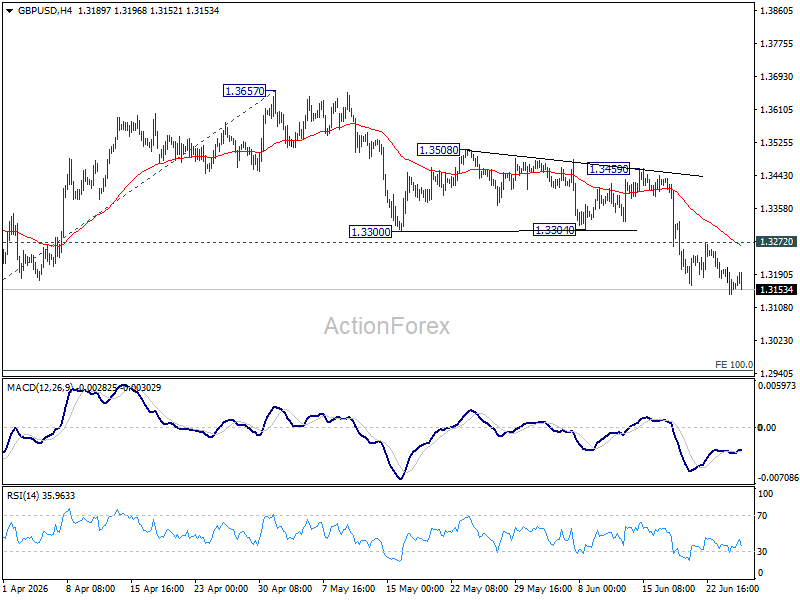
In the bigger picture, price actions from 1.3867 are a corrective pattern within the broader up trend from 1.0351 (2022 low). With 1.3008 support intact, medium term bullishness is maintained and break of 1.3867 is in favor for a later stage, towards 1.4248 key resistance (2021 high). However, firm break of 1.3008 will at least bring deeper fall to 38.2% retracement of 1.0351 to 1.3867 at 1.2524, with increased risk of bearish reversal.
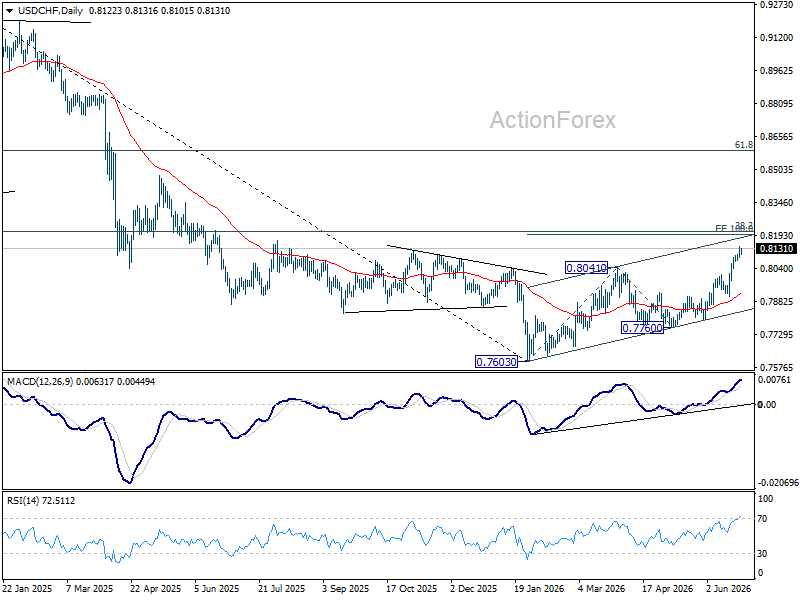
USD/CHF Daily Outlook
Intraday bias in USD/CHF stays on the upside for 100% projection 0.7603 to 0.8041 from 0.7600 at 0.8198. On the downside, below 0.8074 minor support will turn intraday bias neutral and bring consolidations first before staging another rise.
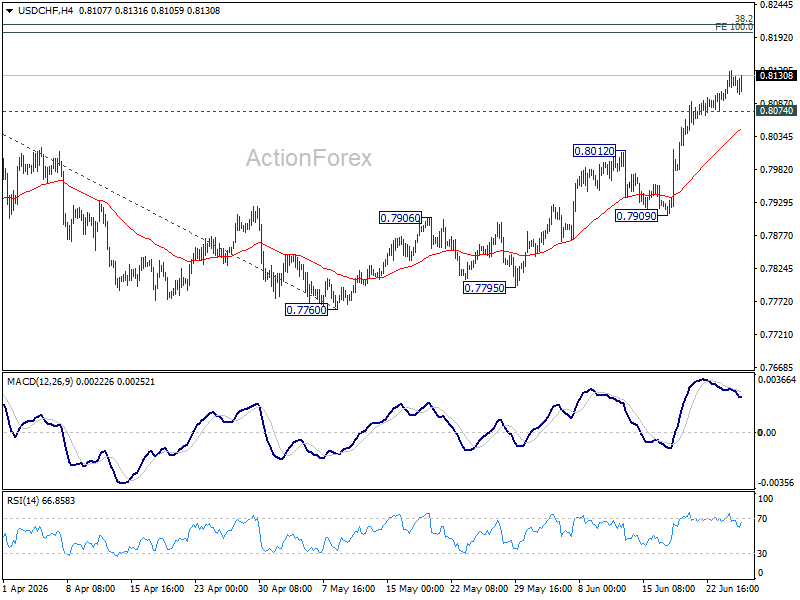
In the bigger picture, while a medium term bottom was formed at 0.7603, it's still early to call for bullish trend reversal. As long as 38.2% retracement of 0.9200 (2025 high) to 0.7603 at 0.8213 holds, the larger down trend could still continue through 0.7603 at a later stage. However, firm break of 0.7603 will argue that the trend has reversed and turn focus to 0.8332 support turned resistance (2023 low) for confirmation.
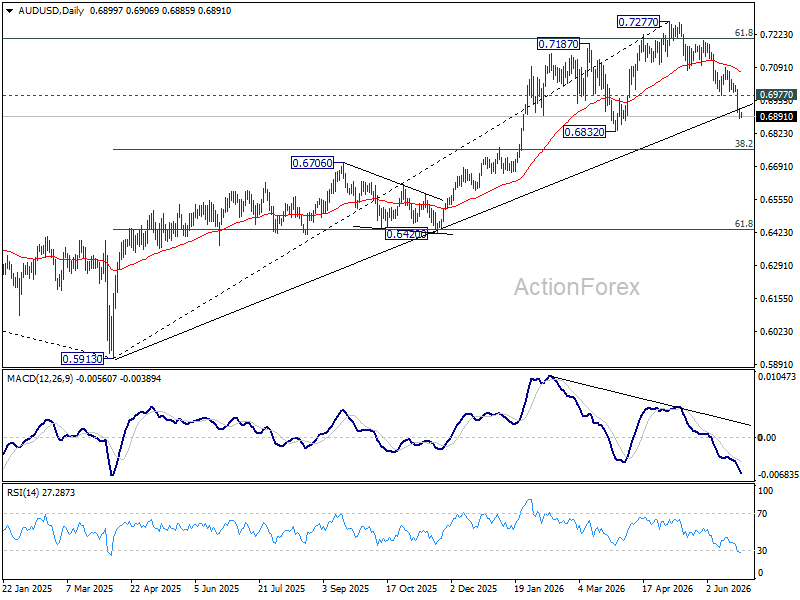
AUD/USD Daily Report
Intraday bias in AUD/USD is turned for some consolidations. But upside of recovery should be limited by 0.6977 support turned resistance. Below 0.6881 temporary low will resume the fall from 0.7277 to 0.6832 support first. Firm break there will target 0.6756 fibonacci level.
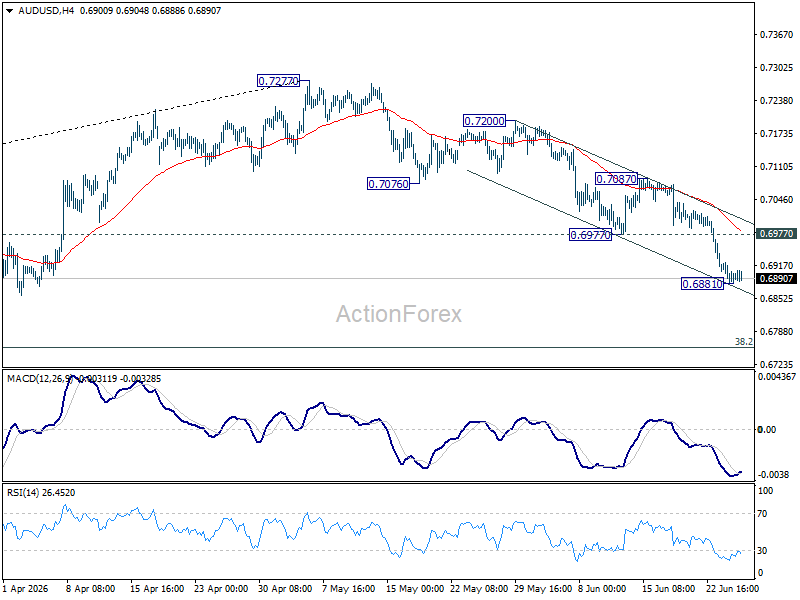
In the bigger picture, considering bearish divergence condition in D MACD, a medium term top could be formed at 0.7277 after failing to sustain above 61.8% retracement of 0.8006 (2021 high) to 0.5913 (2024 low) at 0.7206. Deeper fall could be seen to 38.2% retracement of 0.5913 to 0.7277 at 0.6756 as a correction. But strong support should be seen there to bring rebound. Consolidations would continue below 0.7277 for a while.
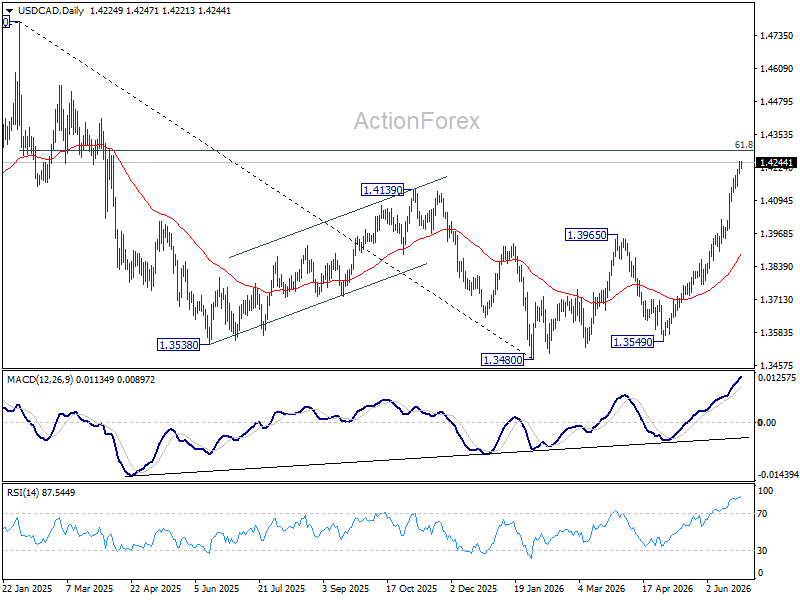
USD/CAD Daily Outlook
Intraday bias in USD/CAD remains on the upside for 61.8% retracement of 1.4791 to 1.3480 at 1.4290. Sustained break there will pave the way to 1.4791 high. On the downside, below 1.4140 minor support will turn intraday bias neutral and bring consolidations first, before staging another rally.
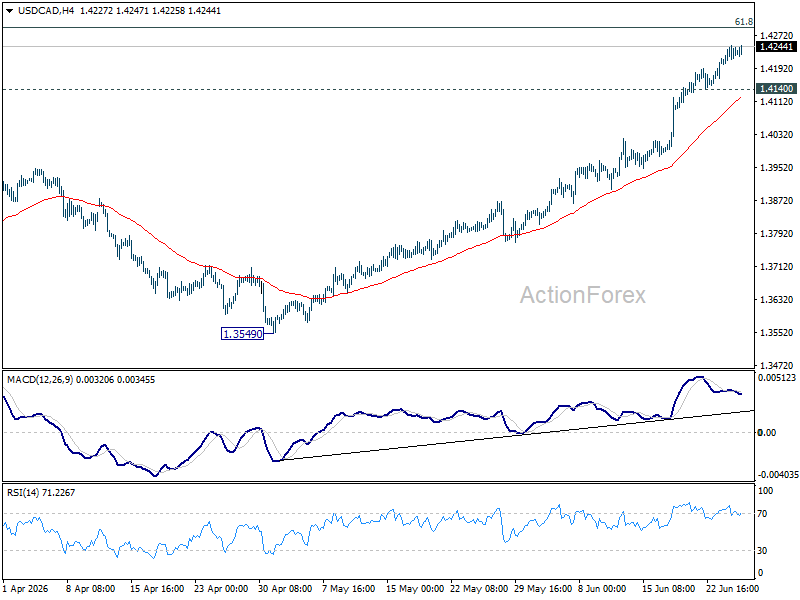
In the bigger picture, current development suggests that fall from 1.4791 has completed as a three wave correction to 1.3480. It's still early to judge if rise from there a corrective bounce, or resumption of the larger up trend from 1.2005 (2021 low). But in either case, retest of 1.4791 high should be seen next.
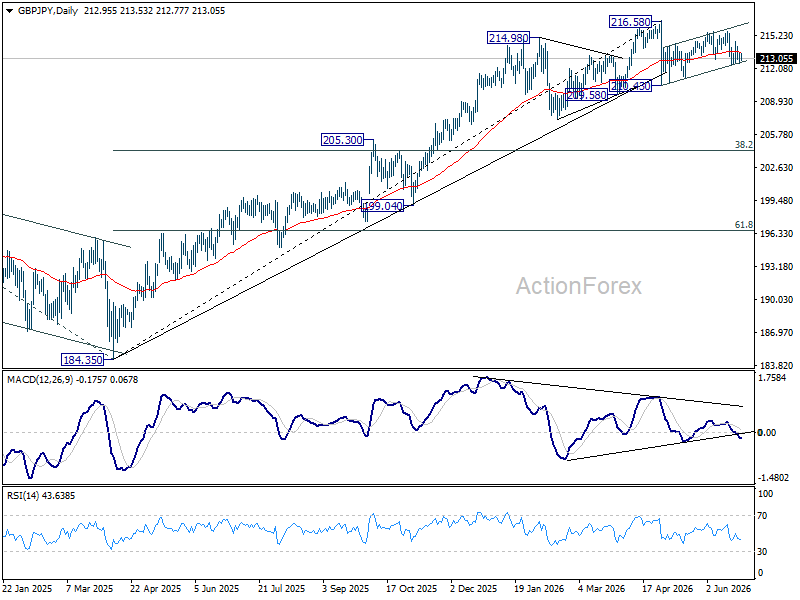
GBP/JPY Daily Outlook
Range trading continues in GBP/JPY and intraday bias remains neutral. On the downside, below 212.36 will affirm the case that rebound form 210.43 has completed as a correction. Deeper fall would be seen to 211.23 support first. However, break of 215.59 will resume the rebound from 210.43 to retest 216.58.
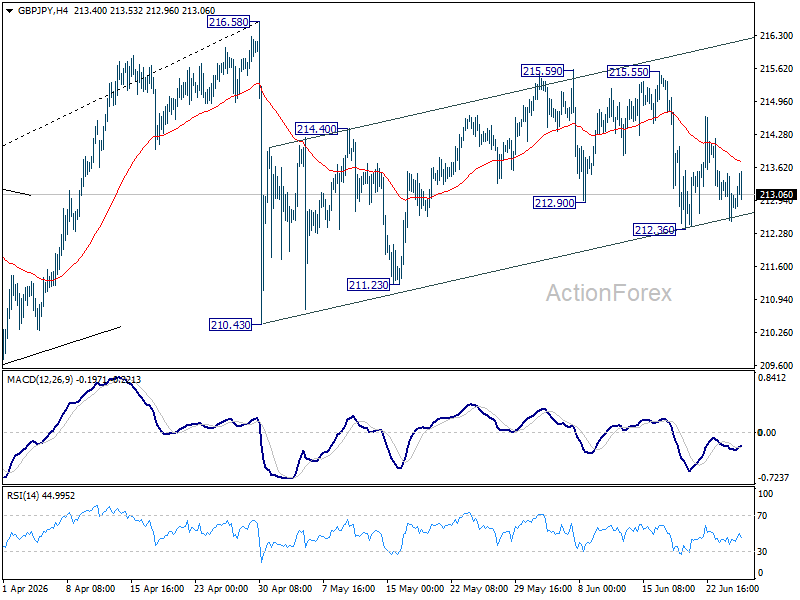
In the bigger picture, there is no clear sign of trend reversal yet. The long term up trend could still extend to 61.8% projection of 148.93 (2022 low) to 208.09 (2024 high) from 184.35 at 220.90 on resumption. However, sustained break of 55 W EMA (now at 207.11) will argue that it's already in medium term down trend for 184.35 support.