
Sample Category Title
AUD/USD Daily Report
Intraday bias in AUD/USD is back on the downside with breach of 0.6881 temporary low. Current fall from 0.7277 should target 0.6832 support first. Firm break there will target 0.6756 fibonacci level. Risk will continue to stay on the downside as long as 0.6977 support turned resistance holds, in case of another recovery.
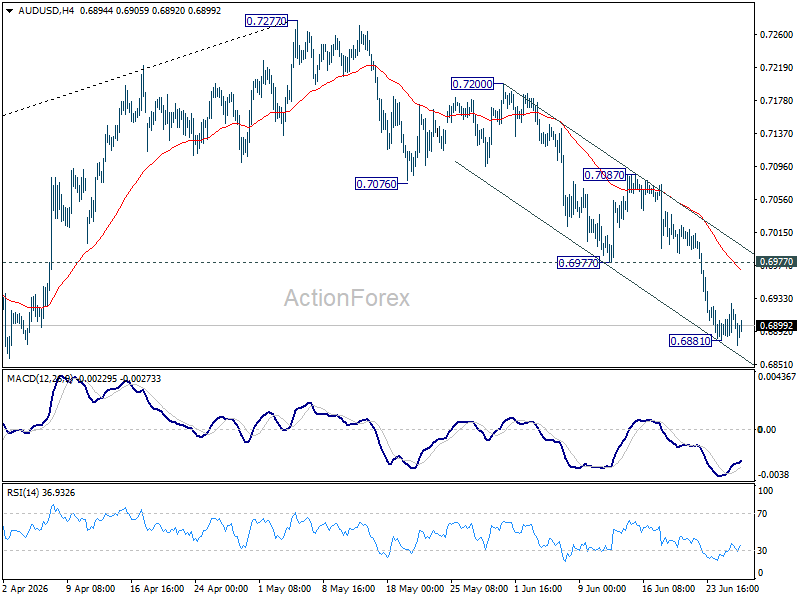
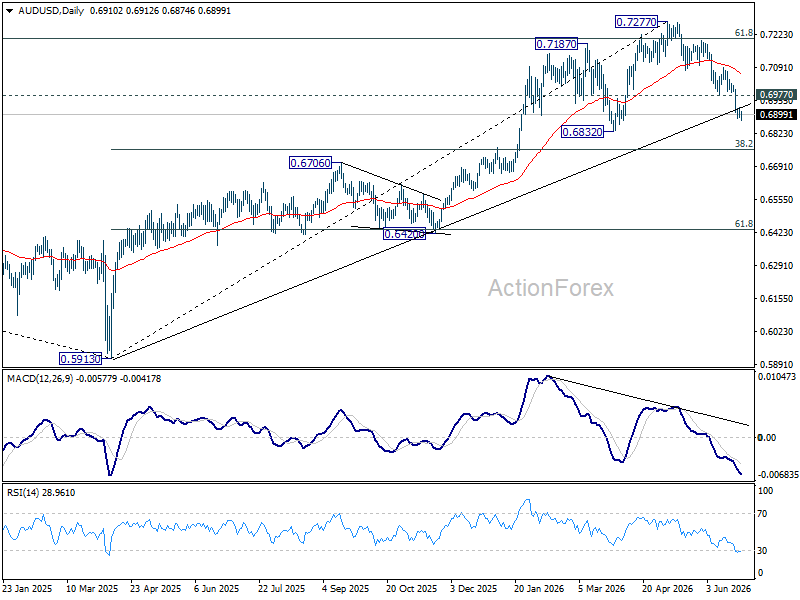
In the bigger picture, considering bearish divergence condition in D MACD, a medium term top could be formed at 0.7277 after failing to sustain above 61.8% retracement of 0.8006 (2021 high) to 0.5913 (2024 low) at 0.7206. Deeper fall could be seen to 38.2% retracement of 0.5913 to 0.7277 at 0.6756 as a correction. But strong support should be seen there to bring rebound. Consolidations would continue below 0.7277 for a while.
USD/CAD Daily Outlook
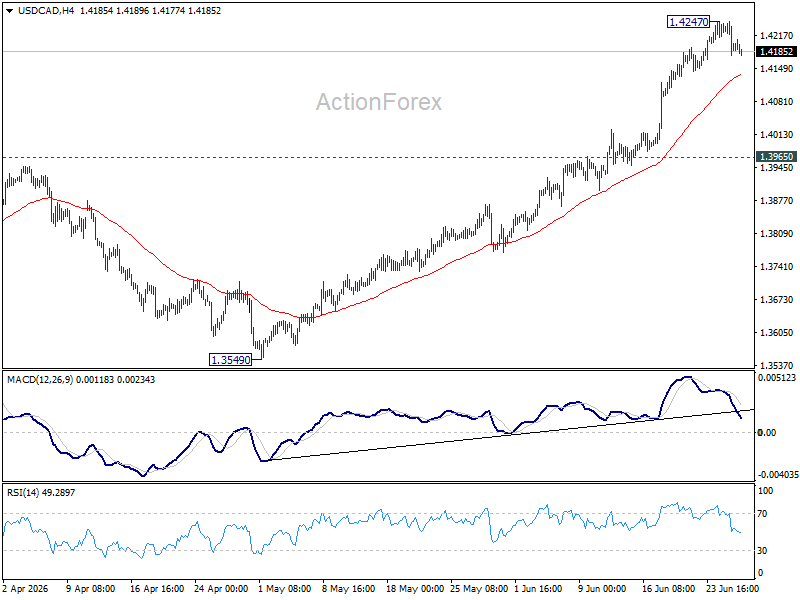
Intraday bias in USD/CAD is turned neutral first with current retreat. Some consolidations would be seen below 1.4247 temporary top. Downside should be contained 1.3965 resistance turned support to bring rally. Above 1.4247 will target 61.8% retracement of 1.4791 to 1.3480 at 1.4290. Sustained break there will pave the way to 1.4791 high.
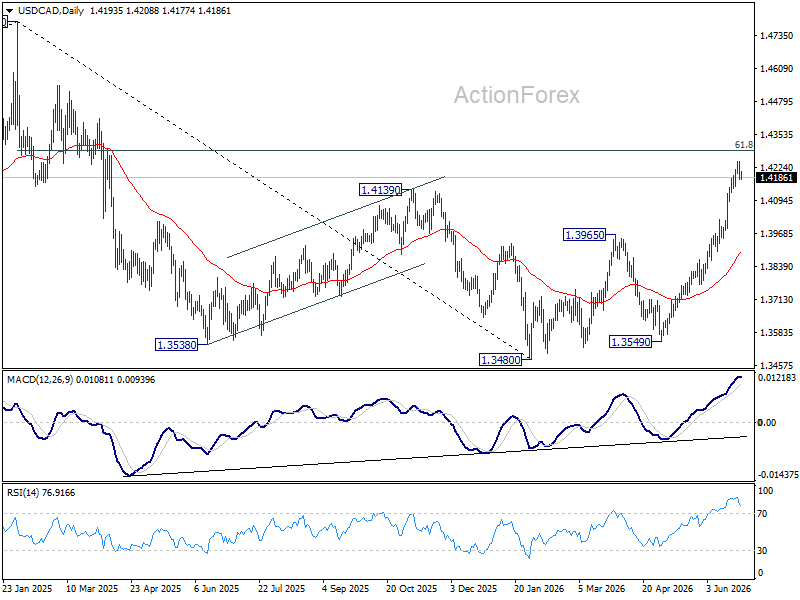
In the bigger picture, current development suggests that fall from 1.4791 has completed as a three wave correction to 1.3480. It's still early to judge if rise from there a corrective bounce, or resumption of the larger up trend from 1.2005 (2021 low). But in either case, retest of 1.4791 high should be seen next.
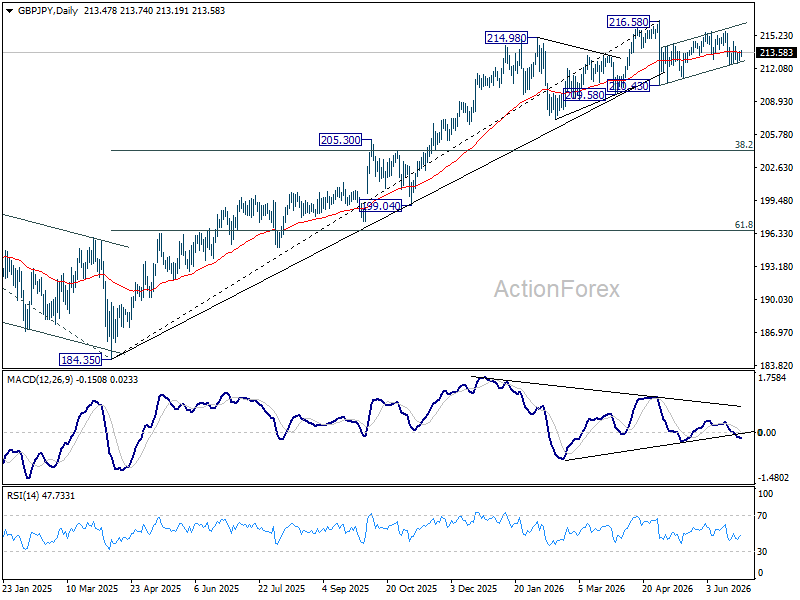
GBP/JPY Daily Outlook
Intraday bias in GBP/JPY remains neutral as sideway trading continues. On the downside, below 212.36 will affirm the case that rebound form 210.43 has completed as a correction. Deeper fall would be seen to 211.23 support first. However, break of 215.59 will resume the rebound from 210.43 to retest 216.58.
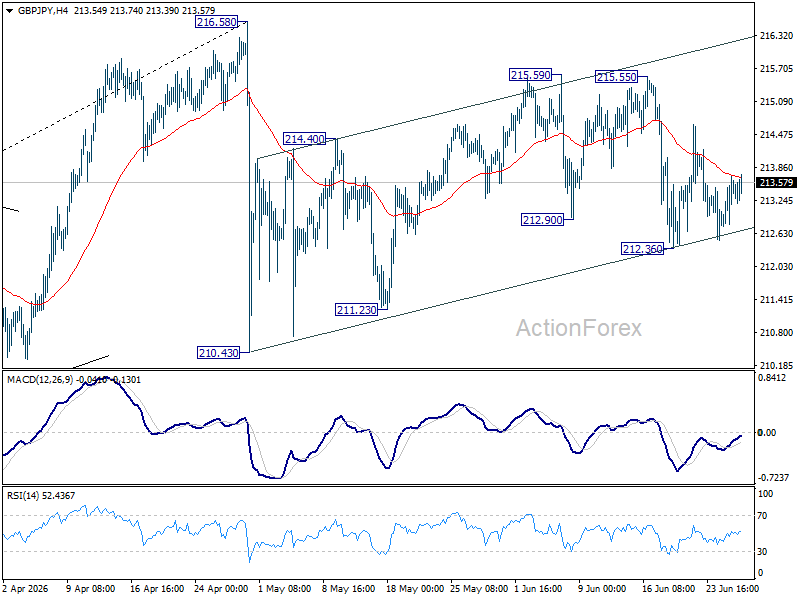
In the bigger picture, there is no clear sign of trend reversal yet. The long term up trend could still extend to 61.8% projection of 148.93 (2022 low) to 208.09 (2024 high) from 184.35 at 220.90 on resumption. However, sustained break of 55 W EMA (now at 207.11) will argue that it's already in medium term down trend for 184.35 support.
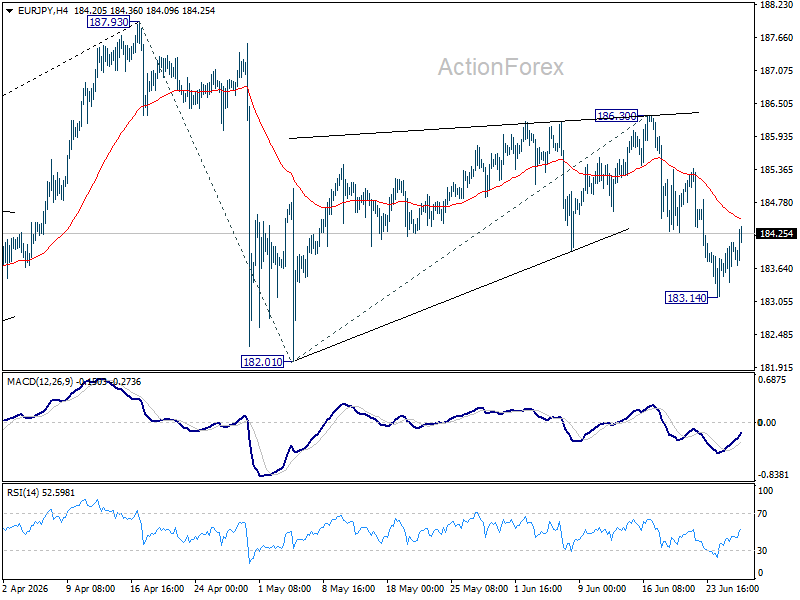
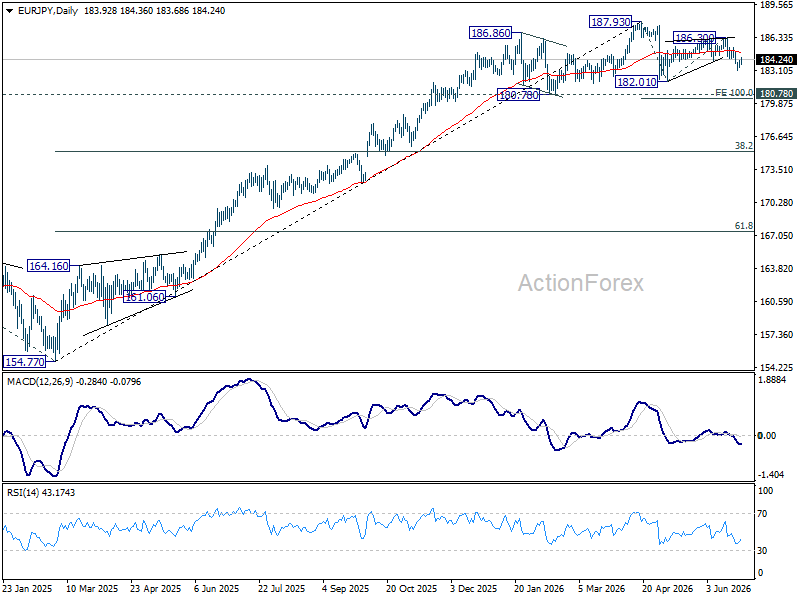
EUR/JPY Daily Outlook
Intraday bias in EUR/JPY is turned neutral with current recovery. Risk will stay on the downside as long as 186.30 resistance holds. Below 183.14 will target 182.01. Firm break there will resume the fall from 187.93 and target 100% projection of 187.93 to 182.01 from 186.30 at 180.38.
In the bigger picture, there is no sign of reversal yet. Uptrend from 114.42 (2020 low) is still expected to resume at a later stage to 78.6% projection of 124.37 (2022 low) to 175.41 (2025 high) from 154.77 at 194.88. However, sustained break of 55 W EMA (now at 179.41) will argue that it's already in a medium term down trend to 175.41 resistance turned support and below.
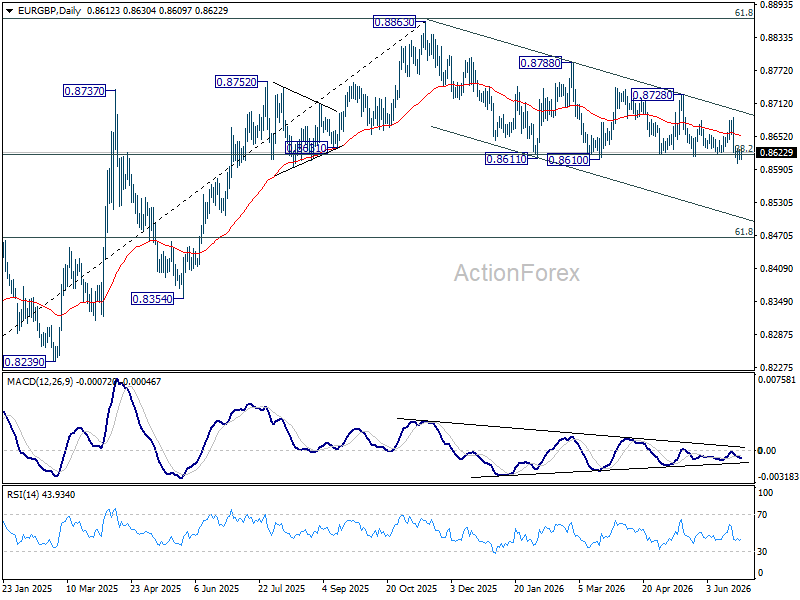
EUR/GBP Daily Outlook
Intraday bias in EUR/GBP remains neutral and focus stays on 0.8610/8 key support zone. Decisive break there will will revive the case of bearish trend reversal, and target 0.8466 fibonacci level. Nevertheless, firm break of break of 0.8686 resistance will bring further rally back to 0.8728 resistance.
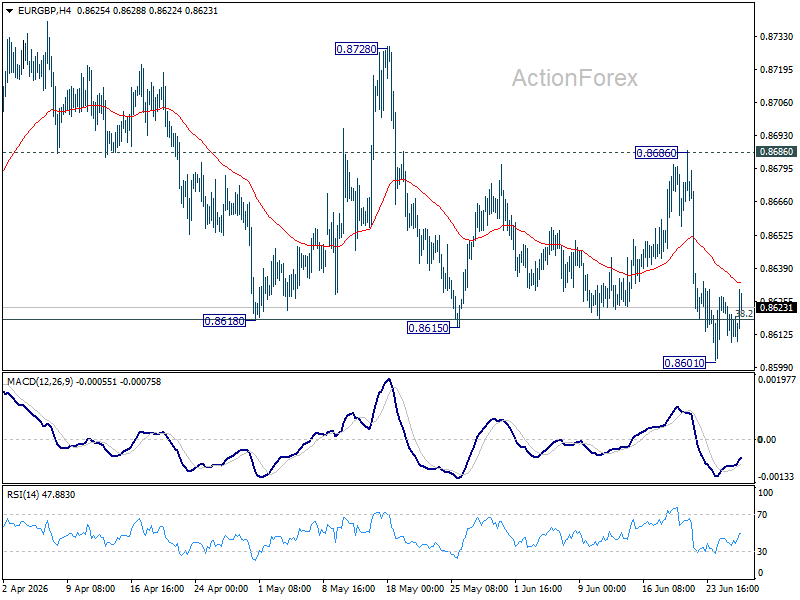
In the bigger picture, focus is staying on 38.2% retracement of 0.8221 to 0.8863 at 0.8618. Strong rebound from there will retain medium term bullishness. Rise from 0.8221 should resume through 0.8863 at a later stage. Nevertheless, sustained break of 0.8618 will confirm that whole rise from 0.8221 has completed at 0.8863. Deeper decline should then be seen to 61.8% retracement at 0.8466 at least.
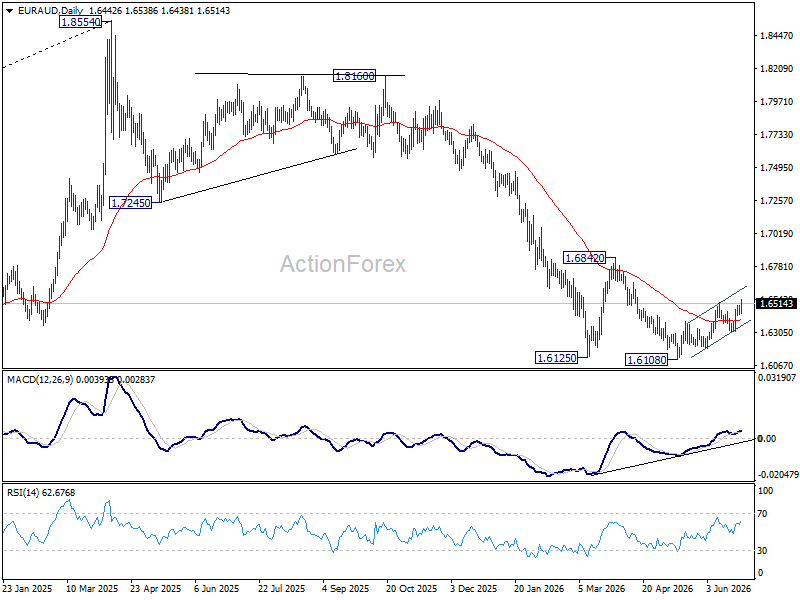
EUR/AUD Daily Outlook
EUR/AUD's rise from 1.6108 resumed by breaking 1.6516 resistance. Intraday bias stays on the upside for 1.6842 resistance. For now, risk will stay mildly on the upside as long as 1.6306 support holds, in case of retreat.
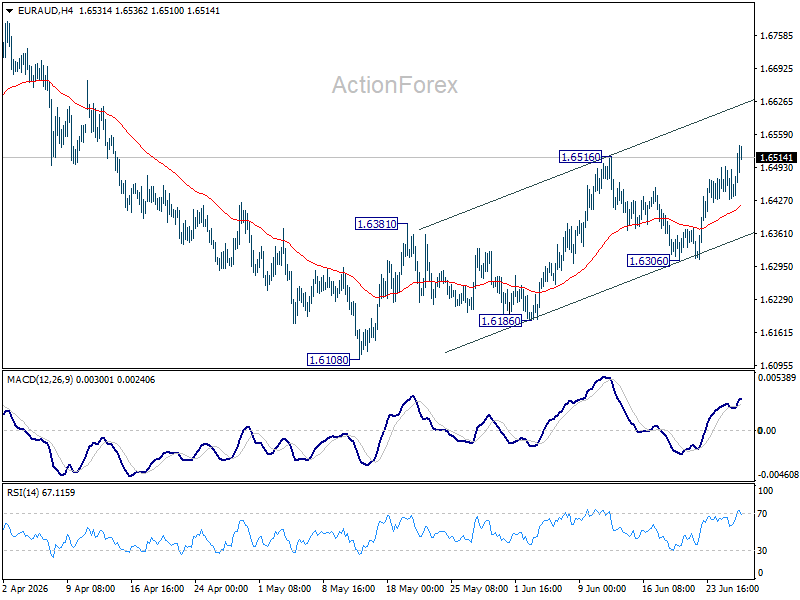
In the bigger picture, outlook will stay bearish as long as 1.6842 resistance holds. Fall from 1.8554 (2025 high) is expected to continue to 61.8% retracement of 1.4281 to 1.8554 at 1.5913. Decisive break there will pave the way back to 1.4281 (2022 low). However, firm break of 1.6842 should confirm medium term bottoming, and bring stronger rally.
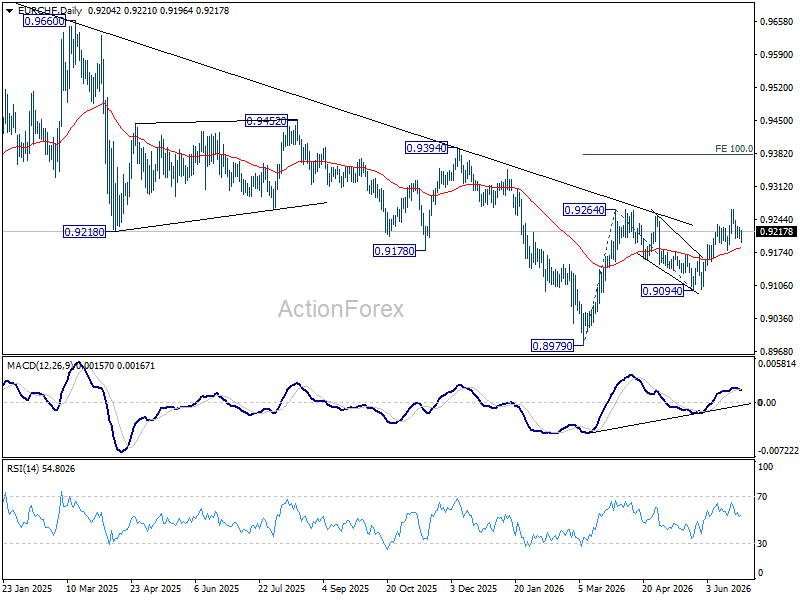
EUR/CHF Daily Outlook
Intraday bias in EUR/CHF remains neutral at this point. On the upside, above 0.9928 minor resistance will argue that pullback from 0.9265 has completed. Further rise should be seen to retest this resistance Decisive break of 0.9264 resistance will resume the rally from 0.8979 to 100% projection of 0.8979 to 0.9264 from 0.9094 at 0.9379. In any case, outlook will stay bullish as long as 0.9179 support holds.
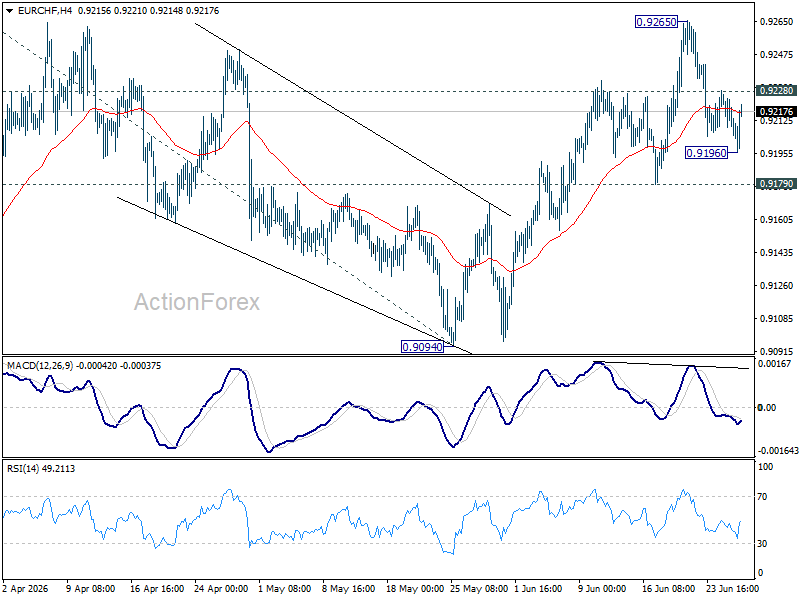
In the bigger picture, the break of medium term falling trend line resistance indicate that 0.8979 is already on medium term bottom. Considering bullish convergence condition in W MACD, rise from there should at least be reversing the fall from 0.9928, with prospect of developing into a medium term up trend. Firm break of 0.9394 resistance will add more credence to this case. For now rise will remain on the upside as long as 0.9094 support holds, in case of retreat.
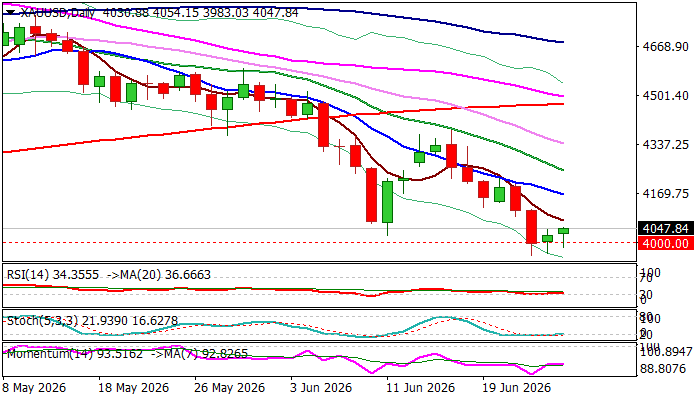
Gold – Bears Pause at Significant $4000 Support
Gold price ticks higher on Friday after repeated failure to register clear break of psychological $4000 support.
The metal is on track for the fourth consecutive weekly loss, pressured by stronger dollar on growing expectations that Fed will start raising interest rates, with the first action expected as early as September.
Thursday’s US PCE data (Fed’s preferred inflation gauge) showed that inflation rose above 4% for the first time in three years, adding to growing bets for rate hike.
Bears face strong headwinds at $4000 zone which marks significant support (attacked for the first time since early November 2025), with oversold daily studies and anticipated partial profit-taking at the end of the week, expected to provide temporary support to the price.
Limited upticks are likely to mark positioning for fresh push lower, as long as fundamentals remain dollar favorable and daily techs firmly bearish.
Solid resistance at $4170 (falling 10DMA / 50% retracement of $4382/$3959 bear-leg) should ideally cap upticks and keep intact barriers at $4200 (round-figure) and $4220 (Fibo 61.8%).
Res: 4076; 4121; 4170; 4200
Sup: 4000; 3959; 3886; 3800
The Dollar: Has It Peaked?
- The USD index is retreating as the likelihood of a Fed rate hike diminishes.
- Gold has lost the ‘debasement trade’ as a key driver and is facing capital outflows from ETFs.
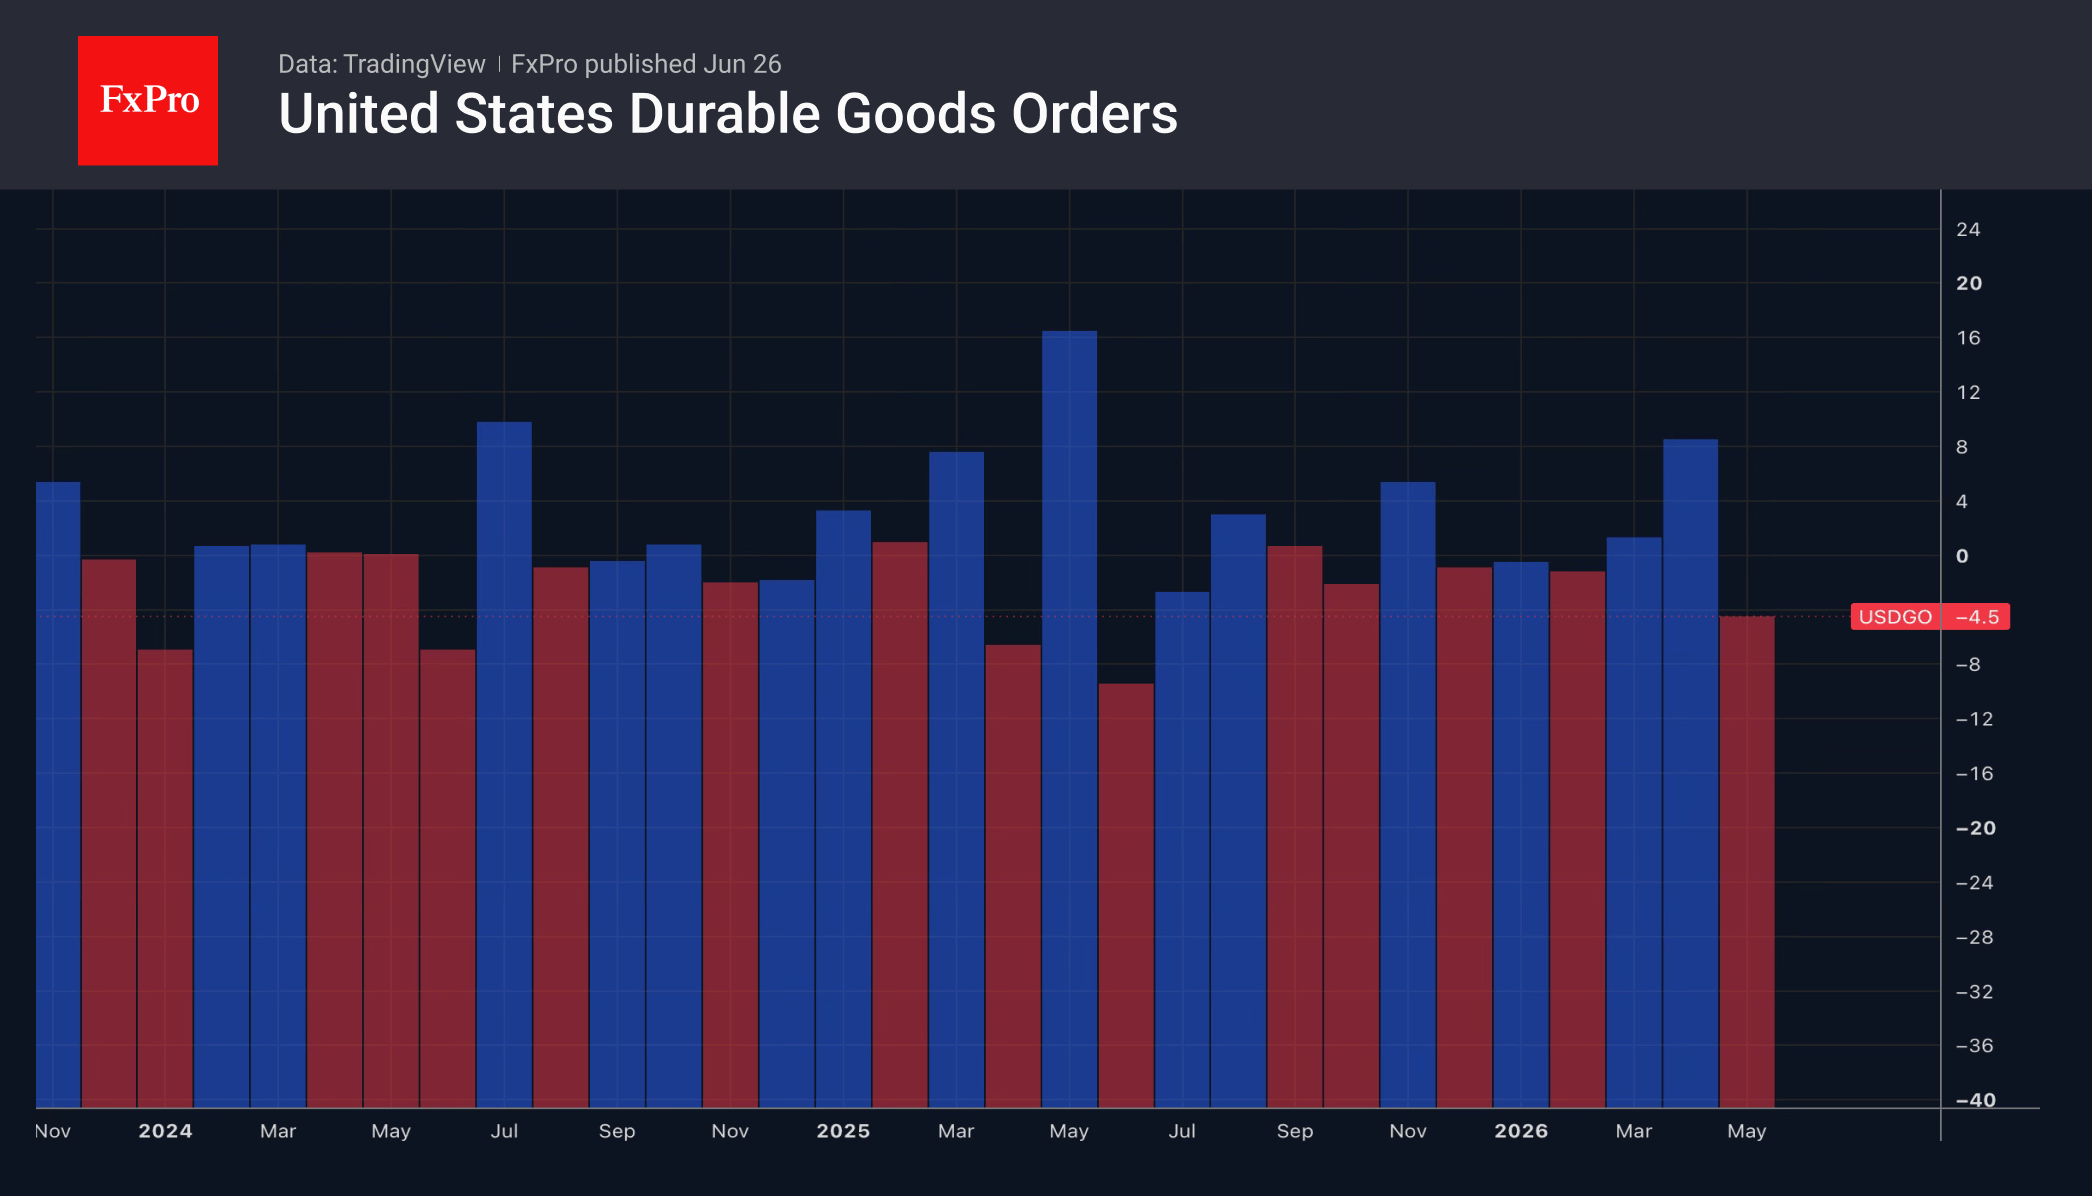
The US dollar took a hit after the macroeconomic data. Orders for durable goods fell 4.5% month-on-month in May, while the personal consumption expenditure index rose 0.4% month-on-month, falling short of forecasts. Despite an upward revision to first-quarter GDP, consumer spending proved weaker than expected. Combined with a statement from the Fed’s Williams that monetary policy is well-positioned, this pushed the USD index back from its recent highs.
The futures market has reduced the probability of a September monetary policy tightening to 58% and of two hikes in 2026 to 36%. US Treasury yields have plunged alongside, putting pressure on the US dollar.
Continuing falls in stock indices and the escalation of the conflict in the Middle East were poised to lend a helping hand to the greenback. There, Iran targeted a tanker passing through the Strait of Hormuz for the first time in two weeks. Nevertheless, the US did not escalate. The White House stated that no one was injured and that the movement of cargo through the world’s key oil artery continues.
The US dollar’s retreat has breathed new life into USDJPY bears. The yen has pulled back from its 40-year lows. The government’s verbal interventions have done little to help. Nor has the statement by the Bank of Japan’s hawks on the need to bring the overnight rate to a neutral level of 2 per cent as quickly as possible.
Markets are drawing attention to the discrepancy between Tokyo’s fiscal and monetary policies. Sanae Takaichi’s new economic stimulus programme called for the BoJ to assist the government in sustaining domestic demand. Typically, this is achieved through lower interest rates.
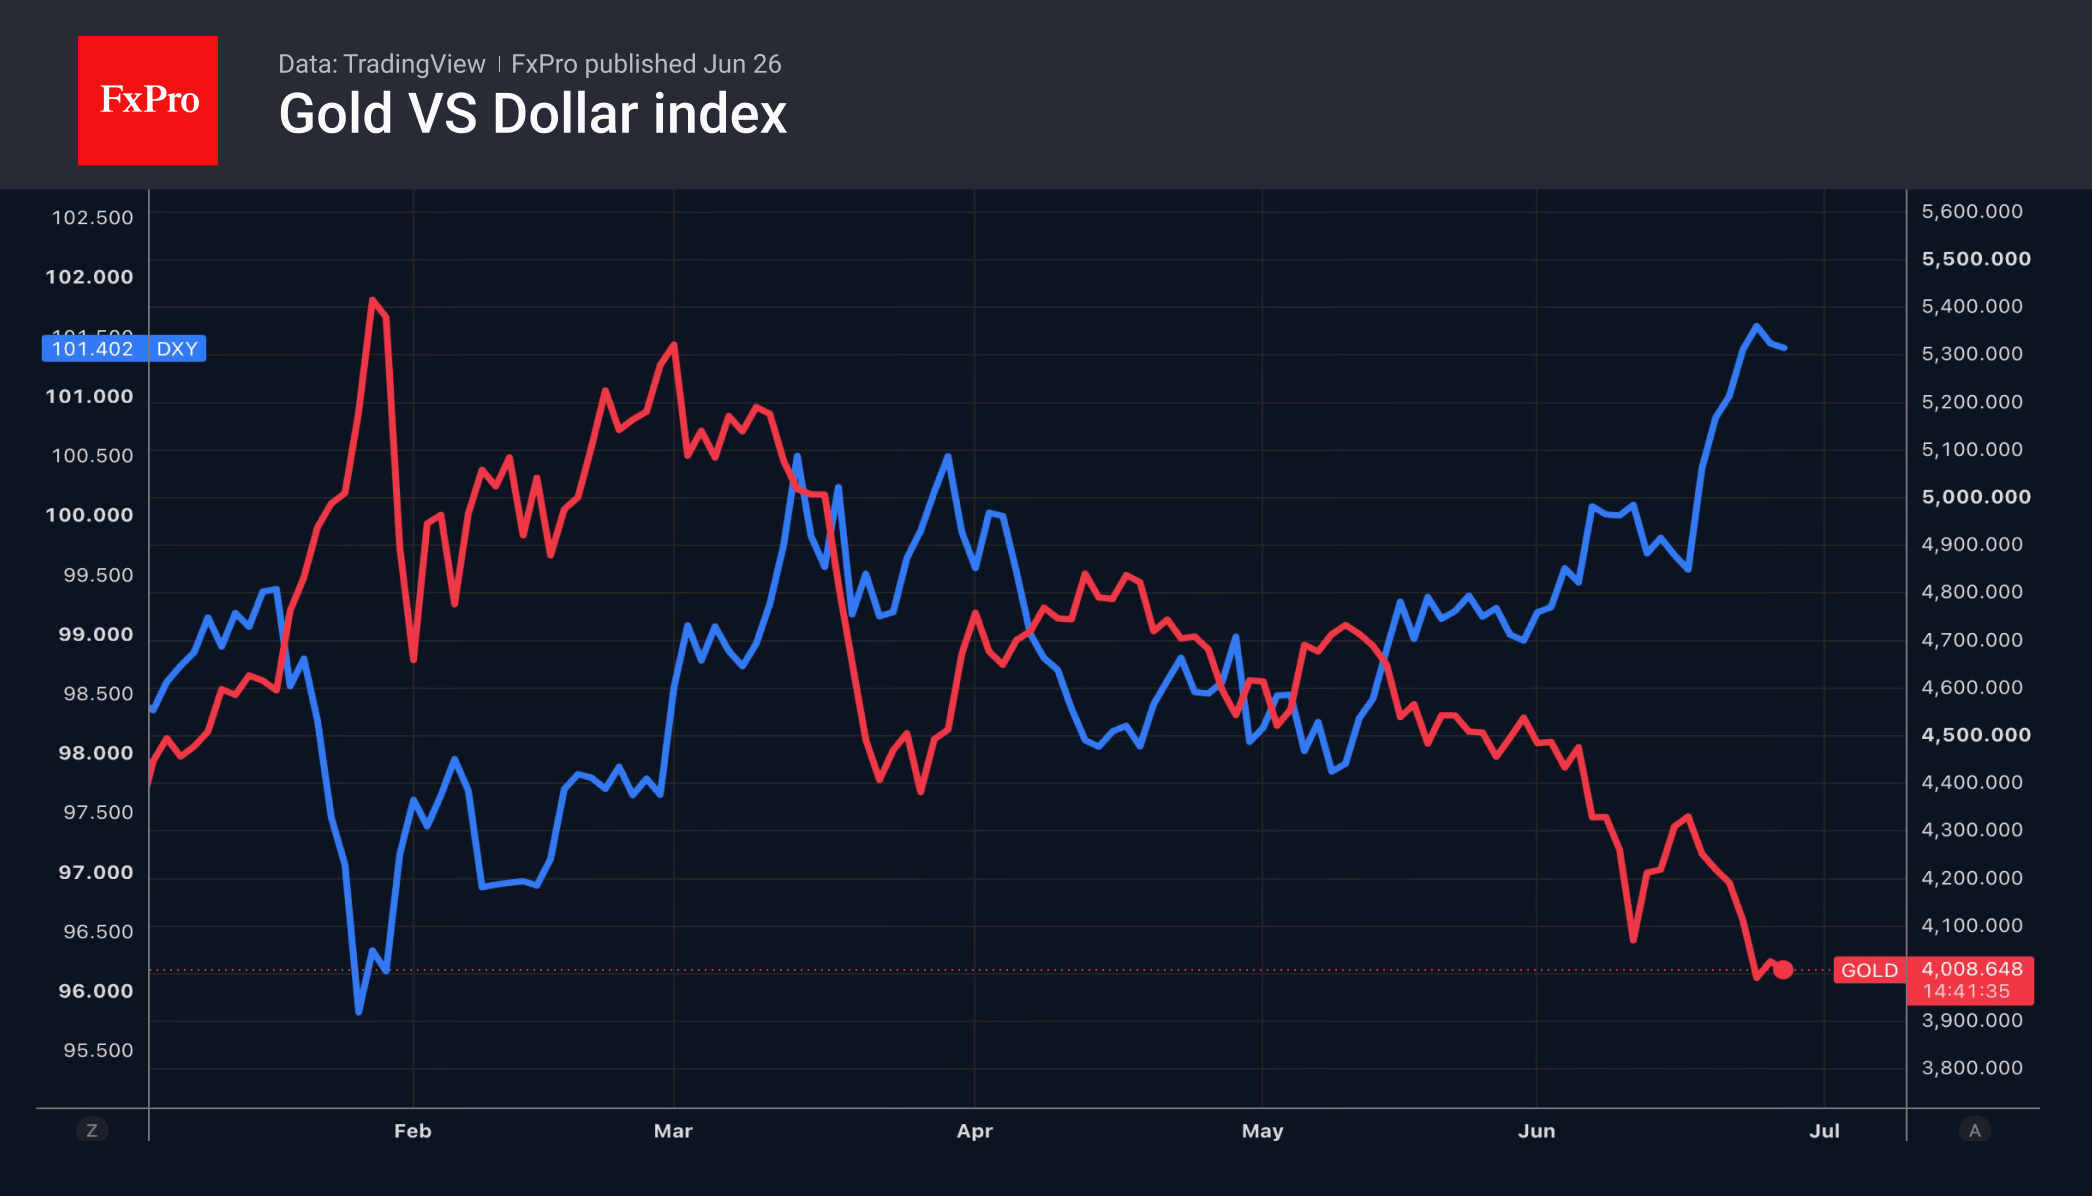
The decline in the USD index and US Treasury yields has allowed gold to find its footing. The precious metal is facing headwinds as it loses a key advantage: the ‘debasement trade’. The focus of the Fed and other central banks on tightening monetary policy is boosting the appeal of fiat currencies. At the same time, there has been a capital outflow from ETFs. Their holdings have fallen by $12 billion since the end of February, marking the worst four-month period since 2013.
The FxPro Analyst Team
The Crypto Market Has Tested the $2T Mark
Market Overview
The crypto market capitalisation fell from $2.12T to $2.02T before rebounding to $2.06T, where it had stabilised at the time of writing as active trading began in Europe. Selling pressure intensified after a fresh downward surge in stock indices. This morning, cryptocurrencies again appeared stable or rebounding, but these sentiments will only be tested once active US trading begins. Over the past 24 hours, the top performers among the most liquid coins were AAVE (+5.6%), Solana (+0.7%) and Theta Network (+0.1%). Lagging behind were Algorand (-6.7%), Polkadot (-6.2%) and NEAR Protocol (-6.1%).
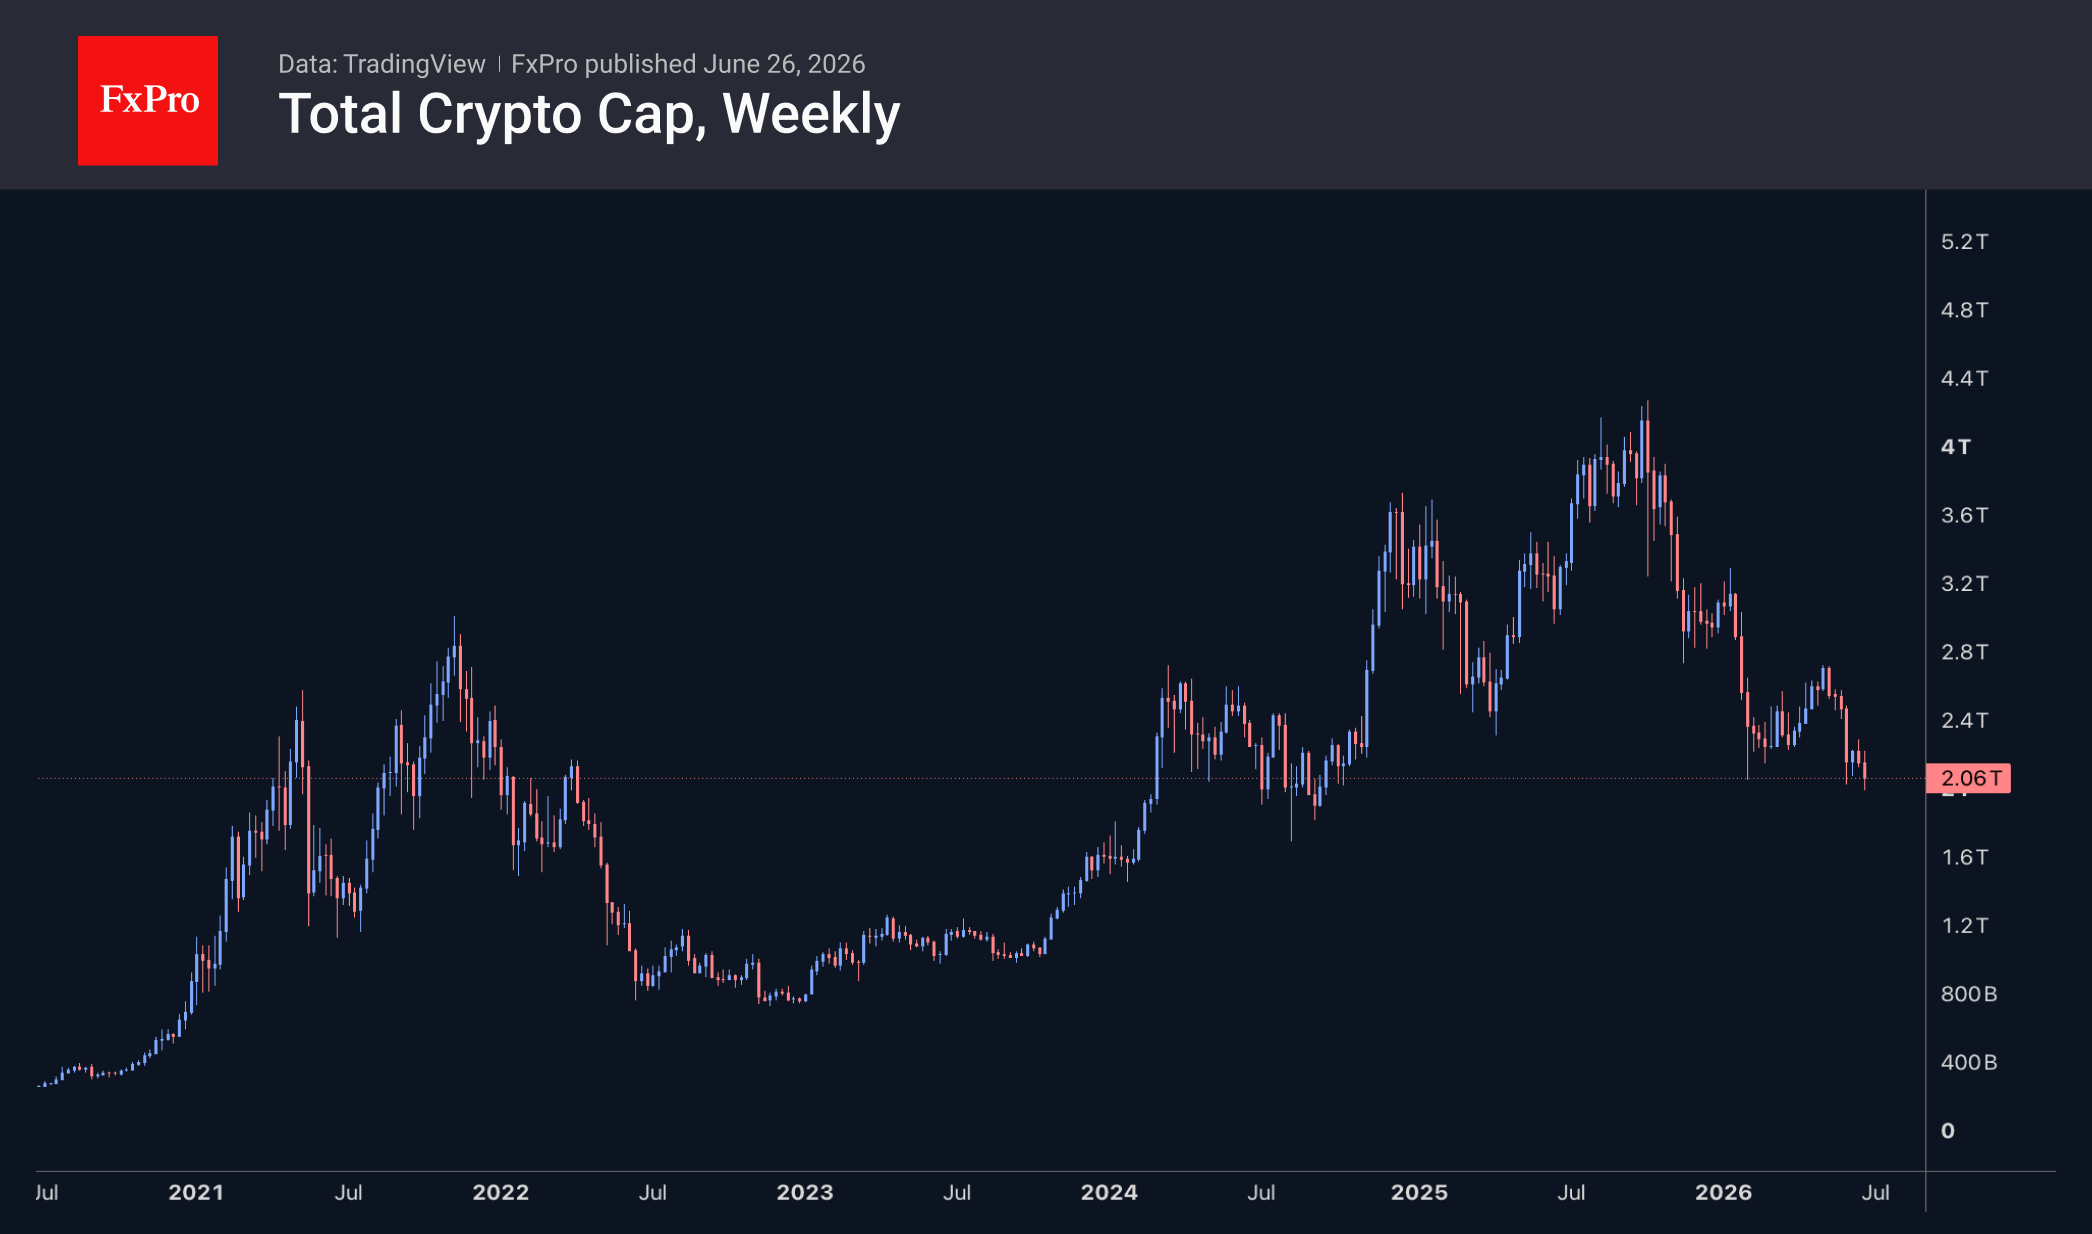
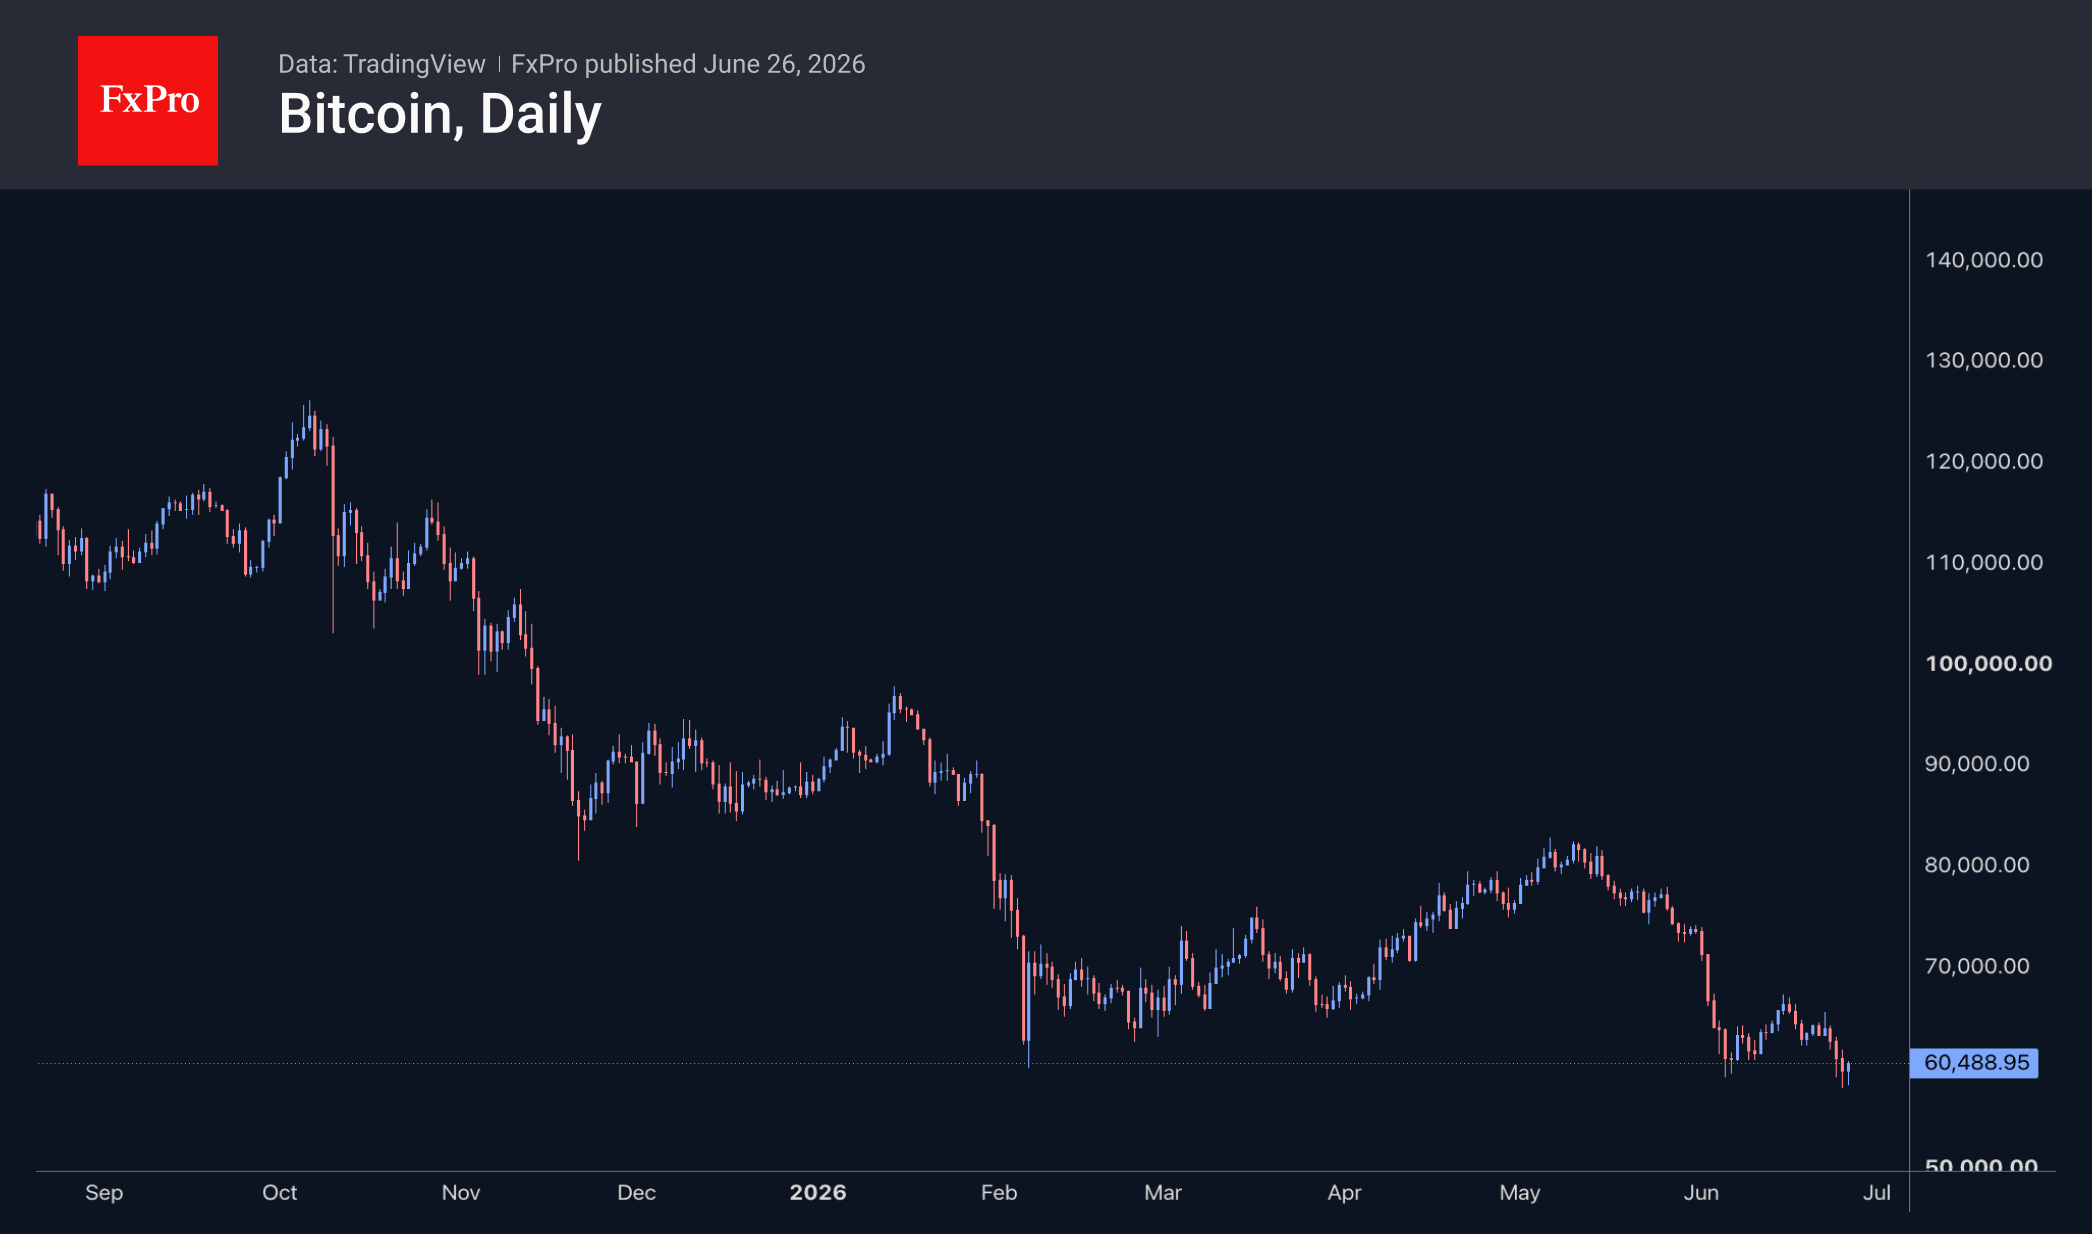
Bitcoin approached $58K at its lows late Thursday and early Friday, but in both cases, aggressive buying quickly pushed it back into the $60K range. This pattern resembles margin position liquidations during downtrend spikes, followed by strong buying on pending orders during the recovery. Given deteriorating sentiment among institutional investors and their ability to quickly divest from cryptocurrencies to stabilise their balance sheets, it is worth preparing for continued pressure and periodic sell-off spikes by leveraged traders.
News Background
Bitcoin plummeted to $58K amid a surge in aggressive selling on Binance, according to analyst Amr Taa. His data shows that spot market sales volume reached nearly $4 billion in two hours.
Bitcoin’s sharp fall coincided with the opening of the US market and a further deviation from par value of Strategy’s STRC preference shares. Concerns are mounting about Strategy’s financial health, as it lacks sufficient dollar reserves to pay dividends and reduce its debt burden, potentially prompting the sale of part of its BTC holdings.
Technical analysts are highlighting the emergence of a ‘head and shoulders’ pattern on the monthly chart for Strategy’s ordinary shares (MSTR), which could lead to an 80 per cent fall in the share price. The pattern is reminiscent of the dot-com bubble era, when MSTR shares formed a similar pattern and subsequently lost more than 99% of their value over the following two years.
Major players are accumulating Bitcoin at record rates against a backdrop of panic selling by retail investors, and the psychological divide between the two groups is widening to extreme levels, CryptoQuant notes.
The FxPro Analyst Team