Sample Category Title
US Oil Falls Lower
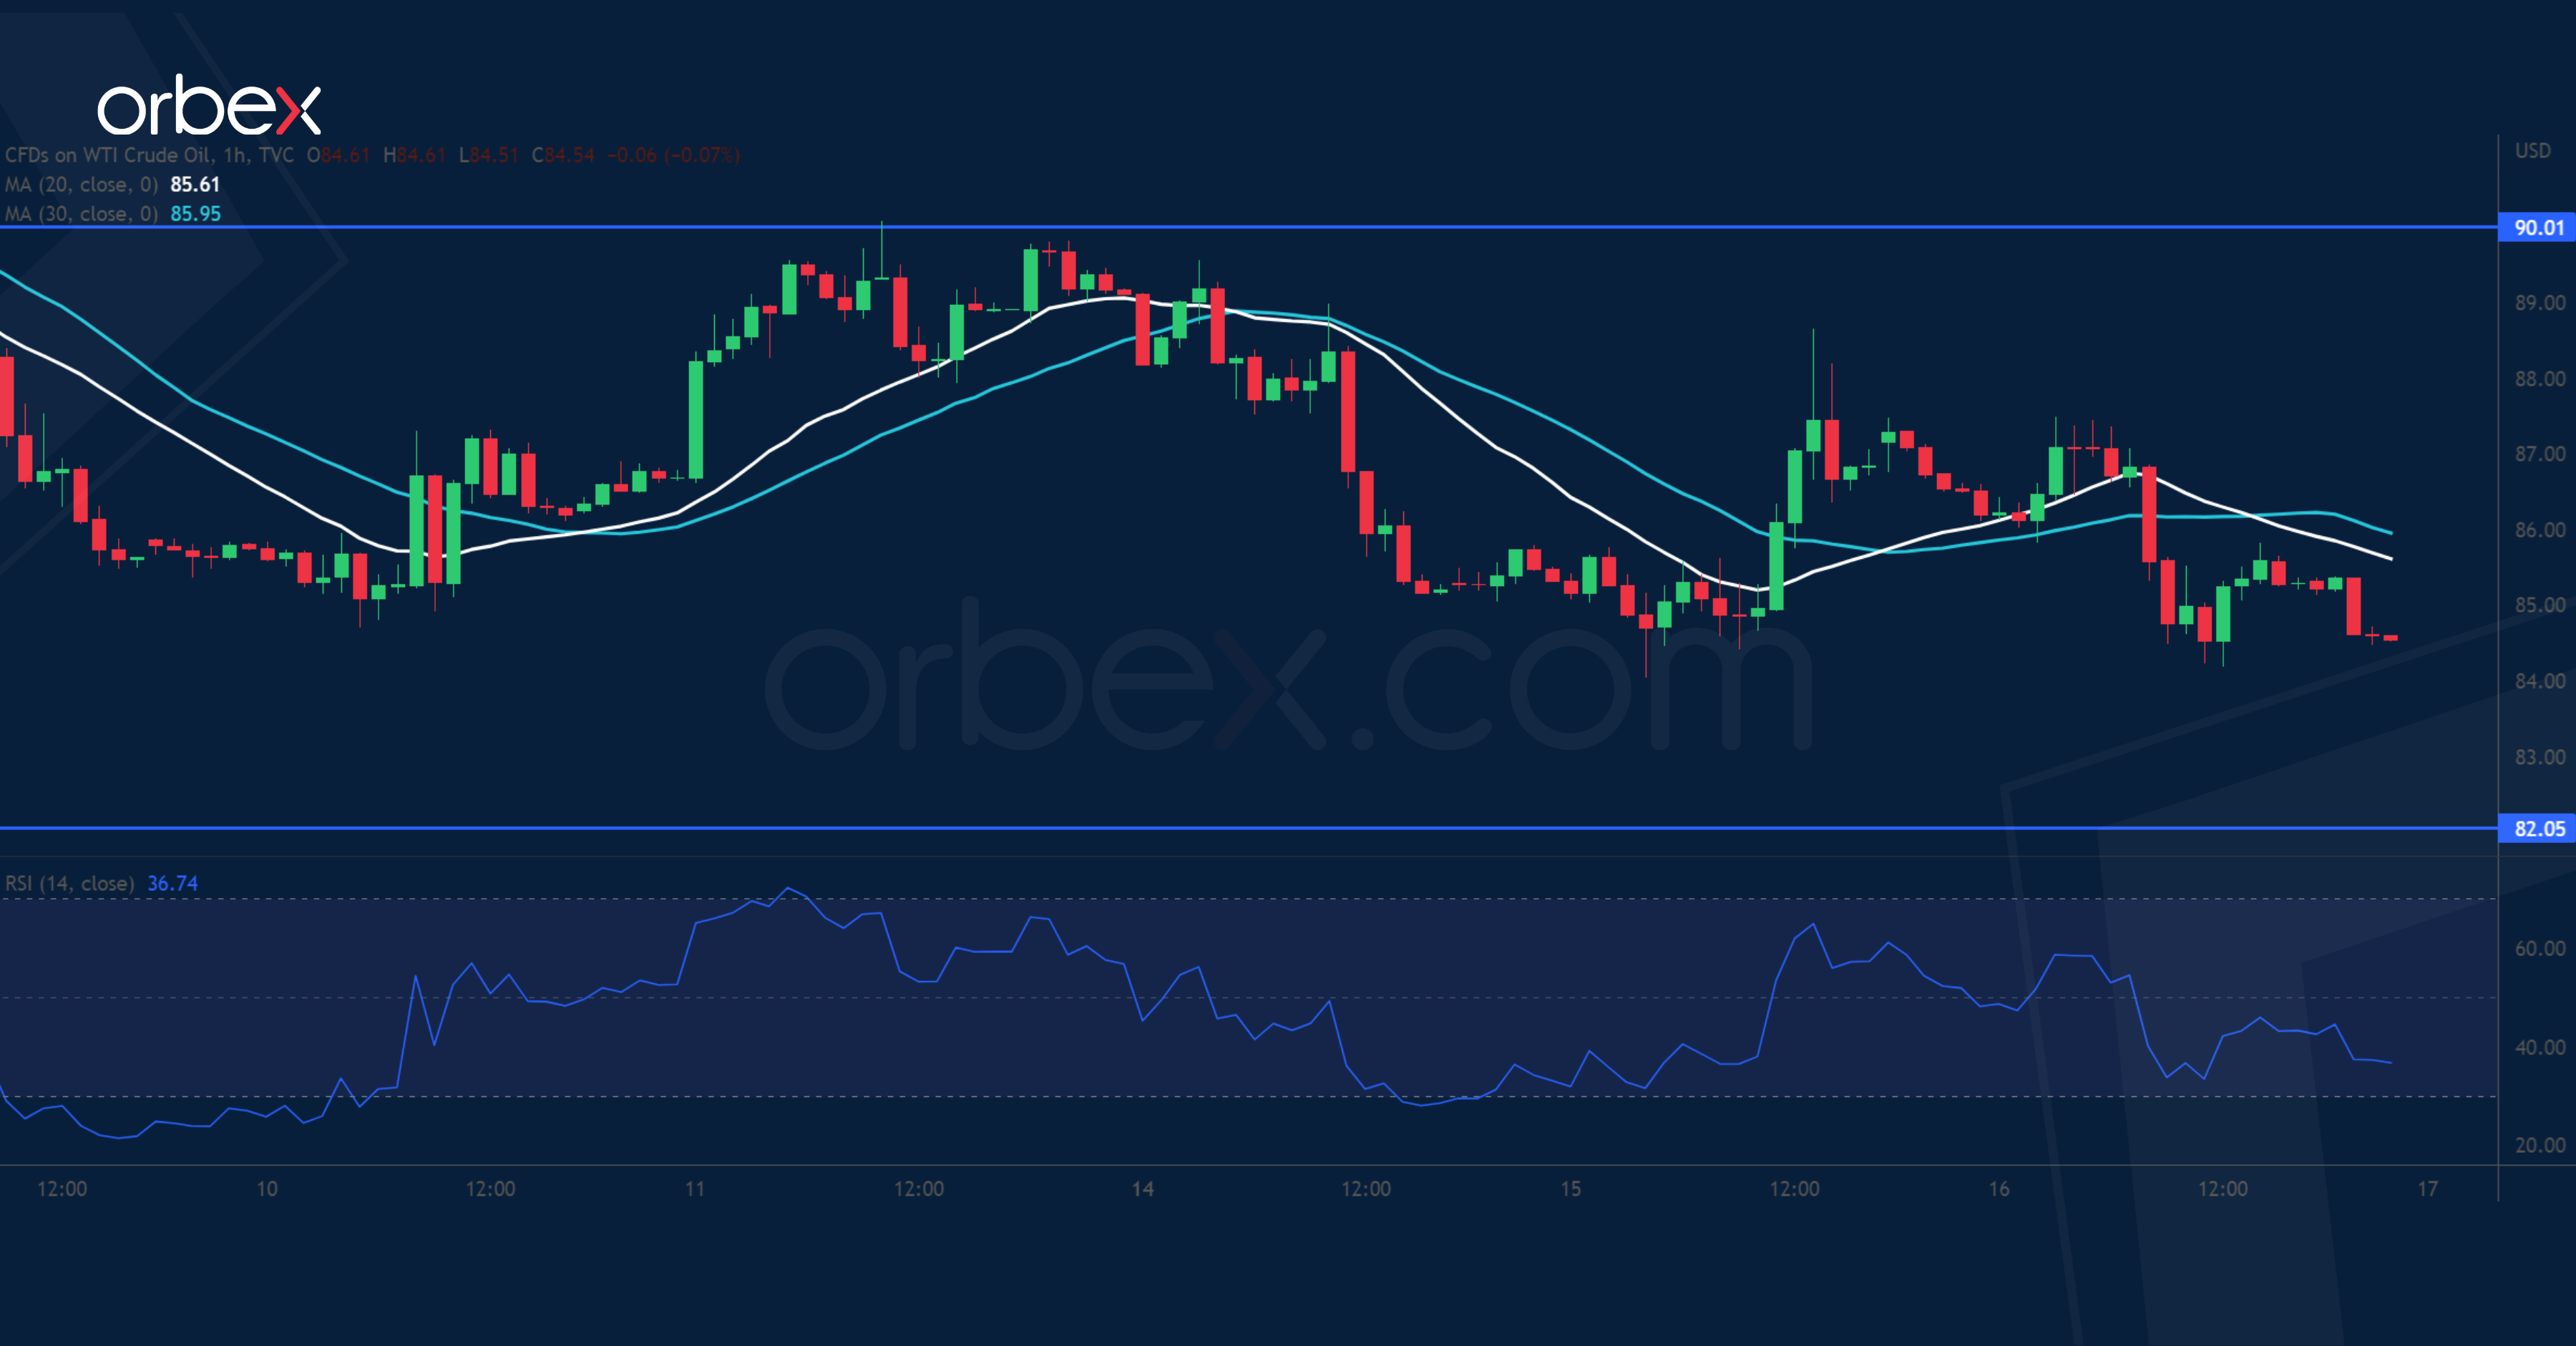
WTI crude remains feeble amid rising COVID-19 cases in China. The price is in a horizontal consolidation between 82.00 and 93.50, but the downward pressure is still omnipresent following a double top at the upper band. Two consecutive falls below 88.00 and 85.00 have put the bulls on the defensive. As the latest rebound stalled at the psychological level of 90.00, the commodity could be vulnerable to a new round of sell-off. A drop below 82.00 might attract momentum sellers and push the price towards 77.00.
USDCAD Attempts to Rebound
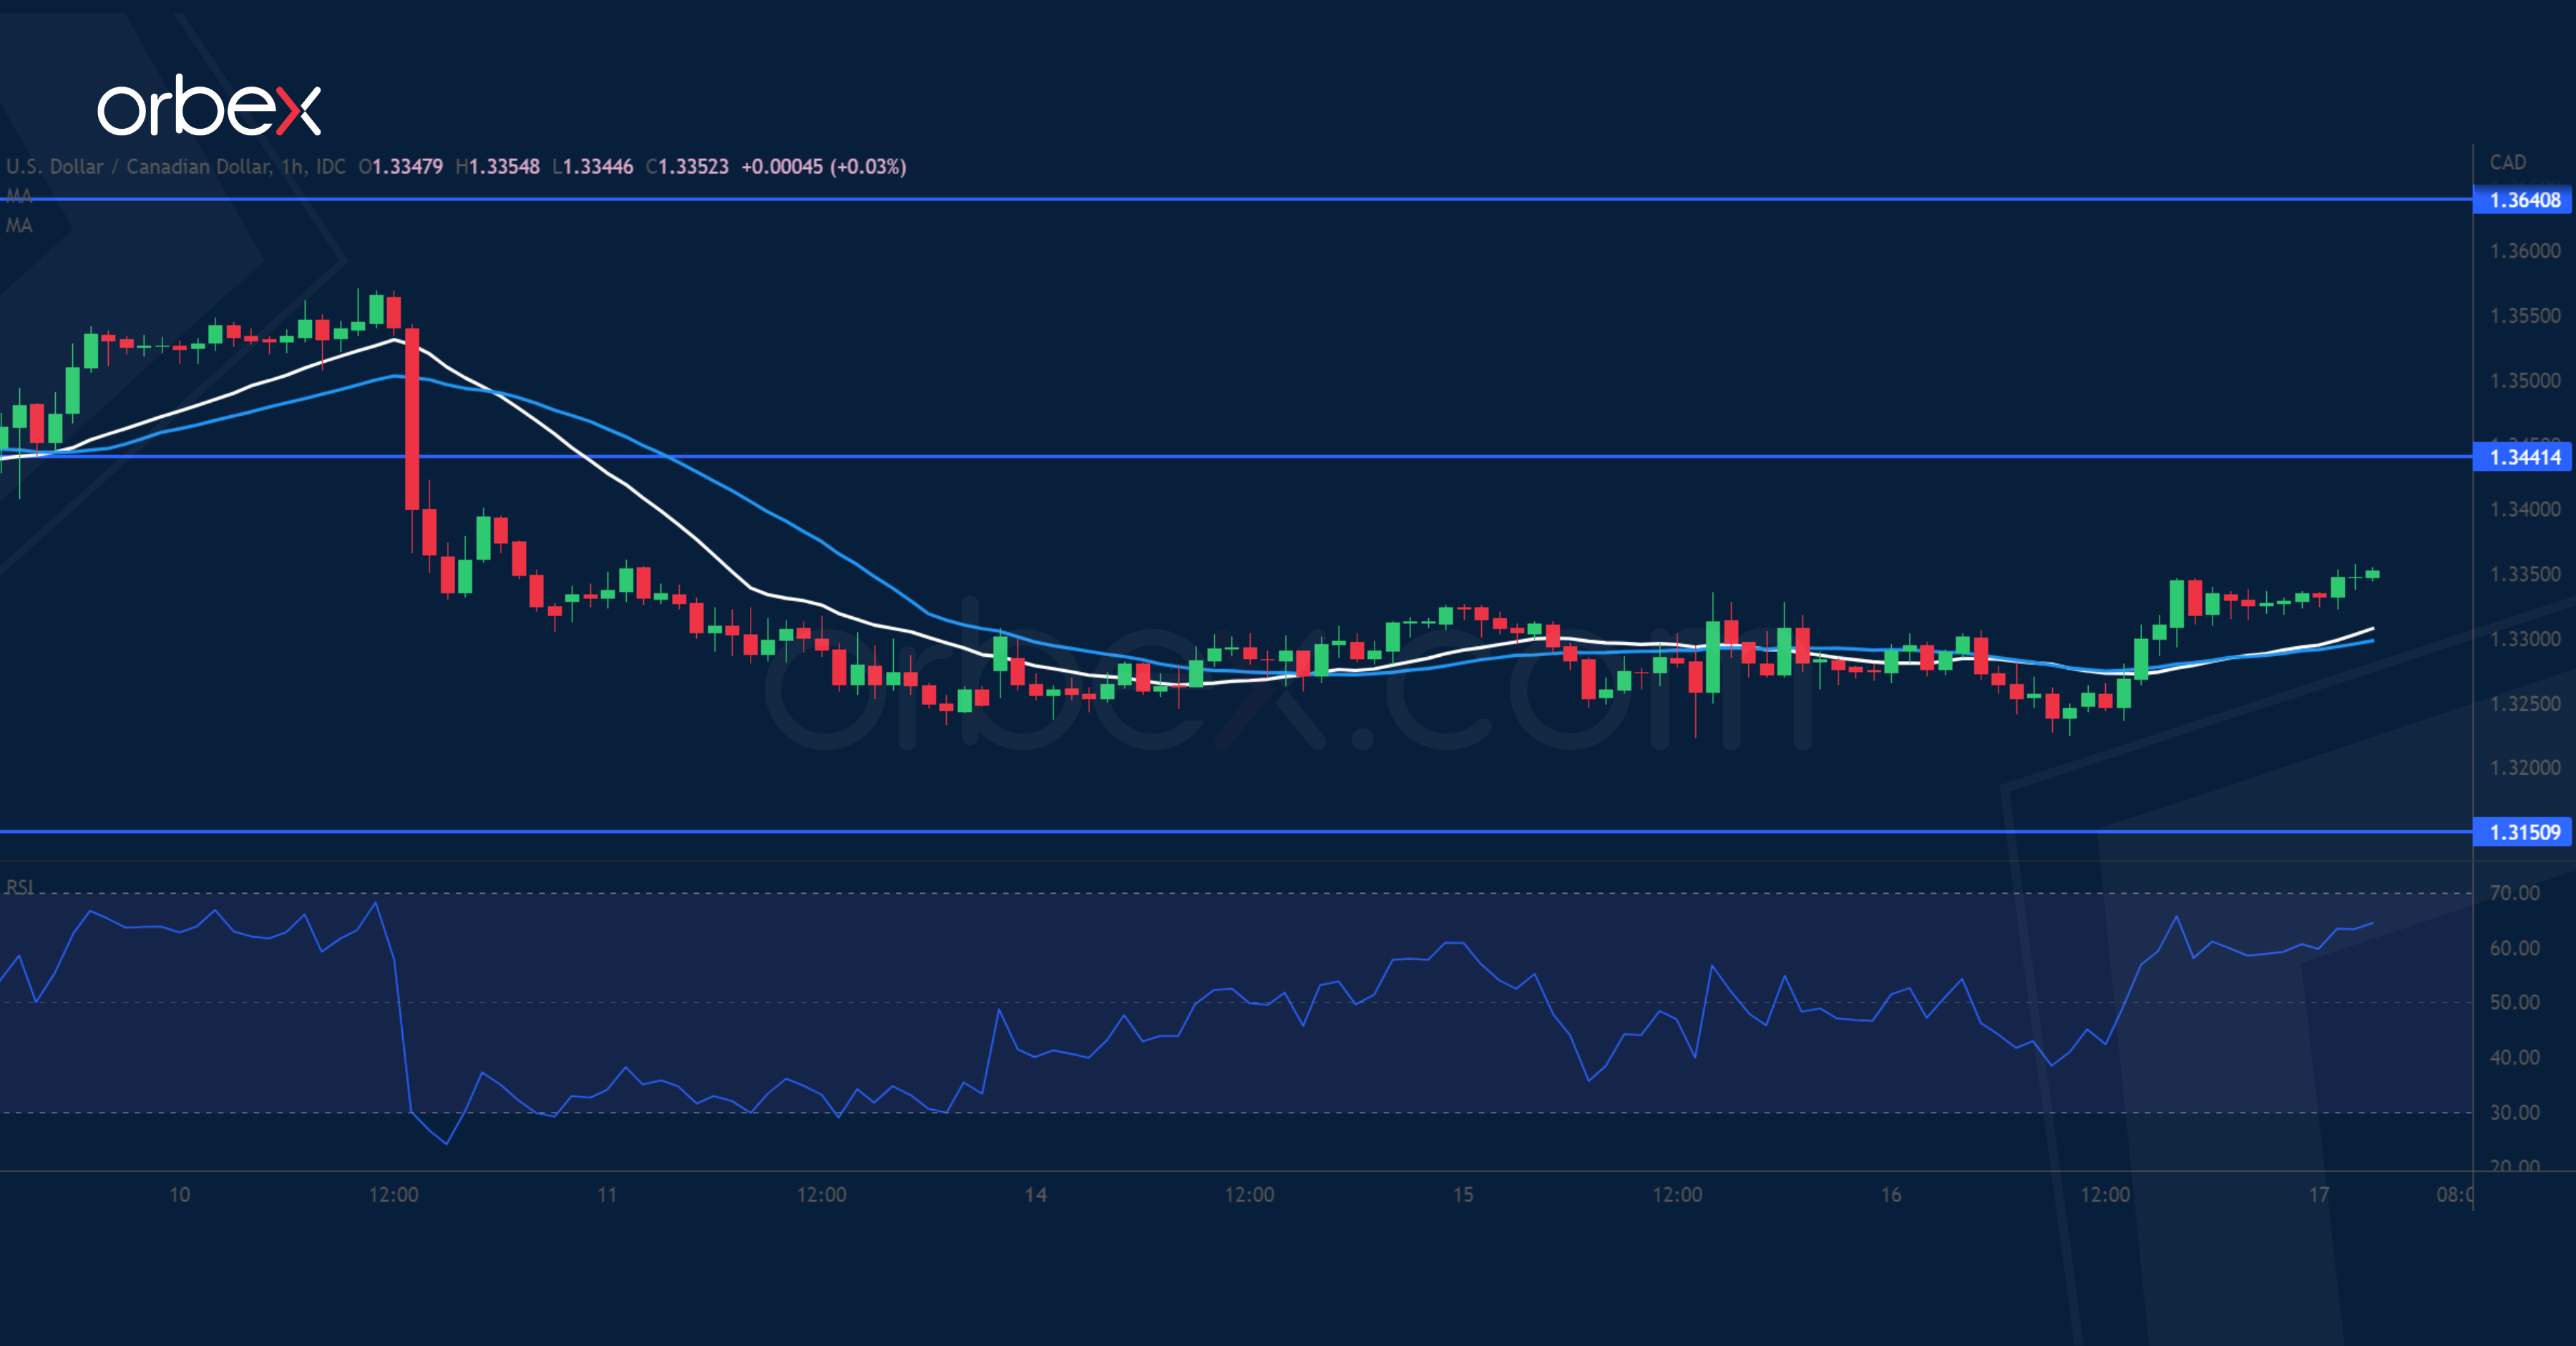
The Canadian dollar slid as October’s inflation fell short of expectations. A dip below 1.3240 indicates a lack of demand for the US counterpart. The greenback may continue to lose ground as traders stay on the sidelines for fear of catching a falling knife. 1.3150 is the immediate level to see whether it could trigger a buy-the-dips behaviour. Failing that, the psychological level of 1.3000 would be on the line. For those looking to buy, 1.3440 is the first hurdle to clear and the pair may only regain a foothold once above 1.3640.
GBPUSD Keeps High Ground
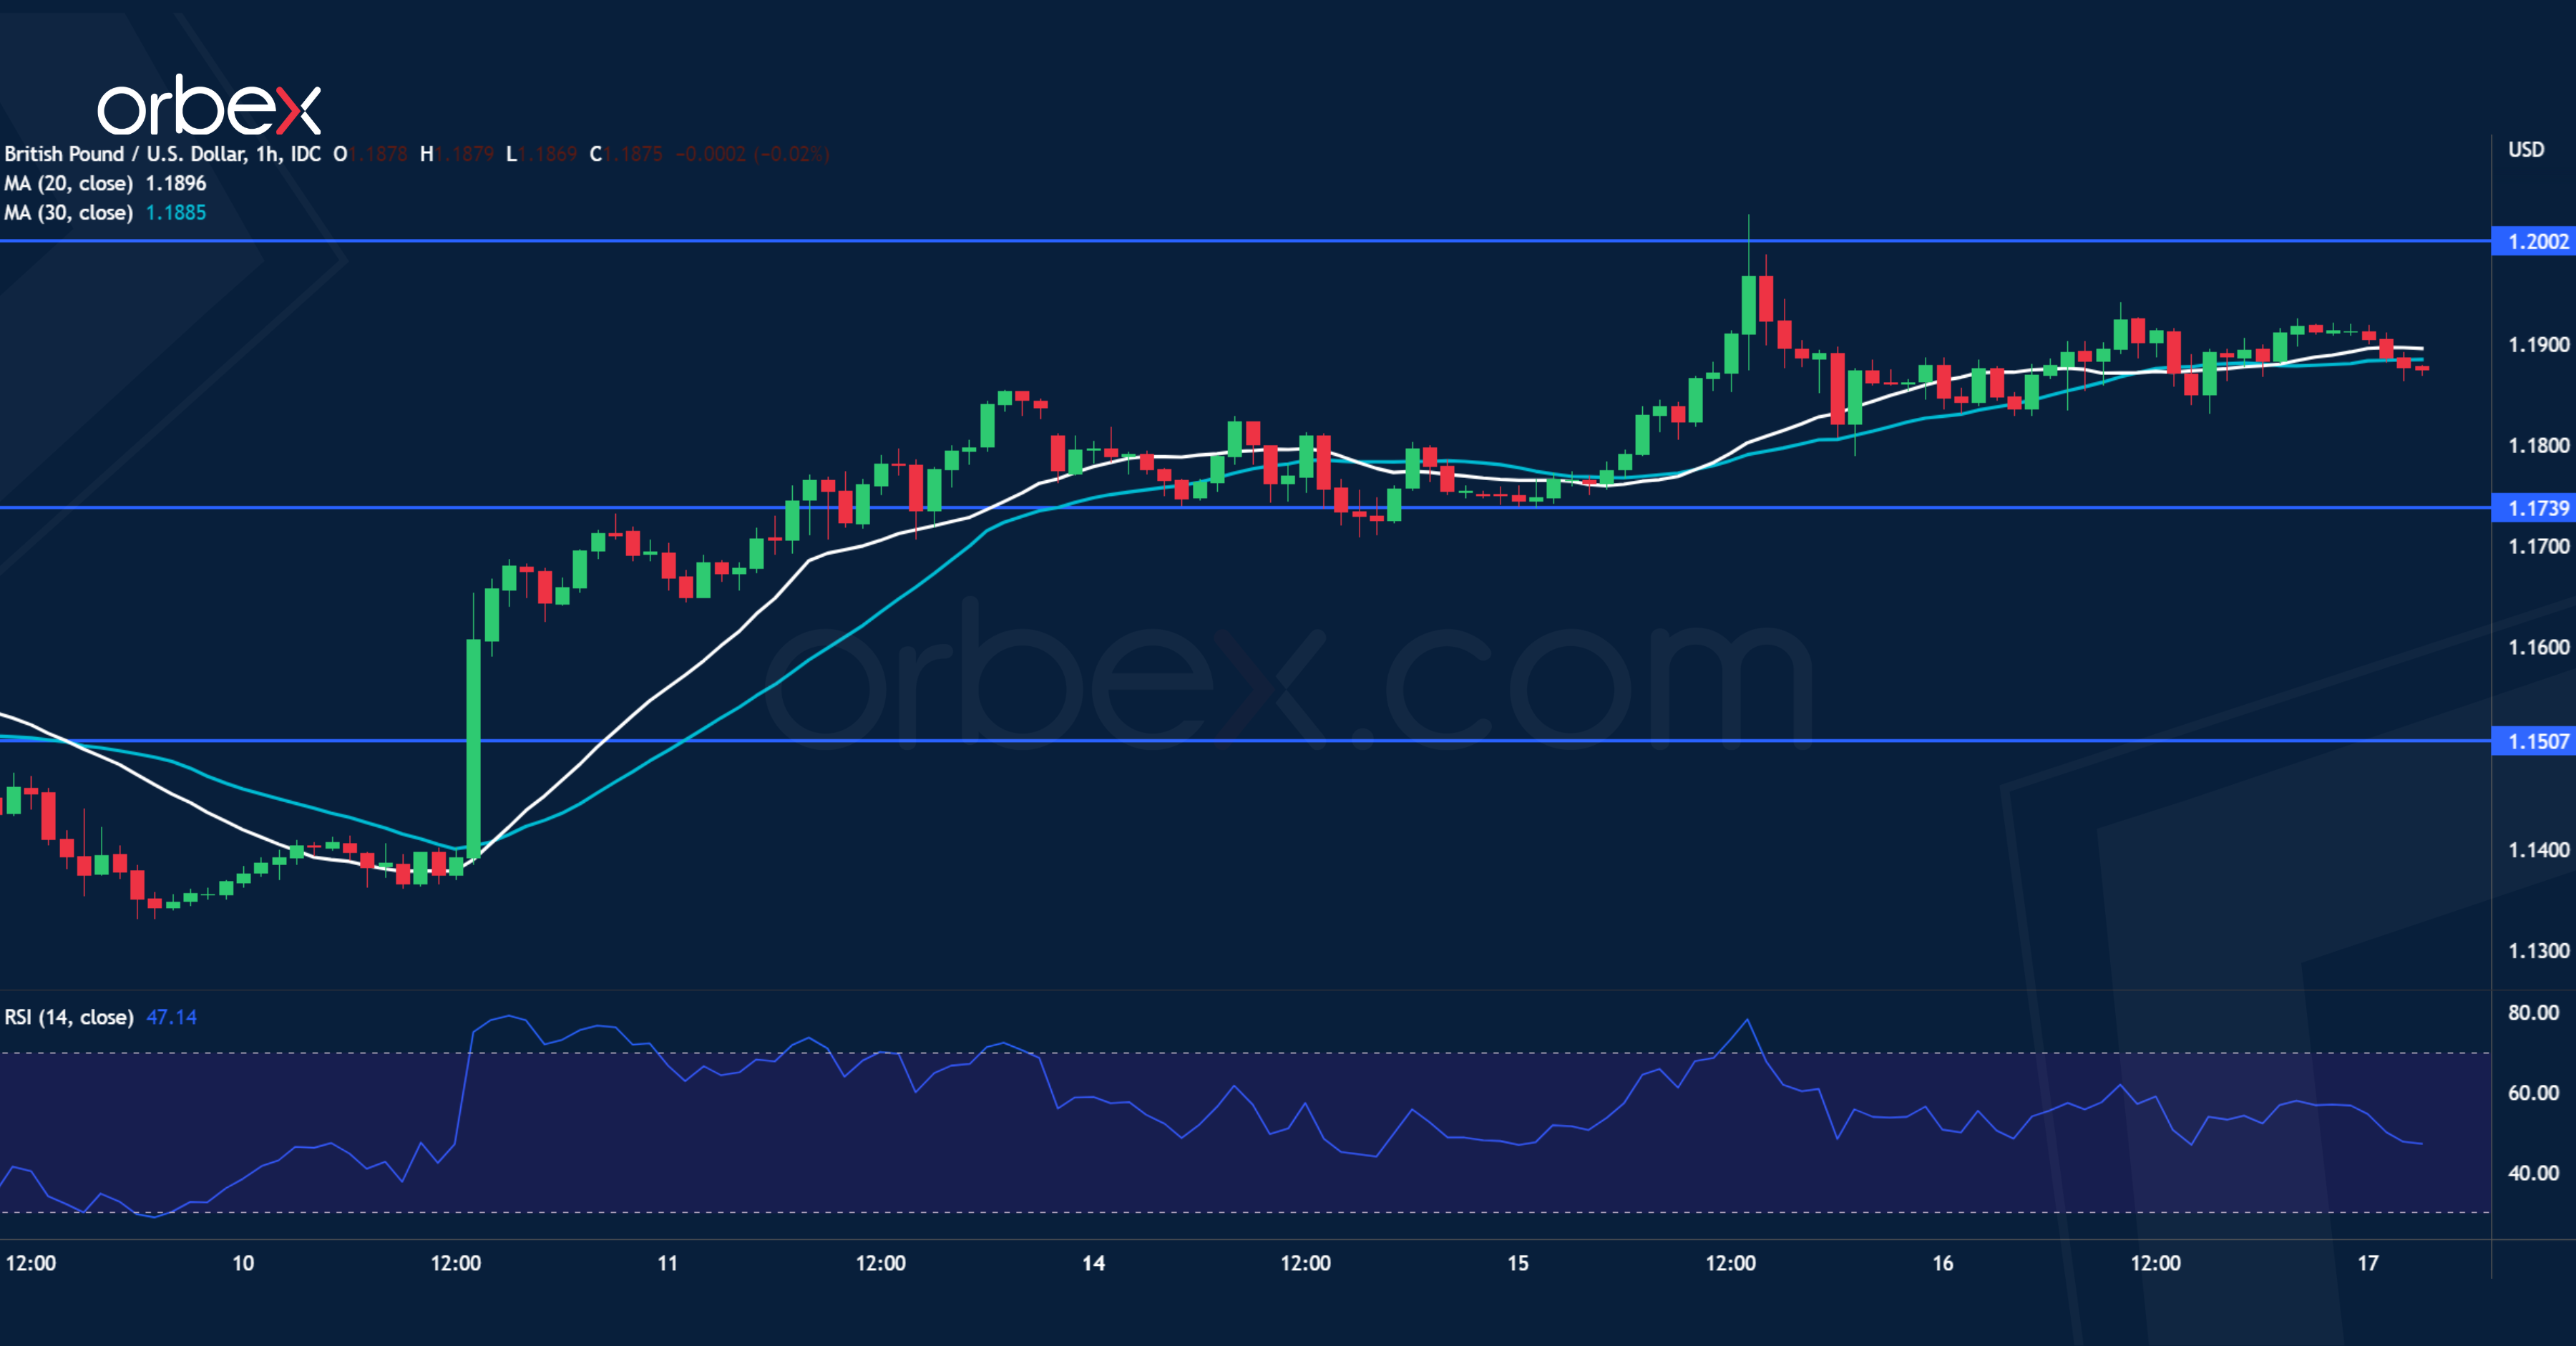
Sterling rallies as red hot inflation in the UK calls for more interest rate hikes by the BoE. A break above September’s high of 1.1740 has prompted some bears to cover their positions, easing the downward pressure from the daily chart’s perspective. A brief pause above this resistance-turned-support suggests that there is still juice in the recovery. August’s double top at 1.2250 would be next should the rebound pick up speed past 1.2000. 1.1500 near the origin of a bullish breakout is a key demand zone.
There’s a Lack of momentum within ECB to Push for Another 75 bps Hike in Dec
Markets
EUR/USD didn’t revisit Tuesday’s high yesterday as an early attempt to regain traction was blocked by stronger US retail sales and by ECB comments. The pair eventually closed below 1.04 and is trading there still. Initial optimism came from NATO and international comments suggesting that the missile on Polish territory was an unfortunate accident from Ukrainian air defense systems, nevertheless sparked by Russian missile attacks against the country. Better US retail sales were later erased by an unexpectedly steep drop in US homebuilder sentiment (see below). Dovish comments of Bank of France Villeroy were later echoed in a more general Bloomberg article. People close to the matter suggested that there’s a lack of momentum at the moment within the ECB to push for another 75 bps rate hike in December. Everything seems to be boiling down to the November inflation figure which will be released on Nov 30. It is extremely relevant both as an indicator of price pressure and as a number to feed into quarterly forecasts. Another upward surprise seems necessary to keep the 75 bps hiking pace going. Reasons to slow it down to 50 bps include mounting recession risks, the arrival at a neutral deposit rate of 2% and the near start of the balance sheet reduction via partly halting APP redemptions.
Core bonds extended their good run of late with US yields ceding up to 12.2 bps at the very long end of the curve and rising by 1.6 bps at the front end. US yields lost necklines of double top formations at tenors from 3y onwards earlier this week. The US 10-yr yield drop below 3.9% took it in no time to 3.7% currently with strong support arriving at 3.64% (38% retracement on August/October upleg) and 3.5% (previous cycle high in June). The final target of the double top formation stands in the same zone (3.47%). We believe this is the maximum potential of the current correction lower in US yields. Afterwards, we stick with more sideways action ahead of the mid-December policy meetings by central banks with new real upward yield potential only arriving early January, after the traditional low-volume Christmas period. The German yield curve bull flattened with yields 7.3 bps (2-yr) to 11.5 bps (30-yr) lower. The German 10-yr yield closed just below 2%. First support stands at 1.95% (end of October low) with 38% retracement on the August/October rise at 1.82% and the October low of 1.77% the key levels to watch. The forward view is similar as for US Treasuries. Today’s eco calendar contains more US housing data, Philly Fed Business Outlook and weekly jobless claims. UK Chancellor Hunt in his Autumn Statement will present long-term Budget plans. Speeches by central bank governors remain wildcards.
News Headlines
The Australian labour market posted an unexpectedly strong performance in October. Employment growth rose by 32.200, compared to a modest decline of 3;800 in September. Markets only expected a rise of about 15 000. The rise was fully driven by a 47.100 jump in full employment. Total hours worked rose a strong 2.3%. The unemployment rate eased from 3.5% to 3.4%, a cycle low and the lowest level since 1974. The participation rate was unchanged at 66.5%. Yesterday, Australian Q3 wage growth data also surprised on the upside off expectations at 1.0% Q/Q and 3.1% Y/Y. A persistent strong labour market questions speculation of late that the Reserve Bank of Australia might be nearing the end of its rate hike cycle . The RBA recently indicated that already quite some tightening has been put in place that takes to filter through into the economy. Even after today’s data markets still only see about a 75% chance of an additional 25 bps rate hike at the early December RBA meeting. The 2-y Government bond yield temporary rebounded but still trades about 6 bps lower in a daily perspective. The Aussie dollar doesn’t profit, trading near AUD/USD 0.6720.
The NAHB index in sentiment among US homebuilders yesterday showed a larger than expected deterioration declining from 38 to 33. The index reached the lowest levels since mid-2012, disregarding the bottom at the start of the corona crisis in 2020. According the tot NAHB statement, “higher interest rates have significantly weakened demand for new homes as buyer traffic is becoming increasingly scarce”. The decline was visible both in the subseries for current and future single family home sales as well as in expected buyers traffic.
How Austere?
Better-than-expected US retail sales didn’t please investors yesterday, as it fueled, again, inflation expectations. Higher inflation expectations fueled the hawkish Federal Reserve (Fed) expectations. And hawkish Fed expectations fueled recession worries – without however Fed being there to disperse cheap money.
US indices gave back gains yesterday. The S&P500 slid 0.83% and Nasdaq fell 1.54%.
Sour earnings from Target, which highlighted that nice-to-have stuff like clothes and electronics didn’t sell well in the latest quarter, because of rising prices, didn’t help lift the investor mood.
JP Morgan economists said they expect the US to enter a mild recession next year because of the rising rates and the tightening monetary conditions. And again, because recession will be triggered by higher rates and QT, the Fed won’t be a shoulder to cry on for investors.
Prospect of slower global economy, along with the de-escalation of geopolitical tensions on news that the rockets that hit Poland this week were from the Ukrainian defense, and probably landed in Poland by accident, pulled oil prices lower yesterday.
The barrel of American crude slid below $85 despite a more-than-5-mio decline in US crude inventories. The price is below the summer triangle, and sitting near the bottom of the long-term ascending trendline. While slower global growth, and recession are arguments that could push oil prices under the bus, oil bulls still have the tight supply, uncooperative OPEC for lower prices, and the Chinese reopening jokers in their hands. Therefore, further weakness into the $80/82 should meet a solid dip-buying interest.
Ugly news for Brits?
Inflation in Britain rose past the 11% mark last month. The Office of National Statistics said that inflation would have been nearly 14% if government actions to limit the energy bills hadn’t been there.
But the government won’t continue spending money to make things easier for Brits moving forward. Today, the much-expected budget announcement will finally hit the fan.
And it won’t be pretty.
The UK braces for ‘austerity in steroids’ wrote Bloomberg, reminding that Sunak government must fill in a £55 billion hole by increasing taxes and cutting spending.
For investors, though, austerity means a more stable budget, less negative pressure on the sovereign bonds, and an ideally stronger British pound.
Cable consolidates near the 1.19 mark this morning. Maybe we won’t see a kneejerk positive reaction right away, because politicians tend to overpromise and underdeliver. But in all cases, we are confident that the budget announcement under Sunak won’t trigger the same chaos as under Liz Truss.
Sunak Speaks
Market movers today
In the UK, we look forward to the Chancellor's Autumn Statement today, where PM Sunak's government will spell out its fiscal plans. It is widely expected to include tax increases across the board to fill up the hole of approximately GBP 50bn in the UK's public finances.
Euro area inflation surprised again to the upside in October and the final release today will provide details on the drivers.
US housing starts will probably bring more evidence that the housing market continued to cool in October. A range of Fed speakers will also be on the wires.
Norges Bank (NB) will release the results of its Q4 expectations survey. For NB to continue to signal a trade-off between inflation and growth, wage and price expectations need to be anchored. We believe it is too soon to expect a meaningful drop in inflation expectations, but wage expectations (for next year) could well level off, giving some support to NB's narrative.
The 60 second overview
US: Votes from the US midterm election have been counted and the Republican party won majority in the House of Representatives by a slim margin.
Macro: US retail sales rose 1.3% in October and much more than expected by analysts. Higher gasoline prices explain some of the rise in consumer retail spending, but sales were broad based. It also means that the drop in CPI hardly reflects a drop in US demand.
Oil: The Druhba oil pipeline was up and running again yesterday after a power outage due Russian missile strikes on Tuesday halted flows. Quiet has returned to oil prices after the brief spike.
FI: Global bond yields continue to decline from the long end of the curve. 10Y US Treasuries fell 9bp, while 10Y Bunds fell 11bp and we are again below 2% in the Bund. We also saw a widening of the German ASW-spreads after a long period where the ASW-spreads have tightened.
FX: Relatively quiet day yesterday, as soon as the geopolitics were taken care of. EUR/USD rally potentially losing steam and consolidating around 1.04 for now, while Scandies have traded on the back foot in recent sessions. Brent oil 1.5% lower since start of the week and US equities in red yesterday. PLN regain its previous losses, with EUR/PLN back at 4.70, as there was no further escalation yesterday.
Credit: Credit markets took a breather from a long streak of gains, with iTraxx Xover widening almost 14bp while Main widened 3bp.
Nordic macro
Norges Bank (NB) will release the results of its Q4 expectations survey. For NB to continue signal a trade-off between inflation and growth, wage and price expectations need to be anchored. We believe it is too soon to expect a meaningful drop in inflation expectations, but wage expectations (for next year) could well level off, giving some support to NB's narrative.
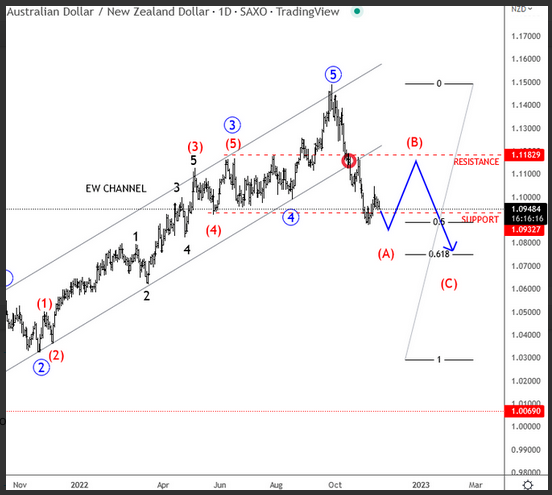
AUDNZD Turning Bearish, More Weakness after Rally
AUDNZD has been trading nicely higher since start of the year and formed a clear bullish impulse. Notice that price also reached the upper trendline of an EW channel which is usually the ending point of a higher degree structure. We talked about this in our past updates and warned about a bearish turning point which is now in full progress and will most likely resume much lower as pair came sharply out of an upward channel. However, nothing moves in a straight line, so ideally wave A is now approaching some support, thus we can see a rally in (B) in the next few weeks.
AUD/USD Daily Report
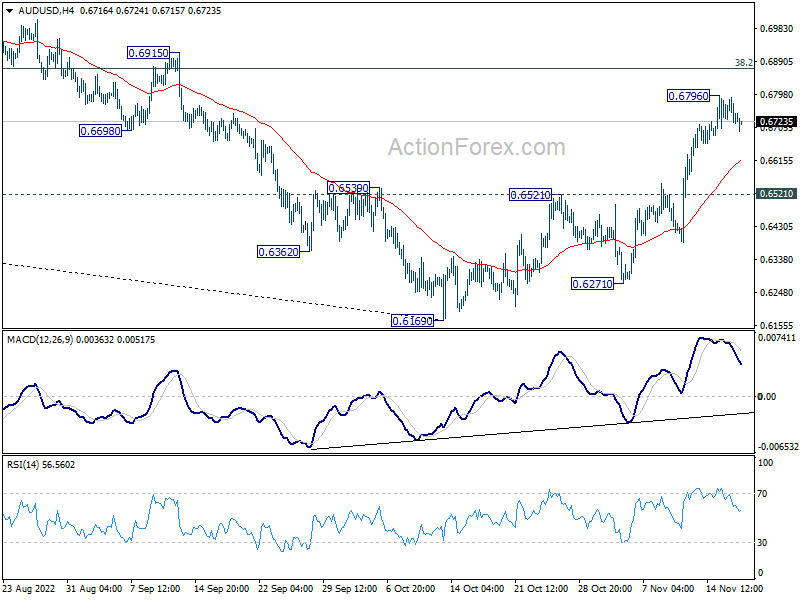
Daily Pivots: (S1) 0.6711; (P) 0.6752; (R1) 0.6784; More...
A temporary top is in place at 0.6796 with current retreat. Intraday bias in AUD/USD is turned neutral for consolidations. Further rally is expected as long as 0.6521 resistance turned support holds. Above 0.6796 will resume the rise from 0.6169 to 0.6871 fibonacci level.
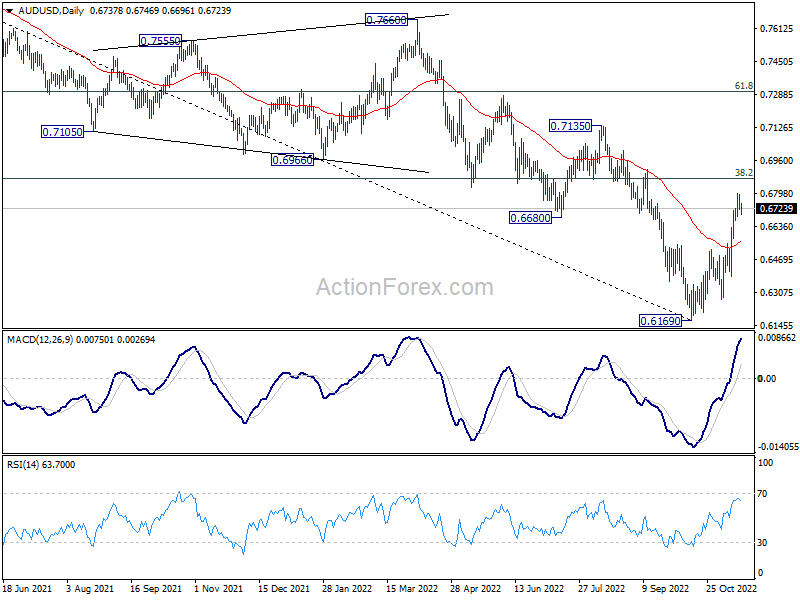
In the bigger picture, the break of 0.6680 support turned resistance confirms medium term bottoming at 0.6169. It's too early to call for trend reversal. But even as a corrective move, rise from 0.6169 should target 38.2% retracement of 0.8006 to 0.6169 at 0.6871. Sustained trading above 55 week EMA (now at 0.6934) will raise the chance of the start of a bullish up trend. This week now remain the favored case as long as 0.6521 resistance turned support holds.
Aussie Dips Despite Solid Job Data, Markets in Consolidations
The forex markets are still engaging in corrective trading in Asian session today. Despite stronger than expected job data, Aussie trades lower following mild risk-off sentiment. Kiwi, Loonie and Sterling are are softer. On the other hand, Dollar, Yen and Swiss Franc are the firmer ones, while Euro is mixed. For now, the selling in Dollar should have been exhausted, and consolidation would likely extend for a while. The question is how much the greenback could recover during this phase.
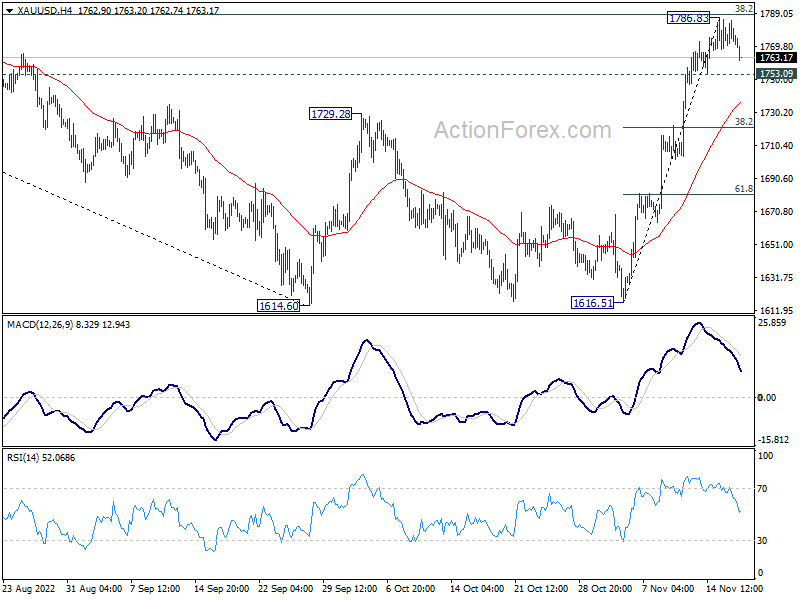
Technically, Gold's development is so far in line with expectation. 1768.83 looks increasing likely a short term top, just ahead of 38.2% retracement of 2070.06 to 1614.60 at 1788.58. Break of 1753.09 minor support will bring deeper fall to 4 hour 55 EMA (now at 1734.49). The key line of defense will be at 38.2% retracement of 1616.51 to 1786.83 at 1721.76. As long as this fibonacci support holds, another rise is still in favor, and that will suggests that recovery in Dollar would be limited.
In Asia, at the time of writing, Nikkei is down -0.31%. Hong Kong HSI is down -2.21%. China Shanghai SSE is down-0.68%. Singapore Strait Times is up 0.53%. Japan 10-year JGB yield is up 0.0004 at 0.246. Overnight, DOW dropped -0.12%. S&P 500 dropped -0.83%. NASDAQ dropped -1.54%. 10-year yield drooped -0.0107 to 3.692.
Fed Waller more comfortable to hike 50bps in Dec, but no judgement before more data
Fed Governor Christopher Waller said in a speech that while the slowdown in CPI in October was "welcome news", "we must be cautious about reading too much into one inflation report"
"I don't know how sustained this deceleration in consumer prices will be," he said. And, it's "way too early to conclude that inflation is headed sustainably down"
Despite raising interest rates from near 0% to 3.75-4.00% in nine months, "policy is barely in restrictive territory today, so more interest rate hikes are needed to get inflation down," he said.
"The Committee will reach the terminal rate well before inflation reaches 2 percent because of the abundance of evidence that it takes months, and perhaps even longer, for the full effects of a rate increase to work through the economy."
"Looking toward the FOMC's December meeting, the data of the past few weeks have made me more comfortable considering stepping down to a 50-basis-point hike. But I won't be making a judgement about that until I see more data, including the next PCE inflation report and the next jobs report."
BoJ Kuroda: May take a long time to achieve price stability with wage hikes
BoJ Governor Haruhiko Kuroda told the parliament that it may "take a long time" to achieve the "price stability target, involving wage hikes". He reiterated that the central bank needs to continue with its monetary easing to support a fragile recovery.
At the same session, Executive Director Shinichi Uchida said it was too early to discuss exit from monetary stimulus. "When exiting, the point will be adjusting long-term and short-term policy rates and the BoJ's balance sheet," Uchida said. "The order and mixture of those factors would differ depending on economy, prices and financial situations at the time."
Japan trade deficit hit another record as import surged
Japan's exports rose 25.3% yoy to JPY 9.00T in October, after shipments of cars and electronics components increased. Imports rose 53.5% yoy to JPY 11.16T, hitting a historical high, as led by crude oil, liquefied natural gas and coal.
Trade deficit came in at JPY -2.16T, a record for the month. Also, Japan has seen as record trade deficit for each month in the past six months, on rising energy and raw material costs, as well as weak Yen exchange rates.
US-bound exports rose 36.5% yoy to JPY 1.78T while imports rose 47.1% yoy to JPY 1.06T. Exports to China rose 7.7% yoy to JPY 1.72T while imports rose 39.3% yoy to JPY 2.39T.
In seasonally adjusted term, exports rose 2.2% mom to JPY 8.91T. Imports rose 4.2% mom to JPY 11.21T. Trade deficit came in at JPY -2.30T.
Australia employment grew 32.3k in Oct, unemployment rate dropped to 3.4%
Australia employment rose 32.2k in October, above expectation of 15.0k. Unemployment rate dropped from 3.5% to 3.4%, below expectation of 3.5%. Participation rate was unchanged at 66.5%. Monthly hours worked in all jobs rose 2.3% mom.
"Although employment in seasonally adjusted terms rose 0.2 per cent in October 2022, the underlying trend estimate was monthly growth of around 0.12 per cent. This was below the average for the 20 years prior to the pandemic of 0.16 per cent," Bjorn Jarvis, head of labour statistics at the ABS said.
"This indicates that while employment has continued to grow, the rate of growth has slowed to below the longer-term average. It has been below this average for the past 5 months."
Looking ahead
Swiss trade balance, Italy trade balance, and Eurozone CPI final will be released in European session. Later in the day, US will release building permits and housing starts, jobless claims, and Philly Fed survey.
AUD/USD Daily Report
Daily Pivots: (S1) 0.6711; (P) 0.6752; (R1) 0.6784; More...
A temporary top is in place at 0.6796 with current retreat. Intraday bias in AUD/USD is turned neutral for consolidations. Further rally is expected as long as 0.6521 resistance turned support holds. Above 0.6796 will resume the rise from 0.6169 to 0.6871 fibonacci level.
In the bigger picture, the break of 0.6680 support turned resistance confirms medium term bottoming at 0.6169. It's too early to call for trend reversal. But even as a corrective move, rise from 0.6169 should target 38.2% retracement of 0.8006 to 0.6169 at 0.6871. Sustained trading above 55 week EMA (now at 0.6934) will raise the chance of the start of a bullish up trend. This week now remain the favored case as long as 0.6521 resistance turned support holds.
Economic Indicators Update
| GMT | Ccy | Events | Actual | Forecast | Previous | Revised |
|---|---|---|---|---|---|---|
| 21:45 | NZD | PPI Input Q/Q Q3 | 0.80% | 2.60% | 3.10% | |
| 21:45 | NZD | PPI Output Q/Q Q3 | 1.60% | 2.10% | 2.40% | |
| 23:50 | JPY | Trade Balance (JPY) Oct | -2.30T | -2.23T | -2.01T | -2.04T |
| 00:30 | AUD | Employment Change Oct | 32.2K | 15.0K | 0.9K | -3.8K |
| 00:30 | AUD | Unemployment Rate Oct | 3.40% | 3.50% | 3.50% | |
| 07:00 | CHF | Trade Balance (CHF) Oct | 3.70B | 4.0B | ||
| 09:00 | EUR | Italy Trade Balance (EUR) Sep | -4.05B | -9.57B | ||
| 10:00 | EUR | Eurozone CPI Y/Y Oct F | 10.70% | 10.70% | ||
| 10:00 | EUR | Eurozone CPI Core Y/Y Oct F | 5.00% | 5.00% | ||
| 13:30 | USD | Building Permits Oct | 1.52M | 1.56M | ||
| 13:30 | USD | Housing Starts Oct | 1.42M | 1.44M | ||
| 13:30 | USD | Initial Jobless Claims (Nov 11) | 220K | 225K | ||
| 13:30 | USD | Philadelphia Fed Survey Nov | -6 | -8.7 | ||
| 15:30 | USD | Natural Gas Storage | 66B | 79B |
Technical Outlook and Review
USD/JPY:
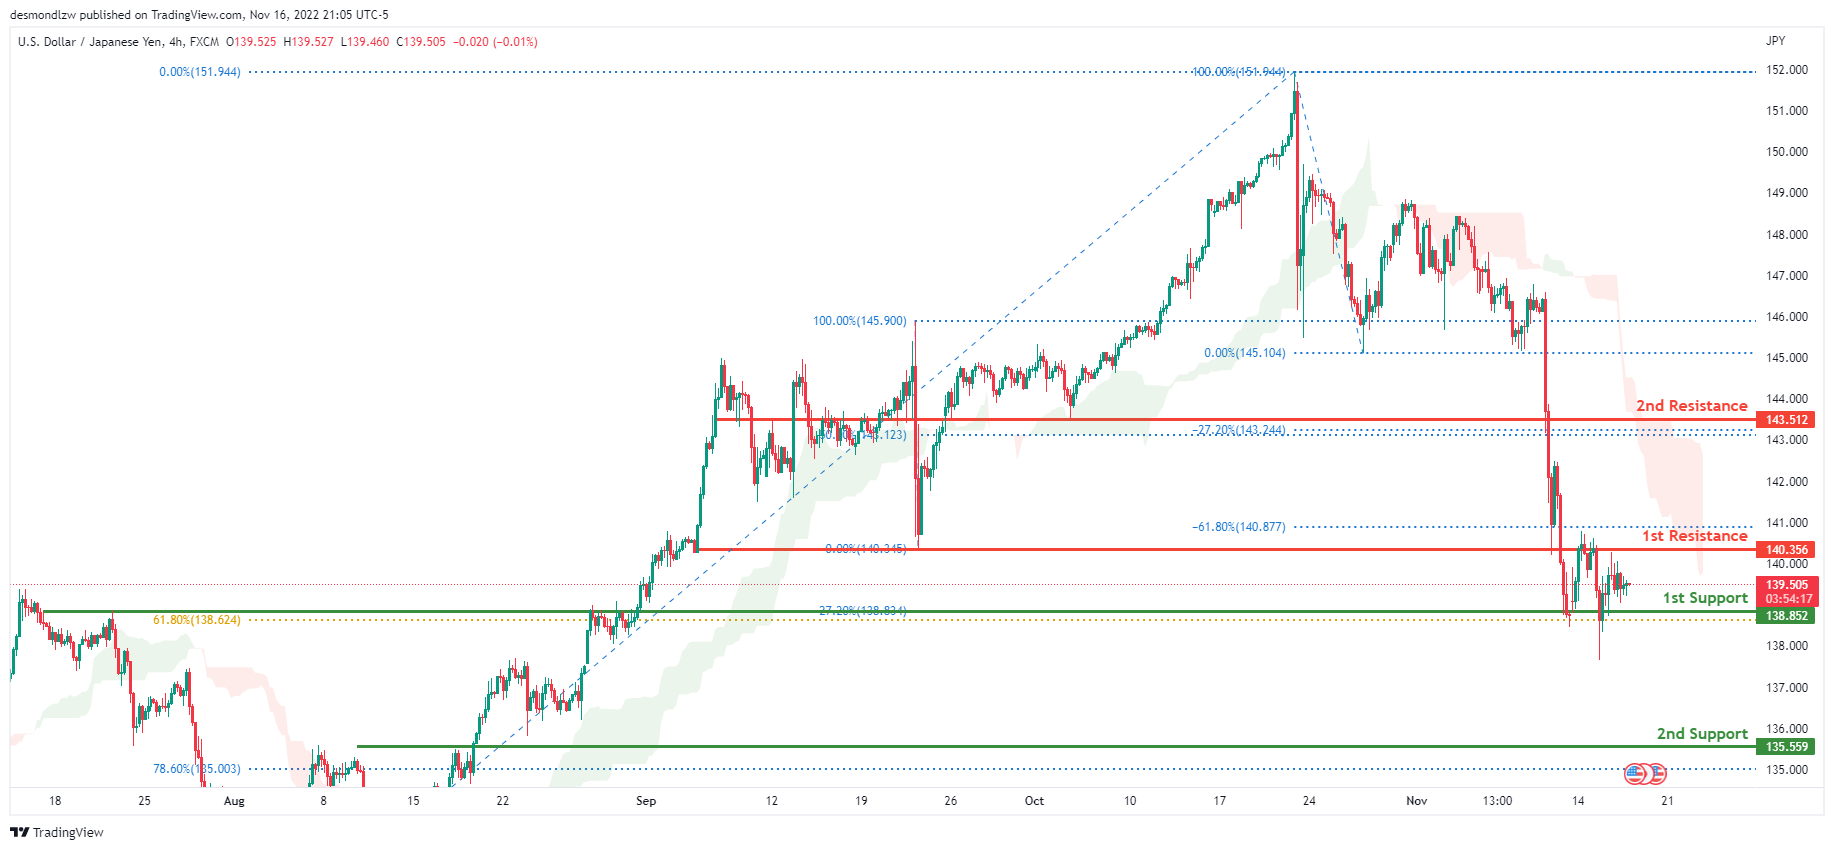
The current general bias for USDJPY on the H4 chart is bearish. To add confluence to this, the price is below the Ichimoku cloud which indicates a bearish market. If the bearish momentum continues, expect USDJPY to break the 1st support line at 138.852 where the -27.2% Fibonacci expansion line is located and head towards the 2nd support line at 135.554 where the 78.6% Fibonacci line is located. In an alternative scenario, price could go back up to break the 1st resistance at 140.356, where the -61.8% Fibonacci expansion line and previous low are located before heading towards the 2nd resistance line at 143.512 where the -27.2% Fibonacci expansion line and 50% Fibonacci line are located.
Areas of consideration:
- H4 time frame, 1st resistance at 140.356
- H4 time frame, 2nd resistance at 143.512
- H4 time frame, 1st support at 138.852
- H4 time frame, 2nd support at 135.554
DXY:
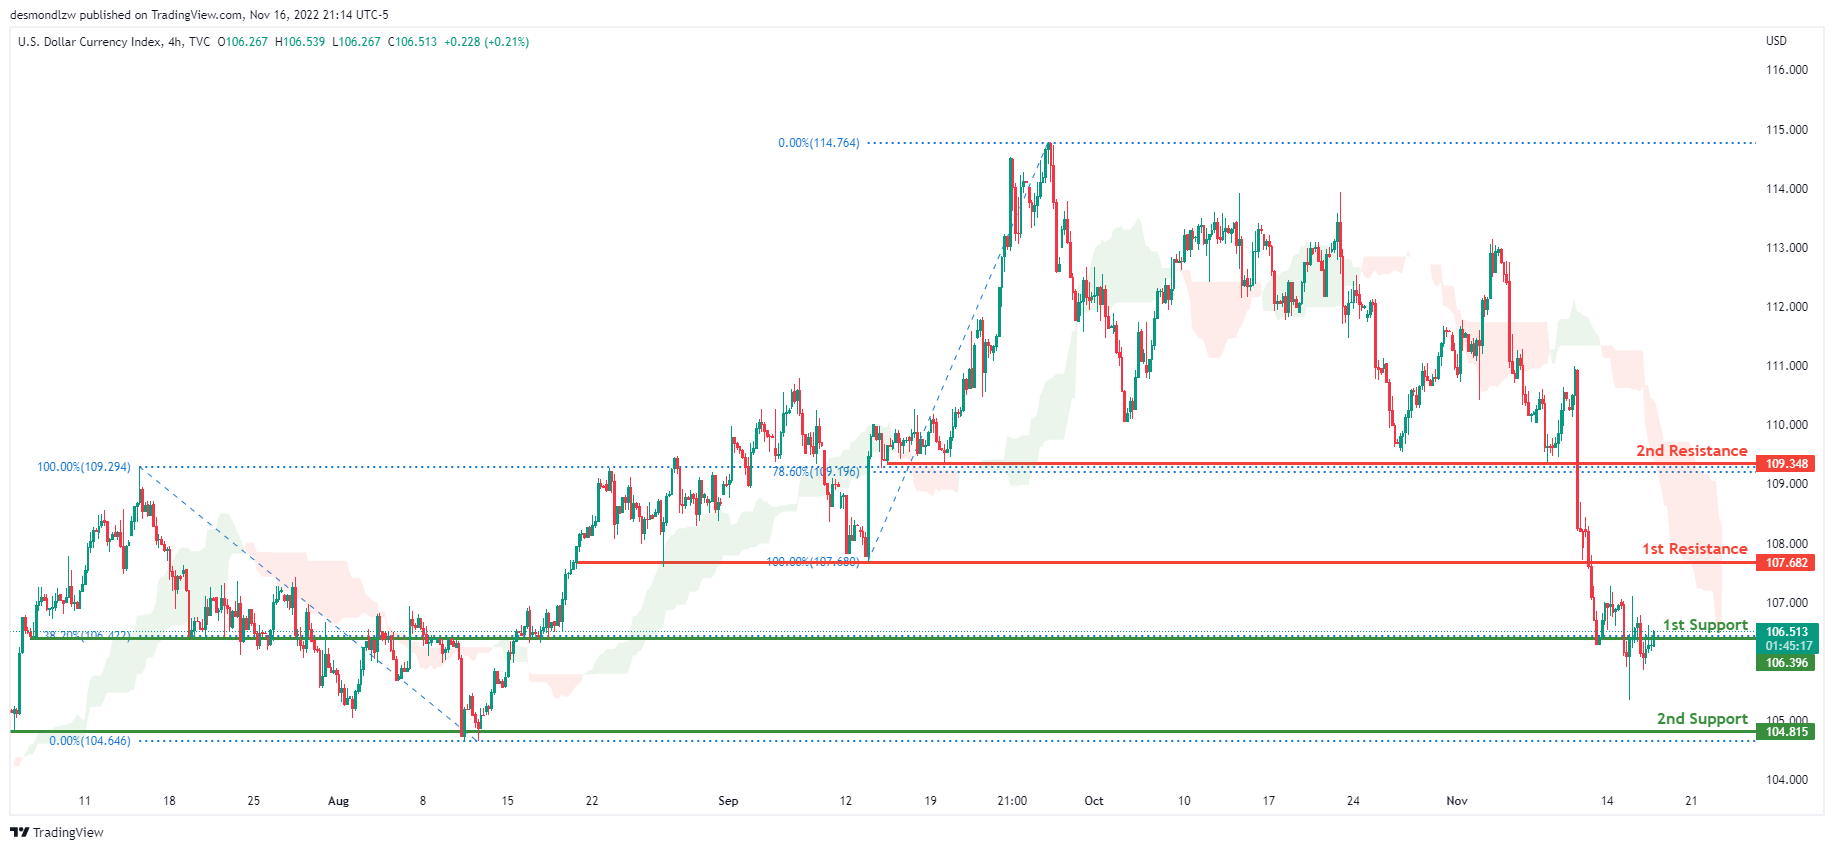
On the H4 chart, the overall bias for DXY is bearish. To add confluence to this, the price is below the Ichimoku cloud which indicates a bearish market. If this bearish momentum continues, price could break the 1st support line at 106.396 where the 38.2% fibonacci line is located, before heading towards the 2nd support at 104.815 where the previous low and the 0% Fibonacci line are located. In an alternative scenario, price could head back up and retest the 1st resistance line at 107.682, where the previous low and 100% Fibonacci line are located.
Areas of consideration:
- H4 time frame, 1st resistance at 107.682
- H4 time frame, 1st support at 106.396
- H4 time frame, 2nd support at 104.815
EUR/USD:
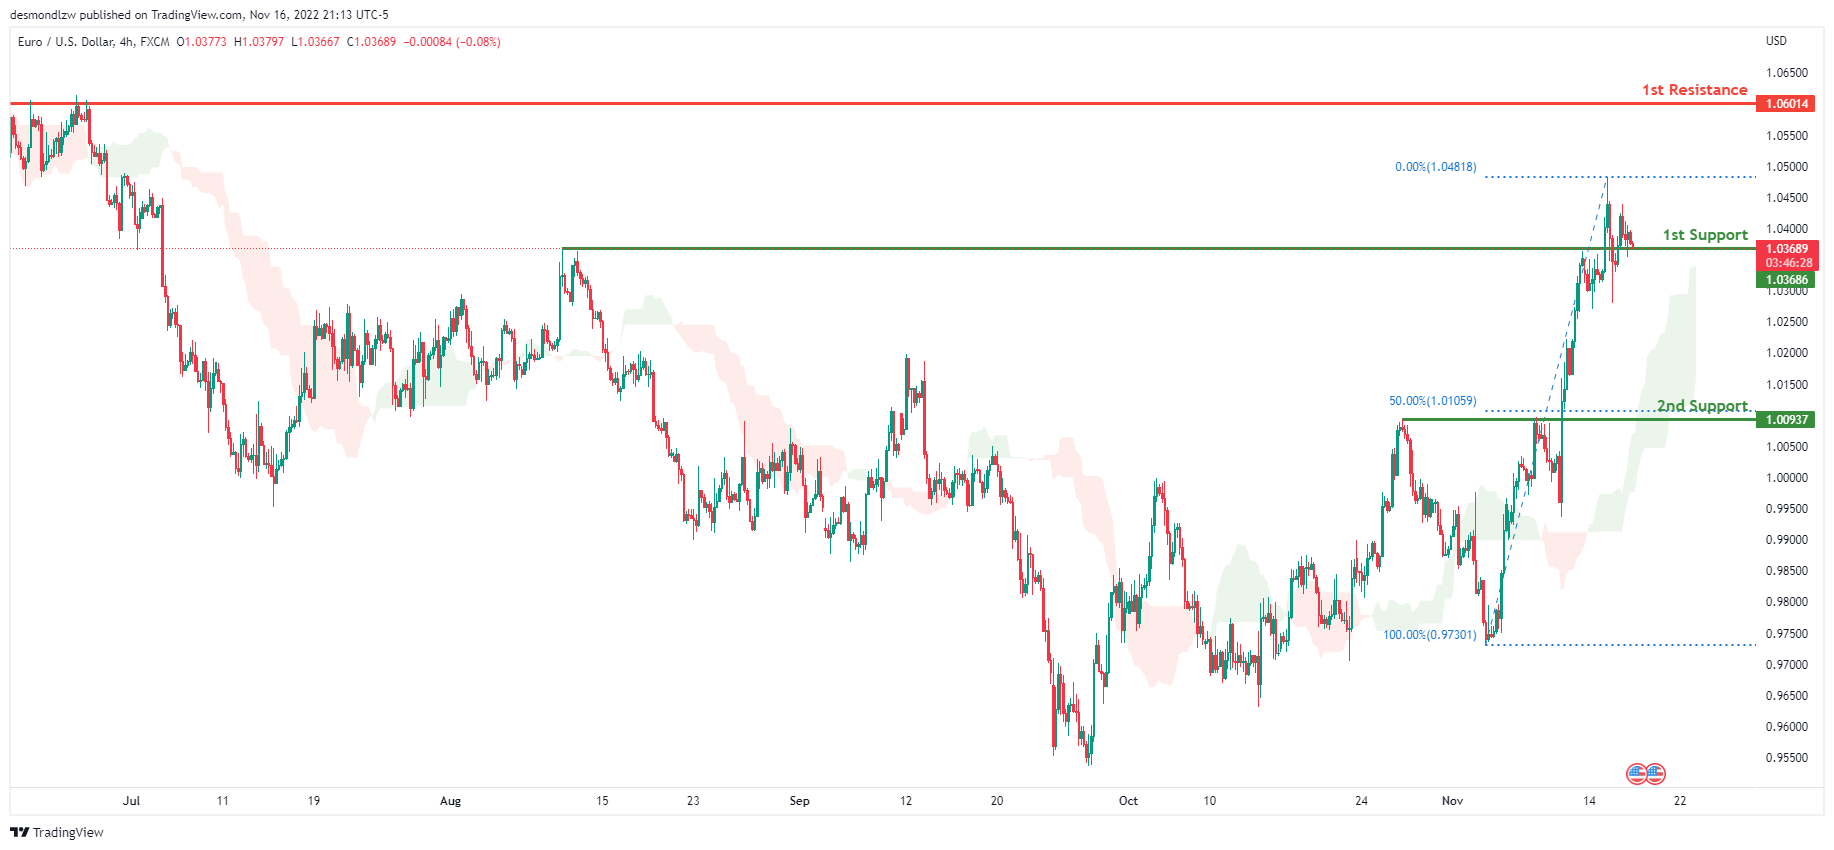
On H4, with the price moving above the ichimoku cloud, we have a bullish bias that the price may head towards the first resistance level at 1.06014, the previous swing high is. Alternatively, the price could break the first support level at 1.03686, which corresponds to the previous swing high and the 0% fibonacci extension, before heading towards the 2nd support at 1.00937 where the 50% Fibonacci lies.
Areas of consideration :
- H4 1st resistance at 1.06014
- H4 1st support at 1.03686
- H4 2nd support at 1.00937
GBP/USD:
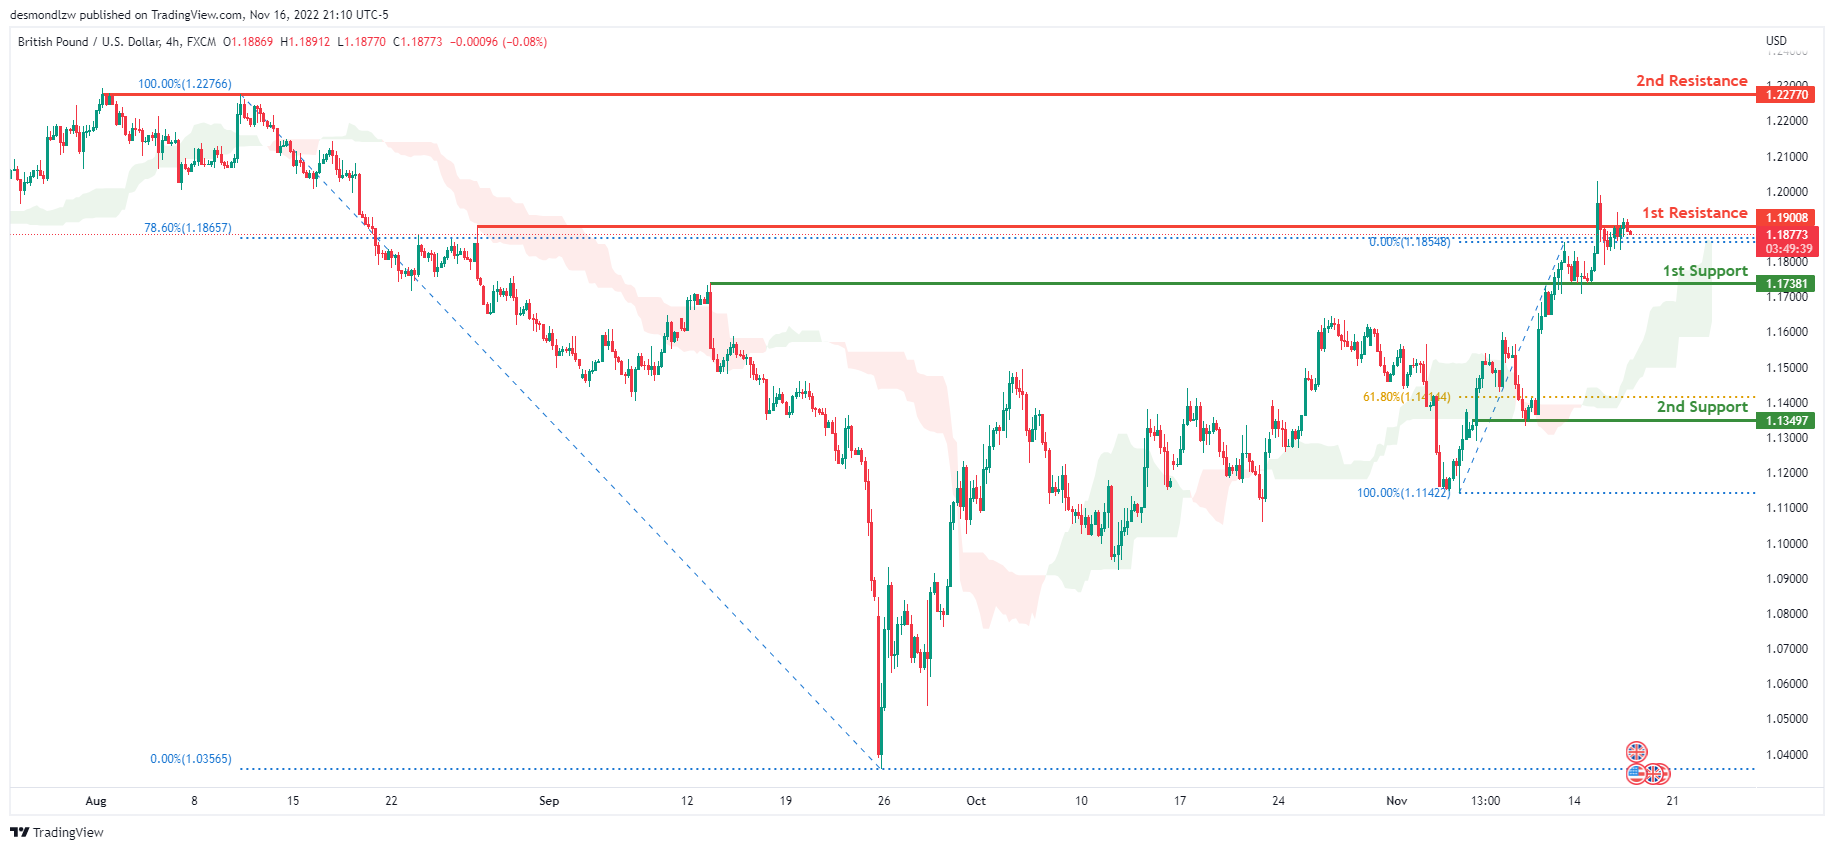
On the H4, the price is moving above the ichimoku cloud, suggesting that the price may break the first resistance level at 1.19008, which corresponds to the 78.6% fibonacci and the previous swing high, before heading to the 2nd resistance line at 1.22770, where the previous swing high is. Alternatively, the price may break the first support level at 1.17381, which is the previous swing high, before moving on to the second support level at 1.13497, which is the 61.8% Fibonacci line.
Areas of consideration:
- H4 1st resistance at 1.19008
- H4 2nd resistance at 1.22770
- H4 1st support at 1.17381
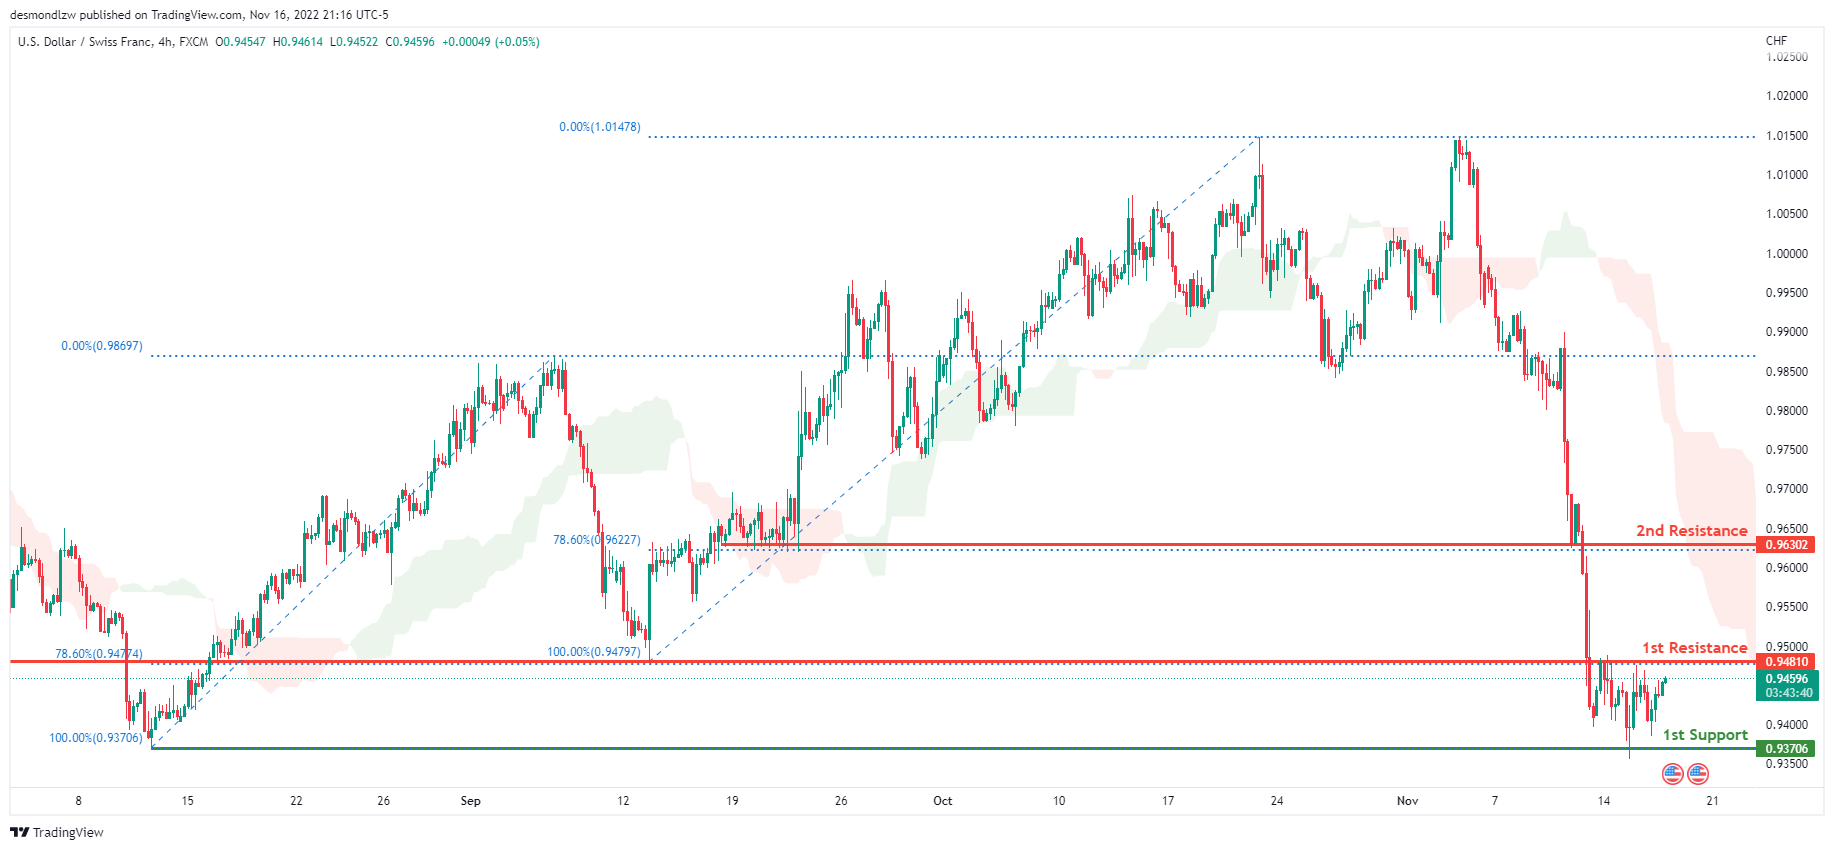
USD/CHF:
The overall bias for USDCHF on the H4 chart is bearish. In addition, the price is below the Ichimoku cloud, indicating a bearish market. If the current bearish trend continues, the price might move back down to retest the first support line at 0.93706, where the previous low was located. In an alternate scenario, price could rise to retest the first resistance line at 0.94810, which is also the 78.6% Fibonacci line. If the first resistance line is broken, the second resistance line is at 0.96302, which is the 78.6% Fibonacci line.
Areas of consideration
- H4 1st support at 0.93706
- H4 1st resistance at 0.94810
- H4 2nd resistance at 0.96302
XAU/USD (GOLD):
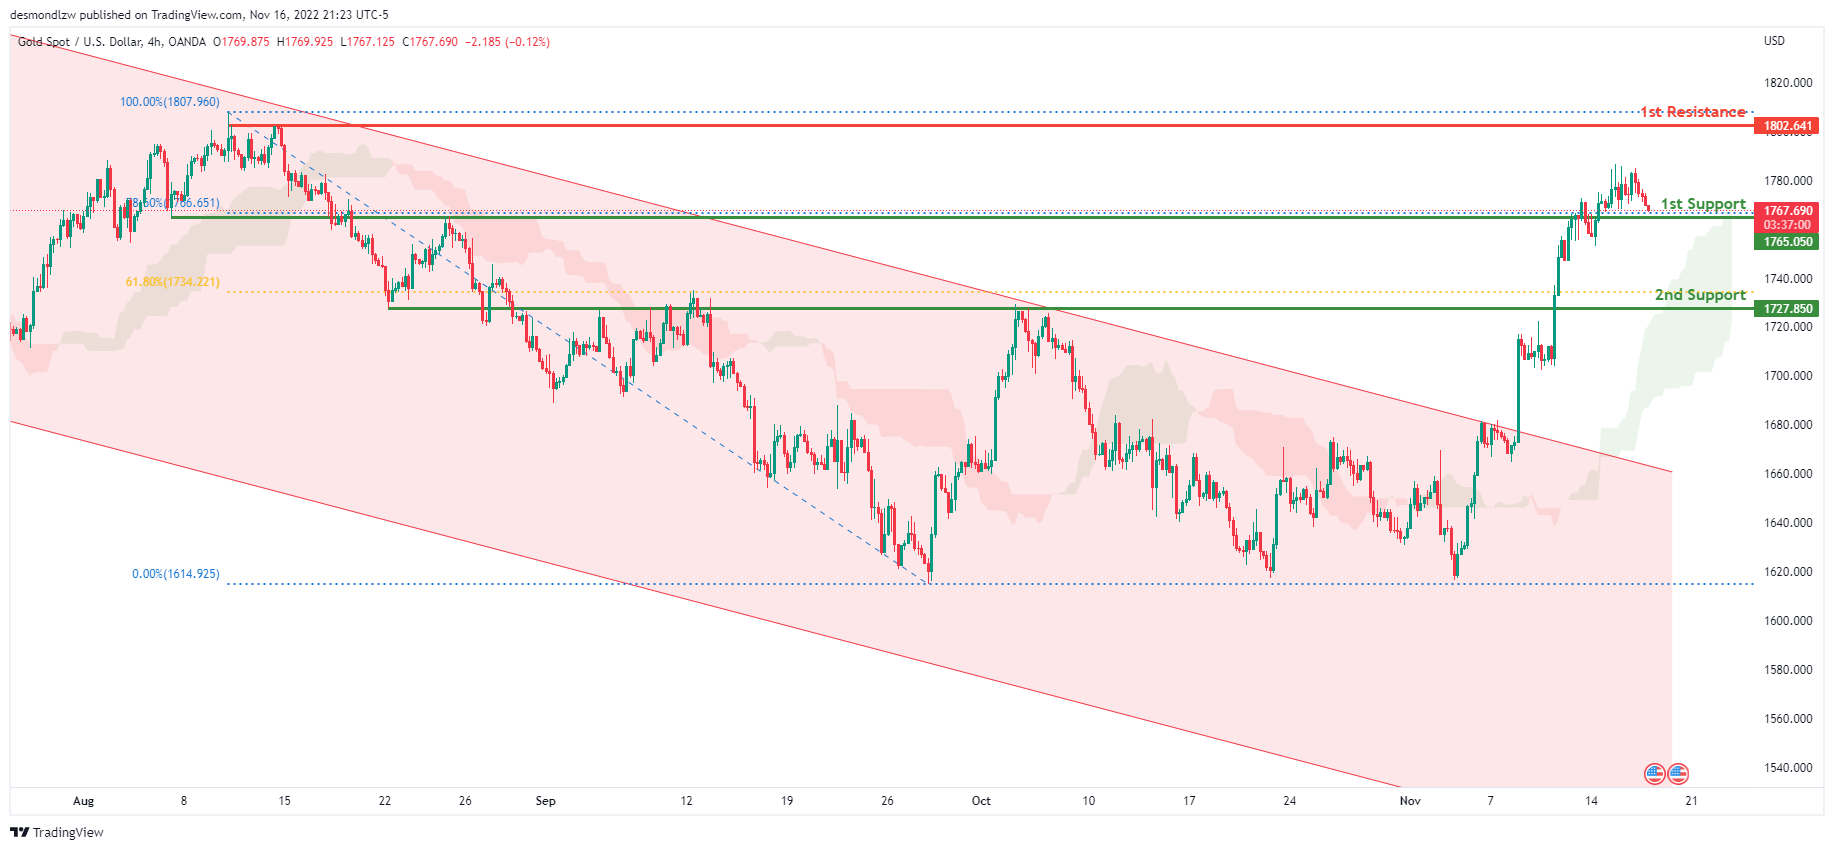
On H4, with the price breaking the descending channel and above the ichimoku cloud, we can expect the price to rise towards the 1st resistance at 1802.641, where the previous swing high is. Alternatively, the price may break the 1st support at 1765.050, which is in line with the 78.6% fibonacci line, before heading towards the 2nd support at 1727.850, where the 61.8% Fibonacci line is.
Areas of consideration:
- H4 time frame, 1st resistance at 1765.483
- H4 time frame, 1st support at 1765.050
- H4 time frame, 2nd support at 1727.850
AUD/USD:
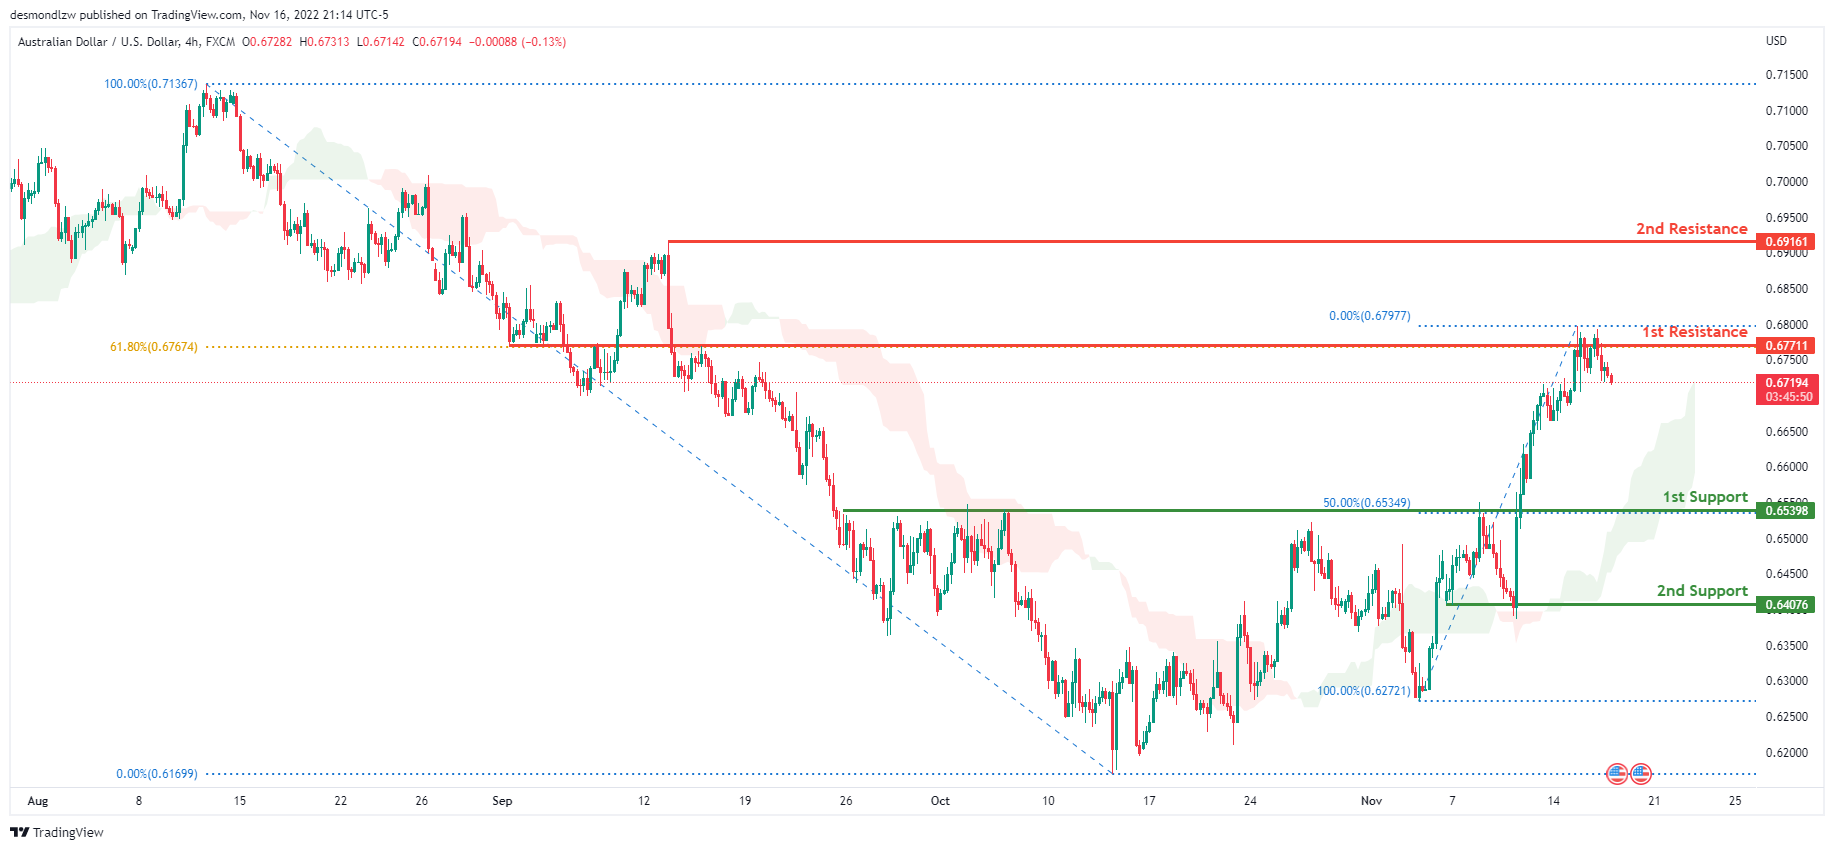
With the price moving above the ichimoku cloud on the H4, we have a bullish bias that the price may break the first resistance at 0.67711, which is in line with the 61.8% fibonacci line, before heading towards the 2nd resistance line at 0.69161, the previous swing high. Alternatively, the price could fall to the first support level at 0.65398, which is marked by the 50% Fibonacci line.
Areas of consideration
- H4, 1st resistance at 0.67711
- H4, 2nd resistance at 0.69161
- H4, 1st support at 0.65398
NZD/USD:
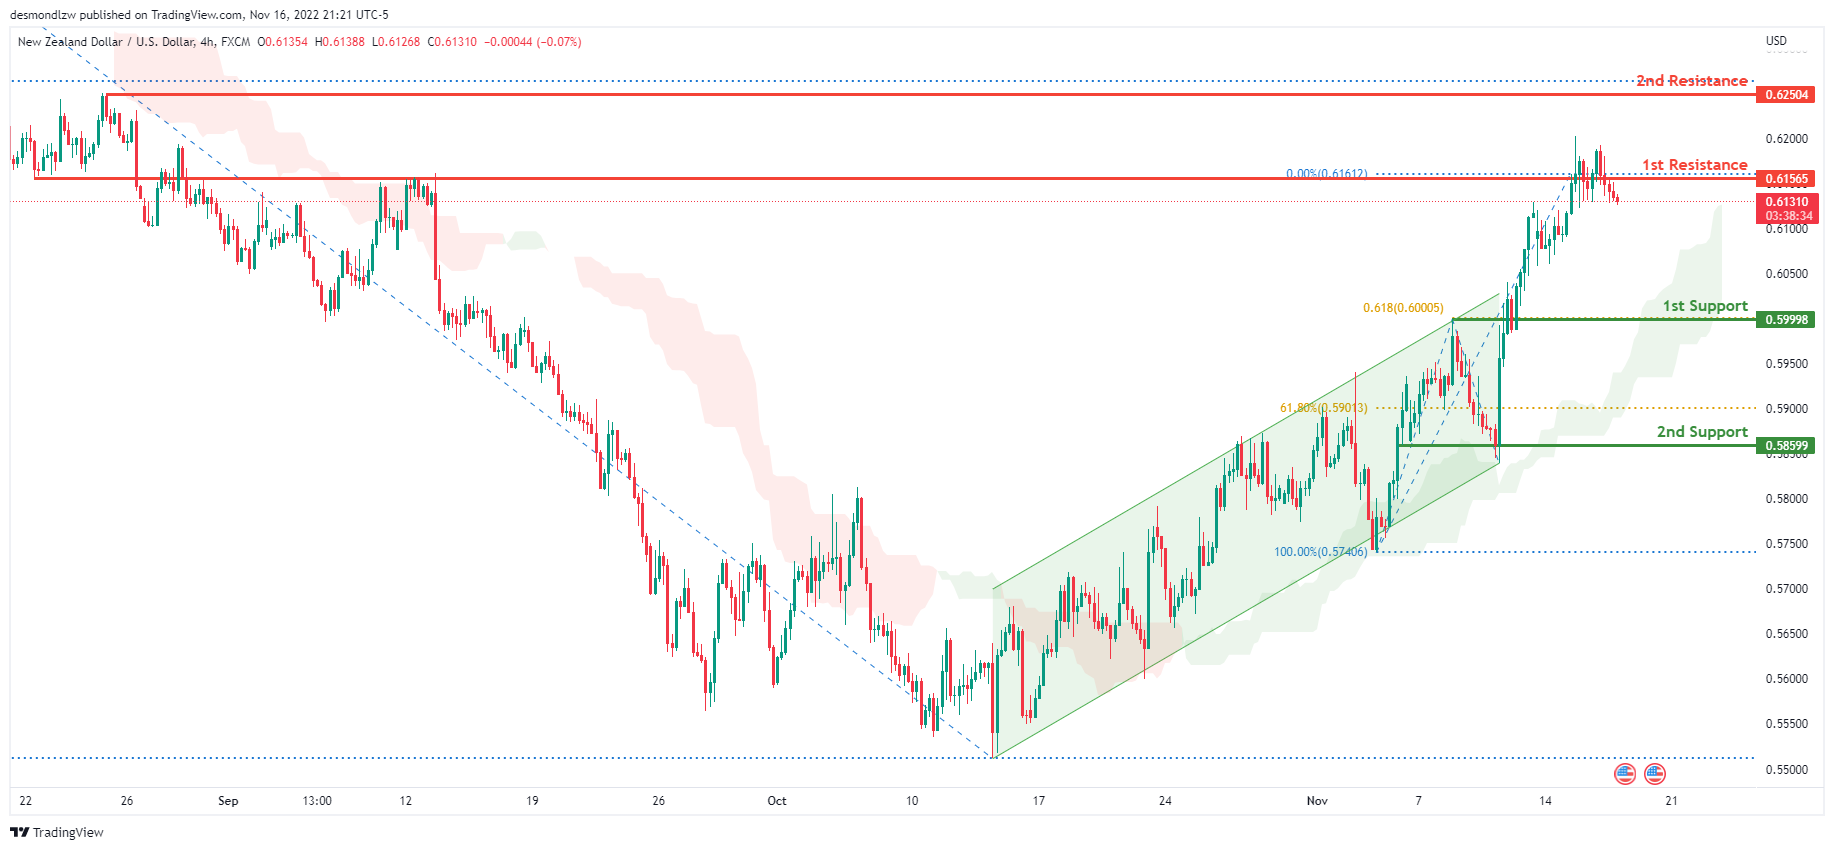
On the H4 chart, the price is moving above the Ichimoku cloud and has broken out of the ascending channel. If this bullish momentum continues, the price may break the 1st resistance at 0.61565, which is in line with the previous swing high and 0% fibonacci line, before heading towards the 2nd resistance line at 0.62504, where the 78.6% Fibonacci line is. Alternatively, the price may head back towards the 1st support at 0.59998, where the 61.8% Fibonacci projection line is located.
Areas of consideration:
- H4 time frame, 1st resistance at 0.61565
- H4 time frame, 1st support at 0.59998
USD/CAD:
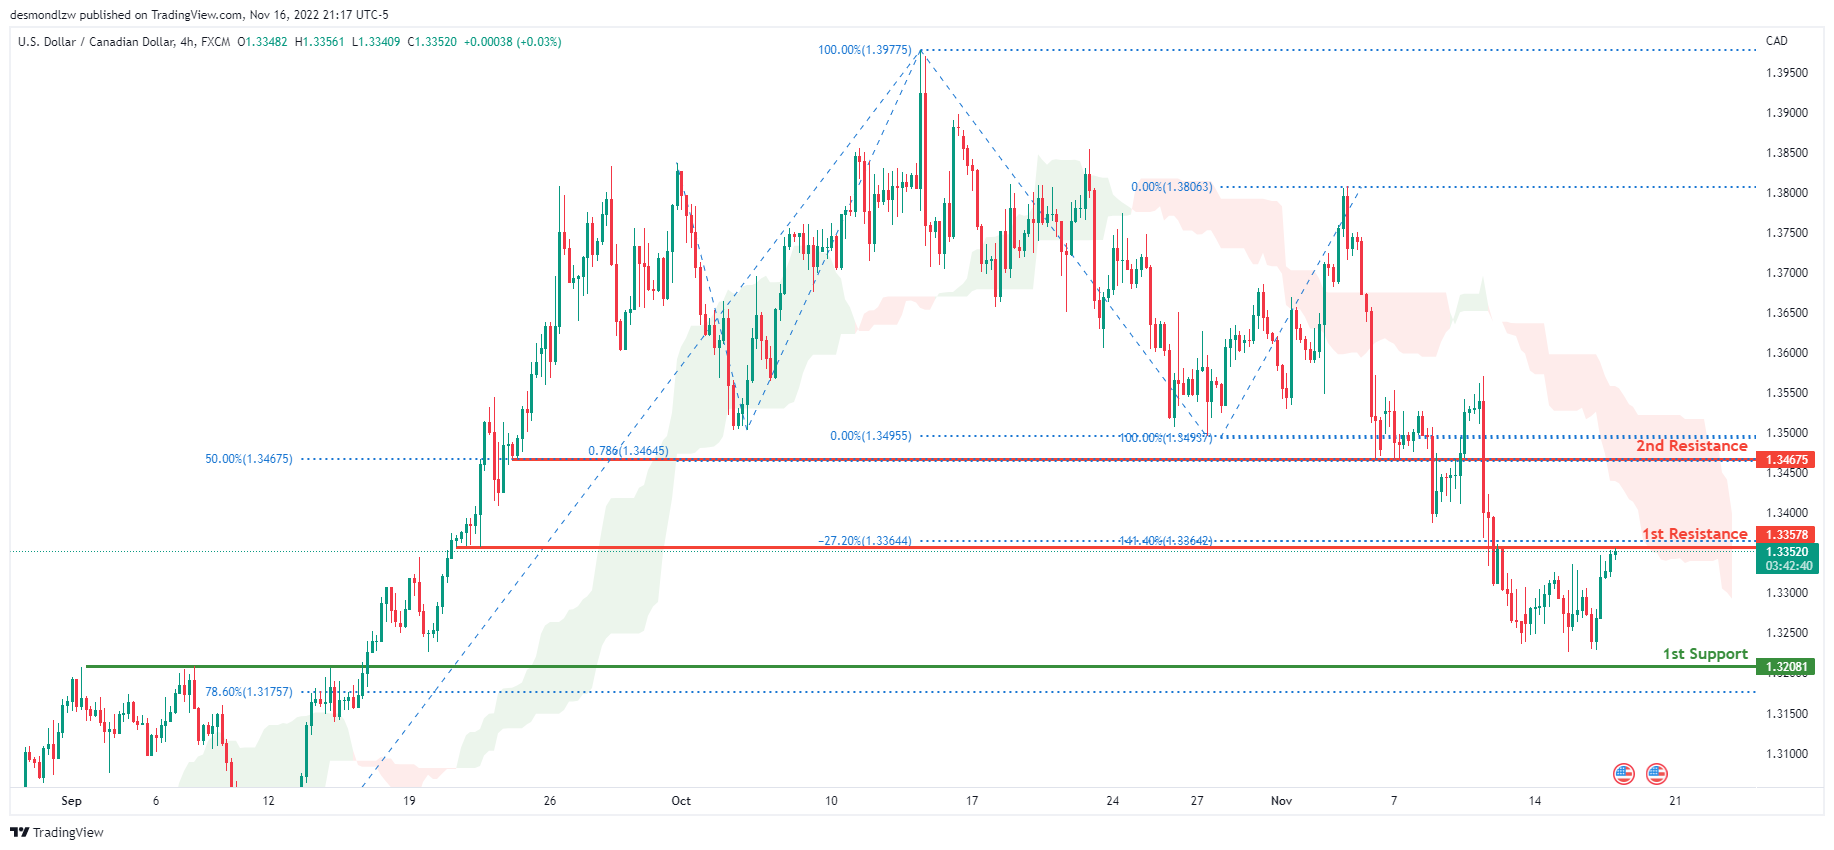
On the H4 chart, the overall bias for USDCAD is bearish. To add confluence to this, the price is below the Ichimoku cloud which indicates a bearish market. If this bearish momentum continues, expect the price to head down towards the 1st support line at 1.32081, where the 78.6% Fibonacci line is located. In an alternative scenario, price could head back up breaking the 1st resistance line at 1.33578, where the -27.2% Fibonacci expansion line and 141.4% Fibonacci line are located, before heading towards the 2nd resistance at 1.34675 where the 50% Fibonacci line and 78.6% Fibonacci projection line is.
Areas of consideration:
- H4 time frame, 1st resistance at 1.33578
- H4 time frame, 2nd resistance at 1.34675
- H4 time frame, 1st support at 1.32081
OIL:
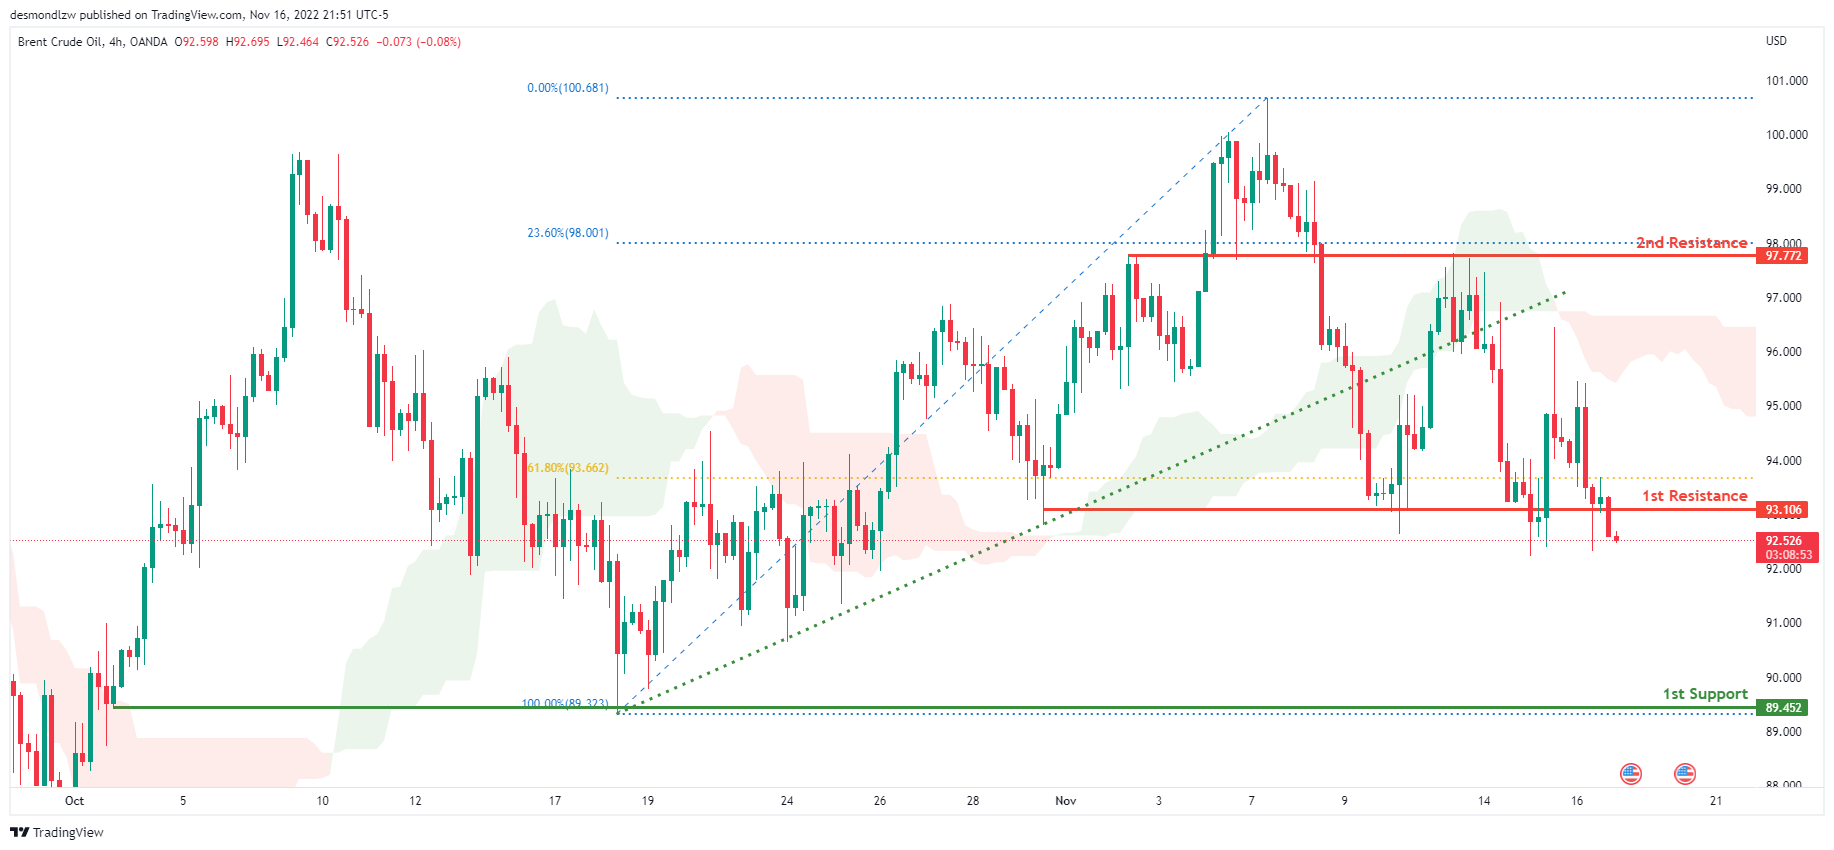
Looking at the H4 chart, the current overall bias for Oil is bearish. To add confluence to this, the price is below the Ichimoku cloud which indicates a bearish market. If this bearish momentum continues, expect price to head towards the 1st support at 89.452 where the previous swing low lies. In an alternative scenario, price might head back up to retest the 1st resistance line at 93.106, where the 61.8% Fibonacci line and previous low are.
Areas of consideration:
- H4 time frame, 1st resistance at 93.106
- H4 time frame, 1st support at 89.452
- H4 time frame, 2nd support at 89.452
Dow Jones Industrial Average:
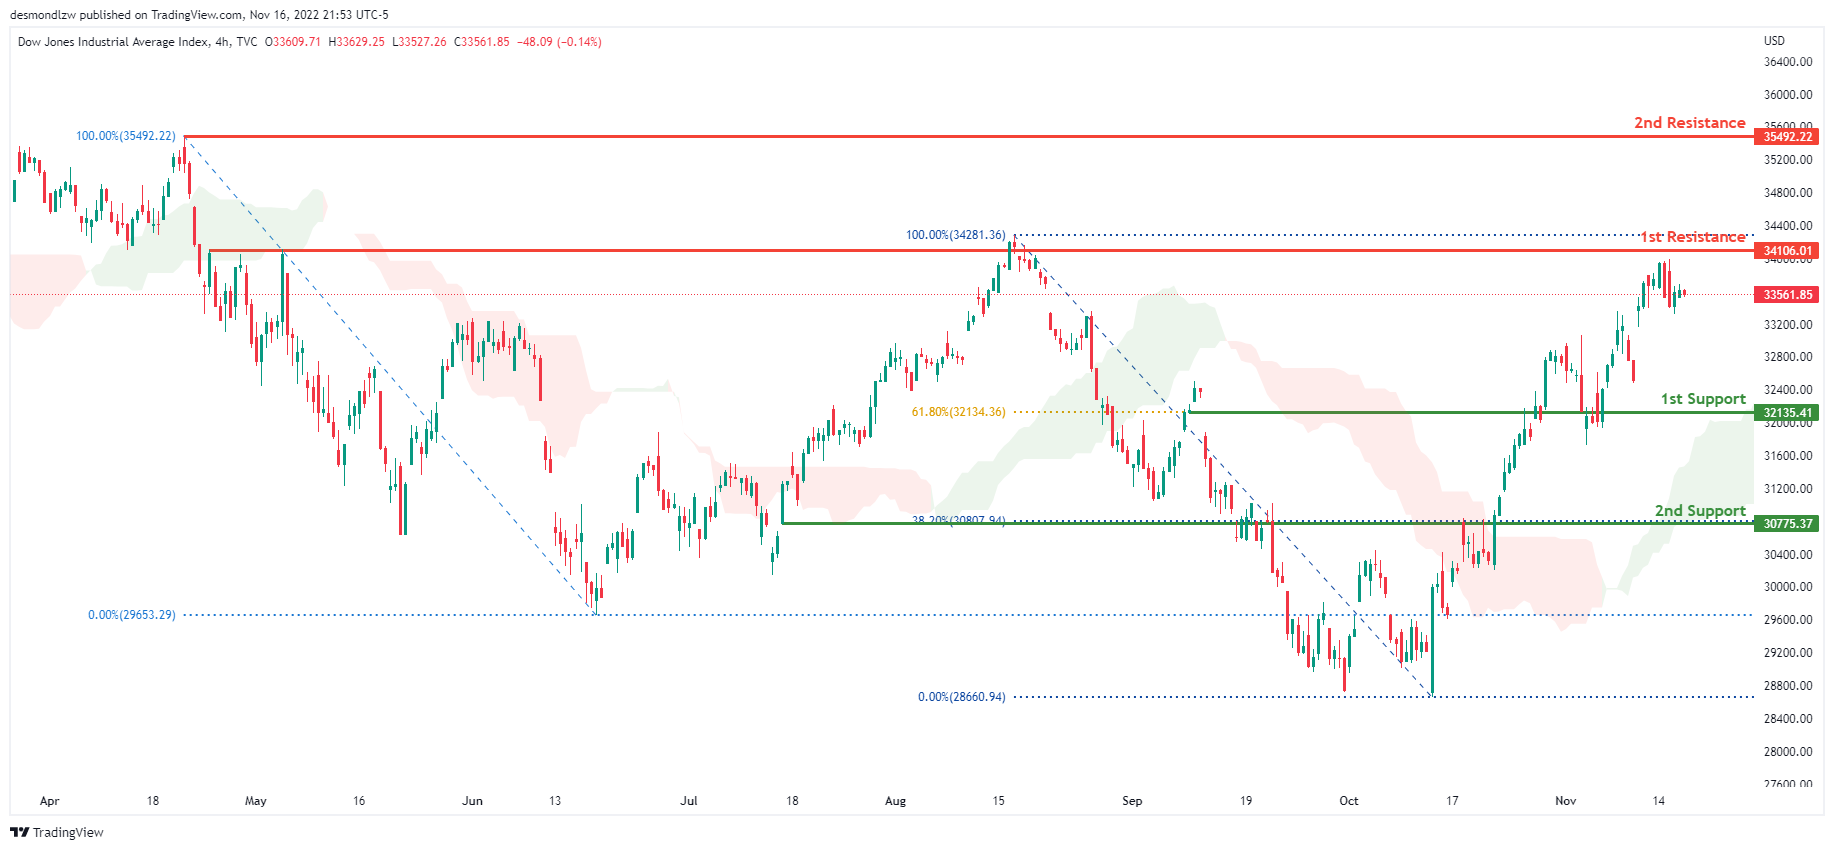
On the H4 chart, the overall bias for DJI is bullish. To add confluence to this, the price is above the Ichimoku cloud which indicates a bullish market. If this bullish momentum continues, expect the price to possibly head towards the 1st resistance at 34106.01 where the previous high and 100% Fibonacci line is located. In an alternative scenario, price could head towards the 1st support line at 32135.41, where the 61.8% Fibonacci line is located.
Areas of consideration:
- H4 time frame, 1st support at 32135.41
- H4 time frame, 1st Resistance at 34106.01
DAX:
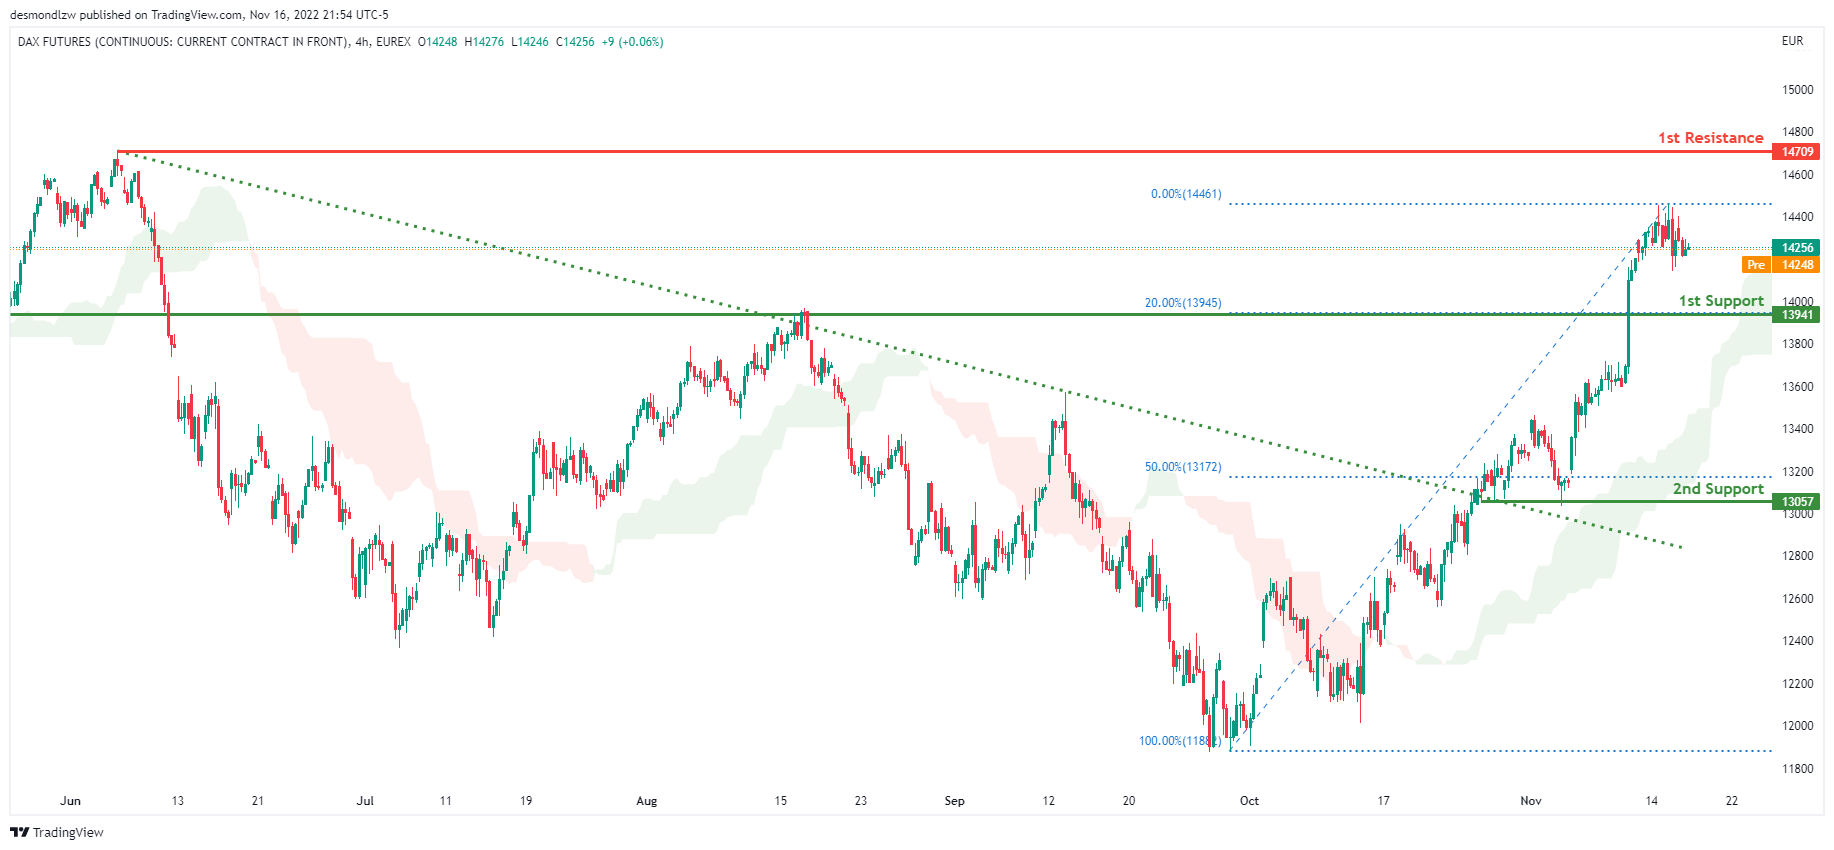
The H4 chart shows a bullish bias, with price breaking through the descending trendline and rising above the Ichimoku cloud. Price is expected to maintain its bullish momentum and rise to the first resistance level at 14709, where the previous swing high is located. Alternatively, the price could fall to the first support level at 13941, which corresponds to the 20% Fibonacci line.
Areas of consideration:
- H4 time frame, 1st resistance is at 14709
- H4 time frame, 1st support is at 13941
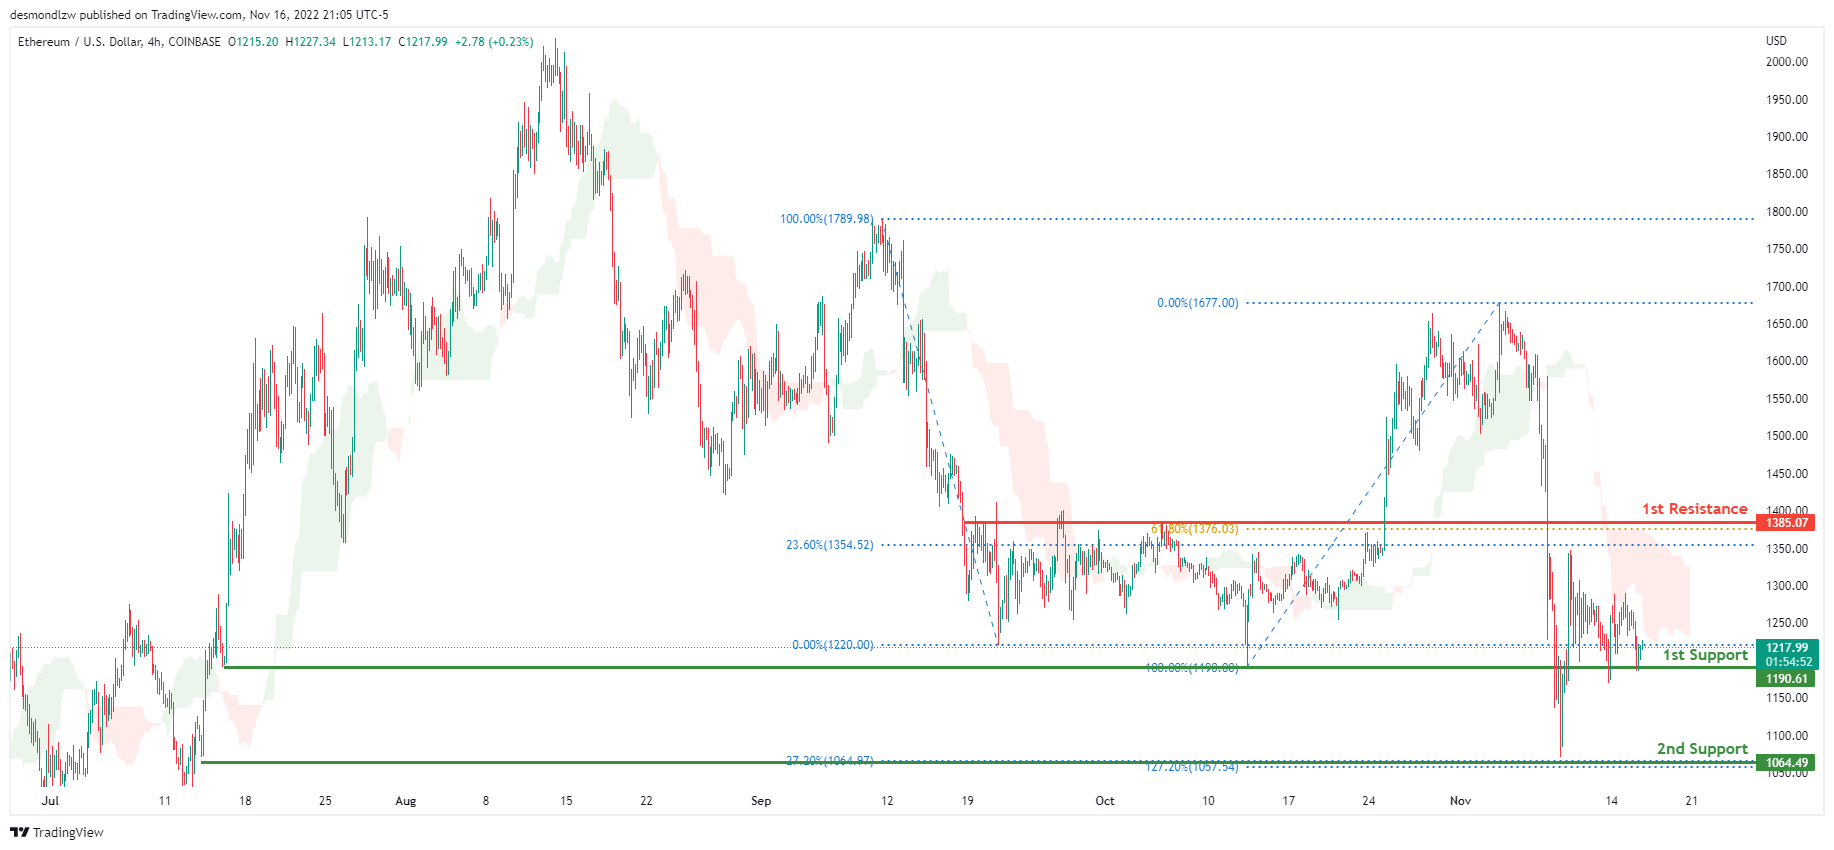
ETHUSD:
Looking at the H4 chart, the current overall bias for ETHUSD is bearish, with price currently under the Ichimoku cloud indicating a bearish market. If this bearish momentum continues, expect the price to break the 1st support line at 1190.61 where the previous low and 100% Fibonacci line was located and head towards the 2nd support at 1064.49 where the -27.2% Fibonacci expansion line and 127.2% Fibonacci extension line are located. In an alternative scenario, price could head back up to retest the 1st resistance line at 1385.07, where the 23.6% and 61.8% Fibonacci lines are located.
Areas of consideration:
- H4 time frame, 1st resistance of 1385.07
- H4 time frame, 1st support at 1190.61
- H4 time frame, 2nd support at 1064.44
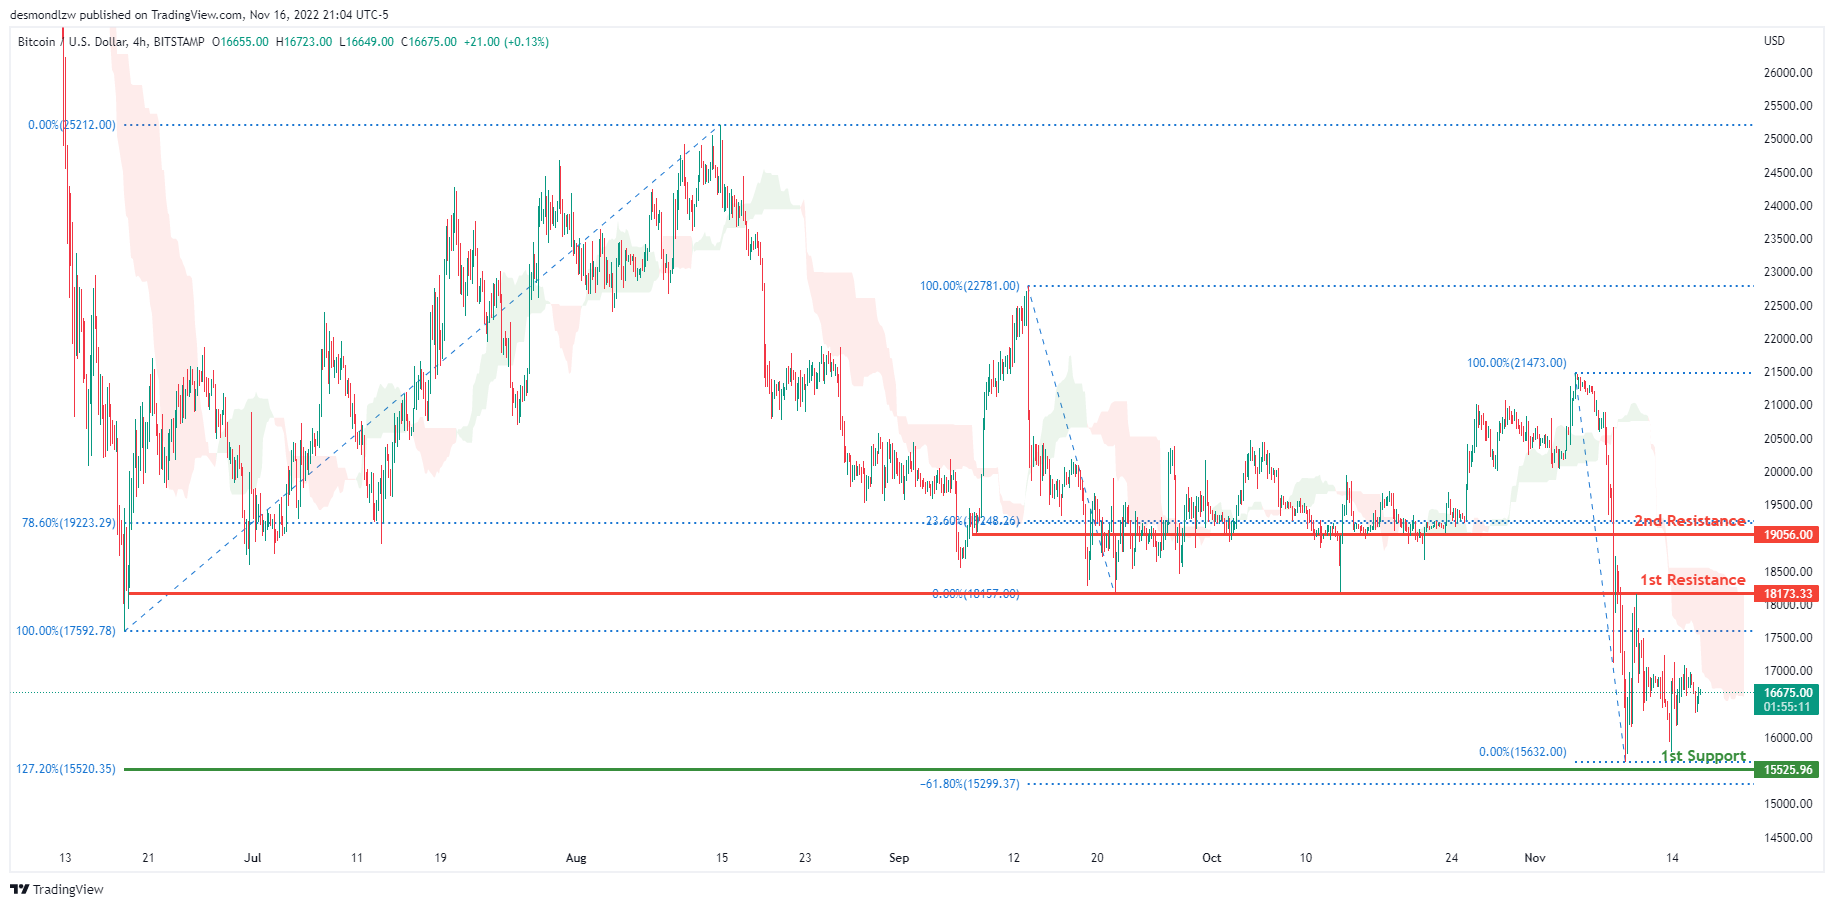
BTCUSD:
On the H4 chart, the overall bias for BTCUSD is bearish. To add confluence to this, the price is below the Ichimoku cloud which indicates a bearish market. If this bearish momentum continues, expect the price to head towards the 1st support line at 15525.96, where the 127.2% Fibonacci extension line and -61.8% Fibonacci expansion line is located. In an alternative scenario, price could head back up to retest the 1st resistance line at 18173.33, where the previous low and 0% Fibonacci line is located.
Areas of consideration:
- H4 time frame, 1st resistance 18173.33
- H4 time frame, 1st support at 15525.96
S&P 500:
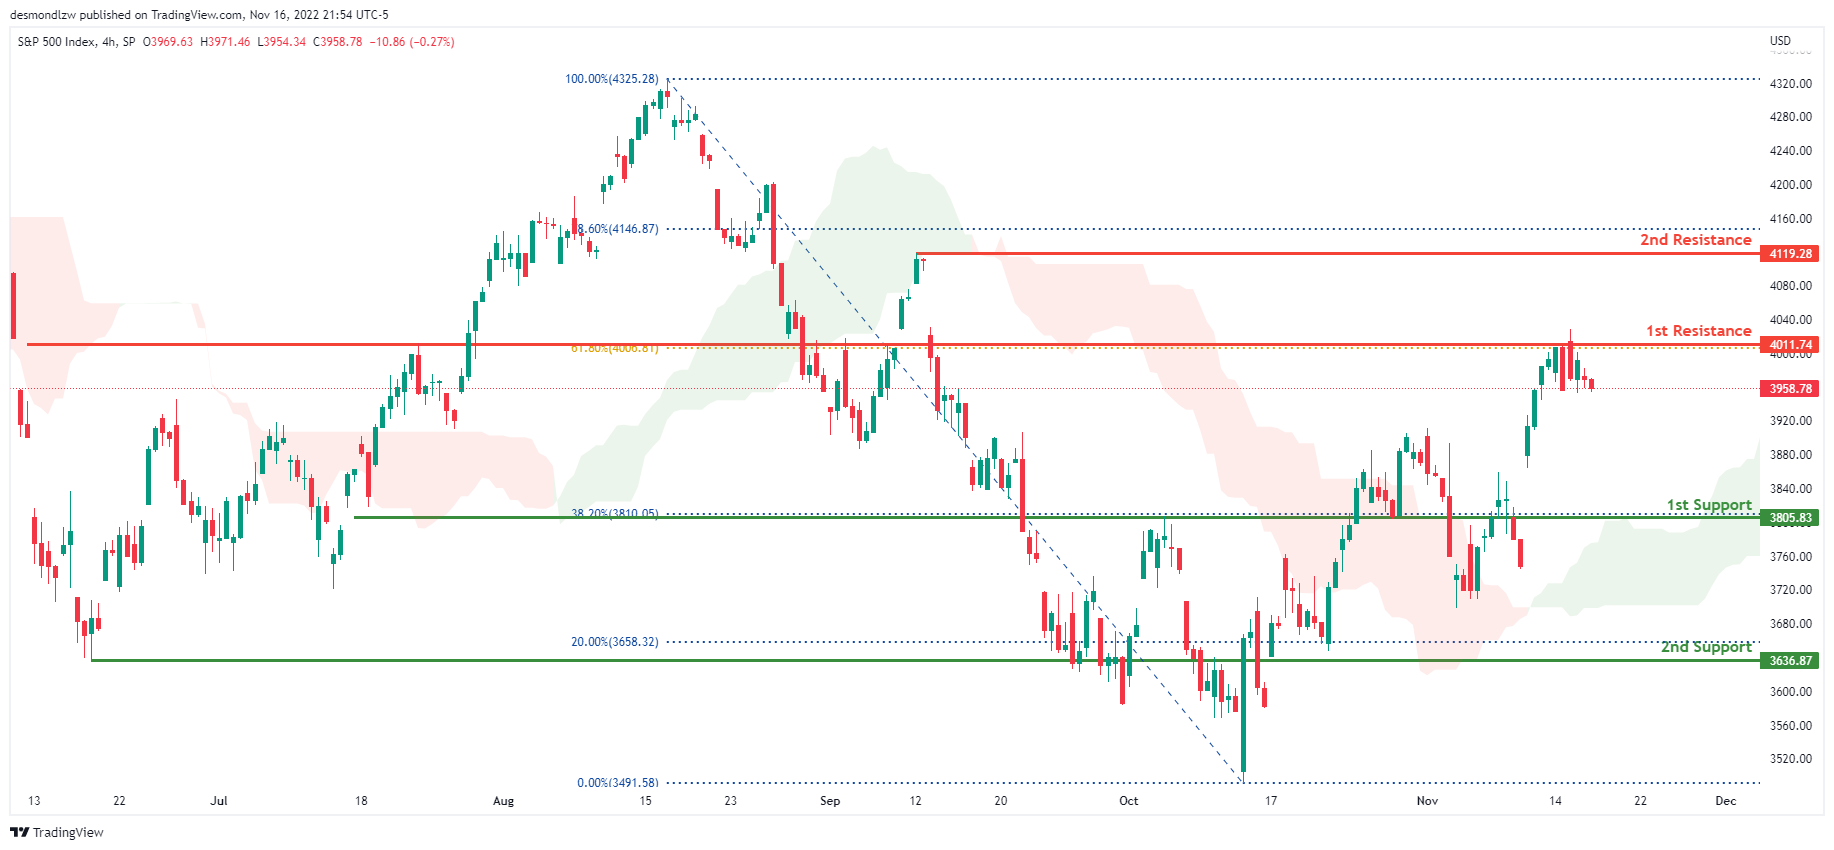
The overall bias for the S&500 on the H4 chart is bullish, with prices above the Ichimoku cloud. If the bullish momentum continues, the price will rise to the first resistance line at 4011.74, where the 61.8% Fibonacci line is located. If the first resistance line is broken, the second resistance line is at 4119.28, which is the previous swing high and the 78.6% Fibonacci line. In an alternate scenario, price could return to the first support line at 3805.83, where the 38.2% Fibonacci line is located.
Areas of consideration:
- H4 time frame, 1st support at 3805.83
- H4 time frame, 1st resistance at 4011.74
- H4 time frame, 2nd resistance at 4119.28