Sample Category Title
EUR/USD Mid-Day Outlook
Daily Pivots: (S1) 0.9975; (P) 1.0031; (R1) 1.0070; More...
EUR/USD's break of 1.0092 resistance now confirms resumption of whole rebound from 0.9534. Intraday bias is back on the upside for 38.2% retracement of 1.1494 to 0.9534 at 1.0283, even as a corrective rise. Sustained break there will target 55 week EMA (now at 1.0567). On the downside, break of 0.9934 will dampen the bullish case and turn intraday bias neutral first.
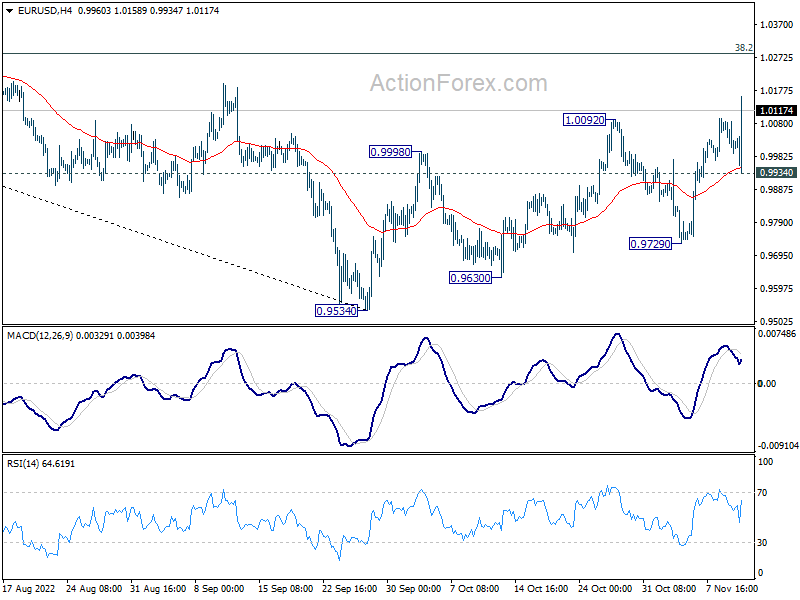
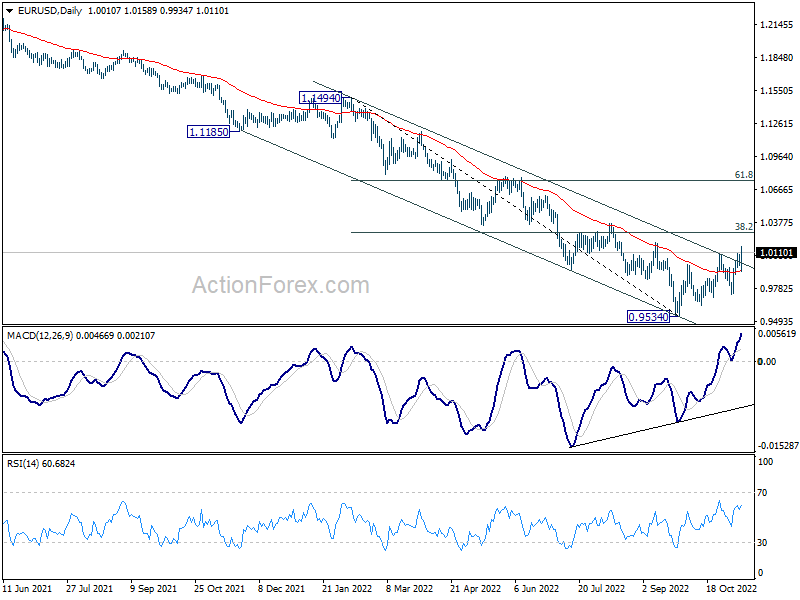
In the bigger picture, break of the medium term channel resistance, bullish convergence condition in daily MACD, as well as some support from 55 day EMA are bullish signs. A medium term bottom should be in place at 0.9534. Stronger rebound should be seen back towards 55 week EMA (now at 1.0567). It's still early to conclude that the medium term trend is reversing, at least until sustained break of 55 week EMA.
Dollar Dives after Lower than Expected CPI Readings
Dollar dives sharply in early US session after lower than expected CPI readings. CPI might have really started to turn around, and that would support Fed to start slowing the pace of tightening. For now, Sterling, Aussie and Yen are the strongest ones while Swiss Franc and Euro are lagging behind. But it will take some more time to find out whole's the biggest beneficiary of the Dollar selloff.
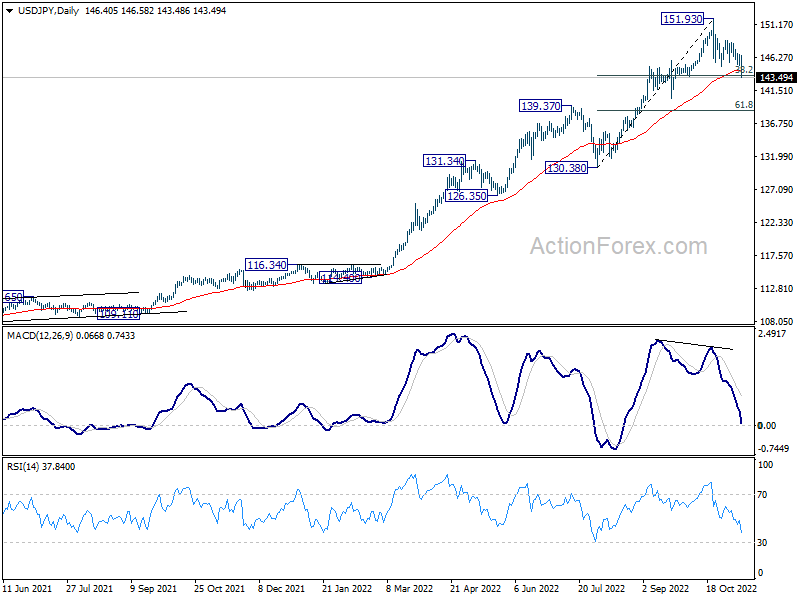
Technically, USD/JPY will be the most interesting one to watch as it's now pressing 38.2% retracement of 130.38 to 151.93 at 143.69. Sustained break there will argue that fall from 151.93 is not just correcting the rise from 130.38, but also a larger up trend. If that's true, there is prospect of deeper decline, as a medium term correction, back to 130.38/139.37 support zone.
In Europe, at the time of writing, FTSE is up 1.15%. DAX is up 2.33%. CAC is up 1.16%. Germany 10-year yield is down -0.167 at 2.004. Earlier in Asia, Nikkei dropped -0.98%. Hong Kong HSI dropped -1.70%. China Shanghai SSE dropped -0.39%. Singapore Strait Times rose 0.24%. Japan 10-year JGB yield is down -0.0128 at 0.246.
US CPI slowed to 7.7% yoy, CPI core slowed to 6.3% yoy, below expectations
US CPI rose 0.4% mom in October, below expectation of 0.7% mom. Core CPI rose 0.3% mom, below expectation of 0.5% mom. Energy rose 1.8% mom while food rose 0.6% mom.
Over the last 12 months, CPI slowed from 8.2% yoy to 7.7% yoy, below expectation of 8.0% yoy. That's the lowest rate since January this year. Core CPI slowed from 6.6% yoy to 6.3% yoy, below expectation of 6.5% yoy. Energy index was up 17.6% yoy while food was up 10.9% yoy.
US initial jobless claims rose 7k to 225k
US initial jobless claims rose 7k to 225k in the week ending November 5. Four-week moving average of initial claims rose 250 to 218.75k.
Continuing claims rose 6k to 1493k in the week ending October 29. Four-week moving average of continuing claims rose 32k to 1450k.
ECB bulletin: Further weakening of economy into beginning of 2023
In the monthly economic bulletin, ECB said the Governing Council expects a "further weakening" of economic activity "in the remainder of 2022 and the beginning of 2023".
High inflation continues to "dampen spending and production" and severe disruptions in gas supply "have worsened the situation further".
Additionally, "worsening terms of trade", with imports prices rising faster than exports prices, are "weighing on incomes in the euro area".
Risks to the economic growth outlook are "clearly on the downside, especially in the near term". Risks to the inflation outlook are "primarily on the upside".
ECB's future policy rate decisions will continue to be "data dependent" and follow a "meeting-by-meeting approach".
BoJ Kuroda: Premature to lay out details of exit strategy
BoJ Governor Haruhiko Kuroda told the parliament, "it's premature to lay out details of an exit strategy. But one major factor of debate will be the pace of increase in the BoJ's short-term policy rate, now set at -0.1%."
"Another factor would be how to adjust its balance sheet," he said, noting that other major central banks adopted the sequence of interest rate hike first, then shrinking balance sheet.
"It's extremely important for the BOJ to underpin the economy with ultra-loose monetary policy and ensure the necessary environment is falling into place for companies to hike wages," Kuroda emphasized.
EUR/USD Mid-Day Outlook
Daily Pivots: (S1) 0.9975; (P) 1.0031; (R1) 1.0070; More...
EUR/USD's break of 1.0092 resistance now confirms resumption of whole rebound from 0.9534. Intraday bias is back on the upside for 38.2% retracement of 1.1494 to 0.9534 at 1.0283, even as a corrective rise. Sustained break there will target 55 week EMA (now at 1.0567). On the downside, break of 0.9934 will dampen the bullish case and turn intraday bias neutral first.
In the bigger picture, break of the medium term channel resistance, bullish convergence condition in daily MACD, as well as some support from 55 day EMA are bullish signs. A medium term bottom should be in place at 0.9534. Stronger rebound should be seen back towards 55 week EMA (now at 1.0567). It's still early to conclude that the medium term trend is reversing, at least until sustained break of 55 week EMA.
Economic Indicators Update
| GMT | Ccy | Events | Actual | Forecast | Previous | Revised |
|---|---|---|---|---|---|---|
| 23:50 | JPY | Money Supply M2+CD Y/Y Oct | 3.10% | 3.40% | 3.30% | |
| 00:00 | AUD | Consumer Inflation Expectations Nov | 6.00% | 5.40% | ||
| 00:01 | GBP | RICS Housing Price Balance Oct | -2% | 28% | 32% | |
| 09:00 | EUR | Italy Industrial Output M/M Sep | -1.80% | 1.70% | 2.30% | |
| 09:00 | EUR | ECB Economic Bulletin | ||||
| 12:30 | USD | Initial Jobless Claims (Nov 4) | 225K | 221K | 217K | 218K |
| 12:30 | USD | CPI M/M Oct | 0.40% | 0.70% | 0.40% | |
| 12:30 | USD | CPI Y/Y Oct | 7.70% | 8.00% | 8.20% | |
| 12:30 | USD | CPI Core M/M Oct | 0.30% | 0.50% | 0.60% | |
| 12:30 | USD | CPI Core Y/Y Oct | 6.30% | 6.50% | 6.60% | |
| 15:30 | USD | Natural Gas Storage | 92B | 107B |
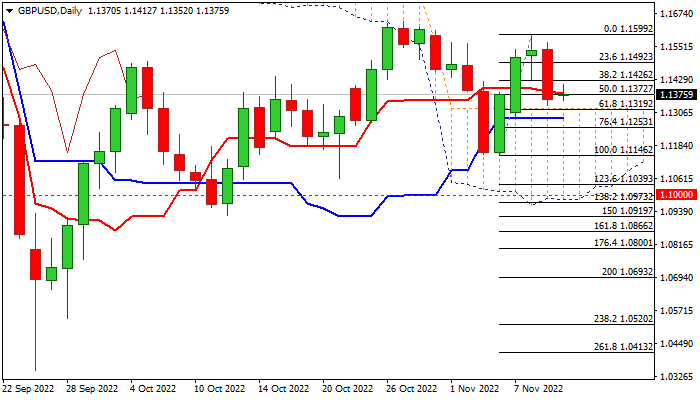
US initial jobless claims rose 7k to 225k
US initial jobless claims rose 7k to 225k in the week ending November 5. Four-week moving average of initial claims rose 250 to 218.75k.
Continuing claims rose 6k to 1493k in the week ending October 29. Four-week moving average of continuing claims rose 32k to 1450k.
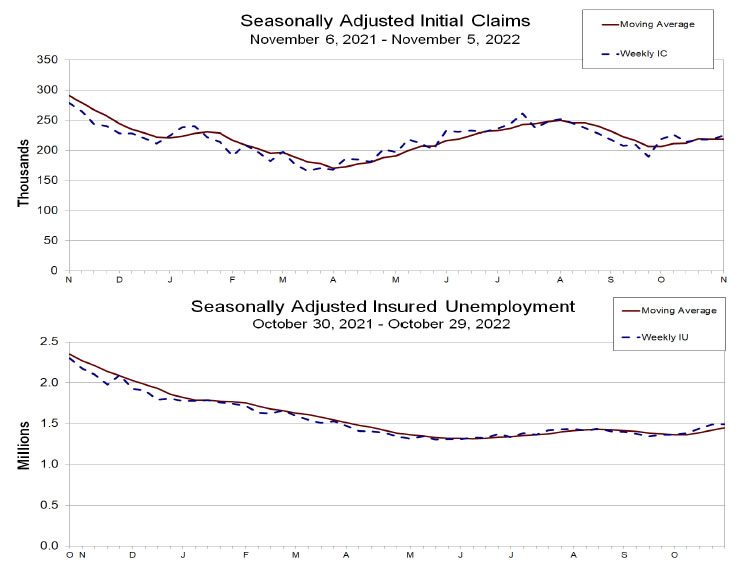
US CPI slowed to 7.7% yoy, CPI core slowed to 6.3% yoy, below expectations
US CPI rose 0.4% mom in October, below expectation of 0.7% mom. Core CPI rose 0.3% mom, below expectation of 0.5% mom. Energy rose 1.8% mom while food rose 0.6% mom.
Over the last 12 months, CPI slowed from 8.2% yoy to 7.7% yoy, below expectation of 8.0% yoy. That's the lowest rate since January this year. Core CPI slowed from 6.6% yoy to 6.3% yoy, below expectation of 6.5% yoy. Energy index was up 17.6% yoy while food was up 10.9% yoy.
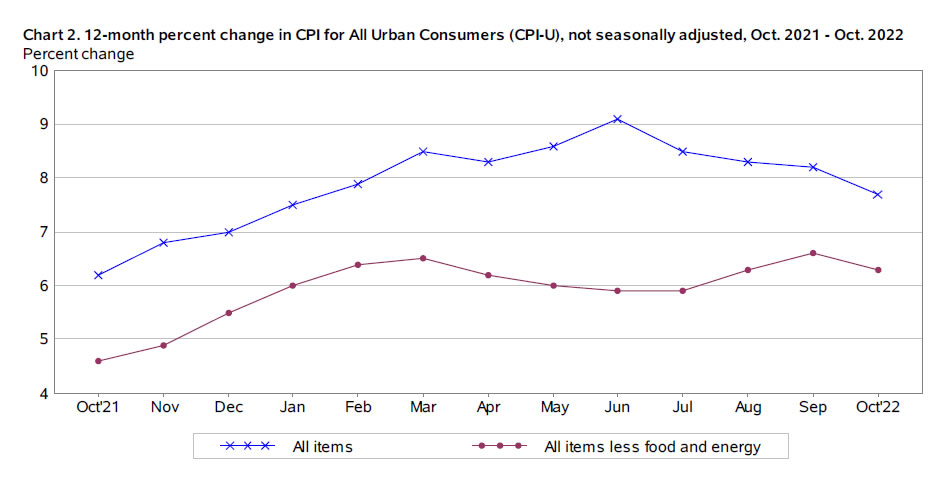
GBPUSD: Fresh Bears Found a Footstep Above Key Support and Eye US Inflation Data for Signal
Cable is consolidating within a narrow range, following Wednesday’s 1.6% drop, which retraced over 50% of the recent 1.1146/1.1599 upleg.
Although a reversal pattern formed on a daily chart, fresh bears face strong headwinds from significant support at 1.1319 (top of thick daily cloud / Fibo 61.8%) which so far keeps the downside protected and prevent confirmation of reversal.
Daily studies are currently mixed, but expected to remain slightly biased higher while the action stays above the cloud, though lift and close above 10DMA (1.1427) is needed to revive bulls and extension above psychological 1.15 level to confirm.
Conversely, penetration of daily cloud and extension through daily Kijun-sen (1.1284) would add to bearish stance and risk deeper fall.
Traders look for US inflation data to get clearer signals, with October’s figure at / below forecast (8%) to deflate dollar and give fresh boost to sterling, while higher than expected result would add to the story of Fed’s continuous aggressive policy tightening, which is expected to be dollar supportive.
Res: 1.1426; 1.1500; 1.1567; 1.1599.
Sup: 1.1333; 1.1319; 1.1284; 1.1253.
ECB bulletin: Further weakening of economy into beginning of 2023
In the monthly economic bulletin, ECB said the Governing Council expects a "further weakening" of economic activity "in the remainder of 2022 and the beginning of 2023".
High inflation continues to "dampen spending and production" and severe disruptions in gas supply "have worsened the situation further".
Additionally, "worsening terms of trade", with imports prices rising faster than exports prices, are "weighing on incomes in the euro area".
Risks to the economic growth outlook are "clearly on the downside, especially in the near term". Risks to the inflation outlook are "primarily on the upside".
ECB's future policy rate decisions will continue to be "data dependent" and follow a "meeting-by-meeting approach".
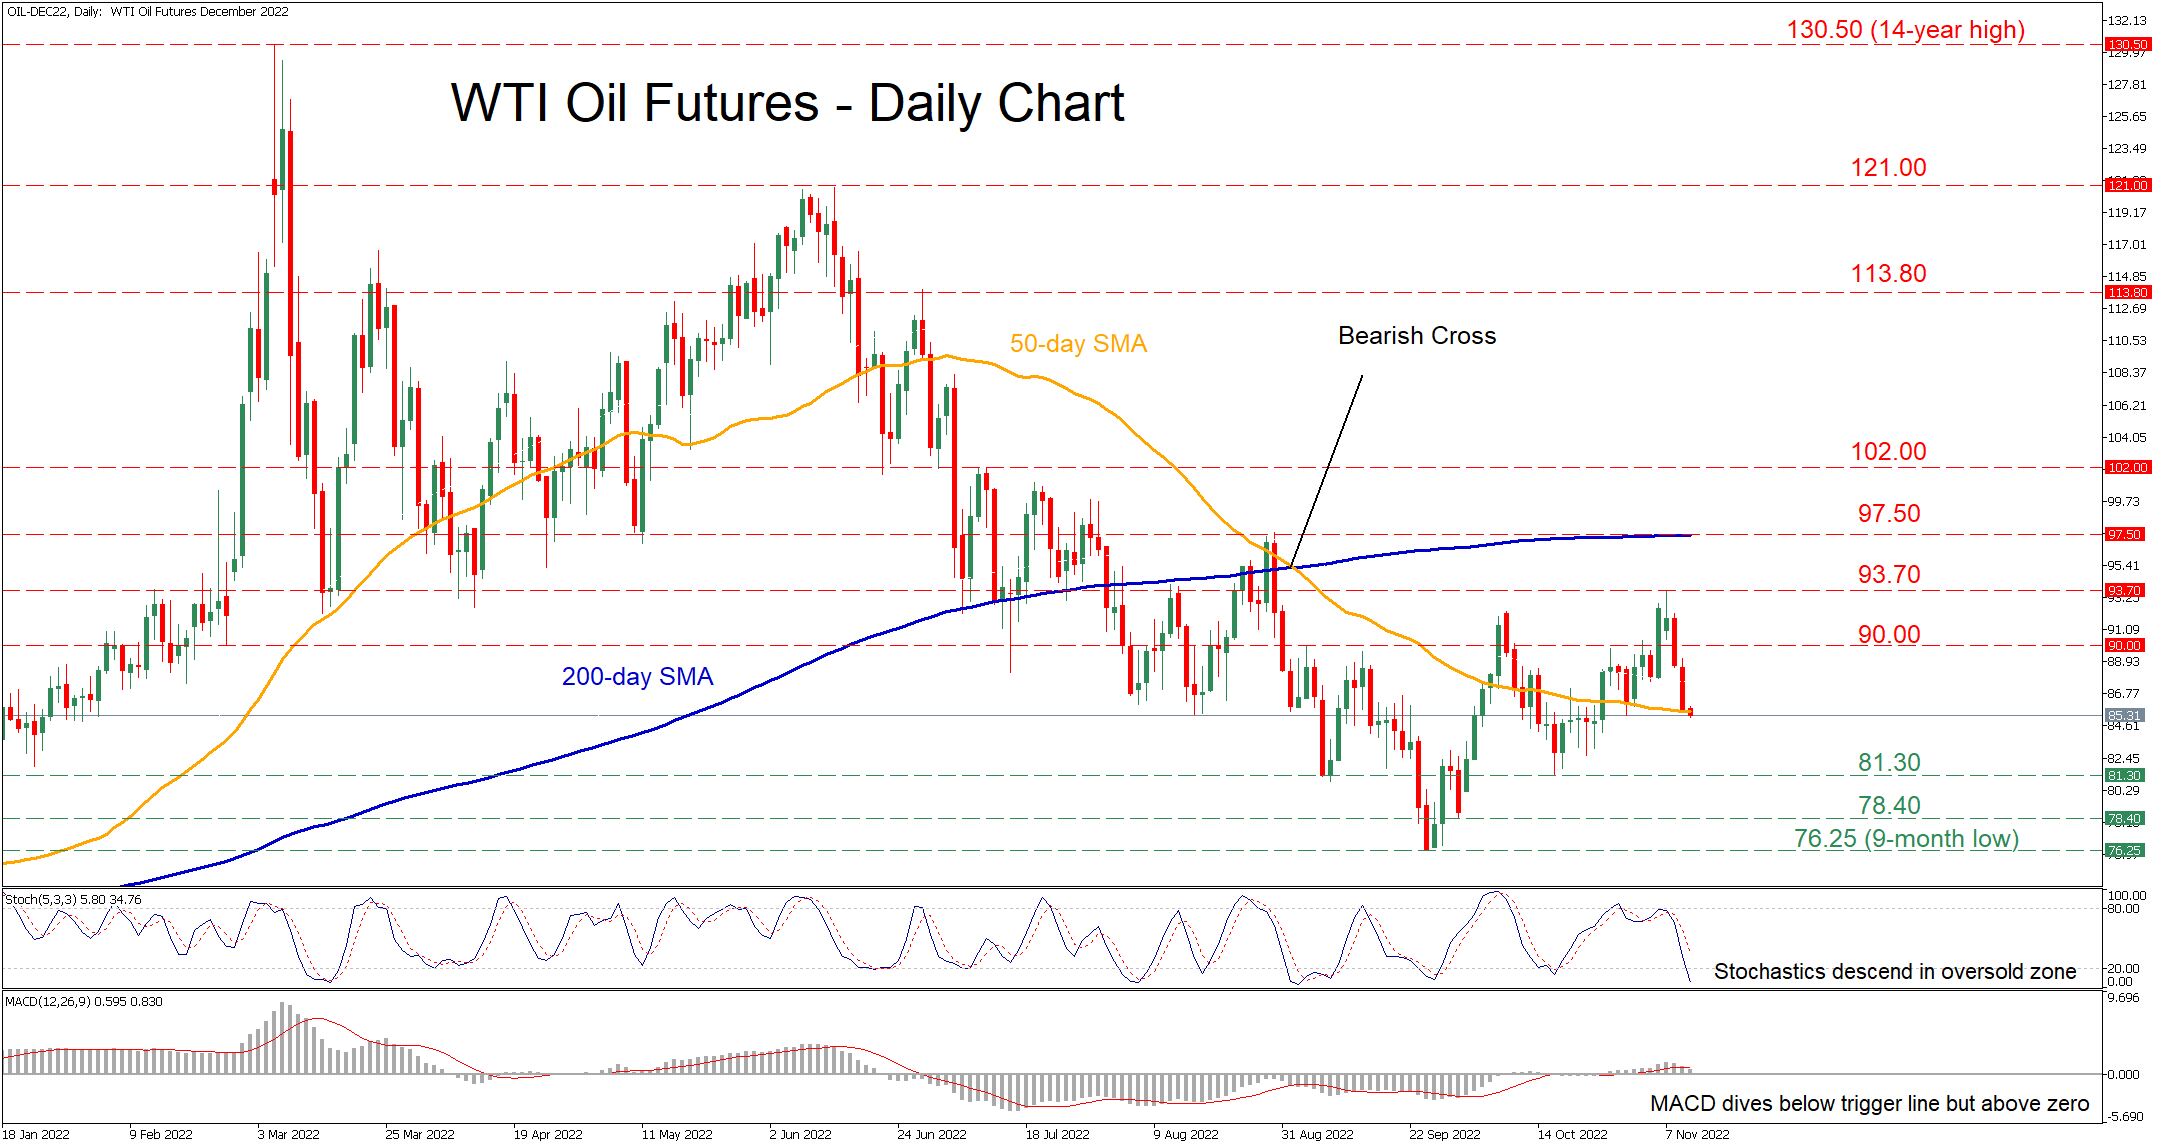
WTI Oil Futures Plummet But 50-day SMA Caps Downside
WTI oil futures (December delivery) have been experiencing a prolonged decline since mid-June when the price failed to surpass the 121.00 mark. Although the commodity managed to erase a part of its downtrend after bouncing at the nine-month low of 76.25, the technical picture has deteriorated again in the last couple of daily sessions.
The momentum indicators currently suggest that bearish forces are strengthening. Specifically, the stochastic oscillator is descending near its 20-oversold zone, while the MACD histogram has dived beneath its red signal line but holds above zero.
If selling pressures persist and the price crosses below the 50-day simple moving average (SMA), initial resistance could be met at the recent support of 81.30. Should that floor collapse, the bears could then aim for 78.40. A violation of the latter may trigger a retreat towards the nine-month low of 76.25.
On the flipside, if buyers regain control, oil futures might ascend towards the 90.00 psychological mark before the recent peak of 93.70 comes under examination. Conquering this barricade, further advances could then stall at the 97.50 region, which overlaps with the 200-day SMA. Even higher, the 102.00 hurdle could prove a tough one for the price to overcome.
Overall, WTI oil futures appear to be losing ground as negative momentum intensifies. Therefore, a successful break below the 50-day SMA might accelerate the downfall.
Aussie Dips as Inflation Expectations Jump
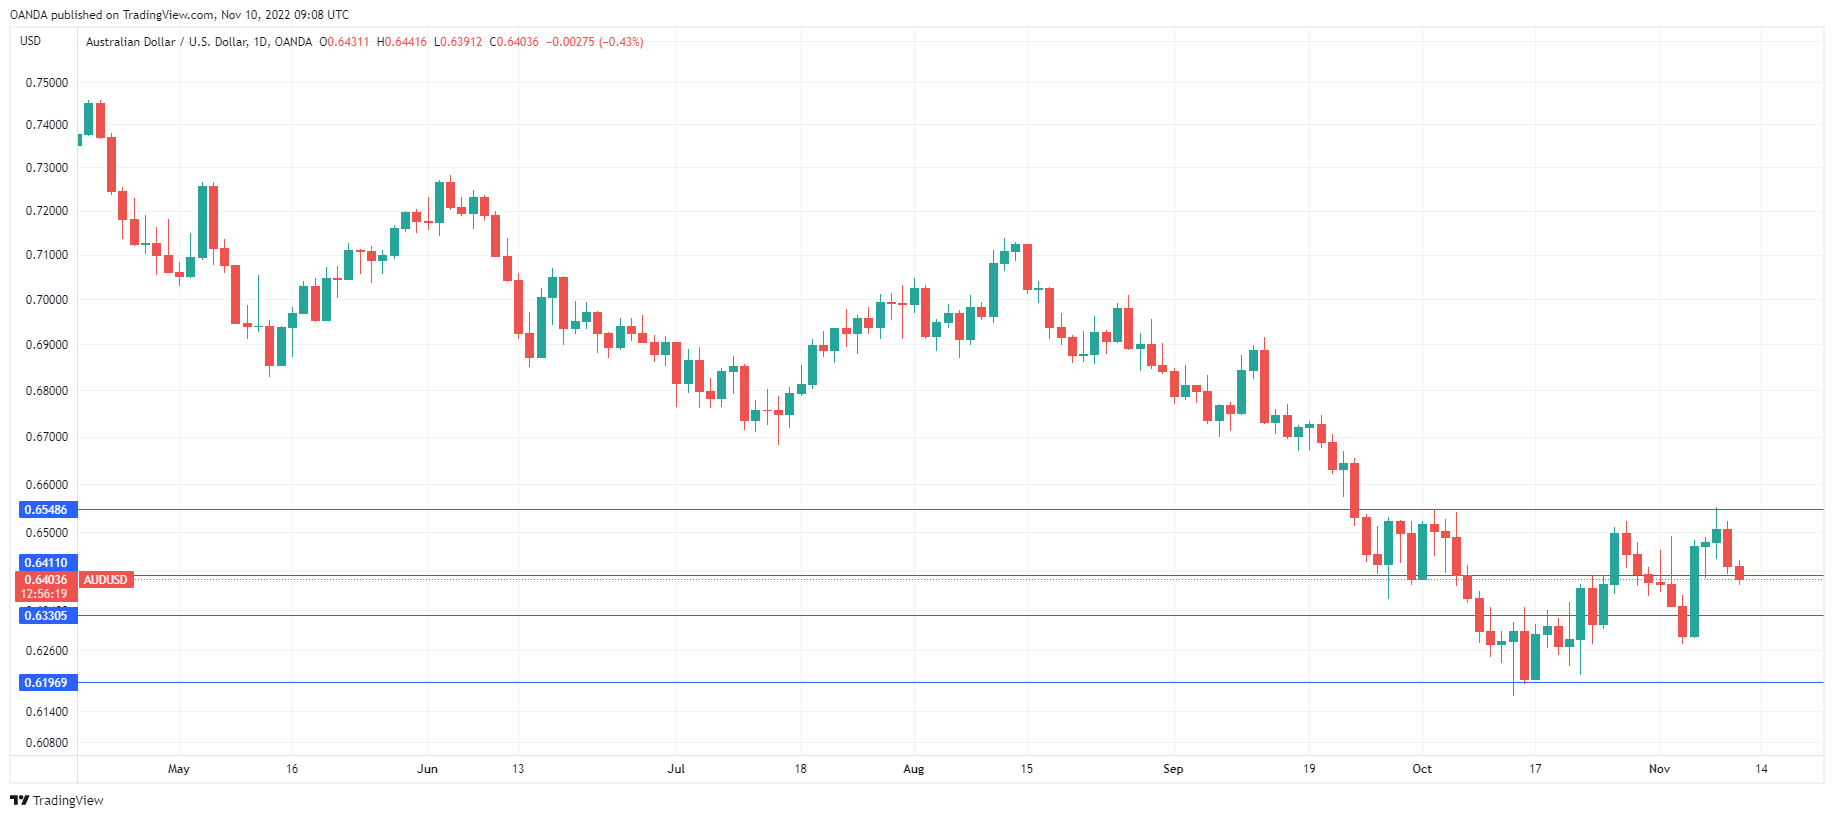
The Australian dollar has extended its losses today. AUD/USD is trading at 0.6412, down 0.29%.
The US dollar has rebounded after a 3-day slide, which saw the Australian dollar climb over 200 points. The Aussie has coughed up half of those gains since Tuesday, and we could be in for further volatility in today’s North American session, as the US releases the October inflation report. Investors are somewhat confused, thanks to mixed signals from both the Federal Reserve and last week’s US employment report.
The Fed meets next in mid-December, and it’s close to a toss-up as to whether the Fed will raise rates by 0.50% or 0.75%. At the last meeting, at which the Fed hiked by 0.75%, Fed Chair Powell hinted at easing up on rates but also said that the terminal rate would likely be higher than previously expected – this mixed message makes it difficult to peg the Fed as being hawkish or dovish.
US inflation expected to remain hot
Last week’s employment report was mixed, as unemployment and wage growth climbed, while nonfarm payrolls fell but still exceeded expectations. This makes today’s inflation report all the more important for the Fed ahead of the December meeting. A hot inflation report would likely boost the likelihood of a 0.75% hike, which would be bullish for the US dollar. CPI is expected to dip to 8.0%, down from 8.2%, which although a slight improvement, would indicate that inflation remains very high.
Australia is also dealing with high inflation, and Melbourne Institute Inflation Expectations for October reinforced concerns that inflation is yet to peak. Inflation Expectations rose to 6.0%, up sharply from 5.4% in September, and the first acceleration in four months. The economy is showing signs of slowing down, and a report from the National Australian Bank on Wednesday projected that GDP would fall to 0.8% in 2023 and interest rates would peak at 3.6% next year. The cash rate is currently at 2.85%, which means that the RBA is likely to continue raising rates into 2003.
AUD/USD Technical
- AUD/USD is testing resistance at 0.6411. Above, there is resistance at 0.6549
- There is support at 0.6239 and 0.6196
Dollar Index: Dollar Remains at the Front Foot But Eyes US Inflation Data for Stronger Signal
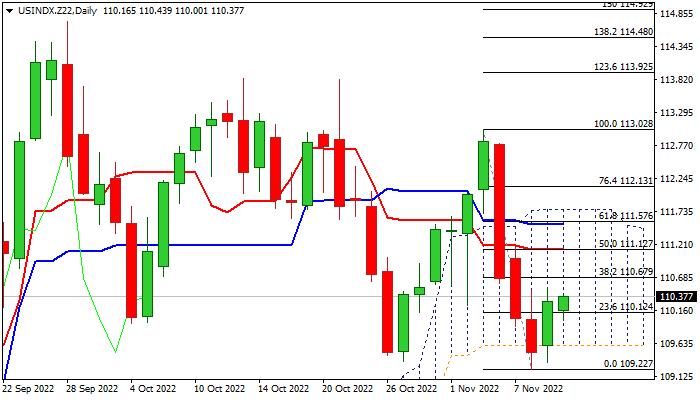
The dollar index remains constructive in early Thursday’s trading, following Wednesday’s 0.65% bounce (the first bullish close after three days of heavy losses), after the action was repeatedly rejected at ley support at 109.35 (Oct 27 low) and also failed to register a clear break below the base of thick daily cloud (109.61).
Thursday’s action is so far holding above broken psychological 110 level, but gains were limited during Asian/early European session, as traders turn focus towards today’s key event – US inflation data.
Economists expect the headline CPI to ease to 8.0% in October from 8.2% previous month, though wide expectations that the Fed may ease its aggressive stance in policy tightening, are very likely not to materialize, as the Fed is not in the position to abandon its hawkish stance with inflation being still four times above the central bank’s 2% target.
Daily studies show a slight improvement, but remain bearish overall, with current recovery to be seen as positioning for fresh weakness while the action stays below 111 zone (daily Tenkan-sen / 50% retracement of 113.02/109.22 bear-leg).
Break here would sideline downside risk and open way for further recovery towards key barriers at 111.52/76 (daily Kijun-sen/daily cloud top), violation of which would bring bulls fully in play.
Res: 111.53; 111.67; 111.12; 111.52.
Sup: 110.00; 109.61; 109.22; 108.92.
EURUSD Fails to Remain Above 1.0000; Neutral in Medium-Term
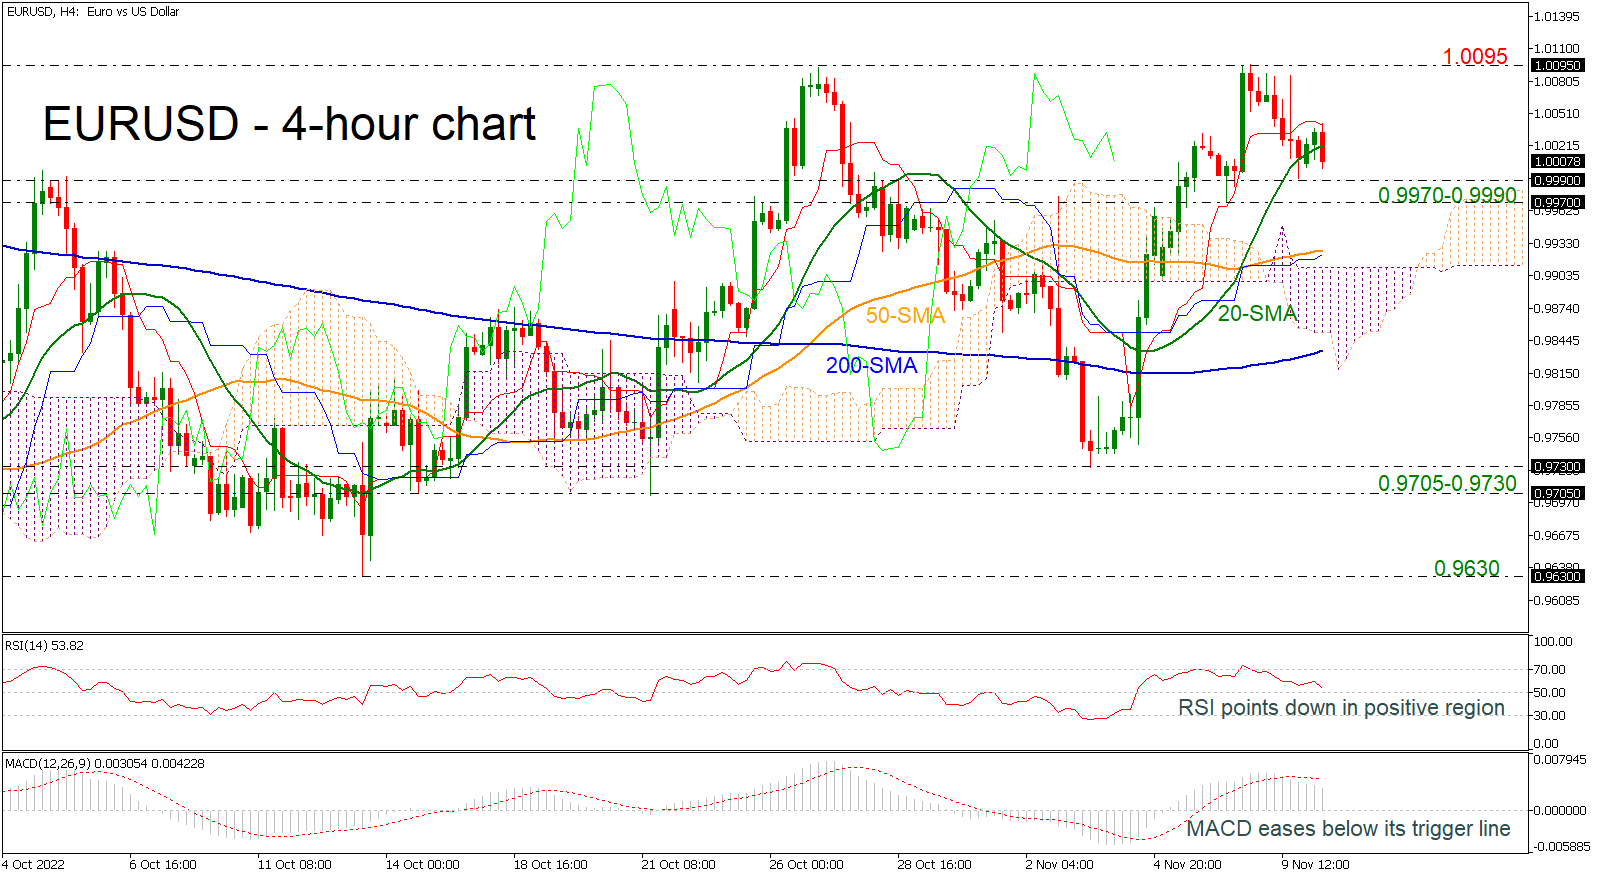
EURUSD is meeting the parity level again, dropping beneath the 20-period simple moving average (SMA) after the pullback from the 1.0095 resistance. In the medium-term timeframe, the pair is failing to have a clear directional movement as it has been moving sideways since mid-October.
The technical oscillators are suggesting a negative movement as the RSI is pointing down in the positive region following the decline from the overbought region, while the MACD is losing momentum beneath its trigger line.
Further losses should see the 0.9970-0.9990 support region acting as a major support ahead of the 50-period SMA and the upper boundary of the Ichimoku cloud around 0.9920. A slip lower would challenge the 200-period SMA at 0.9835, reinforcing the bearish structure in the short-term and open the ways towards the next key support region of 0.9705-0.9730.
In the event of an upside reversal, the 1.0095 resistance could be the next target before being able to re-challenge the 1.0200 obstacle and the 1.0370 peak, registered on August 10.
Overall, EURUSD is bearish in the very short-term timeframe, while the bigger picture is neutral. Any moves beneath the 200-period SMA may switch the outlook back to negative.