

Sample Category Title
Silver (Xag) Elliott Wave Analysis: Final Push Higher Before Reversal
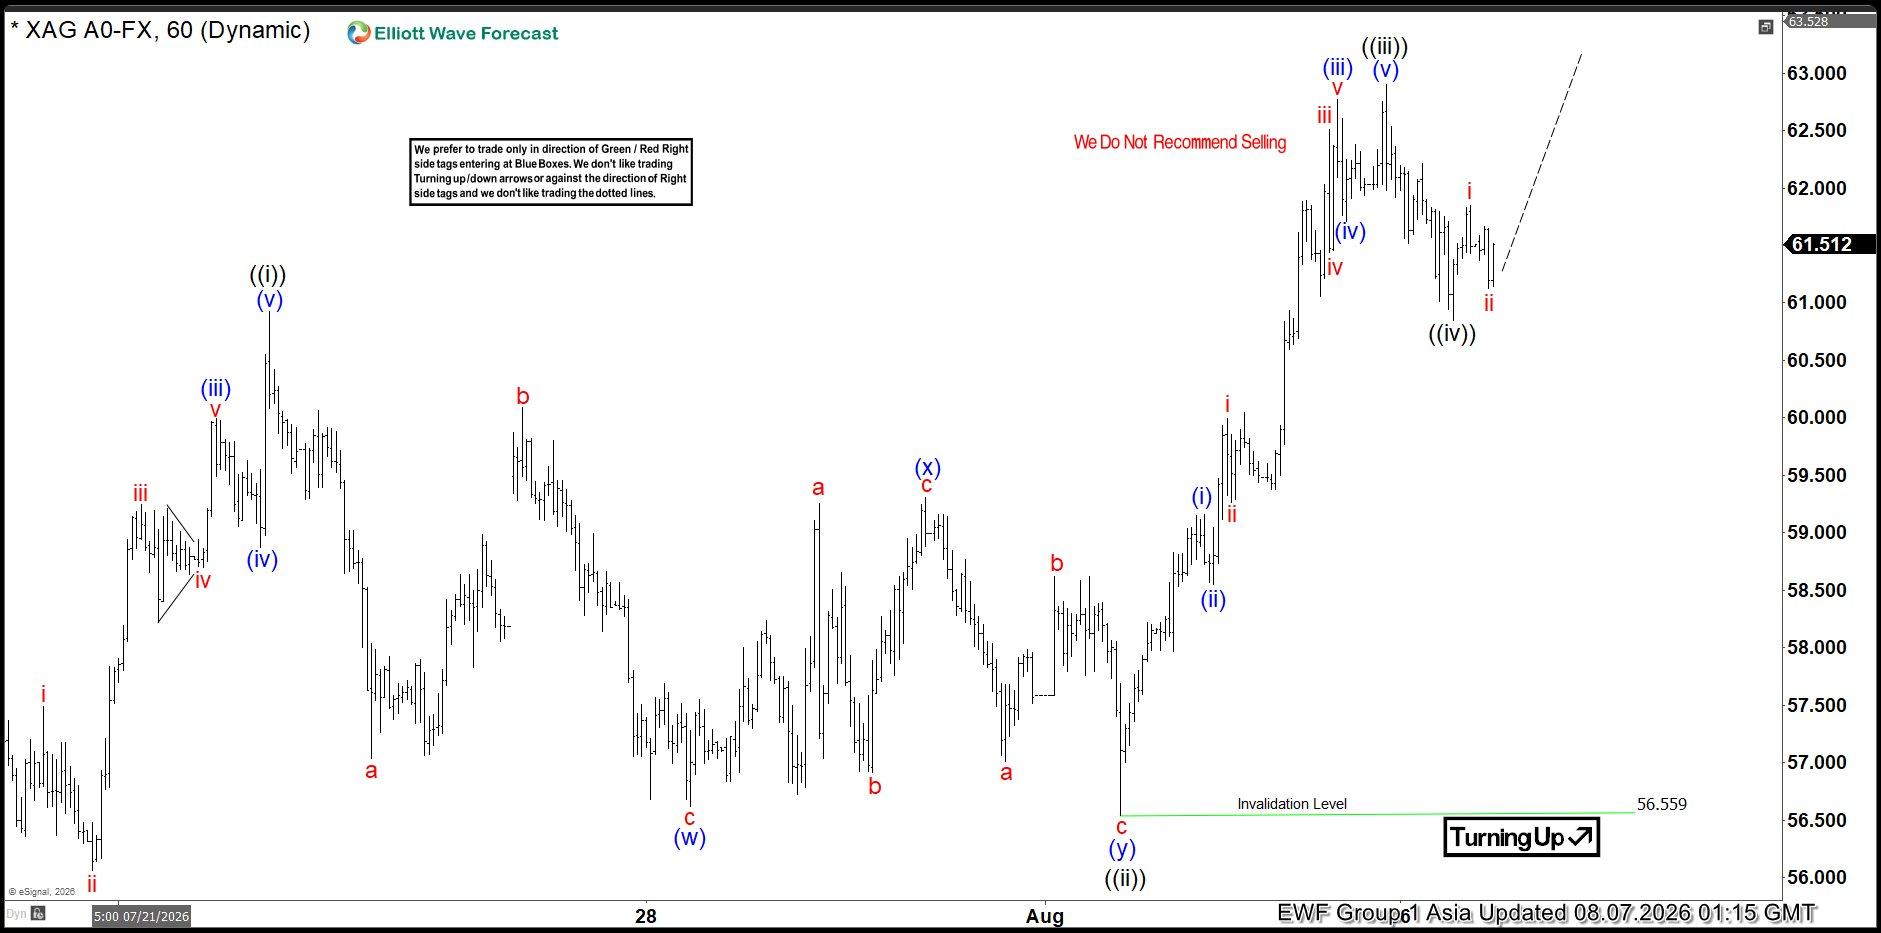
Silver (XAG) continues to follow our Elliott Wave outlook after completing the wave ((iv)) pullback at 60.8514. Buyers have driven the metal higher into the final five-wave advance in wave ((v)). The corrective rally is now entering its final stage. Although the short-term trend remains bullish, the Elliott Wave structure points to limited upside. We expect sellers to return once price reaches key Fibonacci resistance.
The 60-minute Elliott Wave chart shows Silver advancing in wave ((v)) of red wave C, which forms part of a larger wave (B) Flat correction. Fifth waves often extend toward the 1.236–1.618 Fibonacci external retracement of wave ((iv)). That gives an initial target between 63.42 and 64.24. Silver has already reached the 100% Fibonacci extension of wave A. However, buyers could still push prices toward the 161.8% Fibonacci extension near 67.00 before the rally ends.
Our Silver Elliott Wave forecast points to the 62.00–67.00 area as the next major resistance zone. We expect the current bounce to finish within the next 24 hours. After that, sellers should regain control and resume the larger bearish trend.
Overall, Silver remains bullish in the very short term while wave ((v)) continues to develop. Traders should avoid chasing prices into the earlier mentioned resistance zone. Instead, they should watch for signs of exhaustion before positioning for the next move lower.
XAG 60 Min. Elliott Wave Chart
Video analysis:
https://www.youtube.com/watch?v=xB78Jcq_Tvc
China Exports Rise 23.9% YoY as High-Tech Demand Defies Tariffs
China's exports remained a major source of economic strength in July, supported by booming global demand for high-tech products even as growth moderated from June's rapid pace. Exports rose 23.9% yoy in US dollar terms, slowing from 27.0% but beating expectations of 22.2%. Imports also remained strong, though growth eased from 36.0% to 27.5%, broadly matching forecasts. Trade surplus consequently narrowed from $125.6B to $112.5B, but still exceeded expectations of around $107B.
High-tech manufacturing continued to drive export performance. Semiconductor exports nearly doubled in value over first seven months of year, while overall high-tech exports surged 40.7%. Chip exports alone jumped 117% yoy in July, while cars, electric vehicles, batteries and other advanced manufacturing products also recorded strong overseas demand. But strength was increasingly uneven: ceramic exports plunged 28.3% and toy shipments fell 9.7%, highlighting widening divergence between advanced manufacturers benefiting from global AI and electrification investment and traditional industries facing much softer demand.
Trade with US also remained resilient, with Chinese exports rising 17% yoy in July, accelerating from around 14% in June. However, part of that strength likely reflected exporters front-loading shipments ahead of higher US tariffs, raising questions over whether current growth can be sustained. Exports to EU increased 16%, providing another source of external support. With domestic consumption and investment still subdued, exports remain crucial to China's growth outlook, but increasing dependence on high-tech demand and escalating trade barriers leave external sector exposed to both global technology cycle and further protectionist measures.
Data Summary
| Indicator | July 2026 | Expected |
|---|---|---|
| Exports (yoy, USD) | +23.9% | +22.2% |
| Imports (yoy, USD) | +27.5% | +27.9% |
| Trade Surplus | $112.5B | $107B |
| Exports to US (yoy) | +17.0% | — |
| Exports to EU (yoy) | +16.0% | — |
| High-Tech Exports (Jan–Jul, yoy) | +40.7% | — |
| Semiconductor Exports (Jan–Jul, value) | Nearly +100% | — |
| Chip Exports (July, yoy) | +117% | — |
Key Takeaways
- China's exports grew 23.9% yoy in July, slowing from 27.0% in June but comfortably beating expectations of 22.2%. External demand remains an important support for economy amid subdued domestic consumption and investment.
- Imports increased 27.5% yoy, down from 36.0% in June and broadly matching expectations, while trade surplus narrowed from $125.6B to $112.5B.
- AI and advanced manufacturing remain major engines of export growth. High-tech exports surged 40.7% during first seven months of 2026, while semiconductor exports nearly doubled in value.
- July chip exports surged 117% yoy, while auto exports increased by more than 50%, highlighting strength in sectors benefiting from global AI infrastructure spending and China's advanced manufacturing expansion.
- Performance remains uneven. Ceramic exports fell 28.3% and toy exports dropped 9.7%, showing traditional industries are not sharing equally in export boom.
- Exports to US accelerated to 17% yoy, but some strength likely reflected front-loading ahead of higher US tariffs, making it harder to extrapolate July's pace into coming months.
- Overall, trade data remain supportive for China's growth, but increasing reliance on high-tech exports and mounting protectionism create risks for sustainability of export-led momentum.
US Nonfarm Payrolls to Complete the Week
In focus today
- The most important data release will be the US July Jobs Report. We forecast nonfarm payrolls at +70k, the unemployment rate unchanged at 4.2%, and average hourly earnings at +0.3% m/m s.a. Most leading data still point towards solid labour market conditions, although weak labour supply growth also weighs on the employment growth outlook. The unemployment rate remains the Fed's primary focus. The Fed's Barkin (non-voter, neutral) will be on the wires after the release.
- The remaining data calendar remains relatively light, with industrial production due from Denmark, Germany and Norway, including manufacturing production in Norway.
- Focus will also remain on developments in the Middle East and the SOH, where a temporary reopening remains uncertain and traffic is unlikely to resume immediately.
- Over the weekend inflation figures from China are set for release.
Economic and market news
What happened overnight
In commodities, Brent crude moved above USD83/bbl, erasing most of this week's earlier decline. A draft Iran-Oman proposal, now under review by the parliament in Iran, would impose stricter conditions on commercial shipping through the strait than markets had anticipated. The plan includes limits on US and Israeli vessels, compensation requirements for countries deemed hostile and penalties of 20% of cargo value for violations. Reports that Iran struck what it described as "hostile targets" in the strait added to the pressure.
In China, export growth remained strong in July at 23.9% y/y (cons: 22.7%, prior: 27.0%), underscoring trade as a continued bright spot amid weaker domestic indicators. Imports also eased to 27.5% y/y (prior: 36%). Exports remained supported by solid foreign demand alongside robust demand for AI-related technology products and front-loading of shipments to the US ahead of a late-July tariff increase.
In Japan, household spending fell by 3.3% y/y in June (cons: 1.0%, prior: -0.4%). The fall marked the seventh consecutive month of contraction and the largest decline in the current sequence, highlighting continued weakness in consumer demand. On a monthly basis, household spending dropped 6.4% m/m s.a. (cons: -3.1%, prior: 3.7%).
What happened yesterday
In the US, the July Challenger Report showed 33,429 announced layoffs, the lowest level since July 2024. The share of AI-linked layoffs continued to rise and now accounts for up to 33% of total layoffs. Initial and continuing jobless claims remained little changed at low levels, with the latter rising to 1.801m in the week ending 25 July. Productivity growth picked up to 1.4% q/q AR in Q2 from 0.3% in Q1, limiting unit labour cost growth to 1.3% q/q AR from 1.8%. The Fed will be glad to see that the labour market has not been a significant source of inflationary pressure. For now, productivity growth remains consistent with historical levels, suggesting no clear AI-driven acceleration yet.
Attention also turned to Fed communication, with the FT reporting that Chair Warsh will stick to his no-guidance policy. People familiar with his thinking said Warsh would be prepared to raise interest rates at the September meeting if upcoming inflation prints remain elevated and markets price in higher borrowing costs. Warsh is expected to explain the intellectual framework behind his communication strategy at Jackson Hole on 22 August.
In Sweden, July flash inflation surprised to the upside, with core inflation at 0.6% y/y (Danske: 0.39%, cons: 0.24%), CPIF at 0.75% y/y (Danske: 0.64%, cons: 0.49%) and CPI at 0.21% y/y (Danske: 0.11%, cons: 0.03%). The flash details provided only limited information, but the upside surprise was driven by goods prices, likely reflecting pass-through from higher commodity prices during the spring.
In the euro area, retail sales fell by 0.3% m/m in June (cons: 0.1%, prior: 0.4%). The decline mainly reflected weaker sales in Germany and France, while Italy, Spain and the Netherlands recorded modest increases. On a year-on-year basis, retail sales growth slowed to 0.7% from 1.9% in May, marking the weakest gain since July 2024 and falling short of expectations of 1.0%.
Equities: Equities ended lower yesterday in what was once again a textbook 2026 style risk off session, albeit one that looked very different from a traditional risk off environment. The move was not driven by deteriorating macro data or disappointing earnings, but rather by weaker sentiment as investors became increasingly concerned about geopolitics and the pace of AI investment. Higher oil prices weighed on broader equities, but the dominant feature remained sector rotation rather than outright selling. Defensives outperformed, led by energy, while consumer staples and health care also advanced. The magnitude of the ongoing rotations between cyclicals and defensives continues to be striking and remains far larger than the underlying market moves. Yesterday also marked the first session in a week where value and min vol outperformed, while Europe emerged as the strongest regional market. This morning, AI concerns continue to weigh on Asian markets, particularly the more technology heavy indices, while US and European futures are trading mixed.
FI and FX: EUR/USD edged lower but remained within the 1.1500-1.1550 range and USD/JPY edged above 158 yesterday, as higher oil and natural gas prices supported USD broadly against most G10 currencies. Treasury and Bund yields moved higher particularly in the belly of the curve. Brent crude ended the day just below USD84/bbl, following reports that Iran had attacked "hostile targets" in the Strait of Hormuz and the draft proposal with Oman included stricter control of the Hormuz Strait than anticipated by markets. Swedish rates sold off following the publication of the July flash inflation print, as CPIF excl. energy came in 0.3pp above analyst expectations at 0.6% y/y. Rounding off the week, the US Jobs Report is set for release in the afternoon. We forecast nonfarm payrolls at +70k, the unemployment rate holding steady at 4.2% and average hourly earnings at +0.3% m/m SA.
USD/JPY Faces NFP With Intervention Risk Creating an Asymmetric Trade
TL;DR: USD/JPY has recovered a third of last week's intervention-driven losses, but Friday's payrolls report sets up an asymmetric trade — a strong print faces profit-taking near 160 on intervention risk, while a weak print has a clear, undeterred path back to 155.
A Recovery That Faces Its First Real Test
USD/JPY has recovered roughly one-third of the losses triggered by last week's rare US-Japan intervention, but Friday's nonfarm payrolls report will test whether that recovery has much further to run. Under normal circumstances, a major upside or downside payroll surprise would produce broadly symmetrical reactions through Treasury yields and Fed expectations. This time is different. Rapid confirmation of intervention by both Washington and Tokyo, together with unusually forceful messaging, has changed how traders are likely to manage positions. A strong NFP could still send USD/JPY higher, but traders now have powerful reasons to take profits as it approaches 160. A weak report faces no equivalent restraint on the way back toward 155.
Intervention Changed More Than USD/JPY's Level
The context of last week's intervention is crucial. Washington and Tokyo didn't merely step into the market and leave traders guessing — both sides moved quickly to confirm what happened, effectively removing ambiguity over whether the sharp fall from 163.97 was official intervention. That mattered because confirmation transformed a one-off market operation into a warning: authorities were prepared to act against excessive Yen weakness, and speculators shouldn't assume USD/JPY could simply snap back once intervention flows ended.
Timing reinforced that message. Intervention came immediately before a heavy US data week containing both ISM surveys and, most importantly, today's employment report. Officials would have known strong data could revive Fed hike expectations and quickly rebuild upward pressure on USD/JPY. By demonstrating their willingness to intervene beforehand, they changed the risk calculation facing anyone considering rebuilding long positions.
That deterrence may prove more important than whether authorities actually intervene again. Traders don't need to know the precise level or timing of another operation — they only need to believe the probability is sufficiently high that holding an extended USD/JPY long becomes unattractive. In that sense, intervention can continue influencing the pair even without another Dollar being sold.
NFP Has Plenty of Room to Surprise
Today's employment report arrives after a particularly mixed set of leading indicators. Expectations center on roughly 80K–100K growth in July payrolls after just 57K in June, while unemployment is expected around 4.2% and average hourly earnings around 0.3% mom. But this week's data provide little conviction over which side of consensus payrolls will land:
- ISM Manufacturing Employment jumped from 49.7 to 52.8, returning to expansion for the first time in 33 months — the strongest employment signal of the week.
- ISM Services Employment moved sharply the opposite direction, falling from 51.2 to 47.4 and returning to contraction.
- ADP added to the softer side of the picture, with private employment growth of only 44K.
- JOLTS offered a more stable message: job openings were little changed at 7.4m, hiring remained subdued at 5.3m, and quits and layoffs were also broadly unchanged — reinforcing a picture of a low-hire, low-fire labor market rather than an abrupt deterioration.
- Weekly initial jobless claims at just 199K confirmed employers are still showing little inclination to shed workers.
Taken together, there's no clean signal ahead of NFP. That raises the potential for a meaningful surprise — and makes the reaction in USD/JPY particularly interesting.
Strong NFP: USD/JPY Can Rise, But Who Wants to Chase It Above 160?
A strong payroll report should initially produce a straightforward reaction. Treasury yields would likely rise, the Dollar should strengthen, and markets could revive expectations for a September Fed hike — a possibility particularly relevant with Brent having rebounded above $83, reducing some of the disinflationary relief that drove Fed repricing earlier this week.
USD/JPY would naturally participate. The rebound from 155.22 could extend, but the difficulty comes as the pair approaches 160. Technically, the 50% retracement of 163.97 to 155.22 lies at 159.59, almost exactly overlapping the 55 4H EMA, currently around 159.51 — making 159.50–160.00 an obvious resistance zone even without intervention risk.
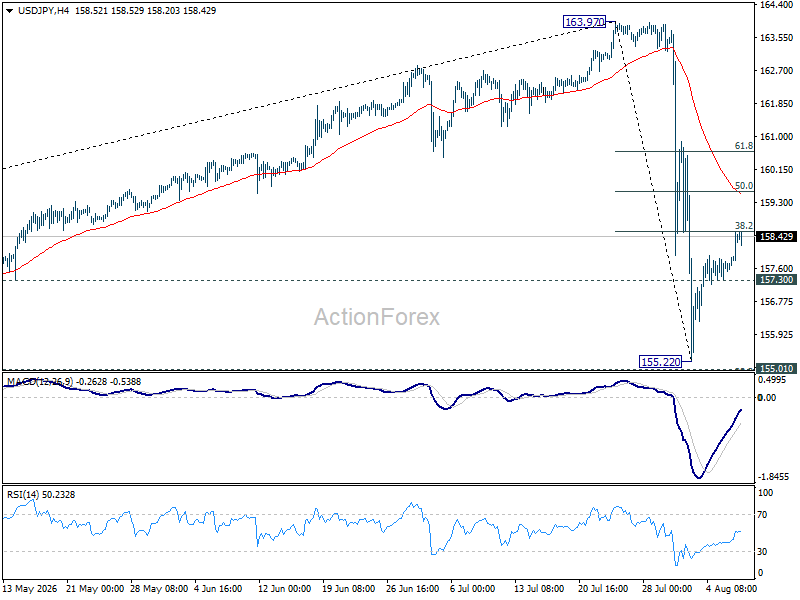
But intervention changes incentives around that resistance dramatically. A trader buying USD/JPY following strong payrolls may have a profitable position by the time the pair approaches 160. Holding onto that trade then means accepting the possibility that Washington and Tokyo intervene again and erase those gains rapidly — last week's operation demonstrated that this is no longer a theoretical tail risk.
Friday timing adds another consideration. Traders approaching US close would have to decide whether to carry those longs through a weekend of persistent Middle East uncertainty and then into Monday's thinner Asian liquidity, when intervention risk would be particularly difficult to ignore. Many may decide there's little reason to do so — creating a natural tendency toward profit-taking around 160. Importantly, authorities wouldn't need to intervene for this mechanism to work: if speculators voluntarily close longs rather than challenge authorities, deterrence itself becomes part of resistance.
Weak NFP: Downside Has No Intervention Problem
A significant payroll miss produces a much cleaner setup. Weak employment growth, particularly if combined with higher unemployment or softer wage growth, would undermine remaining expectations for a September hike. Treasury yields would likely fall, the Dollar would weaken, and USD/JPY could quickly reverse its recovery from 155.22.
Unlike the upside case, traders would have little reason to fear that authorities might stand in their way. Last week's intervention was explicitly aimed at strengthening the Yen — a fundamental move in the same direction would therefore be entirely consistent with the policy objective already demonstrated by Washington and Tokyo.
Technically, a break of 157.30 minor support would shift focus back toward the 155.22 intervention low. The size and speed of any decline would depend heavily on the magnitude and composition of the payroll surprise, but there's little obvious policy deterrent preventing traders from testing that area.
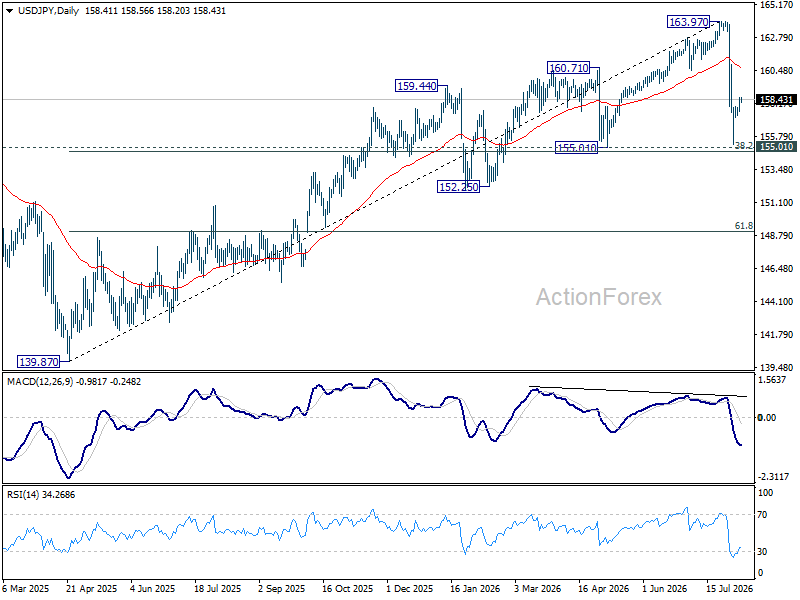
There is, nevertheless, a different reason for shorts to become cautious around 155. The 38.2% retracement of 139.87 to 163.97 lies at 154.76, creating significant medium-term technical support immediately beneath the intervention low. Once USD/JPY approaches that 154.76–155.22 zone, fresh downside would offer progressively less attractive risk-reward. Weekend positioning matters here too — with geopolitical uncertainty still elevated, traders sitting on profitable USD/JPY shorts may see little benefit in pressing them aggressively into major technical support immediately before markets close, which could generate profit-taking around 155 even without any official resistance to Yen strength.
ActionForex's View: Same Payroll Surprise, Very Different Risk Calculations
The result is an unusually asymmetric NFP setup. A strong report can revive Fed hike expectations and extend USD/JPY's rebound, but every move toward 159.50–160.00 increases the incentive for traders to bank profits rather than challenge authorities who have already demonstrated willingness to intervene.
A weak report has a clearer path lower. A break of 157.30 could reopen 155.22, with authorities unlikely to discourage a move that reinforces their own intervention objective. Only around 154.76–155.22 does the downside encounter a comparable reason for traders to step back — and there, the constraint comes from technical support and weekend risk rather than fear of official action.
That could leave 155–160 functioning as an effective post-intervention range. More importantly, it demonstrates why the success of last week's operation shouldn't be judged solely by whether Washington and Tokyo return to the market. If intervention risk persuades traders to take profits before USD/JPY can rebuild its previous rally, deterrence is already doing much of the work authorities intended.
Key Takeaways
- USD/JPY faces an asymmetric NFP setup: intervention risk caps upside profit-taking near 160, while downside toward 155 faces no equivalent official resistance.
- Leading indicators send conflicting signals into NFP — ISM Manufacturing improved sharply while ISM Services contracted and ADP came in soft, leaving no clean consensus read.
- 159.50–160.00 is key resistance (the 50% retracement at 159.59 overlapping the 55 4H EMA at 159.51), reinforced by traders' reluctance to hold longs through intervention-risk weekends.
- A break of 157.30 support would reopen the 155.22 intervention low, a move authorities have no incentive to resist since it aligns with their own policy objective.
- 154.76–155.22 marks the next technical floor beneath the intervention low, where profit-taking on shorts is likely driven by technical support and weekend risk rather than intervention fear.
Cliff Notes: Consumer Shows Resilience Amid Housing Gloom
Key insights from the week that was.
In Australia, the week kicked off with a gloomy update on the housing market. Cotality’s nationwide home value index dropped another 0.7% in July, following declines of 0.5% and 0.7% in May and June respectively, leaving prices 1.6% below their March peak. The scale of the correction is broadening across the capitals, with momentum in Brisbane and Adelaide abruptly shifting from gains to losses, while prices in Sydney and Melbourne fall more than 1% per month. The combination of restrictive monetary policy, weak homebuyer sentiment following the Budget and general economic uncertainty makes for a challenging backdrop.
Shifting focus to the consumer, recent readings on household spending point to a degree of resilience. Nominal household spending rounded out the quarter with a 0.8% increase in June, taking the Q2 gain to 1.3%. Just under half of that increase was driven by higher prices (0.6%), with higher volumes (0.7%) accounting for the remainder of the gain – implying slightly higher inflation and slightly lower real spending versus Q1. Gains across household contents, recreation & culture and hospitality point to the potential for improved discretionary spending, however.
Our Q2 Westpac-DataX Consumer Panel – a comprehensive update on income, spending and saving flows across the country – adds useful context. It shows that income growth has trailed spending growth over the past year, prompting households to draw down on savings. However, this drawdown had a relatively robust starting point given the median consumer had rebuilt savings buffers to around 2022 levels prior to the post-pandemic tightening cycle. While conditions remain uneven across the mortgage belt, the aggregate drawdown this year has been relatively modest, suggesting households retain a degree of financial resilience.
Before moving offshore, a final note on trade. June’s goods trade data surprised to the upside, recording a surplus of $1.9bn following May’s deficit of $2.4bn. Gold exports was the primary driver of monthly volatility, although a solid performance from iron ore also contributed to export earnings. For Q2 as a whole, goods trade appears set to detract around ½ppt from GDP growth, most notably due to large increases in fuel and EV imports.
Over in the US, the manufacturing PMI rose 2.3pts to 55.6, its highest level since May 2022, as production jumped 6.3pts to 58.5 and new orders remained firmly in expansionary territory at 56.7. Employment also returned to expansion for the first time in nearly three years. For the services sector, the headline PMI was broadly unchanged at 54.1, but the detail was mixed. New orders lifted 2.1pts to 57.2 and business activity 3.7pts. However, the employment index fell 3.8pts to 47.4, an outright contractionary read.
While a month behind the ISMs, the latest JOLTS job report points to less demand for labour across a number of key services sub-sectors including healthcare (-147k to 1,347k), education (-133k to 1,475k), professional & business services (-71k to 1,304k), and accommodation & food services (-68k to 684k). The only meaningful offset came from transportation & warehousing, which rose 119k to 1,369k reflecting a seasonal pattern. That said, the current job opening rate for the economy overall is consistent with labour demand and supply remaining broadly in balance as opposed to outright declines. Tonight sees the eagerly awaited release of the July employment report.
In China, the RatingDog manufacturing PMI fell 0.8pts to 50.9 in July, its weakest reading in four months. The headline decline was concentrated in production and new orders. Consistent with a soft domestic economy, price pressures eased further, input price inflation slowing to a six-month low and output price growth remaining broadly flat. The services PMI experienced a sharper fall to 50.4 in July, its lowest reading since September 2024. The July decline was primarily driven by weaker growth in domestic new orders. Employment continued to expand, albeit at a slower pace, while business sentiment fell to its lowest level since early 2020. Clearly there is need for pro-active stimulus in scale through the second half of the year.
Finally, in the Middle East, a deal between Iran and Oman over transit through the Strait of Hormuz is reportedly in the final stages of drafting. If implemented, it will allow safe passage for commercial ships. Iran has said, however, that US and Israeli-linked vessels will not be allowed to transit while the US’ blockade remains in effect. Whether this stance causes an issue for the implementation of this deal and/or any further progress towards a lasting peace is a question for another day. Market participants continue to take a glass half full view, with Brent oil having traded near USD80 most of this week.
USD/JPY Rebounds as Traders Await the US Jobs Report
Key Highlights
- USD/JPY started a recovery wave from the 155.25 zone.
- It cleared a short-term contracting triangle with resistance at 158.00 on the 4-hour chart.
- EUR/USD could correct some gains from the 1.1565 resistance.
- The US nonfarm payrolls could change by 80K in July 2026.
USD/JPY Technical Analysis
The US Dollar tumbled and tested 155.25 against the Japanese Yen. USD/JPY formed a base and started a recovery wave above the 156.50 resistance.
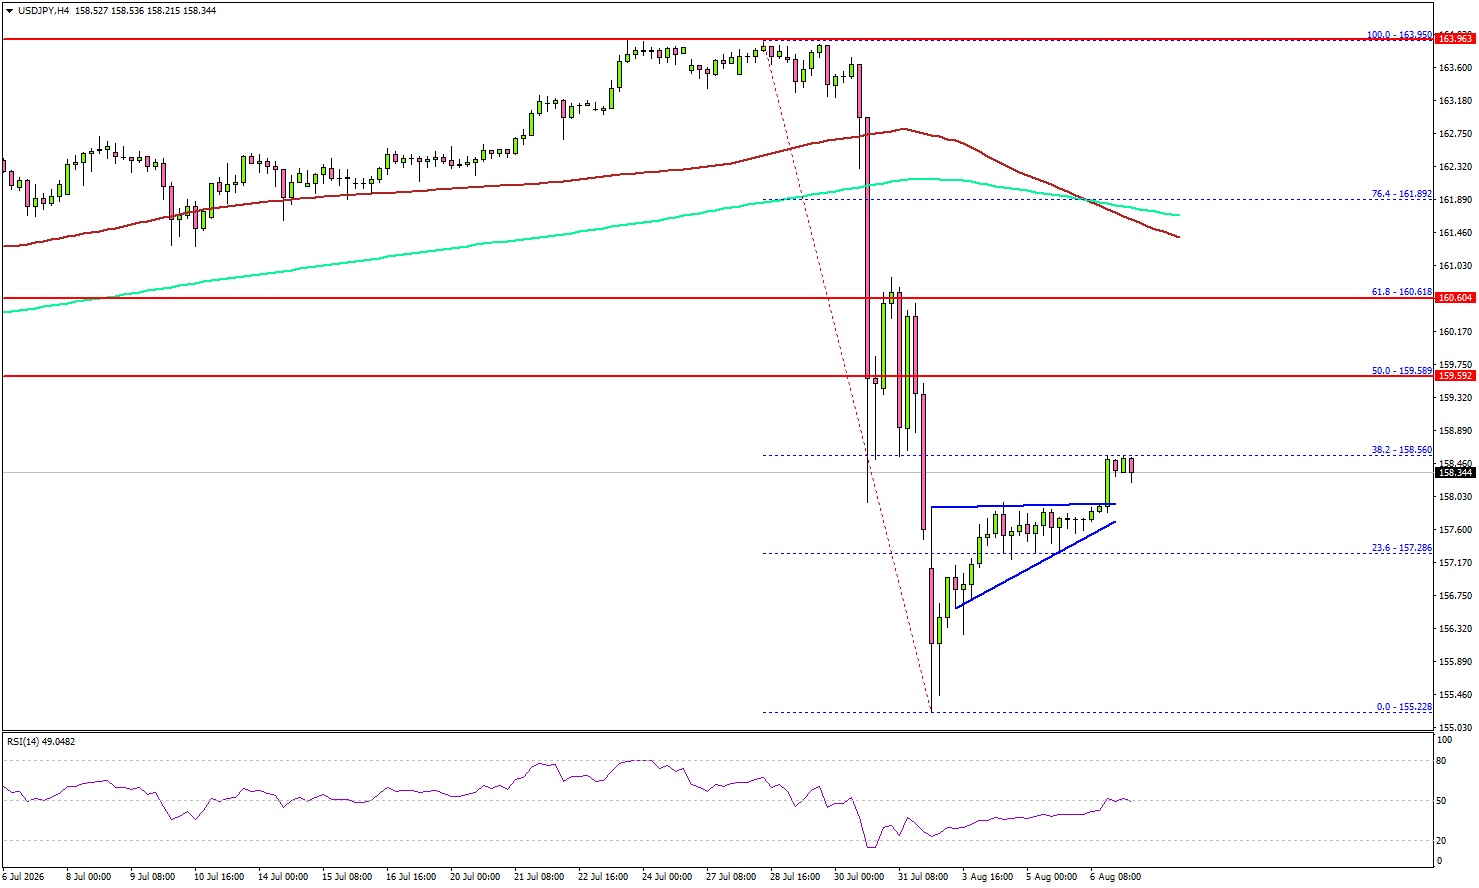
Looking at the 4-hour chart, the pair surpassed the 23.6% Fib retracement level of the downward move from the 163.95 swing high to the 155.28 low. It also cleared a short-term contracting triangle with resistance at 158.00.
However, the pair is still well below the 100 simple moving average (red, 4-hour) and the 200 simple moving average (green, 4-hour). On the upside, the pair could face resistance near 158.80.
The next major resistance might be near the 50% Fib retracement level at 159.60. A close above 159.60 could start another steady increase. In the stated case, the bulls could aim for a move to 160.60 and the 100 simple moving average (red, 4-hour).
Any more gains might open the doors for a test of 162.00. If there is a fresh decline, the pair might find bids near 157.60. The next major support could be near 157.25. The main support might be 156.40. A downside break and close below 156.40 might send the pair toward 155.85. Any more losses could open the doors for a test of 155.25.
Looking at EUR/USD, the pair seems to be facing resistance near 1.1565 and might start a downside correction.
Upcoming Key Economic Events:
- US nonfarm payrolls for July 2026 – Forecast 80K, versus 57K previous.
- US Unemployment Rate for July 2026 - Forecast 4.2%, versus 4.2% previous.
Fed’s Musalem: It’s Okay to Surprise Markets With a Rate Move
St. Louis Fed President Alberto Musalem said he favored raising interest rates by 25bps at last week's FOMC meeting, arguing that acting gradually now would be preferable to risking more aggressive tightening later. Musalem is not a voting member of FOMC this year, so his preference was not among the three formal dissents against the decision to hold rates steady. Speaking in Brazil on Thursday, Musalem said inflation is likely to remain too high relative to Fed's 2% target over coming year if policy stays unchanged. "Earlier gradual incremental interest rate increases are preferable, less disruptive, less costly than potentially later, more abrupt interest rate changes," he said.
Musalem also pushed back against idea that Fed should hesitate simply because financial markets are not positioned for higher rates. While acknowledging that he closely monitors market signals, he said policymakers should follow their economic assessment regardless of prevailing expectations. "If you think that now is the time to change policy in whatever direction, you ought to change that policy, irrespective of what's priced into markets," Musalem said, adding that "there are times or moments when it's okay to surprise the market." His comments are particularly relevant as investors have moved toward pricing a September hold following falling oil prices and optimism over reopening Strait of Hormuz.
Musalem's broader argument was that Fed has little reason to tolerate elevated inflation in hope that stronger productivity eventually resolves price pressures. "It is crucial that monetary policy put a meaningful restraint on underlying inflation, rather than tolerating somewhat higher inflation today to pursue productivity growth tomorrow," he said, warning there is "fertile ground for inflation expectations to potentially become unanchored." With financial conditions supportive, asset prices elevated and labor market characterized by "solid payroll growth," Musalem sees room to tighten policy before inflation becomes harder to contain. His stance therefore adds to hawkish pressure inside Fed just as markets increasingly bet that September will bring another hold.
Key Takeaways
- St. Louis Fed President Alberto Musalem favored a 25bps rate hike at last week's FOMC meeting, arguing current policy may not be restrictive enough to bring inflation sustainably back to 2%.
- Musalem favors earlier, gradual tightening, saying incremental increases now would be "less disruptive" and "less costly" than potentially larger rate moves later.
- He stressed that market pricing should not dictate Fed decisions, saying policymakers should act when warranted "irrespective of what's priced into markets."
- Musalem added that "there are times or moments when it's okay to surprise the market," a notable warning as investors increasingly lean toward a September hold.
- He rejected tolerating above-target inflation in hope that future productivity gains will solve the problem, warning such an approach could put Fed credibility and anchored inflation expectations at risk.
- With economy resilient, financial conditions supportive and labor market stable, Musalem sees room for Fed to focus on inflation rather than wait for clearer economic weakness before tightening.
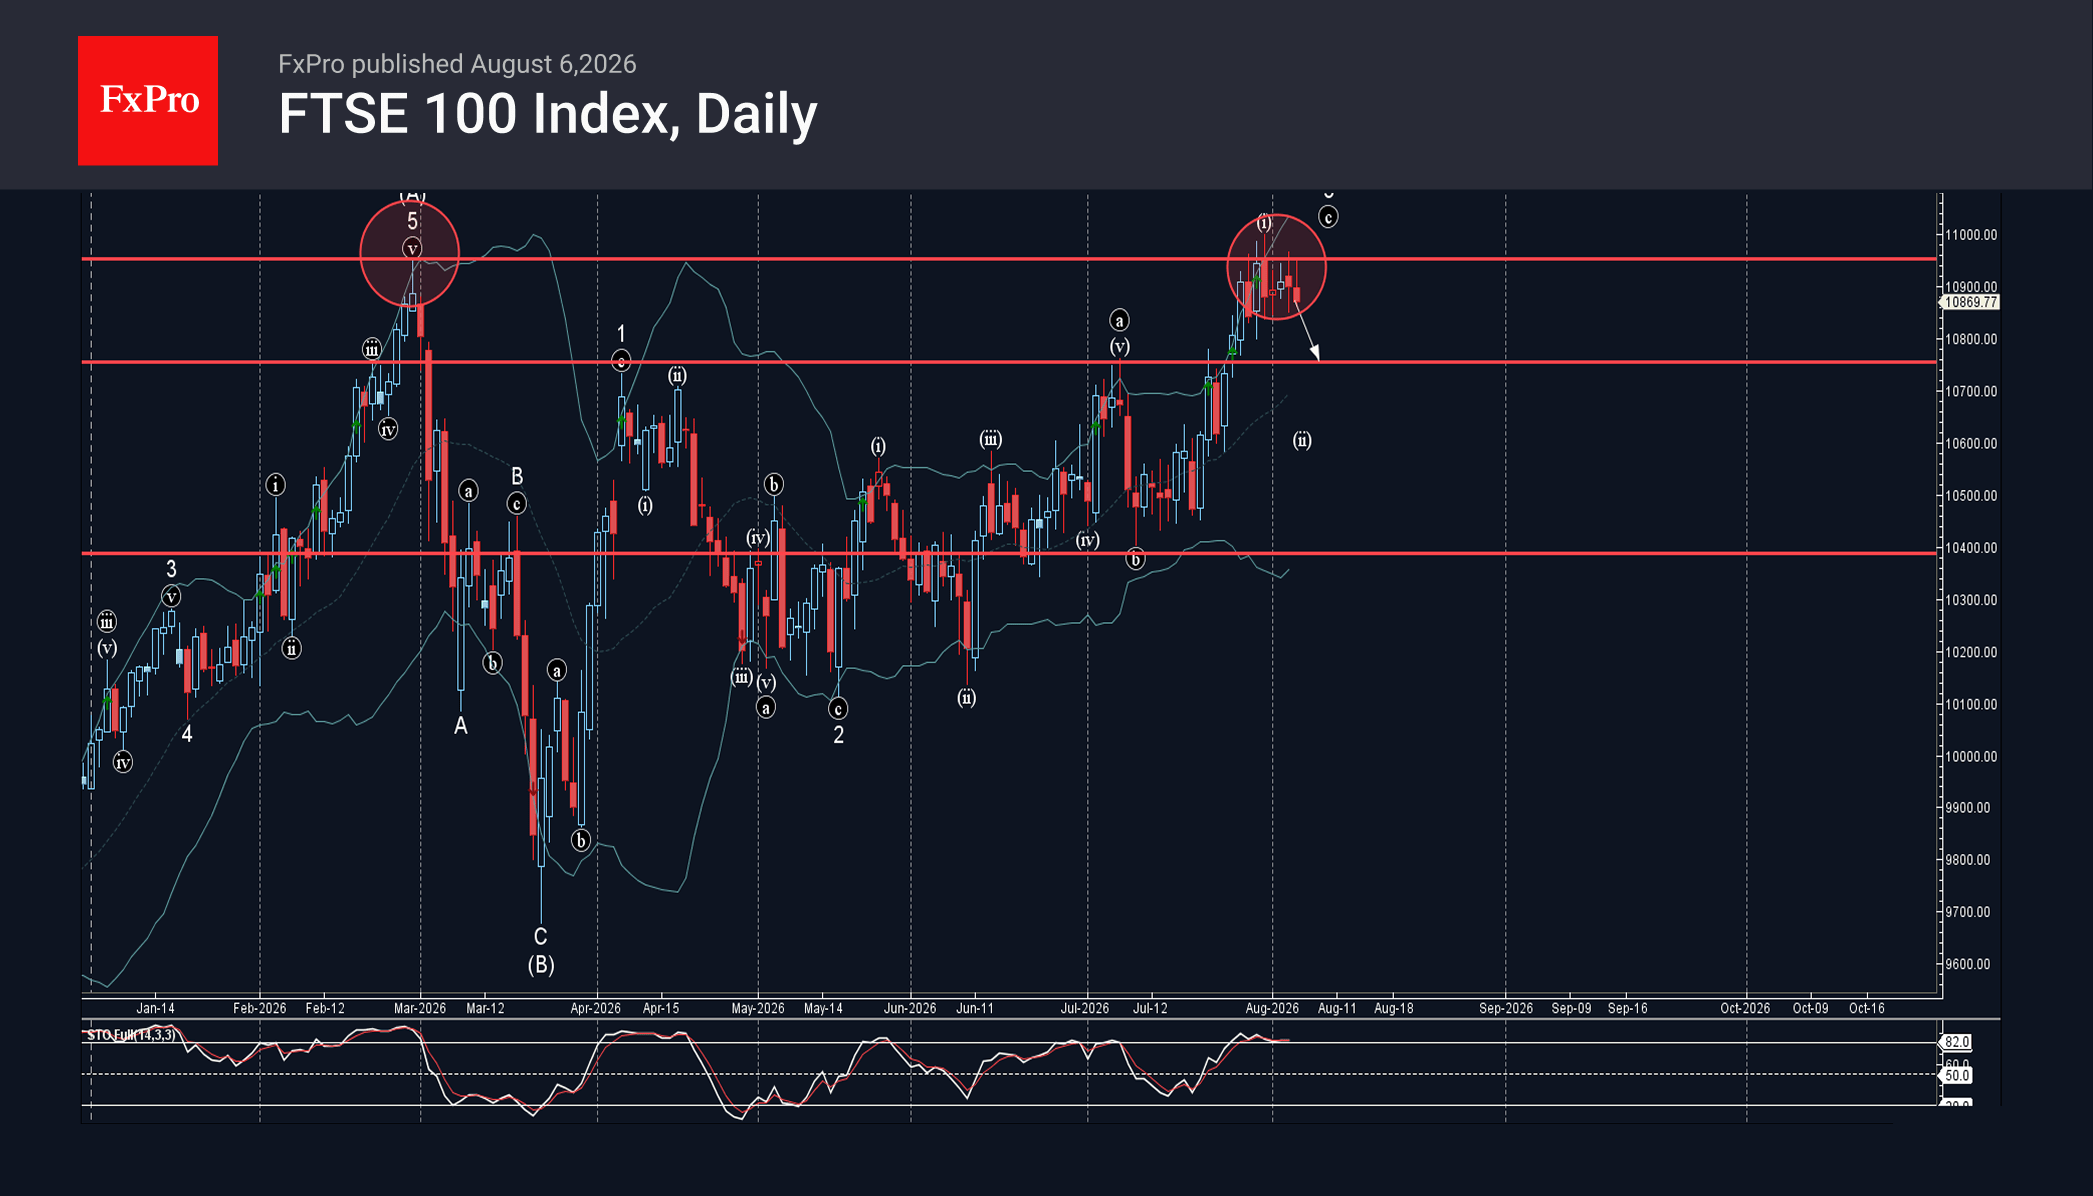
FTSE 100 Index Wave Analysis
FTSE 100 Index: ⬇️ Sell
– FTSE 100 reversed from long-term resistance level 10950.00
– Likely to fall to support level 10750.00
FTSE 100 Index recently reversed from the resistance zone between the long-term resistance level 10950.00 (which stopped the sharp uptrend in February) and the upper daily Bollinger Band.
The downward reversal from this resistance zone stopped the earlier short-term impulse wave c from the start of July.
Given the strength of the resistance level 10950.00 and the overbought daily Stochastic, FTSE 100 Index can be expected to fall further to the next support level 10750.00 (former resistance from April).
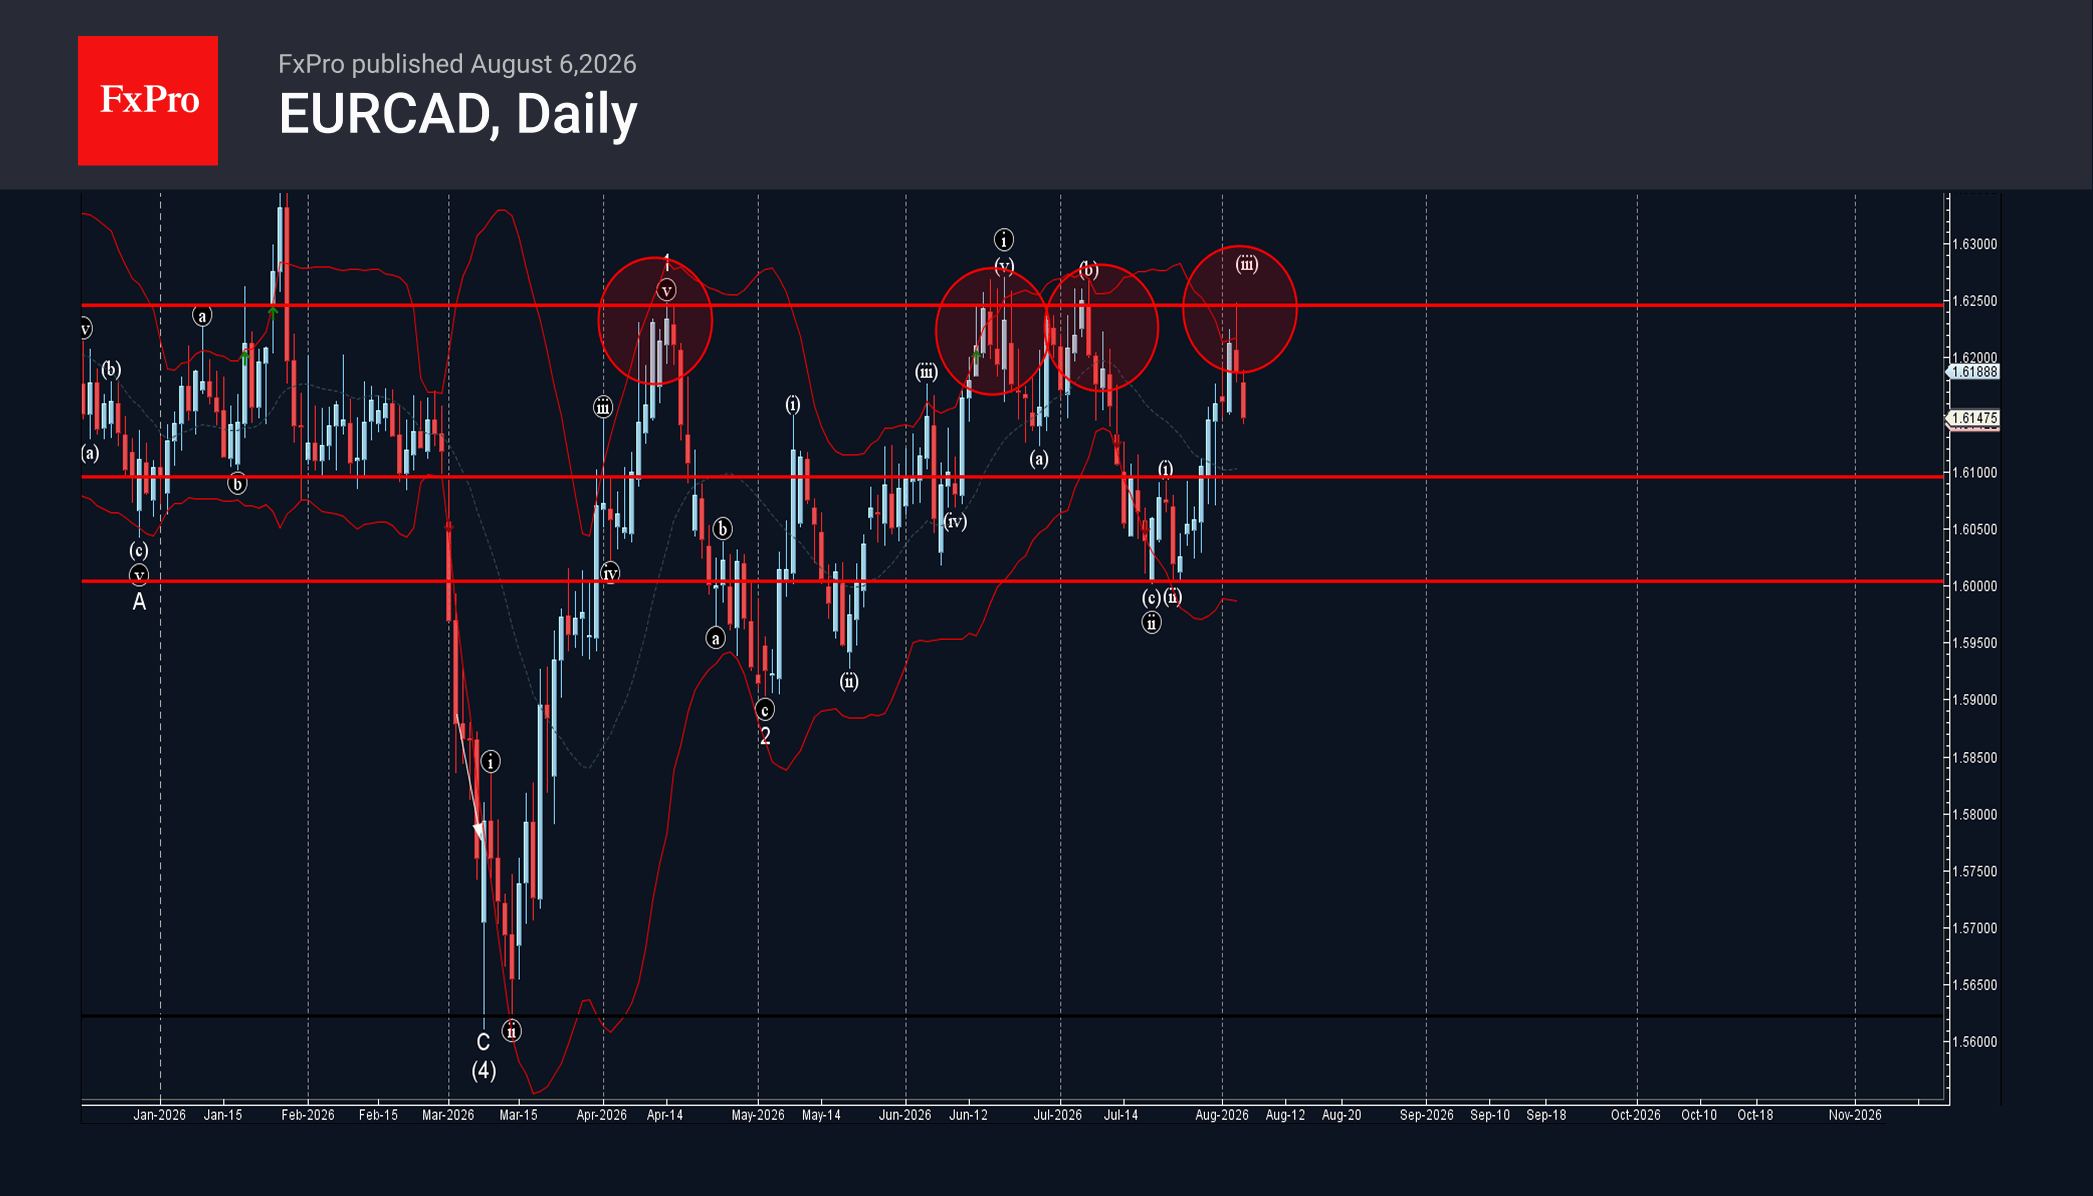
EURCAD Wave Analysis
EURCAD: ⬇️ Sell
– EURCAD reversed from resistance zone
– Likely to fall to support level 1.6100
EURCAD currency pair recently reversed from the resistance zone between the long-term resistance level 1.6250 (which has been reversing the price from April) and the upper daily Bollinger Band.
The downward reversal from this resistance zone stopped the earlier short-term impulse wave iii from the middle of July.
Given the strength of the resistance level 1.6250 and the bullish Canadian dollar sentiment seen today, EURCAD currency pair can be expected to fall further to the next support level 1.6100.
Eco Data 8/7/26
| GMT | Ccy | Events | Act | Cons | Prev | Rev |
|---|---|---|---|---|---|---|
| 23:30 | JPY | Overall Household Spending Y/Y Jun | -3.30% | 0.90% | -0.40% | |
| 03:00 | CNY | Trade Balance (USD) Jul | 112.5B | 107B | 125.6B | |
| 05:00 | JPY | Leading Economic Index Jun P | 116.4 | 116.5 | 116.5 | |
| 06:00 | EUR | Germany Industrial Production M/M Jun | 0.20% | 0.00% | 0.90% | 0.70% |
| 06:00 | EUR | Germany Trade Balance (EUR) Jun | 15.4B | 16.7B | 19.1B | |
| 07:00 | CHF | Foreign Currency Reserves (CHF) Jul | 768B | 759B | ||
| 07:00 | CHF | SECO Consumer Climate (3m) Q3 | -35 | -35 | -40 | |
| 12:30 | CAD | Net Change in Employment Jul | 75.1K | 17.8K | 18.2K | |
| 12:30 | CAD | Unemployment Rate Jul | 6.40% | 6.50% | 6.50% | |
| 12:30 | USD | Nonfarm Payrolls Jul | -23K | 85K | 57K | 20K |
| 12:30 | USD | Unemployment Rate Jul | 4.10% | 4.20% | 4.20% | |
| 12:30 | USD | Average Hourly Earnings M/M Jul | 0.10% | 0.30% | 0.30% | |
| 14:00 | CAD | Ivey PMI Jul | 55 | 55.4 | 56.2 |
| 23:30 | JPY |
| Overall Household Spending Y/Y Jun | |
| Actual | -3.30% |
| Consensus | 0.90% |
| Previous | -0.40% |
| 03:00 | CNY |
| Trade Balance (USD) Jul | |
| Actual | 112.5B |
| Consensus | 107B |
| Previous | 125.6B |
| 05:00 | JPY |
| Leading Economic Index Jun P | |
| Actual | 116.4 |
| Consensus | 116.5 |
| Previous | 116.5 |
| 06:00 | EUR |
| Germany Industrial Production M/M Jun | |
| Actual | 0.20% |
| Consensus | 0.00% |
| Previous | 0.90% |
| Revised | 0.70% |
| 06:00 | EUR |
| Germany Trade Balance (EUR) Jun | |
| Actual | 15.4B |
| Consensus | 16.7B |
| Previous | 19.1B |
| 07:00 | CHF |
| Foreign Currency Reserves (CHF) Jul | |
| Actual | 768B |
| Consensus | |
| Previous | 759B |
| 07:00 | CHF |
| SECO Consumer Climate (3m) Q3 | |
| Actual | -35 |
| Consensus | -35 |
| Previous | -40 |
| 12:30 | CAD |
| Net Change in Employment Jul | |
| Actual | 75.1K |
| Consensus | 17.8K |
| Previous | 18.2K |
| 12:30 | CAD |
| Unemployment Rate Jul | |
| Actual | 6.40% |
| Consensus | 6.50% |
| Previous | 6.50% |
| 12:30 | USD |
| Nonfarm Payrolls Jul | |
| Actual | -23K |
| Consensus | 85K |
| Previous | 57K |
| Revised | 20K |
| 12:30 | USD |
| Unemployment Rate Jul | |
| Actual | 4.10% |
| Consensus | 4.20% |
| Previous | 4.20% |
| 12:30 | USD |
| Average Hourly Earnings M/M Jul | |
| Actual | 0.10% |
| Consensus | 0.30% |
| Previous | 0.30% |
| 14:00 | CAD |
| Ivey PMI Jul | |
| Actual | 55 |
| Consensus | 55.4 |
| Previous | 56.2 |