Sample Category Title
EUR/CHF Daily Outlook
Daily Pivots: (S1) 1.0805; (P) 1.0834; (R1) 1.0849; More....
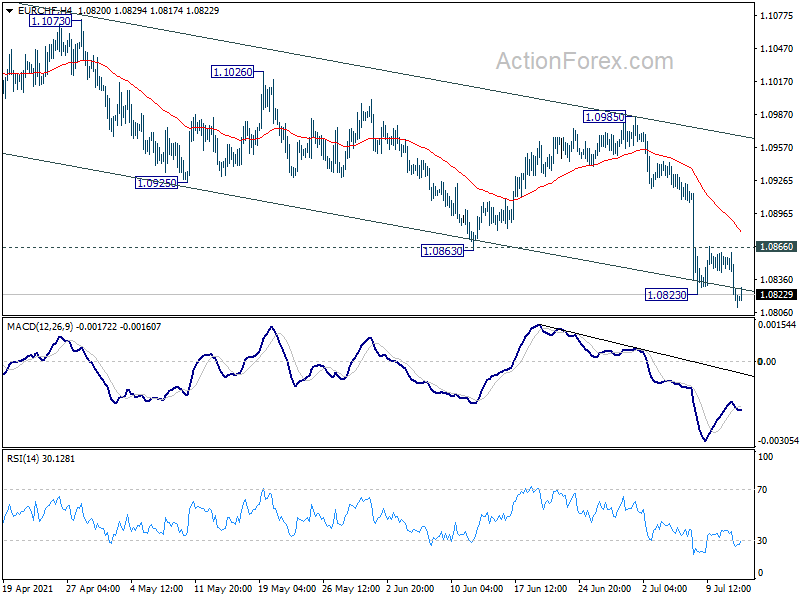
Intraday bias in EUR/CHF is back on the downside with break of 1.0823 support. Fall from 1.1149 is resuming and should target 1.0737 cluster support next. On the upside, above 1.0866 minor resistance will turn intraday bias neutral first. But outlook will stay bearish as long as 1.0985 resistance holds, in case of recovery.
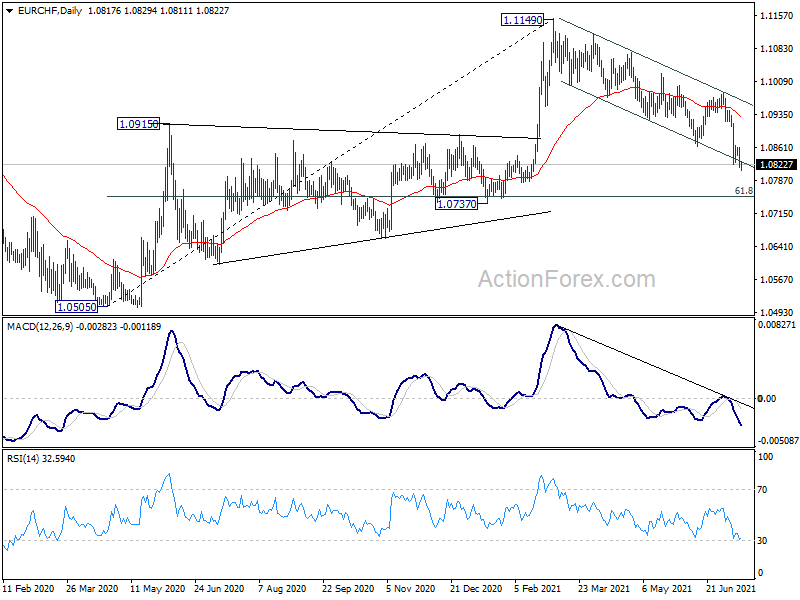
In the bigger picture, current development argues that rebound from 1.0505 (2020 low) might be completed with three waves up to 1.1149 already. Sustained trading below 55 week EMA (now at 1.0885) will affirm this bearish case. Further break of 1.0737 cluster support (61.8% retracement of 1.0505 to 1.1149 at 1.0751) will bring retest of 1.0505 low.
Dollar Doesn’t Dare To Breakthrough Without A Signal From Fed
Inflation in the US continues to go off the charts. Such a sharp rise reinforces the importance of action by the Fed and other policymakers, causing markets to wait tensely for their comments and hints of further moves.
The market's initial reaction to the 5.4% US inflation rate at the end of July pointed to a wait-and-see attitude. The dollar index approached the resistance line of the trading range, however, it lacked the momentum to develop growth. Today the DXY is retreating from this month's highs area at 92.8, and EURUSD is trying to get back above 1.1800.
Another indicator for market sentiment, the USDCNH, shows a subdued momentum after the renminbi rallied slightly at the end of last week.
The same is true for the stock market. The major US indices rewrote their all-time highs and retreated slightly from their peaks late in the day, maintaining a sluggish downtrend on Wednesday morning.
The very fact of the dollar strengthening and stocks weakening at the close of the US session suggests that fund managers are banking on the Fed's increasingly hawkish rhetoric in response to an uptick in inflation.
This reaction is embedded in the reflexes of central bankers, but markets are quite sensibly pausing to clarify their position. There are reasons for this.
Since the global financial crisis, there has been chronically low inflation in the USA and several developed countries. It has become an obstacle for policy normalisation and was considered the norm even for periods of strong economic growth. This trend has recently been repeatedly referred to as the new normal, and so far, central banks are putting this scenario in their forecasts.
The second reason is the reaction of the debt markets. High inflation rates go hand in hand with falling long-term bond yields which contrast with the dynamics at the start of the year. At that time, rising inflation fears drove 10-year yields to a two year high. The debt market thus shows that long-term inflation expectations are under control as desired by the Fed.
There is still no significant pressure on the Fed to roll back stimulus despite the jump in inflation for the reasons stated above. For now, we still expect to hear official signals of an imminent QE rollback at the end of July or at the Jackson Hole symposium at the end of August. The surprise for us will be a dramatic tightening of the tone of the US central bank or Powell at a congressional hearing today or later in the week. This would then provide the necessary impetus to break the established trend and start a dollar rally.
USD/CAD Two Scenarios Likely
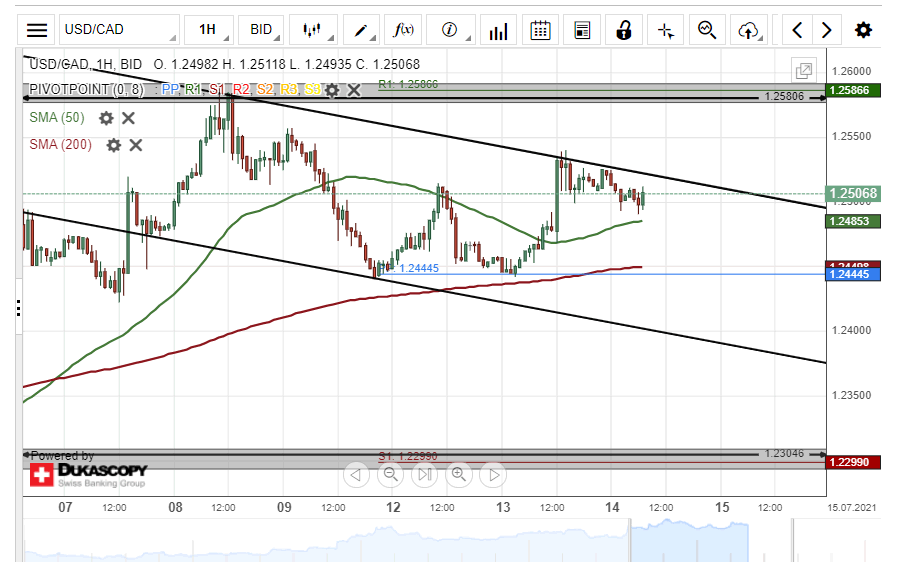
On Tuesday, the US Dollar edged higher by 90 pips or 0.74% against the Canadian Dollar. The currency pair tested the upper line of a descending channel pattern during yesterday's trading session.
Technical indicators suggest buying signals on the 4H and daily time-frame charts. Most likely, buyers could pressure the exchange rate higher during the following trading session.
However, the upper boundary of the channel pattern could provide resistance for the USD/CAD currency exchange rate in the shorter term.
GBP/JPY Breakout Could Occur
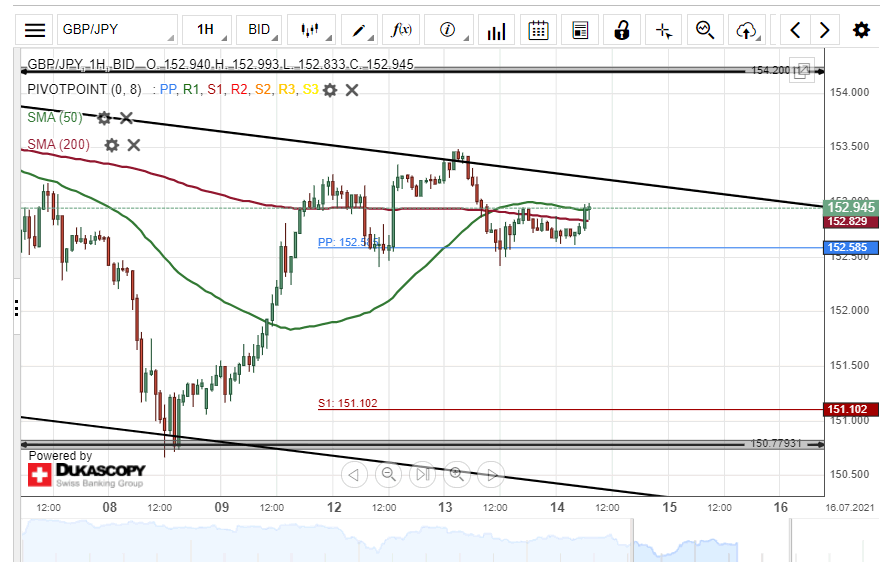
The GBP/JPY currency pair reversed from the upper end of a descending channel pattern at 153.50 on Tuesday. As a result, the Pound Sterling fell by 94 pips or 0.61% against the Japanese Yen during yesterday's trading session.
All things being equal, the exchange rate could continue to edge lower in a descending channel pattern during the following trading session.
However, given that the currency exchange rate is currently trading near the upper boundary of the channel pattern at 152.82, a breakout could occur within the following trading session.
AUD/USD Bearish Bias
On Tuesday, the Australian Dollar declined by 65 pips or 0.87% against the US Dollar. The currency pair was pressured lower by the 50– and 200– hour SMAs during Tuesday's trading session.
Technical indicators flash bearish signals on the 4H and daily time-frame charts. Most likely, the exchange rate could continue to edge lower during the following trading session.
However, the weekly support level at 0.7400 could provide support for the AUD/USD currency exchange rate within this session.
EUR/JPY Trades Go Short
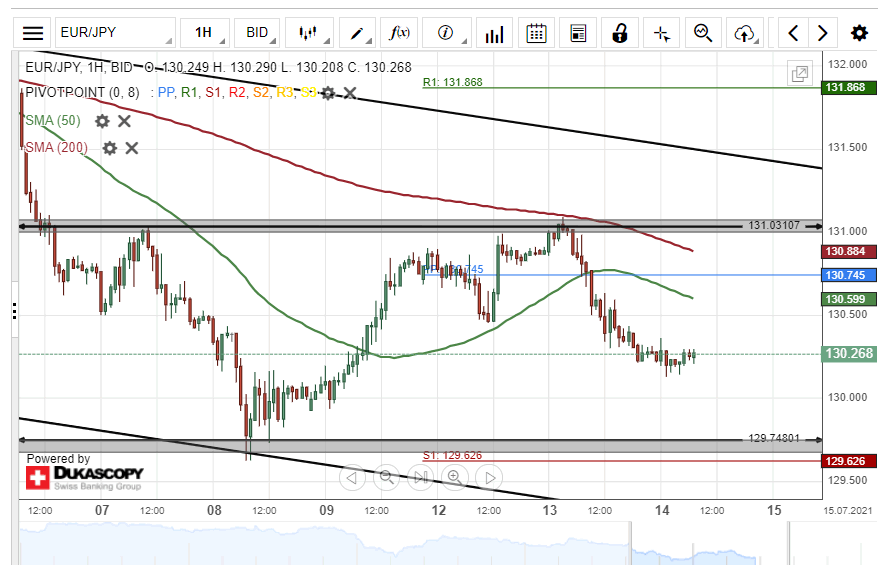
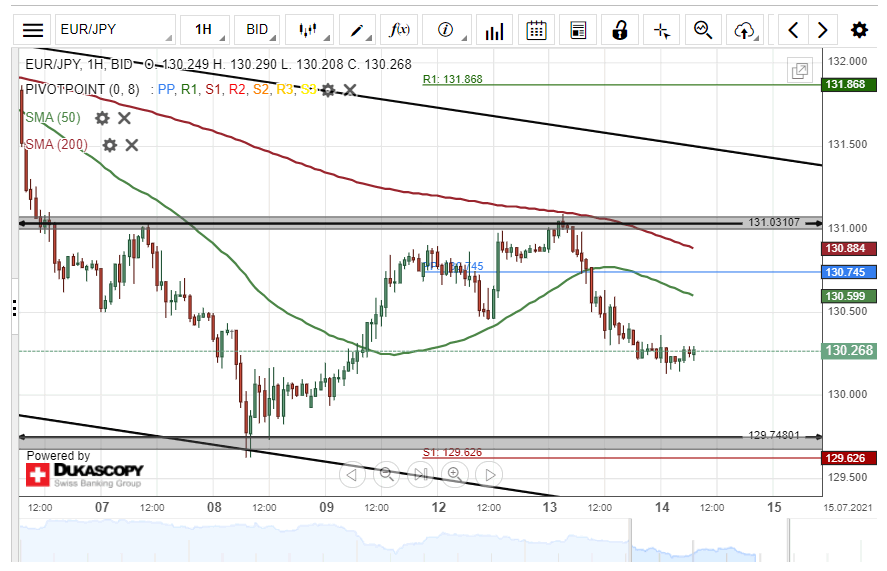
The 200– hour simple moving average provided resistance for the EUR/JPY currency pair on Tuesday. As a result, the Eurozone single currency declined by 85 pips or 0.65% against the Japanese Yen.
Technical indicators suggest selling signals on the 4H and daily time-frame charts. The exchange rate is likely to continue to decline in a descending channel pattern during the following trading session.
However, the EUR/JPY currency exchange rate might reverse from a support level formed by the weekly S1 at 129.62 within Wednesday's trading session.
Daily Tecnical Analysis
EUR/USD
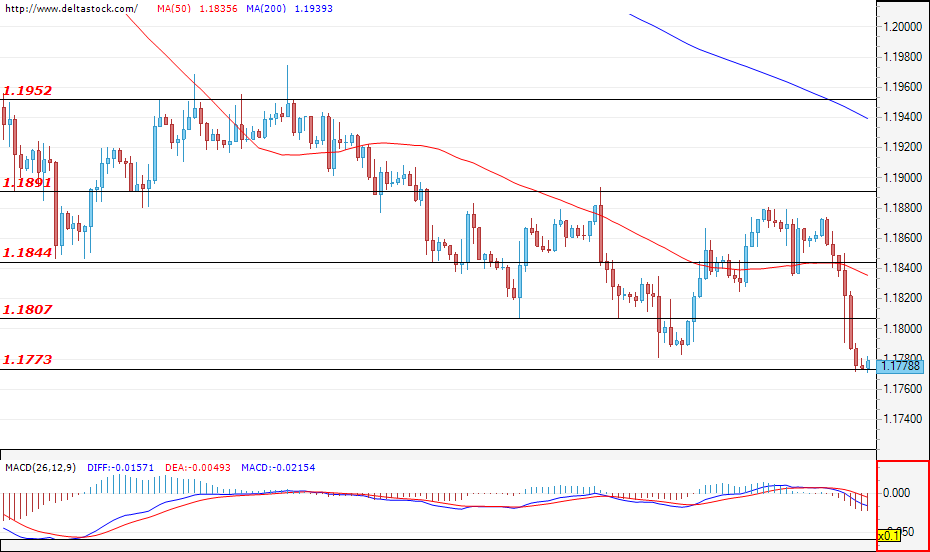
Current level - 1.1778
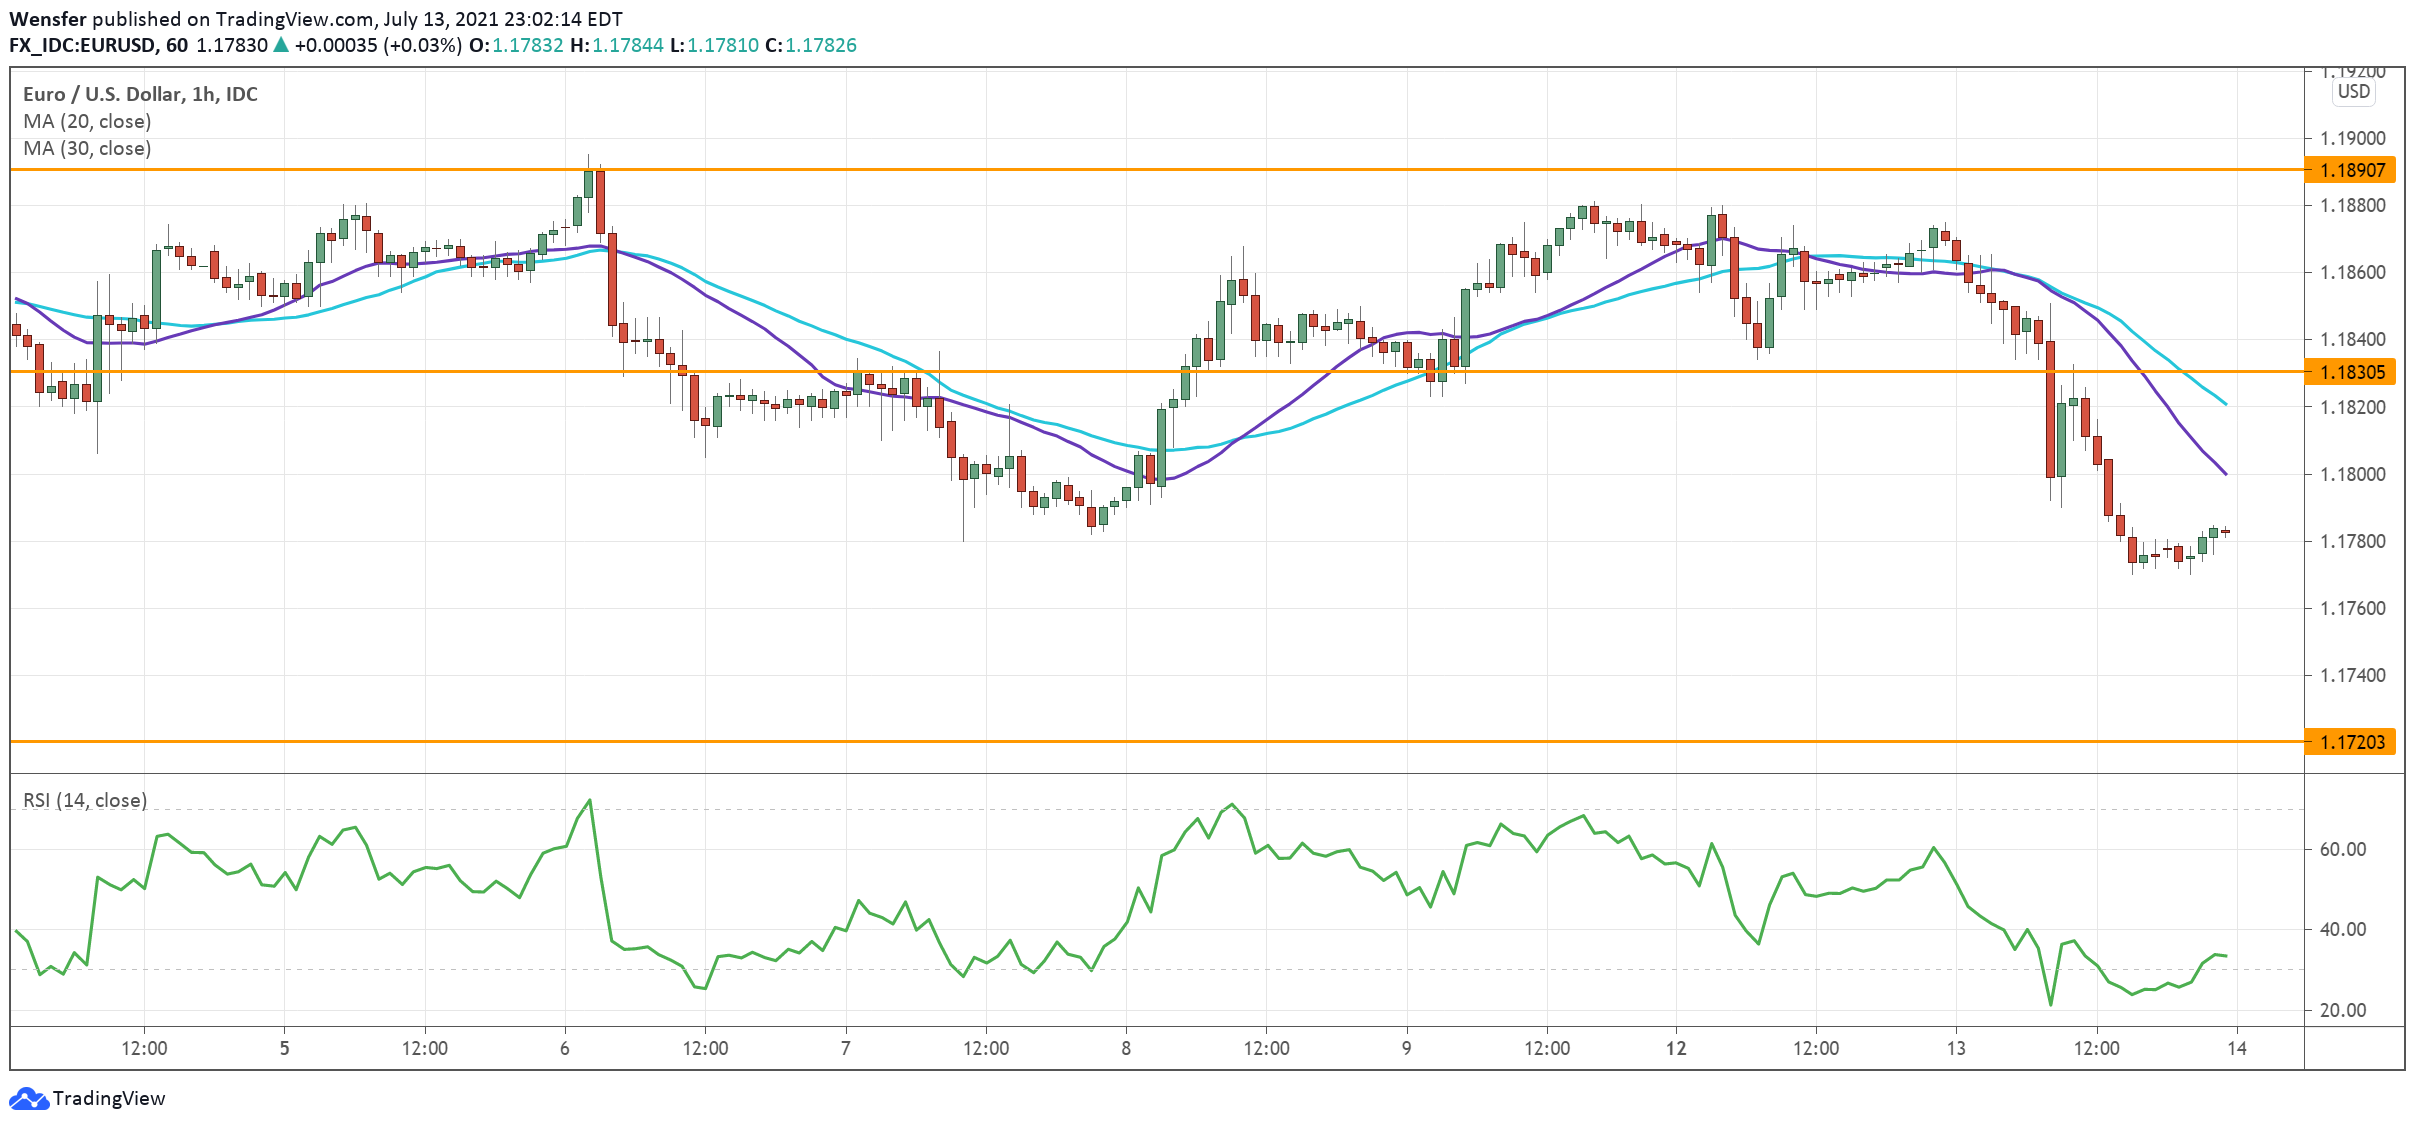
Yesterday, the greenback gained quite a bit of ground against the euro as a result of the unexpectedly high inflation readings in the U.S which fueled the speculation for a Fed rate hike. As a result, the currency pair managed to breach the support zone at 1.1807. The sell-off was limited to the level of 1.1773, but if the bearish attack continues and the mentioned zone is successfully breached, the result will most likely be a deeper sell-off towards the lows from March at around 1.1717. The first target for the bulls is the level of 1.1807, which is now acting as a resistance, but only breach of the next zone at 1.1891 will signal a change in the current sentiment of the market participants. The data for the U.S. producer price index will be released at 12:30 GMT and we could see sharp moves if it rises with more than what the market expects.
| Resistance | Support | ||
| intraday | intraweek | intraday | intraweek |
| 1.1807 | 1.1891 | 1.1750 | 1.1700 |
| 1.1844 | 1.1950 | 1.1717 | 1.1630 |
USD/JPY
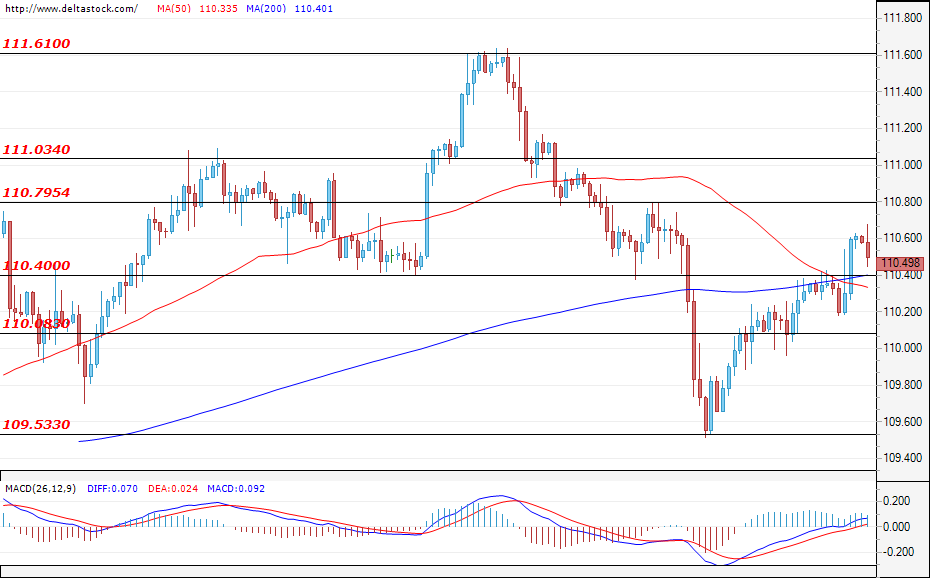
Current level - 110.49
The bulls remain in control and the USD/JPY successfully breached the resistance level at 110.40. At the time of writing the analysis, the most probable scenario is for the recovery to continue and for the pair to test the next target at 110.79. A breach of the zone at 111.03 would strengthen the positive expectations for the future path of the USD/JPY and would help the Ninja reach the local high at 111.61. If the bears prevail and the pair starts falling again, the major support can be found at the level of 110.08, followed by the lower zone at 109.53.
| Resistance | Support | ||
| intraday | intraweek | intraday | intraweek |
| 110.79 | 111.03 | 110.40 | 109.53 |
| 111.03 | 111.61 | 110.08 | 109.00 |
GBP/USD
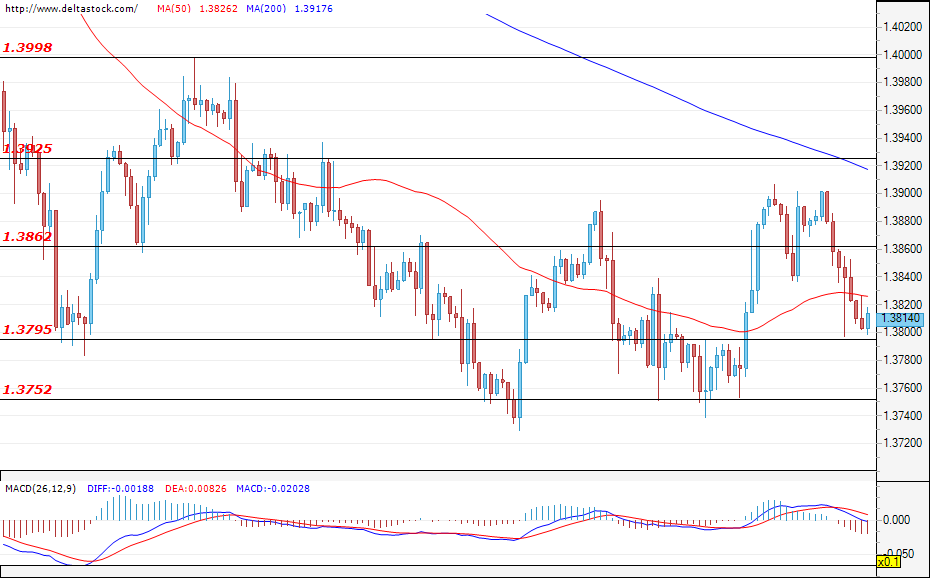
Current level - 1.3814
The bears prevailed and the Cable did not manage to remain above the support level of 1.3862. The mentioned level was violated as the dollar gained strength across the board thanks to the Fed rate hike speculations. During the early hours of today`s trading, the currency pair is hovering close to the support zone at 1.3795 and another test is highly probable. If the bears successfully violate it, the sell-off will most likely deepen towards the local low at 1.3752. If the bulls re-enter the market, they could head the pair towards a test of the level at 1.3862, but only a successful breach of 1.4000 would help strengthen the positive expectations for the future path of the GBP/USD.
| Resistance | Support | ||
| intraday | intraweek | intraday | intraweek |
| 1.3862 | 1.4000 | 1.3795 | 1.3750 |
| 1.3925 | 1.4118 | 1.3750 | 1.3610 |
UKOIL Tests Key Supply Zone
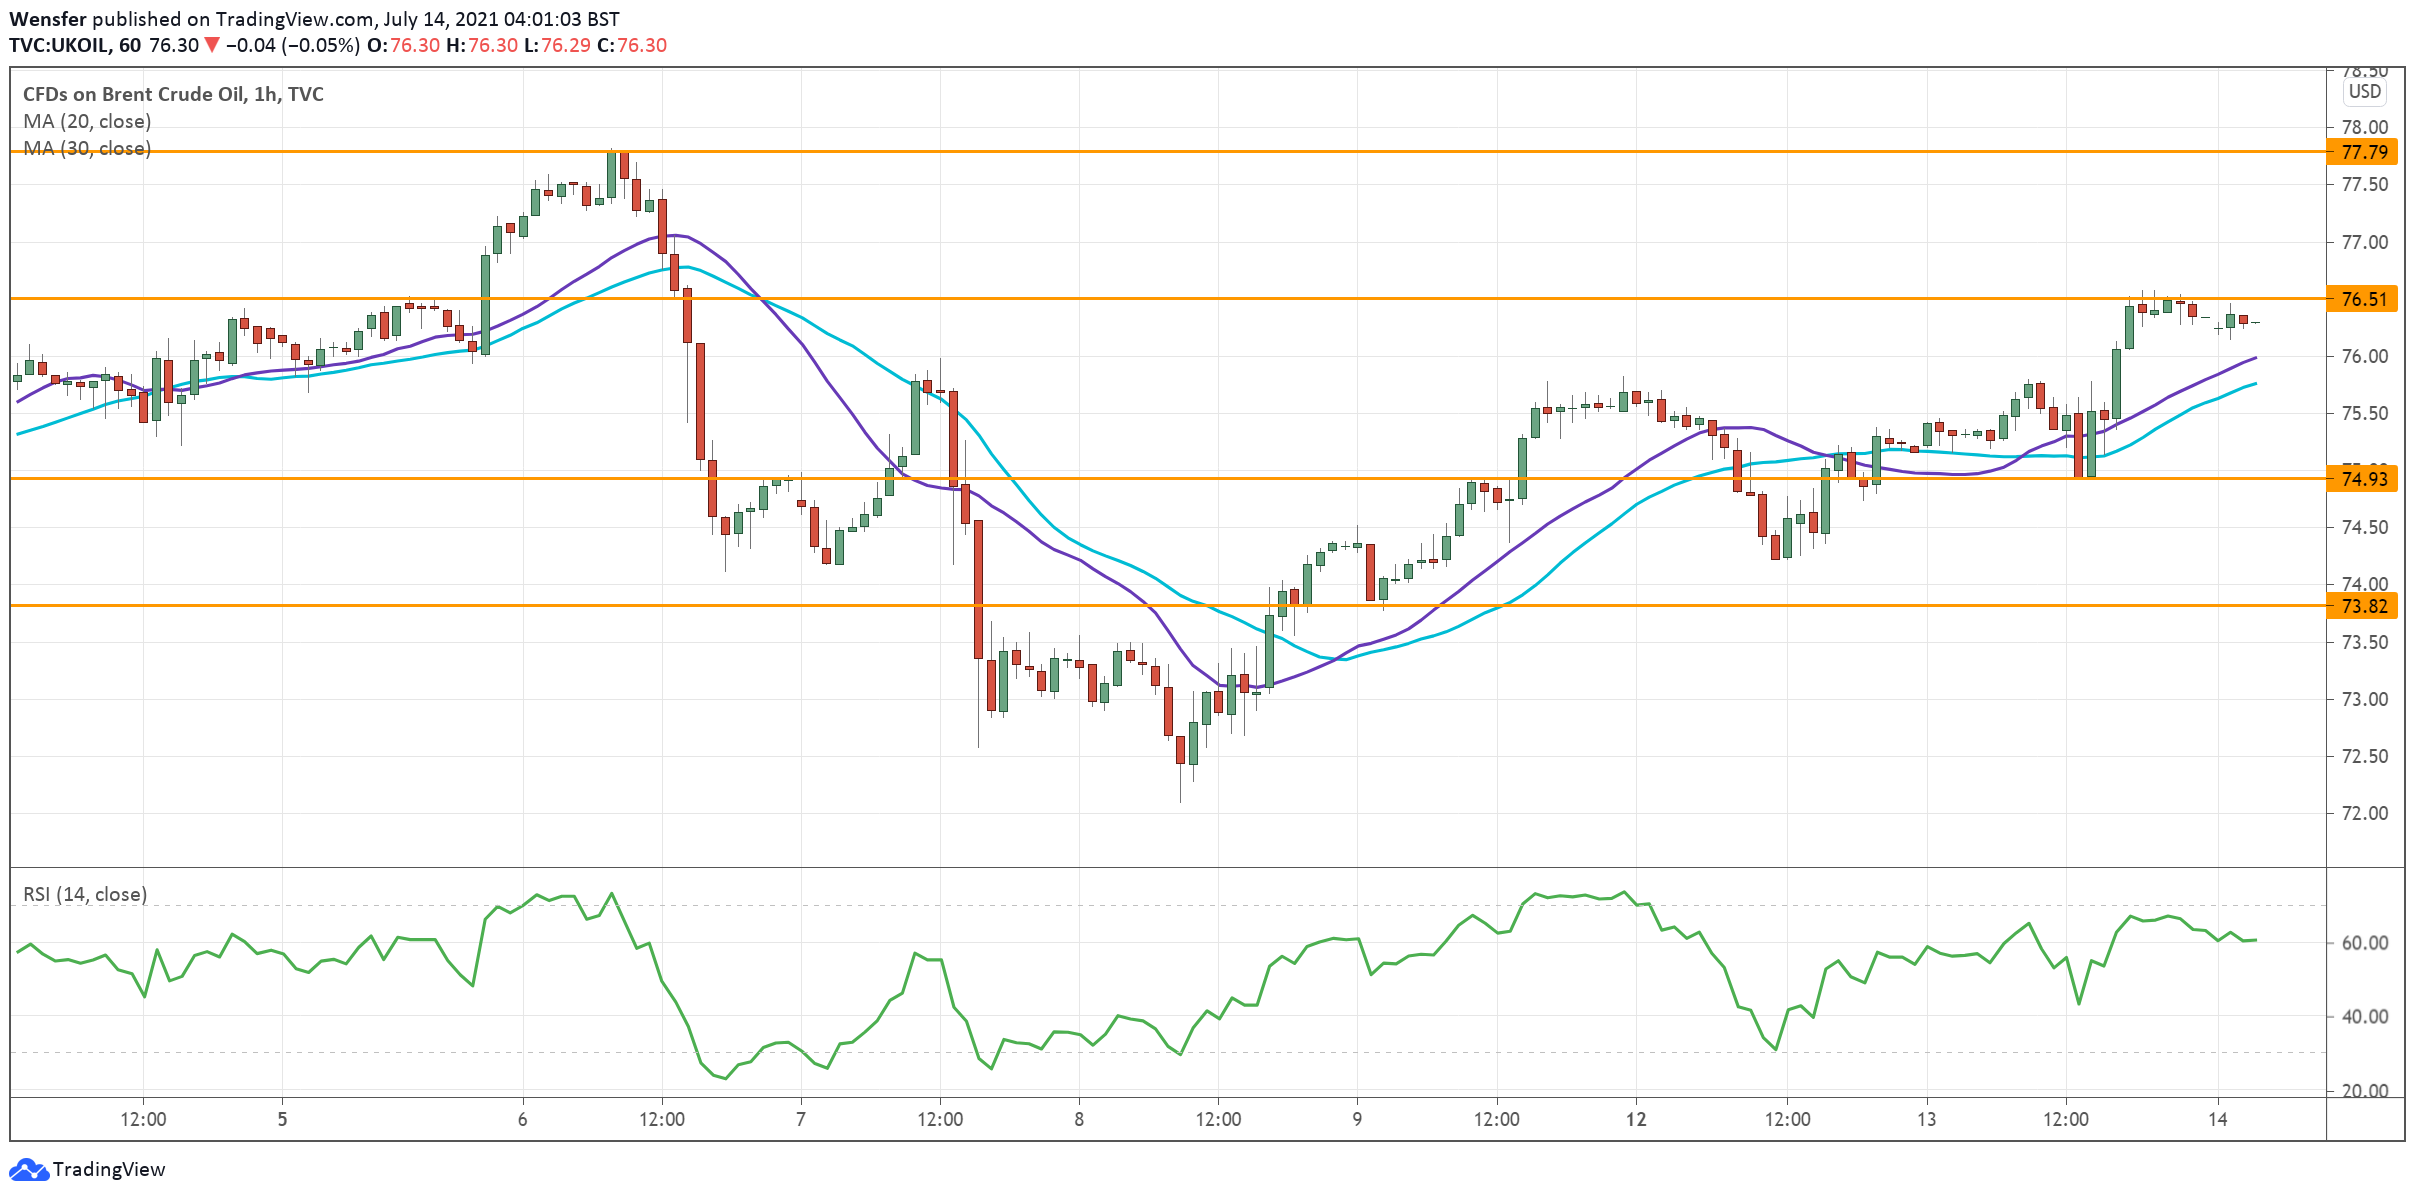
Brent crude rallies back on expectations of falling global inventories.
The previous sell-off has found support on the 30-day moving average (73.00). The recovery is making an attempt at 76.50, former support that has turned into a supply zone.
A bullish breakout would signal that the bulls are back in the game. Then lifting the peak at 77.80 to resume the uptrend would be a formality.
In the meantime, a near-overbought RSI may cause some choppiness, and 74.90 would be the first support in case of a pullback.
USD/JPY Confirms Bullish MA Cross
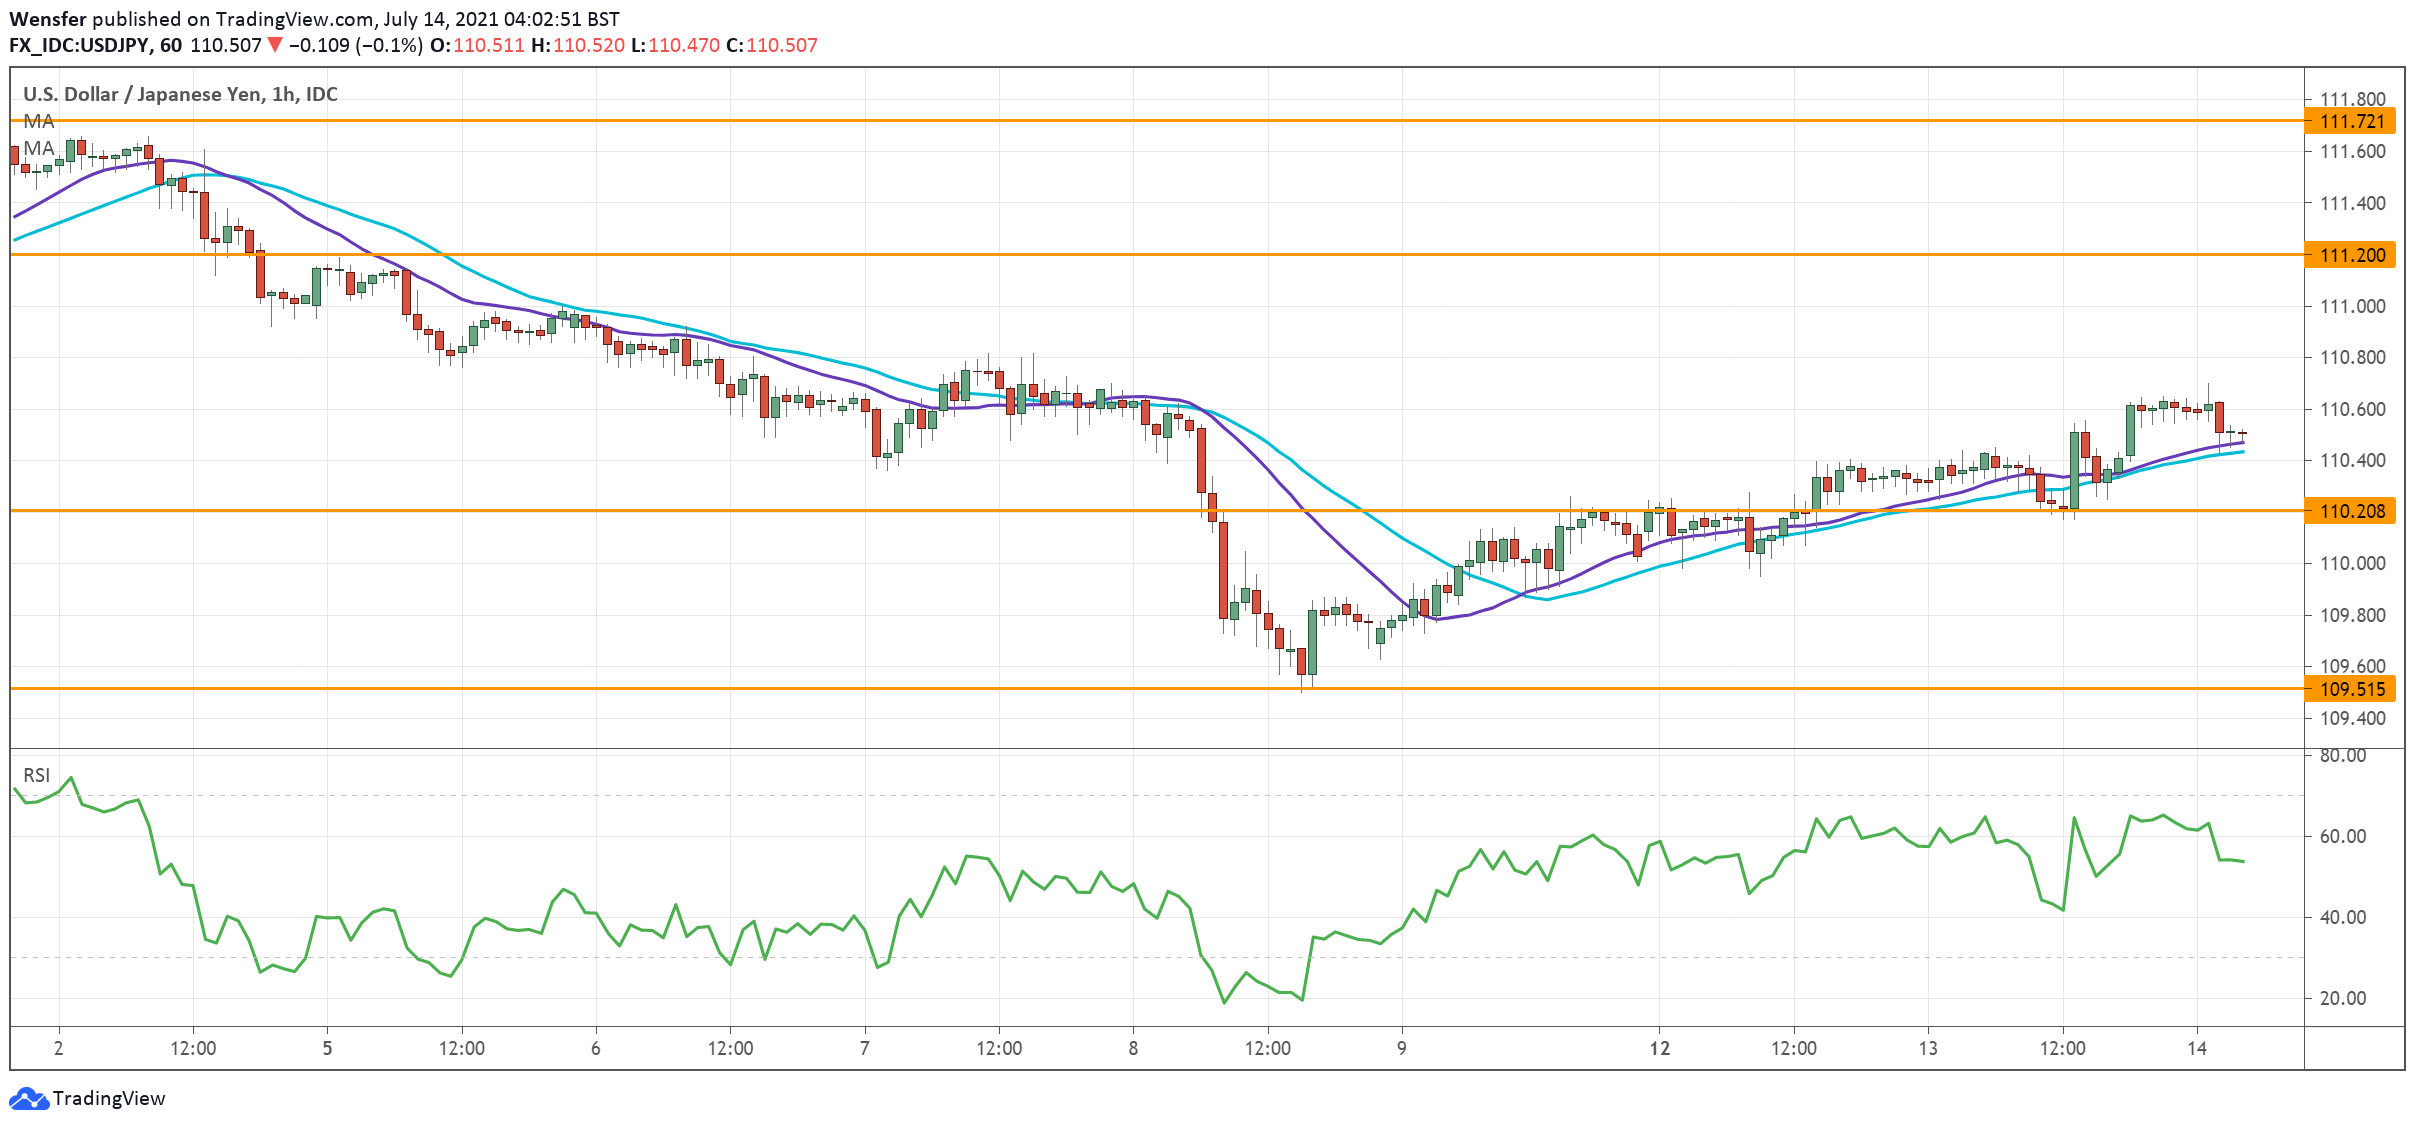
The US dollar continues to bounce back on solid inflation data. The pair saw strong buying interest at the demand zone near 109.50.
The breakout above the resistance at 110.60 confirms the bullish MA cross and overturns the bearish mood. Momentum may rise as sellers would rush to cover their bets.
111.20 would be the next target as the reversal gains traction. A retreating RSI in the neutral zone may allow buyers to build positions. 110.20 has established itself as the closest support.
EUR/USD Tumbles Through Supports
The US dollar advanced as the US June CPI data beat expectations.
The pair has met stiff selling pressure in the supply zone around 1.1890 once again. Sentiment towards the euro is downbeat as long as it remains under the daily resistance at 1.1970.
The bears have seen recent rebounds as opportunities to sell into strength.
Below 1.1780 sellers have gained conviction and may push towards 1.1720 even though short-term traders may lift their feet off the pedal as the RSI goes oversold. A rebound is likely to be capped by 1.1830.