Sample Category Title
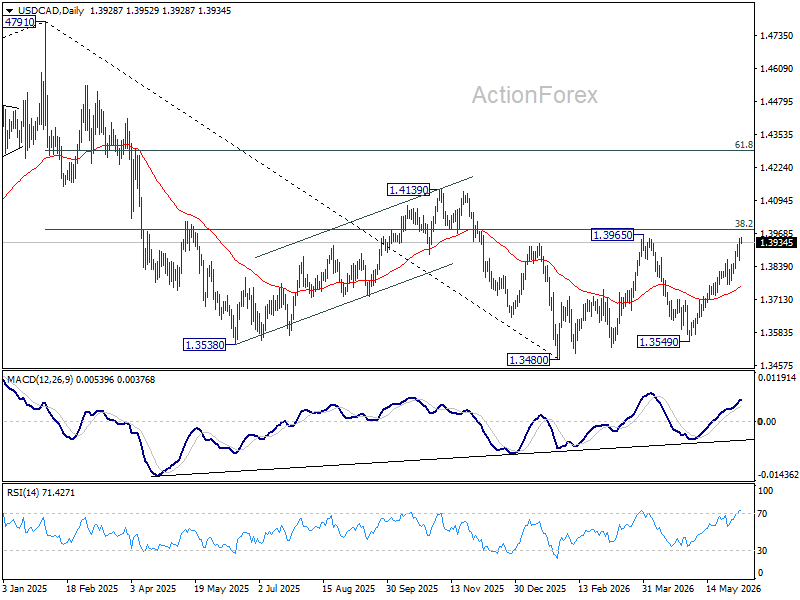
USD/CAD Daily Outlook
Intraday bias in USD/CAD remains on on the upside. Rise from 1.3549 should target 38.2% retracement of 1.4791 to 1.3480 at 1.3981. Decisive break there will carry larger bullish implications and target 61.8% retracement at 1.4290 next. On the downside, below 1.3865 minor support will turn intraday bias neutral first.
In the bigger picture, price actions from 1.4791 are seen as a corrective pattern to the whole up trend from 1.2005 (2021 low). Rejection by 38.2% retracement of 1.4791 to 1.3480 at 1.3981 will keep the decline intact, and bring another fall through 1.3480 at a later stage. However, firm break of 1.3981 will argue that the decline has completed, and set up further rise back to retest 1.4791 instead.
GBP/JPY Daily Outlook
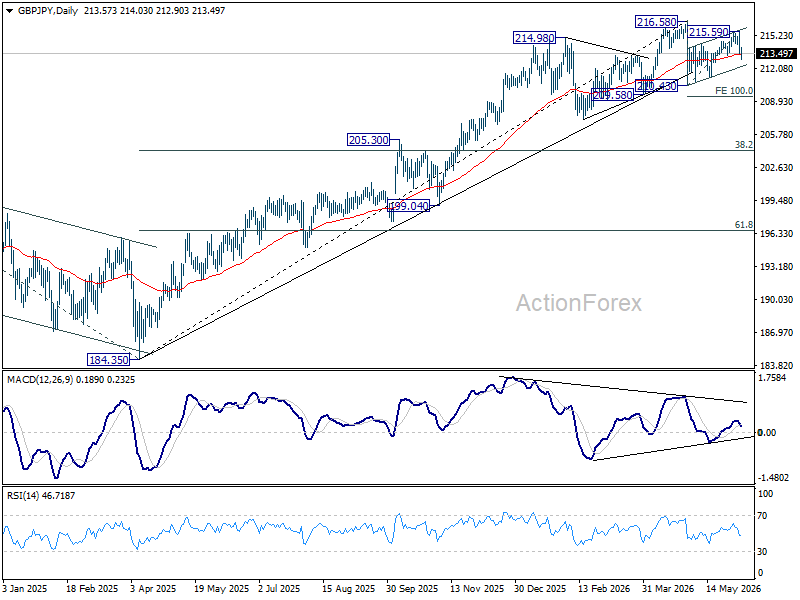
GBP/JPY's break of 213.29 support suggests that rebound from 210.43 has completed with three waves up to 215.50. Fall from there is seen as the third leg of the pattern from 216.58. Intraday bias is back on the downside for 210.43/211.23 support zone. For now, risk will be mildly on the downside as long as 215.59 holds, in case of recovery.
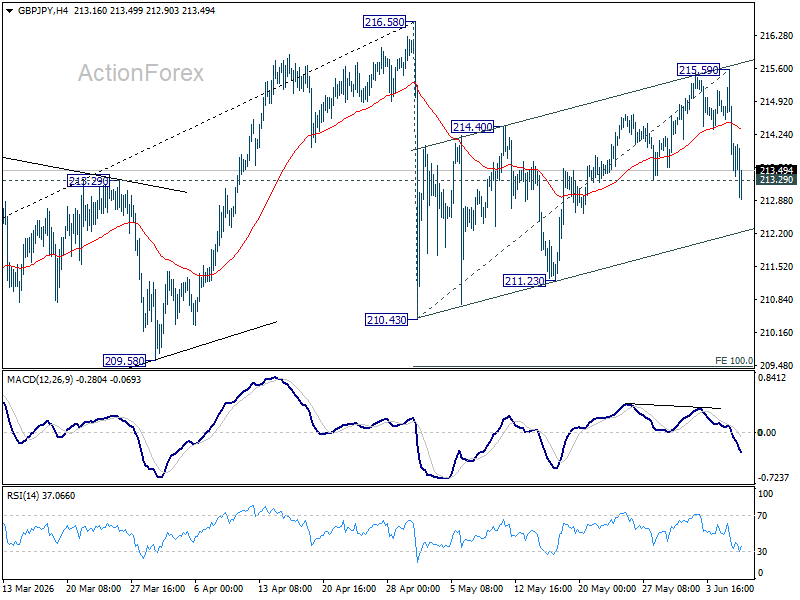
In the bigger picture, there is no clear sign of trend reversal yet. The long term up trend could still extend to 61.8% projection of 148.93 (2022 low) to 208.09 (2024 high) from 184.35 at 220.90 on resumption. However, sustained break of 55 W EMA (now at 206.77) will argue that it's already in medium term down trend for 184.35 support.
EUR/JPY Daily Outlook
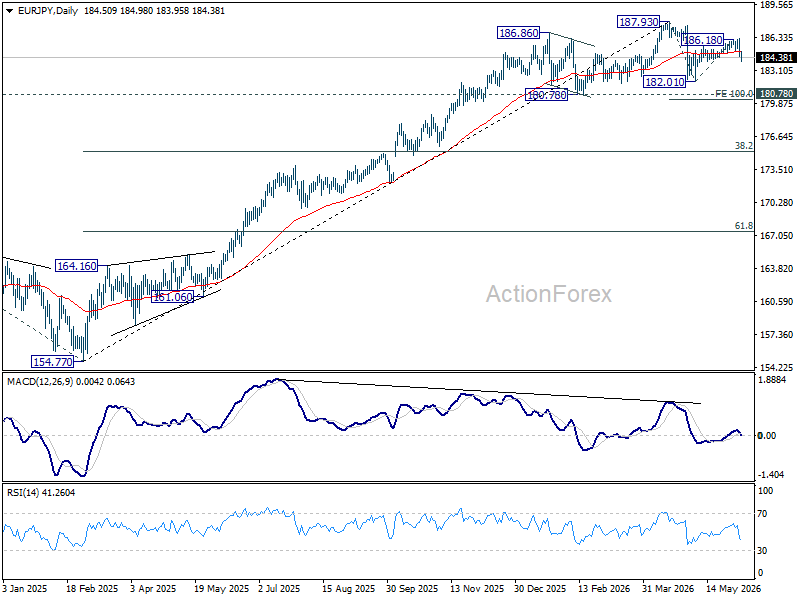
EUR/JPY's break of 184.42 support suggests that rebound from 182.01 has completed with three waves up to 186.18. Fall from there is seen as the third leg of the pattern from 187.93. Intraday bias is back on the downside for 182.01 support next. For now, risk will stay on the downside as long as 186.18 holds, in case of recovery.
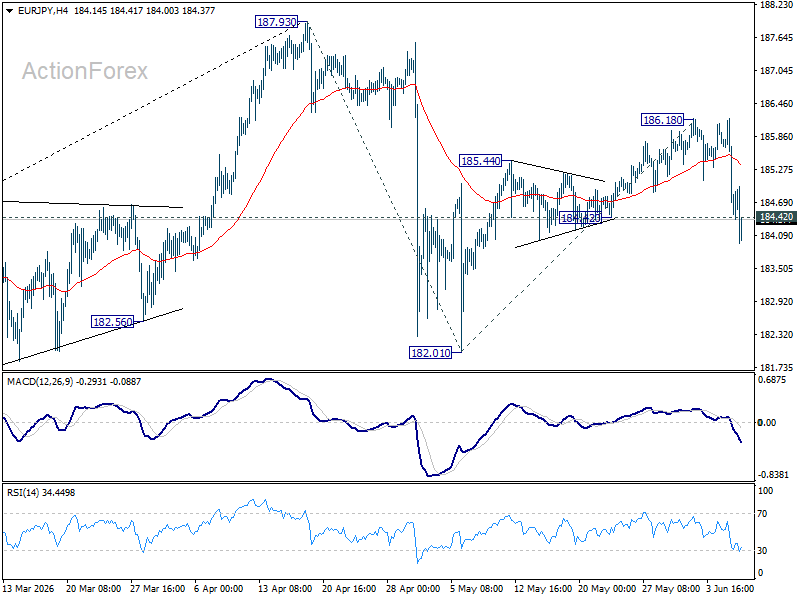
In the bigger picture, there is no sign of reversal yet. Uptrend from 114.42 (2020 low) is still expected to resume at a later stage to 78.6% projection of 124.37 (2022 low) to 175.41 (2025 high) from 154.77 at 194.88. However, sustained break of 55 W EMA (now at 178.95) will argue that it's already in a medium term down trend to 175.41 resistance turned support and below.
EUR/GBP Daily Outlook
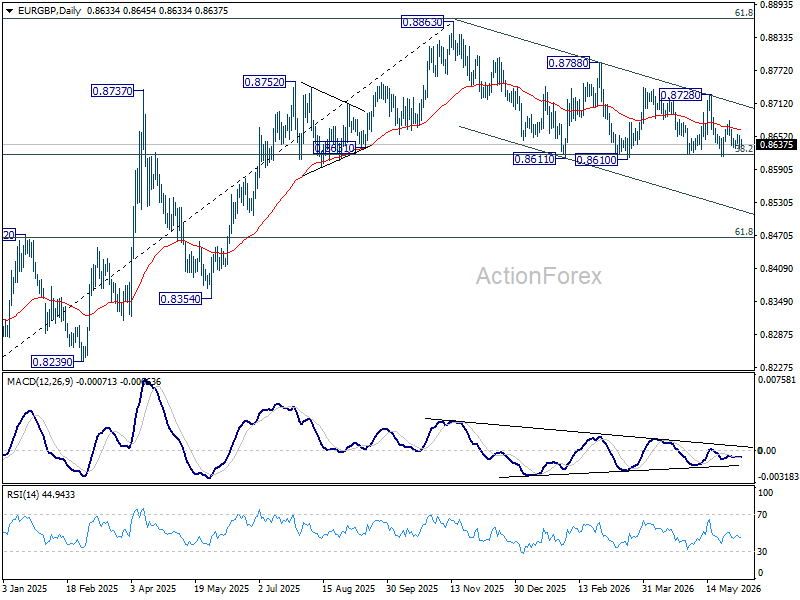
Intraday bias in EUR/GBP remains neutral as sideway trading continues. On the downside, decisive break of 0.8610 support will revive the case of bearish trend reversal. On the upside, break of 0.8728 resistance will bring stronger rally back towards 0.8740 resistance.
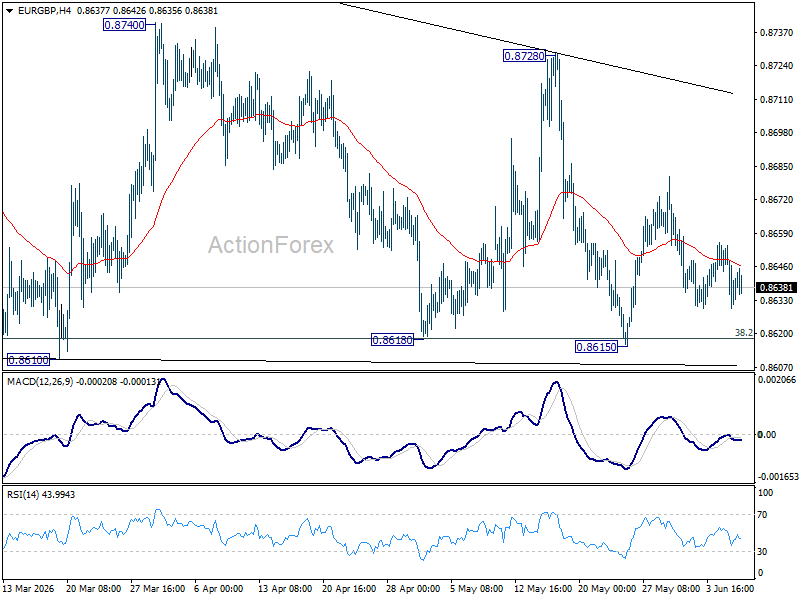
In the bigger picture, focus is staying on 38.2% retracement of 0.8821 to 0.8863 at 0.8618. Strong rebound from there will retain medium term bullishness. Rise from 0.8221 should resume through 0.8863 at a later stage. Nevertheless, sustained break of 0.8618 will confirm that whole rise from 0.8221 has completed at 0.8863. Deeper decline should then be seen to 61.8% retracement at 0.8466 at least.
EUR/AUD Daily Outlook
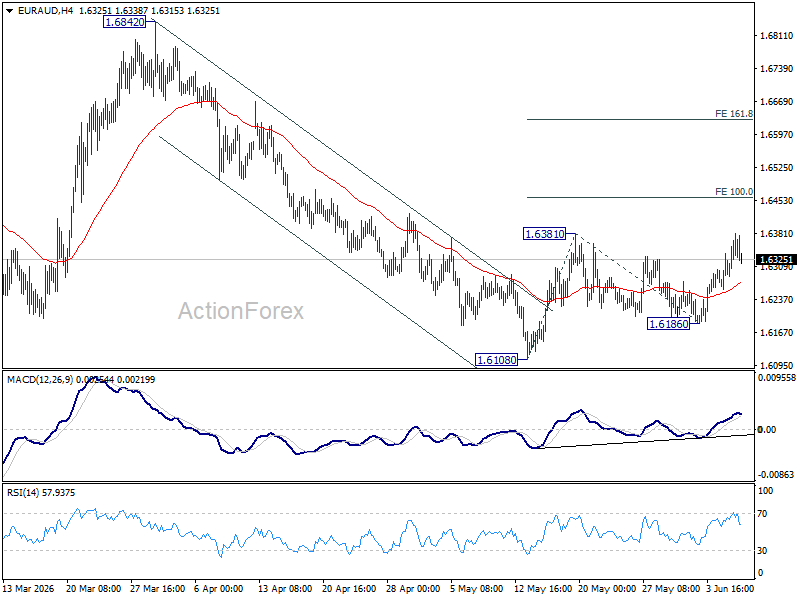
Intraday bias in EUR/AUD remains neutral again range trading continues. On the upside, break of 1.6381 will resume the rebound from 1.6108 short term bottom to 100% projection of 1.6108 to 1.6381 from 1.6186 at 1.6459. Firm break there will pave the way to 161.8% projection at 1.6628. Risk will stay on the upside as long as 1.6186 support holds, in case of retreat.
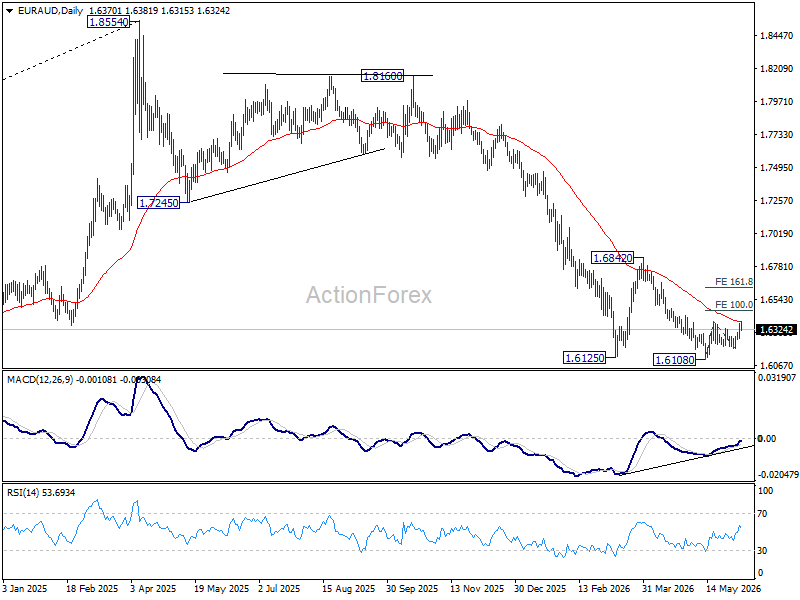
In the bigger picture, outlook will stay bearish as long as 1.6842 resistance holds. Fall from 1.8554 (2025 high) is expected to continue to 61.8% retracement of 1.4281 to 1.8554 at 1.5913. Decisive break there will pave the way back to 1.4281 (2022 low). However, firm break of 1.6842 should confirm medium term bottoming, and bring stronger rally.
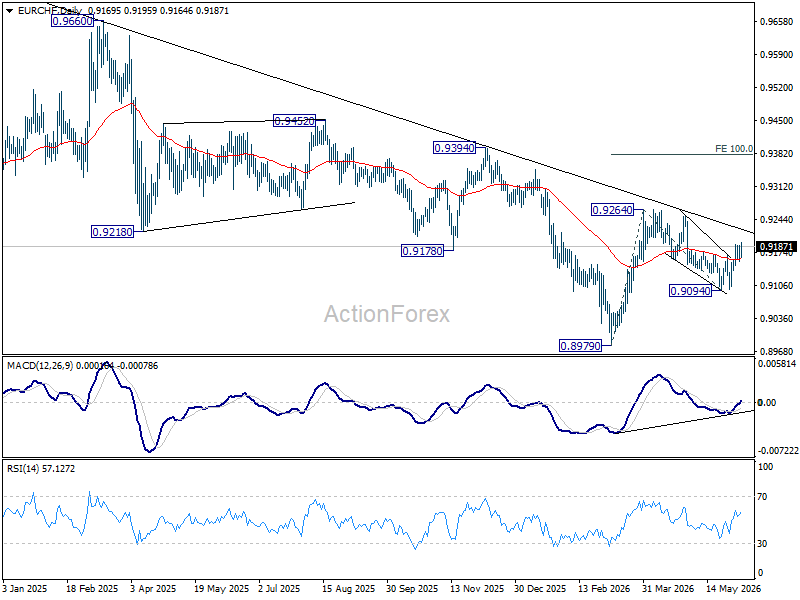
EUR/CHF Daily Outlook
Intraday bias in EUR/CHF is back on the upside with breach of 0.9191 temporary top. Rise from 0.9094 should target a retest on 0.9264 resistance. Firm break there will resume the rally from 0.8979 to 100% projection of 0.8979 to 0.9264 from 0.9094 at 0.9379. On the downside, below 0.9155 minor support will turn intraday bias neutral again.
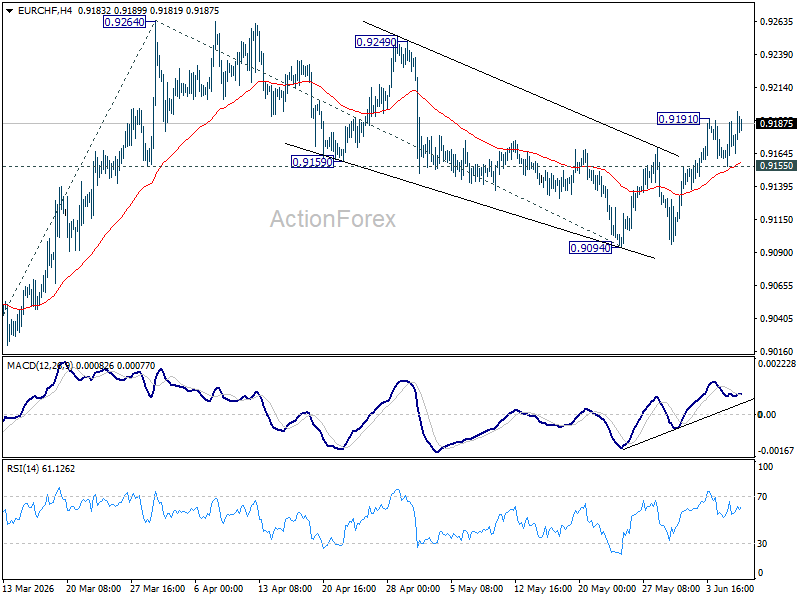
In the bigger picture, as long as 0.9394 resistance holds, down trend from 0.9928 (2024 high) should still be in progress. Firm break of 0.8979 will confirm down trend resumption. However, decisive break of 0.9394 will be an important sign of medium term bullish reversal.
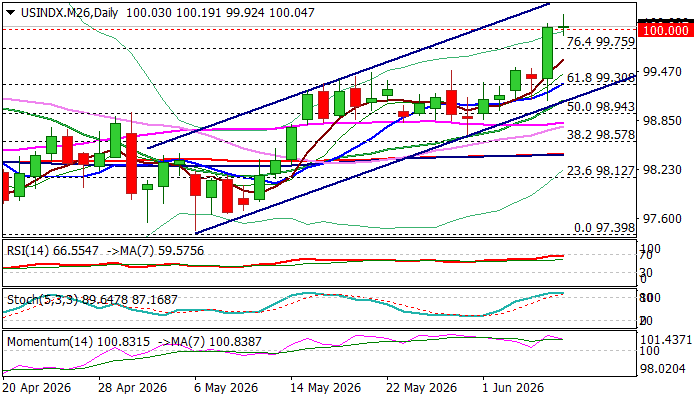
Dollar Index Hits Nine-Week High on Growing Fed Rate Hike Prospects and Geopolitical Tensions
The dollar keeps firm tone and hits new nine-week high on Monday, extending Friday’s rally (dollar was up 0.65%) and probed above psychological $100 barrier for the first time since early April.
Much better than expected US May labor data (NFP) signaled that labor market continues to strengthen and add to prospects for Fed rate hike, as prolonged uncertainty over the war in the Middle East fuels inflation, as well as dollar’s safe-haven appeal.
Technical picture on daily chart is firmly bullish and contributes to supportive fundamentals, with sustained break above $100 to confirm positive signal and open way for attack at key barriers at 100.32/48 (Nov 2025 / Mar 2026 peaks) guarding 100.94 (Fibo 38.2% of 110.00/95.35 Jan 2025 / Jan 2026 downtrend).
However, overbought stochastic, sideways-moving RSI, just under the overbought zone boundary and south-turned 14-d momentum, warn that bulls may take a breather for consolidation / limited pullback.
Recent range top at $99.50 zone and broken Fibo 61.8% ($99.30) offer solid supports which should contain potential dips and keep bullish structure intact.
Res: 100.32; 100.48; 100.94; 101.22
Sup: 99.75; 99.50; 99.30; 99.00
EUR/USD at April Lows: What’s Next for the Pair?
EUR/USD began the new week at 1.1520. The US dollar ended last week with gains of more than 1% following a strong US labour market report. In May 2026, the US economy added 172,000 jobs, significantly above the market forecast of 85,000. The data exceeded expectations, reinforcing confidence in the resilience of the US economy.
The strong employment figures bolstered expectations that the Federal Reserve will maintain its hawkish stance and could even raise interest rates before the end of the year.
Markets have little doubt that the Fed will leave rates unchanged at its next meeting. However, expectations of further policy tightening by the end of 2026 continue to rise.
The situation in the Middle East continues to support the US dollar. Negotiations between the US and Iran have effectively stalled, while renewed tensions have kept oil prices above USD 90 per barrel. Elevated energy prices are increasing inflation risks and boosting demand for the dollar as a safe-haven asset.
Against this backdrop, the euro has come under significant pressure. Energy-related risks facing European economies remain a key factor weighing on the single currency.
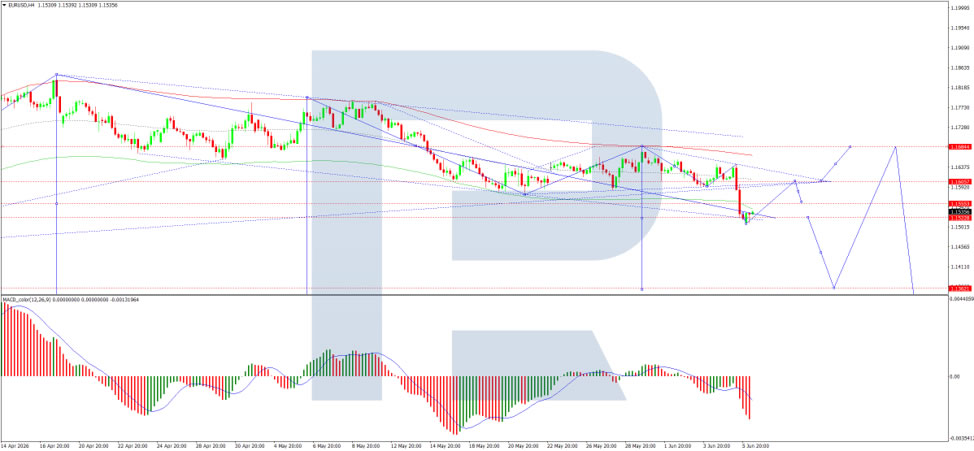
Technical Analysis
On the H4 chart, EUR/USD is trading within a consolidation range around the 1.1525 level, currently extending between 1.1510 and 1.1538. A breakout to the upside could trigger a corrective move towards 1.1570, while a downside breakout would open the way for a decline towards 1.1444.
The MACD indicator supports the bearish scenario, with its signal line below zero and pointing firmly downwards, indicating sustained downside momentum.
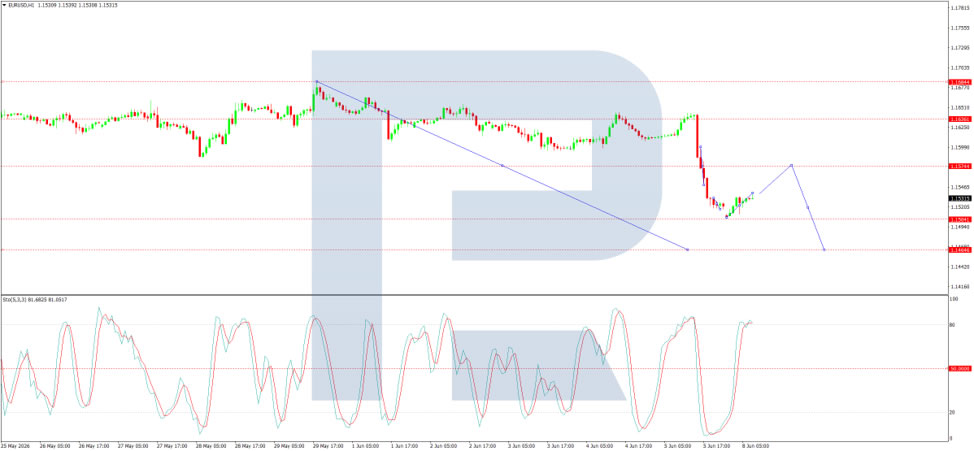
On the H1 chart, EUR/USD has reached 1.1525 and is now consolidating around this level. Further consolidation within the range is expected, with potential extensions towards 1.1500 on the downside and 1.1570 on the upside. After that, a move lower towards 1.1444 remains the preferred scenario.
The Stochastic oscillator confirms this outlook, with its signal line at 80 and turning lower towards 20, signalling growing bearish momentum in the short term.
Conclusion
EUR/USD remains under pressure as strong US economic data, expectations of prolonged restrictive Federal Reserve policy, and geopolitical tensions continue to support the dollar. While a short-term corrective rebound cannot be ruled out, technical indicators suggest that the broader bearish trend remains intact.
Eurozone Sentix Confidence Extends Recovery, but Inflation Concerns Stay Elevated
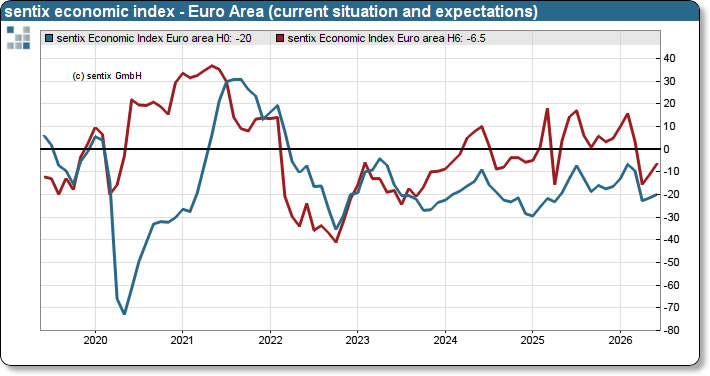
Eurozone investor confidence improved for a second consecutive month in June, with Sentix Investor Confidence rising from -16.4 to -13.4, slightly above expectations of -13.8. The Current Situation Index climbed from -21.5 to -20.0, while the Expectations Index improved notably from -11.3 to -6.5, suggesting investors are becoming more optimistic about the economic outlook after the sharp deterioration seen earlier this year.
According to Sentix, the recovery follows the severe hit to sentiment in March and April caused by the Iran conflict and the resulting surge in oil prices. Concerns about a significant economic slowdown have eased as economic prospects in the US and Asia have improved, providing fresh support for global growth. The Eurozone has also benefited from the more favorable international backdrop, though the recovery remains less dynamic than in other major regions.
However, inflation remains a key concern. Sentix noted that higher energy prices continue to fuel worries about persistent price pressures despite a modest improvement in its inflation barometer from -43 to -38. Germany remains a particular weak spot, with sluggish domestic performance weighing on the broader Eurozone recovery. The survey reinforces expectations that ECB will maintain a vigilant stance on inflation, with markets already anticipating a rate hike at this week's policy meeting.
| Indicator | Previous | June | Expected |
|---|---|---|---|
| Sentix Investor Confidence | -16.4 | -13.4 | -13.8 |
| Current Situation Index | -21.5 | -20.0 | |
| Expectations Index | -11.3 | -6.5 | |
| Inflation Barometer | -43 | -38 |
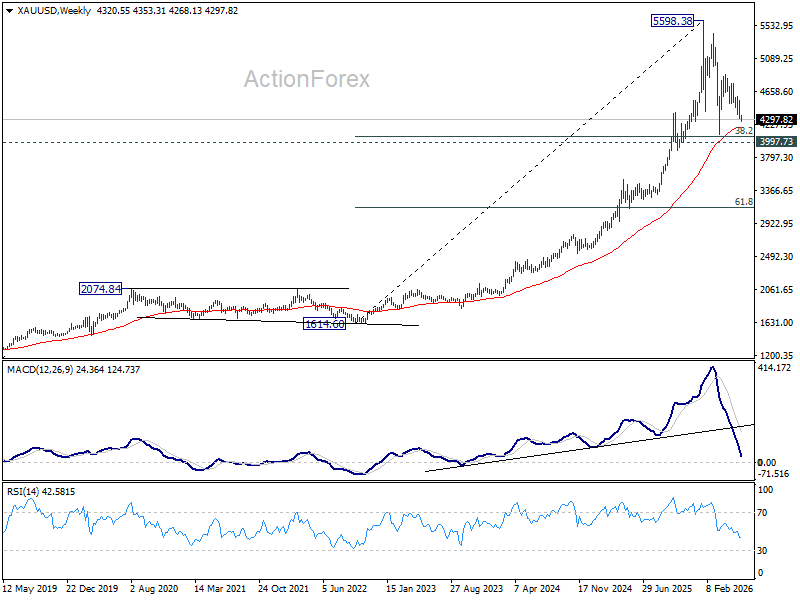
Gold’s Downside Acceleration Points to Crucial $4,000 Battle Zone
Gold's near-5% collapse last week has extended into the new week, with selling pressure accelerating as investors continue to reprice the global interest rate outlook. The precious metal is now approaching a critical test, with a retest of the March low near $4,100 increasingly likely and the psychologically important $4,000 level beginning to come into view.
The primary catalyst behind the latest decline was Friday's stronger-than-expected US nonfarm payrolls report. The data reinforced the view that the US labor market remains resilient. As a result, any lingering expectations for near-term Fed rate cuts have largely disappeared. Instead, markets are increasingly focused on the possibility that policymakers may need to tighten further later this year as higher energy prices feed through to inflation.
That shift in expectations has had a direct impact on Gold. Fed funds futures are now pricing a significant probability of at least one additional rate increase before year-end. Treasury yields have climbed, while Dollar has regained strength, with DXY moved back above 100. For a non-yielding asset such as Gold, rising real yields significantly increase the opportunity cost of holding bullion, encouraging institutional investors to rotate back into cash and fixed-income assets.
The current environment remains unfavorable for Gold unless there is a meaningful change in the macro backdrop. One potential catalyst would be a substantial easing of tensions between the United States and Iran that lowers oil prices and reduces inflation concerns. Without such a development, markets are likely to maintain a higher-for-longer view on monetary policy, keeping pressure on precious metals.
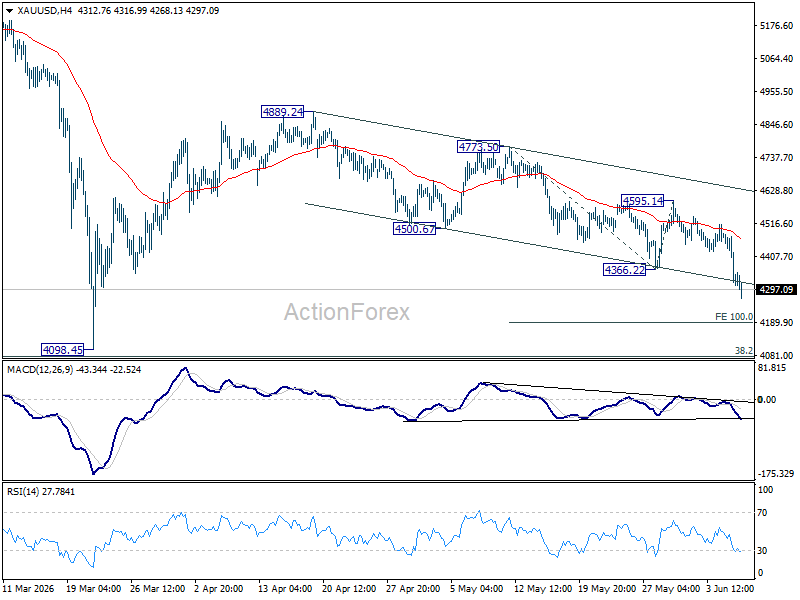
Technically, the outlook has deteriorated notably. Gold's decline from 4,899.24 resumed after decisively breaking below 4,366.22 support. More importantly, prices have now fallen through the lower boundary of a near-term falling channel, suggesting downside momentum is accelerating rather than stabilizing.
As long as the 55 4H EMA (now at 4,463.83) caps rebounds, the bias remains firmly to the downside. Immediate target comes at 100% projection of 4,773.50 to 4,366.22 from 4,595.14 at 4,187.86. A break below that area would quickly shift attention toward the March low near 4,100.
Yet the bigger picture is more nuanced than the current selloff suggests. While markets are increasingly pricing tighter policy, the global economy is not experiencing a demand-driven inflation boom. Instead, it is facing a stagflationary environment characterized by weak growth and supply-driven inflation pressures. That distinction matters because it limits how aggressively central banks can tighten without causing deeper economic damage.
ECB is widely expected to raise rates this week, and Fed may yet tighten again later this year. However, the scope for a prolonged tightening cycle appears limited. The moment growth deteriorates more sharply or labor market weakness emerges, policymakers would likely be forced to pause or reverse course.
For that reason, the zone between 38.2% retracement of 1,614.60 (2022 low) to 5,598.38 at 4,076.57 and structural support at 3,993.73 would likely hold. Strong buying interest is expected there to retain the long term up trend.
However, decisive break below 4,000, however, would suggest that Gold is no longer correcting within a bull market but beginning a much deeper trend reversal.